 Konrad Miotliński
 Luk J. M. Peeters
- 1Centre for People, Place and Planet, Edith Cowan University, Joondalup, WA, Australia
- 2CSIRO Land and Water, Glen Osmond, SA, Australia
Continental scale aquifers can store significant amounts of carbon as a result of immense water volumes, substantial concentrations of dissolved inorganic carbon (DIC) and its reactions with a matrix, thus contributing the global carbon storage and cycle. However, concentration of dissolved solutes may vary significantly over distances, which causes interpretative challenges and difficulties in process quantification. This occurs in the Guarani Aquifer System in South America, which is a subject of extensive research due to a significant strategic role in water supply. Dissolved CO2 is expected to dissociate and undergo reactions with aluminosilicate minerals, but it is unknown how much DIC may get immobilised in the aquifer. To quantify the processes, we performed reactive transport modelling which combines hydrological and geochemical information followed by global sensitivity analysis. We show that more than a half of the infiltrated CO2 may be consistently precipitated as CaCO3. The DIC concentrations across the aquifer depend primarily on the input carbon concentrations and the plagioclase hydrolysis rate, while other parameters including hydraulic conductivity, recharge rate and mineral stability are of the minor importance. We present how advanced modelling techniques may be used to interpret and quantify processes controlling water quality in continental scale groundwater systems.
1. Introduction
Groundwater systems are important inorganic carbon reservoirs, and they are gaining attention as to which extent they contribute to the global carbon cycle. Estimates of carbon fluxes in the subsurface are hugely uncertain due to difficulties in (1) calculating groundwater and chemical fluxes (Fontaine et al., 2007; McCallum et al., 2012; Li et al., 2015), (2) subsurface conceptualisation (Vilhelmsen et al., 2018; Enemark et al., 2019), and (3) the dynamic role of soils in CO2 storage and deep recharge (Kessler and Harvey, 2001; Fontaine et al., 2007; Sánchez-Cañete et al., 2018).
Reactive transport models (RTMs) are useful in addressing these uncertainties because they (1) combine complexity of water flow with a set of biogeochemical reactions (Maher and Navarre-Sitchler, 2019), (2) enable to test a variety of conceptual scenarios when they are run in a predictive mode (Jessen et al., 2017; Jakobsen et al., 2018), (3) may be evaluated using global sensitivity analysis (Dai et al., 2014). Consequently, RTMs can play an important role at every stage of a research project: initially, when little data is available to test a general conceptual model; at the stage of data collection, when combination with global sensitivity analysis offers an efficient way to allocate financial resources or when new conceptual models are available; and finally, to integrate a range of datasets to draw quantitative conclusions and to make predictions.
The data integration remains a major challenge in water chemistry and quality evaluation, which may be independent of the scale of evaluation. Nevertheless, as the modelling techniques improve, new hypotheses may be drawn, particularly when combined with new observations. The DIC reaction with aluminosilicate minerals, which is referred as chemical rock weathering may be associated with precipitation of secondary minerals resulting in a long-term carbon storage (Berner, 1998; Banks and Frengstad, 2006; Steffen et al., 2007; Maher and Chamberlain, 2014). Nevertheless, the reaction pathways are complex and heterogeneous and may depend on a variety of factors including: (1) groundwater flow velocity (Maher and Chamberlain, 2014), (2) thermodynamic equilibria and dissolved ion availability (Zhang and Planavsky, 2020) or (3) rates of dissolution and precipitation (Pogge von Strandmann et al., 2019). These pathways can be explored with RTMs that rely on both hydrological and biogeochemical principles (Steefel et al., 2005).
In a small scale of soil thickness, in situ measurements of a CO2 and O2 couple indicate that CO2 is produced in a shallow subsurface which may not, at least immediately, return to the atmosphere due to (1) dissolution in groundwater, (2) transport in gaseous or dissolved forms, (3) mineral weathering (Sánchez-Cañete et al., 2018). The dynamic interactions at a scale of 100–101 m influence what happens along the way of water flow. Consequently, the CO2 dissolution coupled with advective transport may lead to significant amounts of dissolved inorganic carbon (DIC) stored in groundwater bodies (Li et al., 2015; Zhang and Planavsky, 2020) that may be transported over long distances, undergo biogeochemical transformations and, finally, be discharged to rivers (Gaillardet et al., 1999) or sea (Zhang and Planavsky, 2020).
In aquifers, the process dynamics are subdued. However, water quality patterns observed along flow paths may give an insight of reaction controls. The spatial patterns have been quantified at a scale from 101–102 m Jakobsen et al. (2018) to 105–106 m (Appelo, 1994; Bethke et al., 2002). The large-scale example includes one of the world's most voluminous Guarani Aquifer System (GAS). The spatial patterns are the result of reactions within the aquifer (Sracek and Hirata, 2002; Gastmans et al., 2010) and mixing with other quality groundwater (Aggarwal et al., 2015; Fernandes et al., 2016; Teramoto et al., 2020).
To estimate the carbon fluxes in GAS, we developed a coupled RTM in which we integrate physical properties with the thermodynamic reactions assuming DIC reacts with the abundant aluminosilicate minerals. We verified our model by comparing its results with the groundwater quality data observed along the flow paths in the northeastern part of the aquifer. Independent studies imply dissolution of primary silicates and precipitation of carbonates. Finally, we performed global sensitivity analysis to identify the importance of individual model parameters.
2. Site Description and Methodology
Hydrogeology and geochemical evolution of the north-eastern part of GAS are described in detail elsewhere. Here only a brief description is provided. This is followed by the conceptual and numerical modelling.
2.1. Hydrogeology
The Guarani Aquifer System (GAS) is one of the most voluminous groundwater bodies on the Earth due to its great geographical extend (area of 1,195,500 km2) and a large thickness (Foster et al., 2009). In the NE part, the aquifer is a part of the Paraná Basin which consists of stratified sandstone series of Triassic (Piramboia unit) and Cretaceous (Botucatu unit) ages (Araujo et al., 1999; Gastmans et al., 2010; Hirata et al., 2011). The formation is up to 832 m thick, with the average thickness of 400 m (Araujo et al., 1999). Reported hydraulic conductivity and porosity values are in the range 0.0864–0.864 m/d (De Paula E Silva and Cavaguti, 1994; Rebouças, 1994) and 0.16–0.24 (Rebouças, 1976; Hirata et al., 2011), respectively. About 10% of the formation outcrops, whereas the remaining part is confined by a sequence of basalts of the Serra Geral formation (Fernandes et al., 2016). The GAS is underlain by siltstones containing highly mineralised groundwater of the Passa Dois Group (Silva, 1983; Meng and Maynard, 2001).
Natural aquifer recharge of GAS dominates as direct percolation of precipitation through the outcrop areas. The deep groundwater recharge estimated with the water level fluctuation method accounts locally for up to 50 mm/year, which is 3.5% of the mean annual precipitation (Wendland et al., 2007). No estimates have been performed for the confined part of the aquifer, but since the basalt formation is intersected with dikes (Fernandes et al., 2016) and groundwater samples contain 14C (Aggarwal et al., 2015), infiltration of recent rainwater through the overlying basalt unit seems to be taking place. Downstream, in the deeply confined part of the aquifer, elevated Cl− concentrations along with crust 4He gas dissolved in groundwater suggest recharge from the underlying formations (Aggarwal et al., 2015). The groundwater flow is radially diverging and the discharge takes place in the Paraná River valley, where artesian conditions are apparent (Rebouças, 1994).
Groundwater residence times evaluated using the 81Kr isotope vary in the broad range of 80–820 ky (Aggarwal et al., 2015). The groundwater dating implies that the average linear groundwater velocities are from 0.15 to 1.25 m/year and, consequently, that GAS has been flushed at least 180 times since its deposition which was followed by a number of tectonic events with the most recent one between 88 and 65 million years ago (Araujo et al., 1999).
2.2. Spatial Water Quality Patterns
The chemical composition of groundwater exhibits a zonation from fresh Ca-HCO3 and Ca-Mg-HCO3 water types in the unconfined and marginal part of the basin towards brackish Na-HCO3-Cl and Na-Cl in the confined part (Gastmans et al., 2010). The evolution has been suggested to be a result of either aluminosilicate weathering (Silva, 1983; Gastmans et al., 2010) or cation exchange coupled to carbonate dissolution (Sracek and Hirata, 2002). There is more evidence for the former mechanism, which includes: (1) multiple flushing since the formation of the aquifer (Araujo et al., 1999); (2) the presence of primary (plagioclase, K-feldspar) and secondary aluminosilicates (kaolinite, smectites) (Gesicki, 2007); (3) the presence of chalcedony near the outcrop and authigenic calcite cement in the deep confining zone (Hirata et al., 2011). A similar trend was observed and modelled elsewhere (Banks and Frengstad, 2006; Pogge von Strandmann et al., 2019).
2.3. Conceptual and Numerical Models
We conceptualised a groundwater system as a two-dimensional (2D) vertical cross-section parallel to the direction of groundwater flow (Freeze and Witherspoon, 1968). The system is a rectangular with the dimensions 300 km and 400 m in length and thickness, respectively (Figure 1). We imposed groundwater flow field by using the flux boundary condition along the upper and lower boundaries of the system.
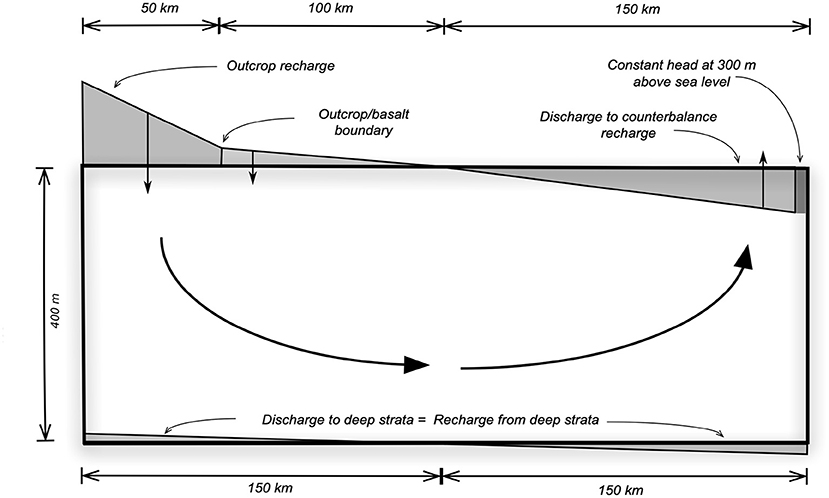
Figure 1. Conceptual 2D model of the water flow in the GAS with shaded polygons depicting water fluxes through the top and bottom boundaries.
The USGS PHAST code (Parkhurst et al., 2010) and PHREEQC database (Parkhurst and Appelo, 1999) were used to simulate reactive transport in the 2D domain. The methodology was used in smaller scale studies (Jessen et al., 2017; Jakobsen et al., 2018). Here, the domain was divided into 31 and 401 nodes in a vertical and horizontal direction, respectively, which correspond to the depth and distance. In addition to flux boundary conditions at the upper boundary, we assigned a single node at 300 km with a constant boundary condition to assure a numerical stability of the solution (Figure 1).
Chemical fluxes through the system are products of water flux and concentrations. The recharge water at the outcrop contains dissolved CO2, which is meant to react with the aquifer material. The basement water is highly-mineralised Na-Cl groundwater of the Passa Dois Group which discharges Na+ and Cl− to GAS (Meng and Maynard, 2001; Hirata et al., 2011; Soler i Gil and Bonotto, 2014; Aggarwal et al., 2015).
The aquifer matrix consists of plagioclase (Ca0.5Na0.5Al1.5Si2.5O8) which is allowed to develop: (1) chalcedony (SiO2), (2) kaolinite (Al2Si2O5(OH)4) and calcite (CaCO3) precipitation if mineral saturation is reached. The plagioclase hydrolysis follows the kinetic Transition State Theory (Appelo and Postma, 2005; Maher and Navarre-Sitchler, 2019):
where R is the overall reaction rate (M/L/s), r is the rate constant (M/m2/s), IAP is the ion activity product (-), K is the solubility product (-), A0 is the initial surface area of the solid (m2), V is the volume of solution (m3), m0 initial moles of the solid, m moles of solid at a given time, n rate exponent. We assumed that m0 and m are equal 10 M, A0 = 2.26 m2/kg and V = 0.162 L/kg (Appelo and Postma, 2005). This is a conservative approach if concentrations achieve steady state. The m0, A0, and the IAP change over the course of a simulation making the overall reaction rate variable in time and space.
The IAP/K ratio controls the mineral saturation. The mineral saturation index is:
To ensure that the geochemical system reaches steady state in terms of water quality, each model run was 1 million years. All model parameters are listed in Table 1). A few parameters of the RTM were fixed in the model: (1) the pH value at of recharge water (4.4) as mean value observed in the outcrop zone (Gastmans et al., 2010), (2) the maximum recharge rate at the bottom (0.00015 m/yr) and (3) the concentrations at the bottom recharge (5 mM Na+ and Cl−, respectively).
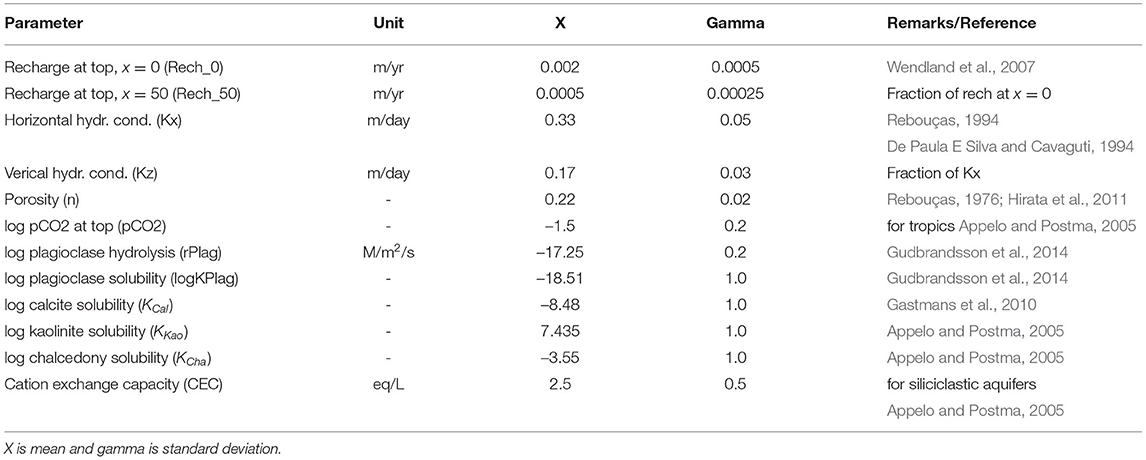
Table 1. Parametrization of the reactive transport models with ranges explored in global sensitivity analysis.
An ensemble of 1,000 parameter combinations was generated with Latin Hypercube Sampling and evaluated with the RTM to carry out a global sensitivity analysis. Table 1 includes the mean (X), standard deviation (gamma) and additional comments for each model parameter. We used the delta moment-independent measure technique developed by Borgonovo (2007) and Plischke et al. (2013), as implemented in the SALib python library (Herman and Usher, 2017). The technique calculates a total sensitivity index value between a parameter of the model and a model output. Higher values indicate that the model outcome is more sensitive to parameter values.
2.4. Water Quality Data
To compare the modelling results with the field data (Gastmans et al., 2010) we selected a number of monitoring wells that are located along interpreted flow paths and we estimated distances from the basin's margin (Table 2 in Appendix).
3. Results and Discussion
3.1. Hydrogeochemical Evolution in a 2D Siliciclastic System
The flux of water with CO2 solution together with thermodynamic feasibility for secondary reactions create (1) distinct peaks of Ca2+ and total alkalinity () and (2) a gradual increase in pH (Figure 2). The pattern on a smaller spatial scale was identified in CO2 driven silicate weathering systems. That included plagioclase-rich anorthosites in Norway (Banks and Frengstad, 2006) naturally recharged with CO2-rich water, and in engineered CO2 injection into basalts in Iceland (Pogge von Strandmann et al., 2019).
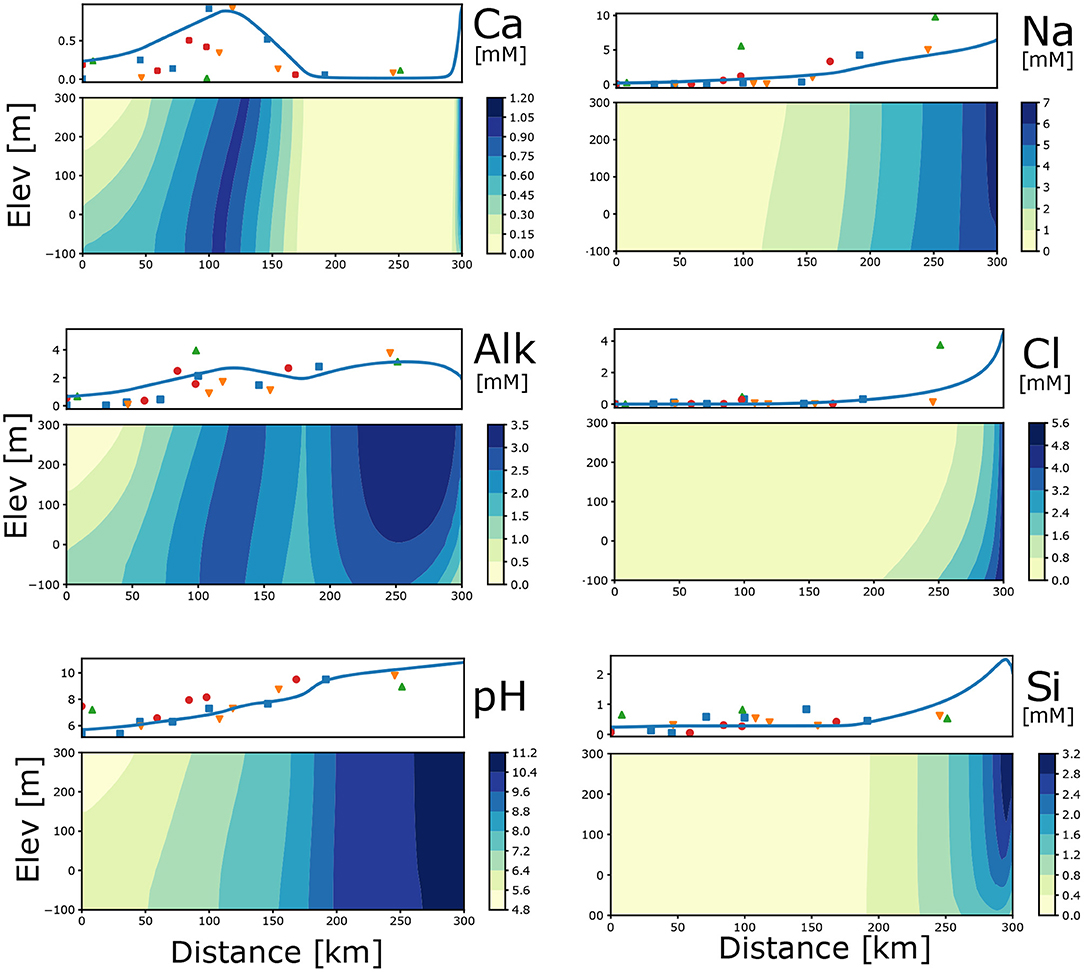
Figure 2. Profile average (measured and modelled) and 2D distribution of concentrations (mM) and pH due to plagioclase hydrolysis and associated secondary reactions. Input parameters for the model are: Rech_0 = 0.0025, Rech_50 = 0.0002, Kx = 0.33, Kz = 0.033, pCO2 = –1.5, log r_Plag = –17.22, log KCal = –8.48, n = 0.22, CEC = 2.5. Different symbols for measured data indicate separate flow paths.
Plagioclase hydrolysis drives the stoichiometric increases in Ca2+ and Na+ and the intensity of the process depends on the chemical rate (R in Equation 1). At low concentration levels, the process consumes dissolved CO2 and hydrogen ions producing silicic acid and carbonate alkalinity (Equation 3):
Once groundwater becomes saturated with respect to chalcedony, its precipitation takes place which prevents an ongoing increase of SiO2 in the solution (Equation 4):
As the evolution continues, at a pH ≈ 8 (x=140 km) groundwater becomes saturated with respect to calcite. At this pH value, the is a dominant dissolve carbonate form which is being consumed, consequently, leading to calcite precipitation (Equation 5):
The concentrations of carbonate species and calcite saturation index (Equation 2) and precipitation are depicted in Figure 3. Concentrations of Ca2, carbonate alkalinity and pH observed in the field enable the comparison with the model. Banks and Frengstad (2006) found the same.
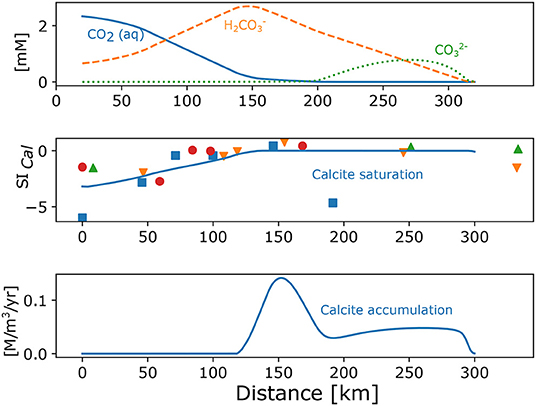
Figure 3. Modelled concentrations of dissolved carbonate species (upper), saturation index (SI) for calcite (line, middle), and rate of calcite accumulation in a function of distance (lower). SI calculated with PHREEQC (Parkhurst and Appelo, 1999) from the observations is also shown (points, middle). Input parameters for the model are: Rech_0 = 0.0025, Rech_50 = 0.0002, Kx = 0.33, Kz = 0.033, pCO2 = –1.5, log r_Plag = –17.22, log KCal = -8.48, n = 0.22, CEC = 2.5. Different symbols for measured data indicate separate flow paths.
Plagioclase continues on being dissolved at higher pH values producing the dissociated increasing total alkalinity (Equation 6):
Production of (Equation 6) causes an increase in the total Si concentration (Figure 2). The increases in Na+ and Cl− concentration from 150 to 300 km in Figure 2 are chiefly a result of the inflow from the underlying strata as the boundary concentrations are 5 mM. Since the bottom recharge Na:Cl ratio is 1, any number larger than 1 is a combination of plagioclase hydrolysis and ion exchange.
3.2. Sensitivity of the Model Output to Selected Parameters
Figure 4 depicts how sensitive the model outputs are in relation to the model inputs at different distances. Overall, the carbon concentrations depend primarily on partial pressure CO2 and the plagioclase hydrolysis rate (Figure 4 and Appendix). These two input parameters affect a number of model outputs including Alkalinity, Ca2+, Na2+, pH, and SiO2. Although high groundwater recharge rates indicate elevated carbon loading, the global influences of Rech_0 and Rech_50 on dissolved carbon concentration are minor.
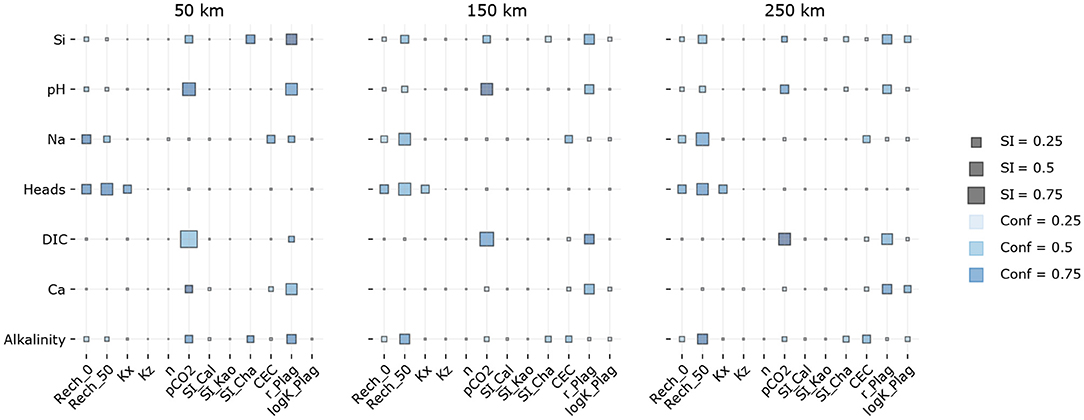
Figure 4. Sensitivity indices and confidence intervals for different distances from the model edge. Inputs are on the horizontal axes, whereas outputs are on the vertical axis. Large SI for the DIC output indicates the most influential input parameters, chiefly pCO2 and r_Plag. The exact SI and Conf values are given in Appendix.
The solubility constants of secondary minerals including calcite do not have major implications on the DIC concentrations. This indicates that even a relatively wide range of calcite solubility values (SI_Cal variations in a range of ± 1.0) does not affect the carbon cycling to this extent as recharge CO2 and the plagioclase dissolution rate do. The cation exchange capacity has a minor significance too, although it is often regarded as a major parameter affecting solute concentrations in large groundwater basins (Appelo, 1994; Sracek and Hirata, 2002; Gastmans et al., 2010). Indeed it influences concentrations of other species, including Na+ and total alkalinity.
The comparison of sensitivities at 50, 150, and 250 km show the increasing importance of weathering and cation exchange over the distance. Nevertheless, relatively similar sensitivities at these distances indicate that it does not really matter which part of the aquifer groundwater is sampled to identify the most influential global parameters.
The input parameters were evaluated in a range of values. The ranges were chosen either from the field observations (Rebouças, 1994; Gastmans et al., 2010) or literature (Appelo and Postma, 2005; Gudbrandsson et al., 2014). It is widely accepted that a saturation index (Equation 2) of a precipitating mineral phase is positive in aquifers due to kinetic inhibition of the process (Appelo and Postma, 2005). This is the reason; we used a wide range of log solubilities.
Since the field mineral dissolution rates are consistently smaller in the large scale than in the lab or small scale experiments (Gudbrandsson et al., 2014; Maher and Navarre-Sitchler, 2019), we assumed a range which enabled us to develop the concentration patterns observed in the field, chiefly the oversaturation for calcite in the intermediate range (120–160 km) of distances (Figure 3 middle).
3.3. Distribution of Carbon Flux Through the Boundaries and Transformation in the Aquifer
The DIC flux, which is a product of water recharge and DIC concentration, takes place primarily in the outcrop boundary due to relatively high recharge rates (Figure 5). The fluxes through the outcrop (Recharge from 0 to 50 km) account for approximately 75% of total carbon fluxes to the system. This is consistent with the current understanding of the GAS system (Teramoto et al., 2020). Only a minor part of the total flux is discharged.
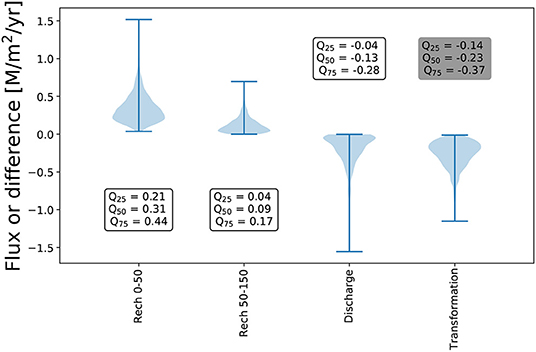
Figure 5. Fluxes through the boundaries and the difference between input and output attributed to the transformation for 1,000 model realisations.
Thus, the transformation of DIC in the aquifer is significantly larger than the DIC discharge rate, indicating that the aquifer serves as an effective carbon sink in the wide range of parameters (Figure 5).
Extrapolating the results to the extend of the aquifer indicates that if the GAS area is 1,195,500 km2, more than 4 × 10¹¹ M/yr gets immobilised within the aquifer assuming homogeneous reactions. Another assumption is that there is no carbon consumption during the leakage through the overlying basalt.
3.4. Limitations and Additional Considerations
The presented approach of estimated carbon cycling is based on the assumption that CO2 removal is driven by plagioclase hydrolysis as it was found in highly reactive anothrosites (Banks and Frengstad, 2006) or basalts (Pogge von Strandmann et al., 2019). Although the model can be used in a variety of settings and at different spatio-temporal scales, a critical evaluation of the conceptual model is warranted.
The evaluation of the conceptual model requires water quality and mineralogical or petrographic measurements. The process of data collection is an expensive task which may not unequivocally show whether the conceptual model is correct (Enemark et al., 2019). In GAS, an alternative conceptual scenario of the carbonate dissolution process coupled with ion exchange was considered (Sracek and Hirata, 2002; Gastmans et al., 2010) as mineralogical studies showed that carbonates were being dissolved in certain locations of the aquifer. In different locations, however, there is evidence of carbonate accumulation (Gastmans et al., 2010; Hirata et al., 2011). Geochemical processes that may lead to different conceptualisations were studied and modelled at small (pore) scales (Jakobsen, 2007; Molins et al., 2012). RTMs should be useful to calculate net precipitation or dissolution.
A detailed process quantification requires not only models, but extensive multicomponent analysis. This can be accomplished in focused engineered studies, in which controlled injection and monitoring is possible. At the CarbFix2 site in Iceland a number of conservative and reactive tracers including calcium isotopes were used to study the extend of the carbonate precipitation process (Pogge von Strandmann et al., 2019). Fortunately, the geological systems can be studied by analogy across scales.
The major limitations of our model include:
• steady-state infiltration and constant carbon input. Although relatively small cyclical variations of climate in Brazil over the last few 100, 1,000 years (Cruz et al., 2005; Rodríguez-Zorro et al., 2020) were encountered, the uncertainty of our estimates remains very high;
• the plagioclase rate dissolution is pH-independent. Some studies point to the significant dependence on pH values (Gudbrandsson et al., 2014);
• the geometry of the model domain is very simple, although it captures the concentration patterns observed in NE part of the aquifer;
• only Ca-Na plagioclase is reacting with DIC, whereas in reality there is a competition among the mineral assemblage for a reactant (Oelkers et al., 2018) leading to geochemical heterogeneity and uneven evolution of porous media (Seigneur et al., 2019).
The interpreted rates of plagioclase hydrolysis rates from our model are 2–3 orders of magnitude smaller than in the small scale and laboratory studies, which is consistent with findings (Molins et al., 2012; Maher and Navarre-Sitchler, 2019). However, the weathering mineral phase should be interpreted here as a mineral assemblage which would have different reactivity than a pure mineral.
The composition of the mineral assemblage, concentrations throughout the aquifer and along the vertical profiles as well as an estimation of distribution of recharge and discharge using tracers, could be helpful in reducing uncertainties of the carbon flux. The model could further be extended to 3D representation of the aquifer.
Our numerical model with its all simplifications underpins the importance of depth specific rather than depth integrated groundwater sampling for process identification (Appelo and Postma, 2005). Even in a relatively simple chemical configuration of a homogeneous aquifer composed of plagioclase receiving infiltration CO2, the concentration patterns reflect complexity both laterally and vertically. The effect is exacerbated by low flow rates in the aquifer.
4. Conclusions
The role of aquifers in the global carbon cycle poses significant interpretative and quantitative challenges. The interpretation is related with the conceptual model, which needs to be developed on the basis of the available datasets and the geological history.
The process quantification may be performed using a reactive transport model which encompasses geochemical and hydrogeological data. Such a model offers partial and integrated water and geochemical fluxes that can be further critically evaluated using observations. Here, we used the distribution of water quality, water residence times and qualitative information on matrix composition from the Guarani Aquifer System as an example of the continental scale aquifer. This enabled us to calculate the water and geochemical balances assuming that plagioclase weathering is thermodynamically coupled with carbonate precipitation.
A simple conceptualisation with a plagioclase mineral only suggests that 50% of carbon is immobilised as CaCO3. By using global sensitivity analysis, we found that the DIC fluxes and weathering rates of aluminosilicate minerals have a major significance in controlling solute concentrations and, consequently, DIC outflux at the discharge zone. Other parameters including horizontal hydraulic conductivity, porosity and stability of secondary minerals play a minor or negligible role in controlling solute concentrations.
In order to better understand the role of large aquifers in carbon cycling, the effort should be placed on:
• the rate of the mineral assemblage dissolution;
• the refined water sampling along the flow paths and in the vertical profile;
• the evaluation of the DIC concentration and its temporal variations in recharge water;
• the estimation of recharge rates;
• the incorporation of isotopes (e.g., Ca2+ and Mg2+) in water quality monitoring to constrain chemical rates and hydrogeological pathways of DIC cycling;
• the distribution of cation exchange capacity in the aquifer and the sorption site composition along the flow paths.
The refinement of the models with aforementioned data would further reduce predictive uncertainty of the CO2 immobilisation in aquifers.
Data Availability Statement
The original contributions presented in the study are included in the article/Supplementary Materials, further inquiries can be directed to the corresponding author/s.
Author Contributions
KM designed the manuscript, developed the reactive model, and wrote the manuscript. LP developed the global sensitivity methodology and revised the manuscript. Both authors contributed to the article and approved the submitted version.
Supplemental Data
The numerical model repository is located on https://www.hydroshare.org/resource/b0c0815fbc4949ad9d0c21102df93a39/. Measured concentrations from GAS are from Gastmans et al. (2010).
Conflict of Interest
The authors declare that the research was conducted in the absence of any commercial or financial relationships that could be construed as a potential conflict of interest.
Publisher's Note
All claims expressed in this article are solely those of the authors and do not necessarily represent those of their affiliated organizations, or those of the publisher, the editors and the reviewers. Any product that may be evaluated in this article, or claim that may be made by its manufacturer, is not guaranteed or endorsed by the publisher.
Acknowledgments
A number of colleagues are acknowledged for friendly and useful remarks on an earlier version of the manuscript. Two Frontiers reviewers greatly contributed to its final version.
Supplementary Material
The Supplementary Material for this article can be found online at: https://www.frontiersin.org/articles/10.3389/frwa.2021.714075/full#supplementary-material
References
Aggarwal, P. K., Matsumoto, T., Sturchio, N. C., Chang, H. K., Gastmans, D., Araguas-Araguas, L. J., et al. (2015). Continental degassing of 4He by surficial discharge of deep groundwater. Nat. Geosci. 8, 35–39. doi: 10.1038/ngeo2302
Appelo, C. A. J. (1994). Cation and proton exchange, pH variations, and carbonate reactions in a freshening aquifer. Water Resour. 30, 2793–2805. doi: 10.1029/94WR01048
Appelo, C. A. J., and Postma, D. (2005). Geochemistry, Groundwater and Pollution, 2nd Edn. Taylor &Francis.
Araujo, L. M., Franca, A. B., and Potter, P. E. (1999). Hydrogeology of the mercosul aquifer system in the Paraná and Chaco-Paraná Basins, South America, and comparison with the Navajo-Nugget aquifer system, USA. Hydrogeol. J. 7, 317–336.
Banks, D., and Frengstad, B. (2006). Evolution of groundwater chemical composition by plagioclase hydrolysis in Norwegian anorthosites. Geochim. Cosmochim. Acta. 70, 1337–1355. doi: 10.1016/j.gca.2005.11.025
Berner, R. A. (1998). The carbon cycle and CO2 over Phanerozoic time: The role of land plants. Philos. Trans. R. Soc. B Biol. Sci. 353, 75–82. doi: 10.1098/rstb.1998.0192
Bethke, C. M., Zhao, X., and Torgersen, T. (2002). Groundwater flow and the 4 He distribution in the Great Artesian Basin of Australia. J. Geophys. Res. 104, 12999–13011. doi: 10.1029/1999JB900085
Borgonovo, E. (2007). A new uncertainty importance measure. Reliability Eng. Syst. Safety 92, 771–784. doi: 10.1016/j.ress.2006.04.015
Cruz, F. W., Burns, S. J., Karmann, I., Sharp, W. D., Vuille, M., Cardoso, A. O., et al. (2005). Insolation-driven changes in atmospheric circulation over the past 116,000 years in subtropical Brazil. Nature 434, 63–66. doi: 10.1038/nature03365
Dai, Z., Keating, E., Bacon, D., Viswanathan, H., Stauffer, P., Jordan, A., et al. (2014). Probabilistic evaluation of shallow groundwater resources at a hypothetical carbon sequestration site. Sci Rep. 4, 1–7.
De Paula E Silva, F., and Cavaguti, N. (1994). A new stratigraphic and tectonic characterization of the Mesozoic sequence in the city of Bauru-SP. Geociencias 13, 83–99.
Enemark, T., Peeters, L. J., Mallants, D., and Batelaan, O. (2019). Hydrogeological conceptual model building and testing: a review. J. Hydrol. 569, 310–329. doi: 10.1016/j.jhydrol.2018.12.007
Fernandes, A. J., Maldaner, C. H., Negri, F., Rouleau, A., and Wahnfried, I. D. (2016). Aspects of a conceptual groundwater flow model of the Serra Geral basalt aquifer (São Paulo, Brazil) from physical and structural geology data. Hydrogeol. J. 24, 1199–1212. doi: 10.1007/s10040-016-1370-6
Fontaine, S., Barot, S., Barré, P., Bdioui, N., Mary, B., and Rumpel, C. (2007). Stability of organic carbon in deep soil layers controlled by fresh carbon supply. Nature 450, 277–280. doi: 10.1038/nature06275
Foster, S., Hirata, R., Vidal, A., Schmidt, G., and Gardu no, H. (2009). The guarani aquifer initiative–towards realistic groundwater management in a transboundary context. System 28. Available online at: https://www.un-igrac.org/sites/default/files/resources/files/GWMATE%20case%20profile%20-%20Guarani.pdf
Freeze, R. A., and Witherspoon, P. A. (1968). Theoretical analysis of regional ground water flow: 3. Quantitative Interpretations. Water Resour. Res. 4, 581–590. doi: 10.1029/WR004i003p00581
Gaillardet, J., Dupré, B., Louvat, P., and Allègre, C. J. (1999). Global silicate weathering and CO2 consumption rates deduced from the chemistry of large rivers. Chem. Geol. 159, 3–30. doi: 10.1016/S0009-2541(99)00031-5
Gastmans, D., Chang, H. K., and Hutcheon, I. (2010). Groundwater geochemical evolution in the northern portion of the Guarani Aquifer System (Brazil) and its relationship to diagenetic features. Appl. Geochem. 25, 16–33. doi: 10.1016/j.apgeochem.2009.09.024
Gesicki, A. L. D. (2007). Diagenetic Evolution of the Pirambóia and Botucatu formations (Guarani Aquifer System) in the S ao Paulo state (in Portuguese) (Ph.D. thesis). University of S ao Paulo.
Gudbrandsson, S., Wolff-Boenisch, D., Gislason, S. R., and Oelkers, E. H. (2014). Experimental determination of plagioclase dissolution rates as a function of its composition and pH at 22°C. Geochim. Cosmochim. Acta 139, 154–172. doi: 10.1016/j.gca.2014.04.028
Herman, J., and Usher, W. (2017). SALib: An open-source python library for sensitivity analysis. J. Open Source Softw. 2, 97. doi: 10.21105/joss.00097
Hirata, R., Gesicki, A., Sracek, O., Bertolo, R., Giannini, P. C., and Aravena, R. (2011). Relation between sedimentary framework and hydrogeology in the Guarani Aquifer System in S ao Paulo state, Brazil. J. South Am. Earth Sci. 31, 444–456. doi: 10.1016/j.jsames.2011.03.006
Jakobsen, R. (2007). Redox microniches in groundwater: a model study on the geometric and kinetic conditions required for concomitant fe oxide reduction, sulfate reduction, and methanogenesis. Water Resour. Res. 43:W12S12. doi: 10.1029/2006WR005663
Jakobsen, R., Kazmierczak, J., Sø, H. U., and Postma, D. (2018). Spatial variability of groundwater arsenic concentration as controlled by hydrogeology: conceptual analysis using 2-D reactive transport modeling. Water Resour. Res. 54, 10254–10269. doi: 10.1029/2018WR023685
Jessen, S., Postma, D., Thorling, L., Müller, S., Leskelä, J., and Engesgaard, P. (2017). Decadal variations in groundwater quality: a legacy from nitrate leaching and denitrification by pyrite in a sandy aquifer. Water Resour. Res. 53, 184–198. doi: 10.1002/2016WR018995
Kessler, T. J., and Harvey, C. F. (2001). The global flux of carbon dioxide into groundwater. Geophys. Res. Lett. 28, 279–282. doi: 10.1029/2000GL011505
Li, Y., Wang, Y. G., Houghton, R. A., and Tang, L. S. (2015). Hidden carbon sink beneath desert. Geophys. Res. Lett. 42, 5880–5887. doi: 10.1002/2015GL064222
Maher, K., and Chamberlain, C. P. (2014). Hydrologic regulation of chemical weathering and the geologic carbon cycle. Science 343, 1502–1504. doi: 10.1126/science.1250770
Maher, K., and Navarre-Sitchler, A. (2019). Reactive transport processes that drive chemical weathering: from making space for water to dismantling continents. Rev. Mineral. Geochem. 85, 349–380. doi: 10.2138/rmg.2018.85.12
McCallum, J. L., Cook, P. G., Berhane, D., Rumpf, C., and McMahon, G. A. (2012). Quantifying groundwater flows to streams using differential flow gaugings and water chemistry. J. Hydrol. 416–417, 118–132. doi: 10.1016/j.jhydrol.2011.11.040
Meng, S. X., and Maynard, J. B. (2001). Use of statistical analysis to formulate conceptual models of geochemical behavior: water chemical data from the Botucatu aquifer in S ao Paulo state, Brazil. J. Hydrol. 250, 78–97. doi: 10.1016/S0022-1694(01)00423-1
Molins, S., Trebotich, D., Steefel, C. I., and Shen, C. (2012). An investigation of the effect of pore scale flow on average geochemical reaction rates using direct numerical simulation. Water Resour. Res. 48, 1–11. doi: 10.1029/2011WR011404
Oelkers, E. H., Declercq, J., Saldi, G. D., Gislason, S. R., and Schott, J. (2018). Olivine dissolution rates: a critical review. Chem. Geol. 500, 1–19. doi: 10.1016/j.chemgeo.2018.10.008
Parkhurst, D. L., and Appelo, C. A. J. (1999). User's Guide to PHREEQC (Version 2) : A Computer Program for Speciation, Batch-Reaction, One-Dimensional Transport, and Inverse Geochemical Calculations. Technical report, USGS.
Parkhurst, D. L., Kipp, K. L., and Charlton, S. R. (2010). PHAST Version 2 - A Program for Simulating Groundwater Flow, Solute Transport, and Multicomponent Geochemical Reactions. Technical report, U.S. Geological Survey Techniques and Methods 6–A35.
Plischke, E., Borgonovo, E., and Smith, C. L. (2013). Global sensitivity measures from given data. Eur. J. Oper. Res. 226, 536–550. doi: 10.1016/j.ejor.2012.11.047
Pogge von Strandmann, P. A., Burton, K. W., Snæbjörnsdóttir, S. O., Sigfússon, B., Aradóttir, E. S., Gunnarsson, I., et al. (2019). Rapid CO2 mineralisation into calcite at the CarbFix storage site quantified using calcium isotopes. Nat. Commun. 10, 1–7. doi: 10.1038/s41467-019-10003-8
Rebouças, A. C. (1976). Recursos Hídricos Subterrâneos da Bacia do Paraná - Analise de Pre-Viabilidade (Ph. D. thesis), Université de Strasbourg.
Rebouças, A. C. (1994). “Sistema Aqüífero Botucatu no Brasil,” in VIII Congresso Brasileiro de Águas Subterrâneas (São Paulo), 500–509.
Rodríguez-Zorro, P. A., Ledru, M.-P., Bard, E., Aquino-Alfonso, O., Camejo, A., Daniau, A.-L., et al. (2020). Shut down of the South American summer monsoon during the penultimate glacial. Sci Rep. 10, 1–11.
Sánchez-Ca nete, E. P., Barron-Gafford, G. A., and Chorover, J. (2018). A considerable fraction of soil-respired CO2 is not emitted directly to the atmosphere. Sci. Rep. 8, 2–11. doi: 10.1038/s41598-018-29803-x
Seigneur, N., Mayer, K. U., and Steefel, C. I. (2019). Reactive transport in evolving porous media. Revi. Mineral. Geochem. 85, 197–238. doi: 10.2138/rmg.2019.85.7
Silva, R. B. G. (1983). Hydrogeochemical and Isotopic Study of Ground-Water of the Botucatu Aquifer, in S ao Paulo state (in Portuguese) (Ph.D. thesis), University of S ao Paulo.
Soler i Gil, A., and Bonotto, D. M. (2014). Hydrochemical and stable isotopes (H, O, S) signatures in deep groundwaters of Paraná basin, Brazil. Environ. Earth Sci. 73, 95–113. doi: 10.1007/s12665-014-3397-0
Sracek, O., and Hirata, R. (2002). Geochemical and stable isotopic evolution of the Guarani Aquifer System in the state of S ao Paulo, Brazil. Hydrogeol. J. 10, 643–655. doi: 10.1007/s10040-002-0222-8
Steefel, C. I., DePaolo, D. J., and Lichtner, P. C. (2005). Reactive transport modeling: An essential tool and a new research approach for the Earth sciences. Earth Planet Sci. Lett. 240, 539–558. doi: 10.1016/j.epsl.2005.09.017
Steffen, W., Crutzen, J., and McNeill, J. R. (2007). The Anthropocene: are humans now overwhelming the great forces of Nature? Ambio 36, 614–621. doi: 10.1579/0044-7447(2007)36[614:TAAHNO]2.0.CO;2
Teramoto, E. H., Gonçalves, R. D., and Chang, H. K. (2020). Hydrochemistry of the guarani aquifer system modulated by mixing with underlying and overlying hydrostratigraphic units. J. Hydrol. 30:100713. doi: 10.1016/j.ejrh.2020.100713
Vilhelmsen, T. N., Maher, K., Da Silva, C., Hermans, T., Grujic, O., Park, J., et al. (2018). The Earth Resources Challenge, Chapter 1. Washington, DC: American Geophysical Union (AGU).
Wendland, E., Barreto, C., and Gomes, L. H. (2007). Water balance in the Guarani Aquifer outcrop zone based on hydrogeologic monitoring. J. Hydrol. 342, 261–269. doi: 10.1016/j.jhydrol.2007.05.033
Keywords: aluminosilicate weathering, Guarani Aquifer System, global sensitivity analysis, CO2 mineralisation, PHAST simulator
Citation: Miotliński K and Peeters LJM (2021) Quantification of Carbon Cycling in a Large Aquifer Using Reactive Transport Modelling. Front. Water 3:714075. doi: 10.3389/frwa.2021.714075
Received: 24 May 2021; Accepted: 09 August 2021;
Published: 10 September 2021.
Edited by:
Anis Younes, Université de Strasbourg, FranceReviewed by:
Shervan Gharari, University of Saskatchewan, CanadaAlban Kuriqi, Instituto Superior Tcnico, Universidade de Lisboa, Portugal
Copyright © 2021 Miotliński and Peeters. This is an open-access article distributed under the terms of the Creative Commons Attribution License (CC BY). The use, distribution or reproduction in other forums is permitted, provided the original author(s) and the copyright owner(s) are credited and that the original publication in this journal is cited, in accordance with accepted academic practice. No use, distribution or reproduction is permitted which does not comply with these terms.
*Correspondence: Konrad Miotliński, ay5taW90bGluc2tpQGVjdS5lZHUuYXU=