
94% of researchers rate our articles as excellent or good
Learn more about the work of our research integrity team to safeguard the quality of each article we publish.
Find out more
ORIGINAL RESEARCH article
Front. Water , 08 October 2021
Sec. Environmental Water Quality
Volume 3 - 2021 | https://doi.org/10.3389/frwa.2021.711477
This article is part of the Research Topic Functional Diversity of Aquatic Microorganisms and Their Roles in Water Quality View all 10 articles
 Cristina P. Fernández-Baca1
 Catherine M. Spirito1
 Justin S. Bae1
 Zsofia M. Szegletes1Nathan Barott1Desiree J. Sausele1
 Yolanda M. Brooks1
 Daniel L. Weller2
 Ruth E. Richardson1*
Public swimming beaches often rely on culture-based methods to determine if fecal indicator bacteria (FIB) levels are greater than health risk-based beach action values (BAV). The slow turnaround time of culture-based assays can prevent effective beach closure and reopening decisions. Faster testing methods that can be completed on-site are needed. Additionally, beach closures are currently based on high FIB levels, but at-present there are no tools to examine the health risks to bathers from myriad pathogens (e.g., bacteria, viruses, protozoa) that may be present in recreational waters. Twelve New York State beaches (n = 9 freshwater and n = 3 marine) were monitored over the course of summer 2018, and two of the freshwater beaches were monitored in fall 2017 as part of a preliminary study. A rapid, in-field workflow for detecting fecal enterococci in water samples was tested using four assays on two Biomeme handheld devices. All Biomeme-based workflows involved in-field DNA extractions and qPCR using portable devices. Beach water samples were also analyzed using EPA-approved or EPA-based qPCR methods: two culture-based methods, Enterolert (targeting enterococci at freshwater and marine beaches) and Colilert (targeting E. coli at freshwater beaches); and one qPCR method based on EPA 1611.1. For low abundance pathogen quantification, nanoscale-qPCR was conducted in 2018 using the Pathogen Panel which targeted 12 viral, bacterial, and protozoal pathogens. In fall 2017, the qPCR-based methods performed similarly to Enterolert (r2 from 0.537 to 0.687) and correctly classified 62.5–75.0% of water samples for a BAV of 104 MPN per 100 ml. In summer 2018, the correlation between Enterococcus levels based on Biomeme qPCR and Enterolert varied substantially between the 12 beaches. Inclusion of diverse regions and beach types may have confounded the Biomeme qPCR results. The EPA 1611.1-based method showed a weak, significant correlation (r2 = 0.317, p = 0.00012) with Enterolert. Nanoscale-qPCR showed low-levels of pathogens present at all beach sites; but only three showed up with any substantial frequency, E. coli eae (25% of samples), norovirus (31.4%), and Giardia lamblia (11.4%). Preliminary studies to establish beach-specific correlation curves between rapid qPCR and Enterolert methods are needed before any qPCR assay is used to inform beach decisions.
In the United States, federal law requires recreational swimming waters be monitored for the presence of fecal indicator bacteria (FIB) to maintain public health and safety. The EPA recommends using fecal enterococci and Escherichia coli for freshwater testing, and enterococci for marine water testing (US EPA, 2013). While FIB themselves are not necessarily pathogenic, elevated FIB levels may indicate fecal contamination, and thus the presence of fecally-associated pathogens. Typically, fecally-associated pathogens are present at much lower levels than FIB making them more difficult to detect. Additionally, because there are many species of pathogenic bacteria, viruses, and protozoa, there is currently no single method to measure the diverse microorganisms that can lead to illness. Thus, FIB are used as proxies to estimate the risk of waterborne pathogens. Recently, the use of FIBs to estimate public health risk has come under scrutiny. A statistical analysis of 540 published studies of indicator-pathogen correlations found that no single indicator, including enterococci or E. coli, was strongly correlated with pathogen presence (Wu et al., 2011). This suggests our current methods for estimating water quality to reduce public health risks may need to be re-evaluated.
Current water testing methods vary by location but are either molecular or culture-based, with the latter being the conventional method for quantifying FIBs. Examples of culture-based methods include Colilert®, Enterolert®, and EPA methods such as US EPA Method 1603 (for E. coli) and US EPA Method 1600 (for enterococci). Although these methods are relatively inexpensive and easy to perform, they all require samples to be transported to a centralized lab for testing and necessitate an overnight incubation step resulting in a significant turnaround time for results. Specialized equipment for sealing and incubating test kits as well as trained lab technicians and reliable electricity, are all necessary for culture-based testing. Crucially, the long incubation period and reliable electricity source required by these methods limits their feasibility for routine, rapid, on-site monitoring. Although research has been done to eliminate the need for electricity by using homemade incubators, these systems are not widely used (Bernardes et al., 2020). In recent years, new culture-based methods have been developed including TECTA (Bramburger et al., 2015) and Compartment Bag Tests (CBTs; Brooks et al., 2017; Wang et al., 2017). However, these methods require processing times ranging from 7 to 48 h to obtain results.
Molecular methods, such as quantitative polymerase chain reaction (qPCR) are culture independent and can be used to specifically test samples for the presence of genes of interest (i.e., FIB indicator genes). qPCR-based methods can achieve results in under 4 h after water samples arrive at a laboratory. Although the EPA has approved two qPCR methods for Enterococcus 23S rRNA genes, EPA 1611.1 and 1609 (US EPA, 2013, 2015), they have not yet promulgated the methods in the Federal Register (https://www.federalregister.gov/agencies/environmental-protection-agency). Thus, although some states have started to implement these methods [e.g., Michigan (Dorevitch et al., 2017; Byappanahalli et al., 2018)], states like New York, do not recognize EPA 1611.1 and 1609 as suitable Enterococcus water quality testing methods for determining beach closures and openings. The EPA has not yet approved any qPCR-based methods for E. coli monitoring, although there are several published qPCR assays that are both sensitive and specific to E. coli, including assays targeting the 23S rRNA, 16S rRNA, uidA, and rodA genes (Huijsdens et al., 2002; Frahm and Obst, 2003; Chern et al., 2011; Haugland et al., 2021). Several other molecular methods have been developed for water quality monitoring, such as isothermal amplification for on-site water testing (Mauk et al., 2015), including for Enterococcus spp. (Kolm et al., 2017); targeting cells with qPCR or a propidium iodide treatment (Bae and Wuertz, 2012), digital PCR (Wang et al., 2016), and high throughput sequencing (Schang et al., 2016). Additionally, many different qPCR-based microbial source tracking (MST) tools have been used with varying success to test for source-specific markers (Harwood et al., 2014). Among these, nanoscale qPCR (ns-qPCR) using OpenArray® technology was recently used in a “Pathogen Panel” to test for Enterococcus spp. and E. coli as well as waterborne pathogens and MST markers in the Hudson River watershed (Brooks et al., 2020). Compared to culture-based testing, current molecular methods to quantify FIB are more sensitive and rapid, resulting in faster turnaround times for water quality monitoring (Griffith and Weisberg, 2011; Dorevitch et al., 2017). However, molecular methods generally require specialized equipment, centralized laboratories, trained technicians, and electricity. Additionally, these methods are currently more expensive than standard culture-based methods (Schang et al., 2016).
Water testing protocols (e.g., E. coli vs. enterococci quantification) vary in New York State (NYS) by locality, but across the state, if a beach exceeds the Beach Action Value (BAV) for the concentration of FIB for that location, the beach will issue an advisory and close immediately until the issue is resolved—i.e., a new water sample is tested and confirmed to contain FIB levels below the BAV (Water Quality Monitoring, 2004). Although time-consuming, culture-based methods are the standard for quantifying FIBs at NYS beaches. qPCR-based methods are comparatively more rapid and can be more sensitive than culture-based methods; however, they can also be more technically challenging and at-present, have not been approved for statewide testing. Biomeme, a Philadelphia based company, has developed a portable qPCR platform for rapid on-site testing to address this issue. Both the original two3 (now discontinued) and the newer model, Franklin (originally named the three9), developed to replace the two3, are portable thermal cycling devices created for quick, easy on-site FIB quantification via qPCR. Biomeme has also designed extraction kits for field processing samples that can be analyzed on their qPCR devices allowing for test results to be known within a few hours. However, similar to other qPCR-based methods, their protocol has not yet been EPA-approved to replace culture-based methods for water quality monitoring of recreational waters in NYS.
In this study, four different methods (Figure 1) including both culture-based (i.e., Enterolert and Colilert) and qPCR-based (i.e., EPA 1611.1-based, three Biomeme methods, and ns-qPCR) were used to test water samples from twelve different public swimming areas across NYS (see Figure 2 for locations). Our objectives were to determine: (1) how well the different qPCR methods (i.e., EPA 1611.1-based and various Biomeme methods) correlated with commonly used culture-based methods; (2) how well new qPCR methods developed by Biomeme compare with a qPCR method based on EPA 1611.1 (i.e., using EPA 1611.1 primers and probe); (3) if the ns-qPCR based Pathogen Panel (targeting 12 viral, bacterial, and protozoal pathogens) can be successfully deployed as a water quality indicator across various site locations (four geographic regions) and water types (fresh and marine water).
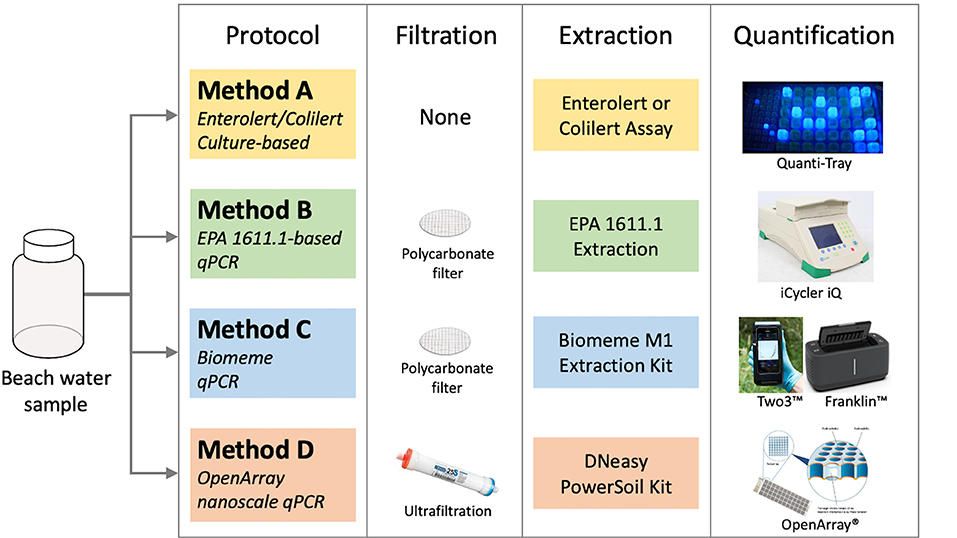
Figure 1. Schematic of the culture-based (Method A) and qPCR-based protocols (Methods B–D) show the workflow from raw beach water samples to comparable results. Method A (Enterolert or Colilert) is the standard method used by NYS beaches. Method C includes four qPCR variants (C1, C2, C2-IPC, and C3). Details on the qPCR assays and which methods were conducted in each year are described in Table 1.
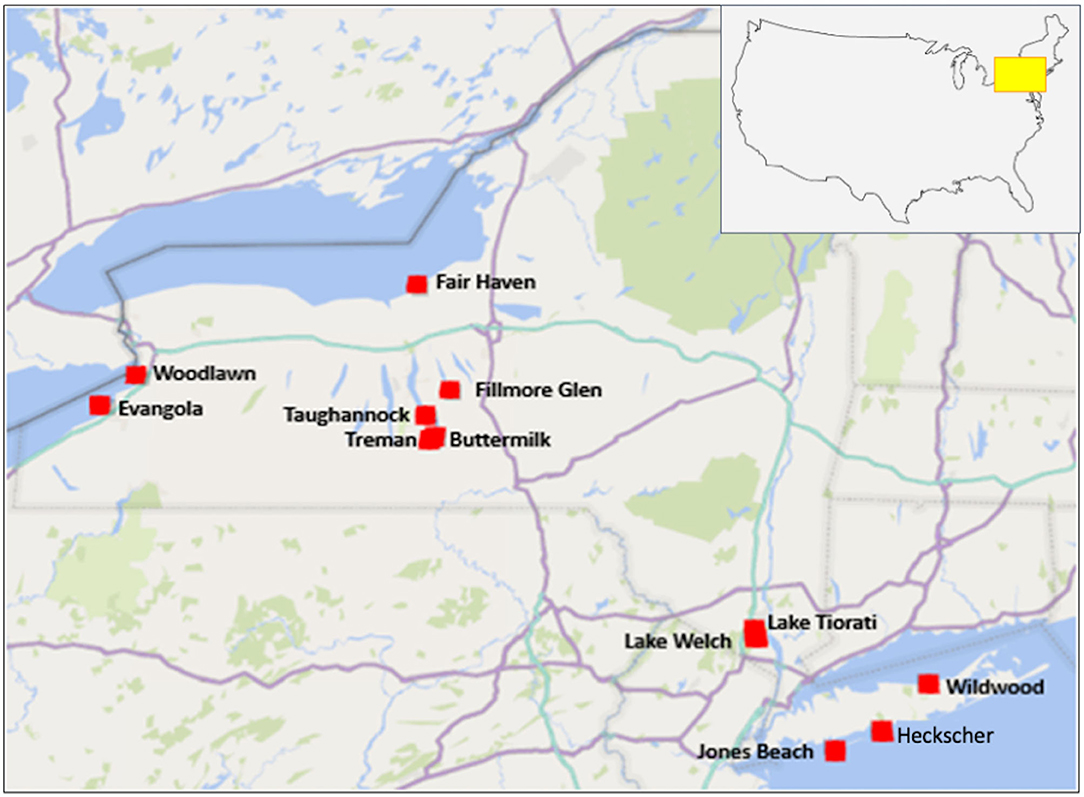
Figure 2. Sampling locations of swimming areas for New York State parks study.
In the fall of 2017, a preliminary study focused on testing water samples from two creek swimming sites both located in the Finger Lakes region (Buttermilk Falls State Park and Robert H. Treman State Park) (see map, Figure 2). Water samples were collected weekly beginning September 13 and ending October 10, 2017 and were analyzed using a qPCR method based on EPA 1611.1 (hereafter referred to as EPA-based or EPA 1611.1-based) and a culture-based (Enterolert) method, as well as three Biomeme methods (Methods C1, C2, and C3) (Figure 1; Table 1). In total 16 samples were taken in 2017 across the two beaches.
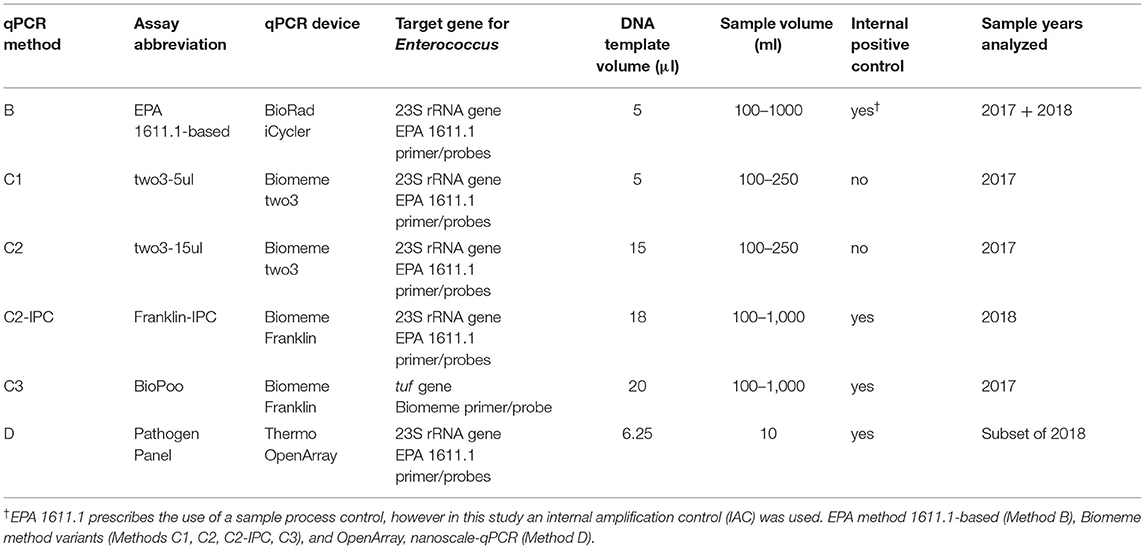
Table 1. Overview of the qPCR methods used in this study.
In the summer of 2018, 10 additional NYS parks swimming areas were added (Figure 2). For this second study, we collaborated with the NYS Department of Parks, Recreation, and Historical Preservation to coordinate collection of beach water samples to be synoptic with their routine sampling for FIB monitoring. Water samples were collected from swimming areas in the 12 NYS parks (Figure 2) including three Great Lakes beaches (i.e., Woodlawn Beach State Park and Evangola State Park on Lake Erie, and Fair Haven State Park on Lake Ontario); four inland beaches in the Finger Lakes region (i.e., Treman State Park, Buttermilk Falls State Park, Taughannock Falls State Park, Fillmore Glen State Park); two inland beaches in the Palisades (Lake Tiorati Beach and Lake Welch Beach); and three marine beaches on Long Island (i.e., Heckscher State Park, Jones Beach State Park, and Wildwood State Park). During the 2018 swimming season from June 11 to July 30, Buttermilk and Treman state parks were sampled weekly between 8:00 and 9:00 a.m. At the remaining 10 sites, morning samples were collected two to three times (Fair Haven was sampled only once and intensive sampling sites were sampled three times, see below) between 8:00 and 9:00 a.m.
A three-day intensive sampling campaign was done to gauge FIB and pathogen fluctuations throughout the day at four beaches across the state (Welch, Buttermilk, Heckscher and Woodlawn). Intensive sampling campaigns involved three consecutive days of sampling during which seven samples were collected. Sampling started and ended with a sample taken at 8:00 a.m. on the 1st and 3rd day. On the second day, five samples were taken beginning at 8:00 a.m. at 3 h intervals as follows: 8:00 a.m., 11:00 a.m., 2:00 p.m., 5:00 p.m., 8:00 p.m. In total, 61 samples were taken in 2018.
Samples collected in 2018 were analyzed using one culture-based EPA method (Enterolert) and one qPCR EPA-based method (EPA 1611.1-based assay), as well as one Biomeme method, Franklin-IPC, which included an internal positive control and was not available in 2017 (Figure 1; Table 1). The two3 device was discontinued and replaced by the Franklin device, thus, the two3 was not used again in 2018. The BioPoo assay was available in 2018, however we used the Franklin-IPC method as this method is more comparable to the EPA-based qPCR method (as well as the two3 methods). The Franklin-IPC (and both assays run on the two3) use the same primers and probe as the EPA 1611.1 method to target the Enterococcus 23S rRNA gene [see methods section EPA-based qPCR method (Method B)], while the BioPoo assay targets the tuf gene [see methods section Biomeme Franklin with BioPoo in 2017 (Method C3) for more details].
In both years, for each sample, a closed, autoclaved 1 L polypropylene or glass bottle was held 15 to 30 cm below the water surface, opened, filled with water, and closed again below the surface using gloved hands. Duplicate water samples were taken for each timepoint. All samples were stored on ice during transit to the laboratory where they were processed within 6 h of collection. In 2018, at each location, water temperature and turbidity (Hach 2100Q Portable Turbidimeter), were recorded. Rainfall over the previous 24 and 96 h was also collected in 2018 from the nearest weather station (see Supplementary Data File 1 for the full dataset). For the nanoscale OpenArray qPCR used in 2018, an additional 10 L sample was taken concurrently with the 1 L sample at each location, as described above, using a 10 L carboy in place of the 1 L bottle. Each carboy was bleach-sterilized overnight and rinsed 3 times with sterile water prior to sampling.
Enterolert and Colilert Quanti-Tray/2000 (IDEXX Laboratories, Westbrook, ME) were used to quantify culturable concentrations of enterococci and E. coli, respectively. Both methods are EPA-approved for freshwater beach monitoring. At all sites Enterolert was used, as this method can be used for either beach type, while Colilert was only used at a subset of sites. For marine beaches, only Enterolert assays were used.
Enterolert and Colilert measurements were performed according to the manufacturers' instructions. Briefly, samples were poured into trays using gloved hands, sealed using the Quanti-Tray Sealer (IDEXX Laboratories, Westbrook, ME), and placed in an incubator at 41°C (±0.5°C) for 24 h. After incubation, the trays were read by illuminating the wells with a 6-watt, 365 nm UV light and recording the number of large and small wells that were positive for blue fluorescence. The number of illuminated wells was converted to MPN per 100 ml using the IDEXX 51-Well Quanti-Tray MPN Table (provided by the manufacturer). The IDEXX-QC Enterococci Quality Controls “Enterococcus faecalis” and “Streptococcus bovis” positive and negative controls (IDEXX Laboratories, Westbrook, ME), respectively, were run to ensure the specificity and accuracy of the testing method. Controls were run concurrently with samples and matched expected results. For all beaches, where possible, we obtained official State Park results for culture-based methods, both Enterolert and Colilert, that were performed at certified labs and used to determine BAV exceedances (See Supplementary Data File 1).
Samples used for qPCR-based methods B and C (i.e., EPA 1611.1-based and the Biomeme methods) were membrane filtered using white polycarbonate filters (diameter, 47 mm, pore size between 0.4 and 0.6 μm) in accordance with EPA method 1611.1 (US EPA, 2015). Each sample was mixed by shaking for 30 s, and 100 to 1,000 ml of sample (exact volumes recorded for each sample) were vacuum filtered through the membrane filter. This was followed by one rinse with distilled water. Filters with captured biomass were stored in sterile, screw cap, 15 ml polypropylene tubes at −80°C until DNA extraction. For 1 L samples, filter clogging was an issue for two of the samples, in these cases multiple membrane filters were used to process one sample and all filters were combined into a single composite sample for DNA extraction.
For ns-qPCR quantification of low-abundance pathogens, samples were processed using tangential flow ultrafiltration to concentrate biomass from large 10 L water samples using a hollow-fiber ultrafilter, Rexseed 25S (Asahi, USA), as described previously (Rhodes et al., 2012; Brooks et al., 2020). Negative controls for each sampling date were also processed and consisted of 10 L of deionized water. All samples were concentrated to approximately 250 ml of retentate. Based on Polaczyk et al. (2008), 0.001% (w/w) bovine serum albumin, 0.9 M sodium chloride, and 0.012% (w/w) polyethylene glycol were added to the retentate followed by an overnight precipitation at 4°C to aid in virus precipitation. The samples were then centrifuged at 10,000 × g for 30 min at 4°C and the supernatant was decanted. The pelleted biomass was resuspended in 5 ml of sterile PBS, distributed into microcentrifuge tubes in 1 ml aliquots, then stored at −80°C until DNA extraction.
For Method B, DNA extractions were performed according to the EPA 1611.1 method with the modification that no sample processing control was used. Filters were transferred to 2 ml screw cap centrifuge tubes prepacked with 0.3 g of 212 to 300 μm autoclaved, glass beads and AE buffer (10 mM Tris-Cl 0.5 mM EDTA; pH 9.0) using sterile tweezers. The tubes were then bead beaten at maximum speed for 60 s and centrifuged at 12,000 × g for 60 s. The supernatant was transferred to a clean 2 ml microcentrifuge tube and centrifuged a second time at 12,000 × g for 5 min. The supernatant was then transferred to a new 2 ml tube and was either immediately used for qPCR or frozen at −80°C until use.
For Method C, DNA extractions from filters were done using the Biomeme Field Sample Prep Kit (M1) following the manufacturer's instructions (Biomeme, Philadelphia, PA). Briefly, sterile tweezers were used to transfer the filters into the kit extraction tubes prefilled with a lysis buffer. The tubes were shaken vigorously to resuspend the filtrate. The subsequent protein, salt, and drying wash followed by air drying and DNA elution were carried out according to the Biomeme protocol (Figure 3). The M1 kit was designed to be used in the field, and in our study the kit was used in the field to immediately process the majority of samples. Samples taken back to laboratory for processing were those taken on the third day of an intensive sampling campaign (4 samples total). All DNA extracts were stored at −80°C.
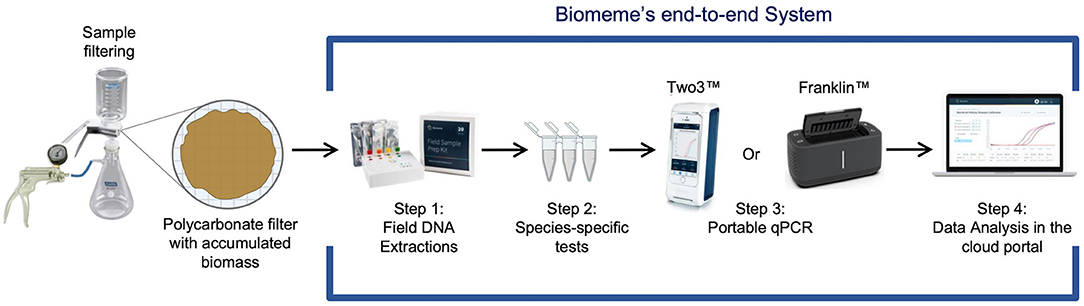
Figure 3. Summary of Biomeme qPCR workflow. Water is membrane-filtered then (1) DNA is extracted using the field DNA sample prep kit; (2) Enterococcus qPCR assays are set up in reagent strips; (3) qPCR assays are run on the smartphone-controlled handheld thermocycler; (4) data is retrieved for analyses via the cloud portal or exported as raw data from the smartphone.
DNeasy Powersoil DNA extraction kits (Qiagen, Valencia, CA) were used to extract DNA from the 1 ml aliquots of the resuspended biomass pellets following manufacturer's instructions. Prior to DNA extraction, bacteriophage MS2 (ATCC 15597-B1), was added to the resuspended biomass pellets and served as an extraction and amplification control (Dreier et al., 2005; Brooks et al., 2020). The DNA extracts were stored at −80°C.
Enterococcus quantification targeting the large subunit ribosomal ribonucleic acid gene (lsrRNA, 23S rRNA) was done using iTaq Universal SYBR Green Supermix (BioRad, Hercules, CA) and the primers/probe and thermal cycling protocol from the EPA 1611.1 method (US EPA, 2015). TaqMan qPCR assays were performed in triplicate on a BioRad iCycler (BioRad, Hercules, CA). Total reaction volumes of 25 μl were used with 5 μl of template (standards, blanks, and/or samples), 10 μl iTaq Universal SYBR Green Supermix (Bio-Rad Laboratories, Hercules, CA) and a mixture of the Enterococcus-specific primers and probe. The thermal protocol had an initial holding period of 2 min at 50°C then a 10 min period at 95°C, followed by 40 cycles of denaturing for 15 s at 95°C and annealing/elongation for 60 s at 60°C.
Standards for E. faecalis 23S rRNA were created using gBlocks (Integrated DNA Technologies (IDT), Coralville, IA). All standards were made in AE buffer using a dilution series from 8.0 × 10³ copies μl−1 down to 1 × 100 copy μl−1. For all qPCR methods copies μl−1 were converted to copies per 100 ml of water sampled. To ensure specificity of amplification, a subset of PCR products were run on a 1% agarose gel to confirm the correct sized product (93 bp for Enterococcus).
To assess inhibition in samples an internal amplification control (IAC) was used retroactively on 85% of the samples (all samples that remained). The IAC was based on the US EPA 1696 method (US EPA, 2019) using the primers and probe from this method as well as the same IAC sequence which was created using gBlocks (IDT). Six no template controls (NTCs) were run per plate and the average Cq of the NTCs (Cq = 27.52) plus three times the standard deviation (Cq + 3 Standard deviations = 28.23) was used as the Cq cutoff for inhibition. If the Cq of 2 of the 3 triplicates run for each sample was below this cutoff Cq then the sample was not considered to be inhibited. The IAC results showed that no samples were inhibited when the same sample dilutions were used as those in the original analysis.
Four different methods were run on Biomeme devices (see Table 1), which varied in the amount of template used (from 5 to 20 μl), the presence/absence of an internal positive control (IPC), and the Biomeme device used (i.e., two3 or Franklin/three9). The Biomeme two3 (now discontinued) had two sampling channels of different excitation and emission wavelengths (allowing duplex reactions) and could analyze three samples at a time (Sepulveda et al., 2018). The replacement for the two3, the Biomeme Franklin/three9 (hereafter referred to as Franklin) can analyze up to nine samples at a time and has three different fluorescence channels, allowing for triplex reactions. Biomeme qPCR was performed using the same thermal profile across both devices with an initial denature step of 60 s at 95°C followed by 45 cycles each with 1 s at 95°C and 20 s at 60°C. The total run time for one run was 45 min. Standards for all Biomeme workflows were dilutions of either gBlocks (Integrated DNA Technologies (IDT), Coralville, IA) (for Methods C1, C2 and C2-IPC) or genomic pure culture DNA from Enterococcus faecilis (for Method C3). Standards dilutions were created from 1 × 10⁵ copies μl−1 to 1 × 101 copies μl−1.
Biomeme's LyoDNA Mix (Biomeme, Philadelphia, PA) was re-suspended by adding a 12% aqueous glycerol solution as per manufacturer's instructions to obtain a 2X concentration master mix. Each 25 μl qPCR reaction contained 12.5 μl of 2X LyoDNA master mix, 5 μl of water, 1 μl of 10 μM forward and reverse primers, 0.5 μl of 10 μM probe, and 5 μl of template DNA. The primers and probes used and their concentrations (400 and 200 nM, respectively) in Method C1 were the same as those of EPA 1611.1-based method (Method B).
Method C2 was designed to increase sensitivity of the original Method C1 to low levels of enterococci. A 5X LyoDNA master mix concentration was used in place of the 2X LyoDNA master mix used in Method C1 which allowed for the addition of more template DNA (15 μl instead of 5 μl). Each 20 μl reaction was composed of 4 μl of 5X LyoDNA master mix, 0.44 μl of nuclease-free water, 0.08 μl of 100 μM forward and reverse primers, 0.4 μl of 10 μM probe, and 15 μl of template DNA. The greater template volume was used to increase the concentration of initial copies per reaction; all other assay concentrations (e.g., primers, probes, etc.) in this method were the same as those used in Method C1.
Method C2-IPC was similar to method C2 with two main differences, first the Franklin device was used in place of the discontinued two3 device and second the LyoDNA master mix was replaced with the LyoDNA+IPC master mix prepackaged in Go-Strips (Biomeme, Philadelphia, PA). Go-Strips include proprietary lyophilized primers, probe, and DNA for an IPC assay in addition to the lyophilized master mix. For this method, 2 μl of primer/probe mix for Enterococcus spp. (same as in EPA 1611.1-based and C1 and C2 methods) and 18 μl of sample were added to the IPC Go-Strips. The IPC was used to assess inhibition and after initial testing indicated inhibition across many samples (i.e., no IPC amplification), all samples were run at 1:10 dilution. The delta Ct method was used to calculate gene copy numbers, using the difference between IPC and Enterococcus Cts to create a standard curve specific for the C2-IPC method.
Method C3, which was run on the Franklin device, uses Biomeme's BioPoo Go-Strips. These Go-Strips contain the lyophilized, proprietary primers and probes for three targets: an IPC, the translation elongation factor (tuf) gene of Enterococcus, and Human Fecal Marker 183 (HF183), a human-associated Bacteroides spp. The Biomeme BioPoo assay tests for the tuf gene rather than the 23S rRNA gene targeted by the EPA 1611.1 primers and probe. For this method, 20 μl of sample was loaded into a well and used to resuspend the master mix. Sample inhibition was assessed by examining IPC results, if the IPC did not amplify, samples were run again at a 1:10 dilution.
As described in Brooks et al. (2020) a “Pathogen Panel” was designed for OpenArray plates (printed by Thermo-Fisher in an 18 x 3 format to allow for 18 targets with three technical replicates per sample), to determine the presence and abundance of 12 waterborne pathogens (Campylobacter spp. unknown target, Shigella spp./enteroinvasive E.coli ipaH, Salmonella spp. unknown target; E. coli stx1; E. coli eae, eaeF2/R; E. coli O157 rfbE; norovirus group II, QNIF2d/Cog2R; adenovirus type 40/41, VTB1-HAdVF; enterovirus highly conserved 5′ untranslated region; hepatitis A highly conserved 5′non-coding region, HAV240/HAV H68; rotavirus A NSP3; Giardia lamblia 18S rRNA, Giardia80F/127R), two general FIB [E. coli unknown gene and Enterococcus spp. 23S rRNA (EPA Method 1611.1)], and three source-specific FIB (i.e., human, Bacteroides spp. 16S rRNA, HumM2; cow, Bacteroides spp. 16S rRNA, CowM3; and poultry, Brevibacterium spp. LA35 16S rRNA) as well as an internal positive control (MS2) (Brooks et al., 2020). Standards for the 17 targets in the Pathogen Panel were either genomic DNA (Salmonella spp. control strain from the Cornell Animal Health Diagnostic Center; Campylobacter jejuni from ATCC, 33560D-5; Shigella flexneri from ATCC, 29903D-5), plasmid DNA (E. coli 23S rRNA (Thermo Fisher ABI part no. 4460366), Giardia lamblia (Genscript, Piscataway, NJ), and norovirus (IDT, Coralville, IA)], or synthetic gBlocks purchased from IDT. The detailed ns-qPCR workflow is described in Goodman et al. (2016). Samples with qPCR inhibition were diluted 1:10 for ns-qPCR.
For all FIB qPCR-based methods, we developed correlation curves between cellular equivalents (CE) per 100 ml as determined by qPCR vs. most probable number (MPN) of enterococci per 100 ml as determined by the culture-based method Enterolert. From these correlation curves we determined the qPCR value corresponding to BAVs used by different localities in NYS. The two BAVs used were 60 MPN per 100 ml for freshwater and 104 MPN per 100 ml for marine beaches. Using these values, we calculated whether any given sample was in exceedance of or below the BAV (indicating an acceptable level of risk, “safe”) based on their qPCR-determined enterococci gene concentrations. For each sample, we then compared the qPCR-based classification to the culture-based, Enterolert, classification and categorized every qPCR measurement as either correctly classified (correct above or below the BAV) or incorrectly classified (false negative or false positive) using Enterolert as the standard.
All statistical analyses were conducted in R (version 3.6.1) (R Core Team, 2013). Data normality was tested in linear and log10-log10 space and all data showed normality in log10-log10 space thus all plots and calculations are presented using the transformed data. Linear regression analyses were conducted using a significance cutoff of p = 0.05. Correlations of environmental variables with qPCR- and culture-based FIB concentrations as well as pathogen concentrations were made with the cor() function in R using the Pearson method with pairwise comparisons. Heat maps were created in R using the Euclidean distance for the dissimilarity measure.
In the preliminary fall 2017 study, two riverine state park swimming areas were monitored (i.e., Buttermilk and Treman State Parks) using four different qPCR methods (i.e., EPA 1611.1-based assay and three Biomeme workflows) for two months. The EPA 1611.1-based assay and all three Biomeme methods correlated positively with the culture-based Enterolert method currently used by the two beaches (Figure 4). All qPCR-based values are reported as gene copies per 100 ml to allow for easy comparisons across methods and years. The in-field and lab benchtop qPCR devices performed relatively similarly with stronger correlations between qPCR and culture-based results for the two3-15 μl (r2 = 0.687, p = 0.00046) and Franklin BioPoo (r2 = 0.645, p = 0.00292) method compared to the EPA-based assay (r2 = 0.594, p = 0.00204), with the two3-5 μl method having the weakest correlation (r2 = 0.537, p = 0.0159). The slopes of the fit-lines also varied by qPCR method with the Franklin BioPoo having a near 1-to-1 correlation with Enterolert results (slope = 0.974, intercept = 0.657), while the other methods had fit-lines with slopes <1 (two3-5 μl slope = 0.591, intercept = 1.99; two3-15 μl slope = 0.657, intercept = 2.44; EPA 1611.1-based method slope = 0.287, intercept = 3.07). No amplification of HF183 was found in any of the fall 2017 samples with the BioPoo assay. Treman State Park had lower FIB counts overall than Buttermilk State Park. All Enterolert results for Treman were below the 60 MPN per 100 ml BAV, whereas Buttermilk results were all above this threshold and most samples were above the 104 MPN per 100 ml BAV (Figure 4).
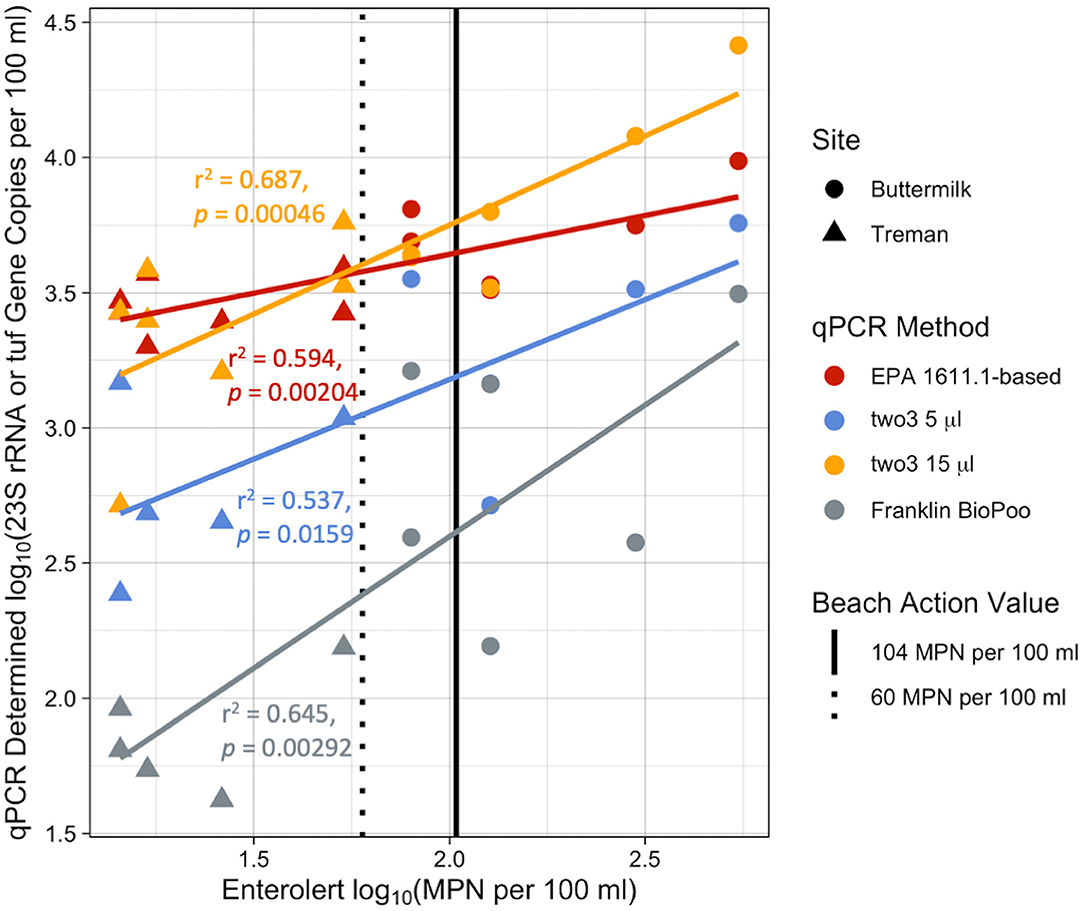
Figure 4. Comparison of qPCR methods to Enterolert. log10-log10 comparison of the Biomeme methods C1, C2, and C3 (two3-5 μl, two3-15 μl, and BioPoo, respectively) and EPA-based method with the standard culture-based method (Enterolert) currently used by beaches for fall 2017 Buttermilk (circle) and Treman (triangle) samples. The Biomeme method C1 and C2 and EPA-based methods quantify the 23S rRNA gene for Enterococcus, while the Biomeme method C3 (Franklin BioPoo) quantifies the tuf gene. Vertical lines denote beach action values (BAVs) used by different localities, the dotted black line represents a BAV of 60 MPN per 100 ml and the solid line represents a BAV of 104 MPN per 100 ml.
Percent correct classifications for each qPCR method were calculated using culture-based Enterolert results as the standard for “correct” quantification. For example, if the qPCR method results agreed with the Enterolert results (e.g., both showed FIB counts were above the BAVs and the beach should be closed) then the qPCR method results was considered correctly classified, if the two methods did not agree then the qPCR method was deemed incorrectly classified, using the Enterolert method result as the standard reference (Table 2). Different localities use different BAVs, thus both were used for these calculations (i.e., 60 MPN per 100 ml and 104 MPN per 100 ml). For the BAV of 60 MPN per 100 ml, the two3-5 μl and BioPoo methods performed the best (78.6% and 81.3% correct classifications, respectively), while the EPA 1611.1-based assay and two3-5 μl performed similarly (68.8% correct classifications for both). For the BAV of 104 MPN per 100 ml, correct classification was best for EPA 1611.1-based assay (75%) while the two3-5 μl and BioPoo Biomeme methods performed similarly (71.4 and 68.8%, respectively) and the two3-15 μl performed worse (62.5%). False negatives were highest for the BioPoo method (18.8% and 25% for BAVs of 60 and 104 MPN per 100 ml, respectively), indicating that this qPCR method would underestimate FIBs more frequently than the other qPCR methods. However, BioPoo's false positive rate is the lowest among the qPCR methods (0 to 6.3% for BAVs of 60 and 104 MPN per 100 ml, respectively).
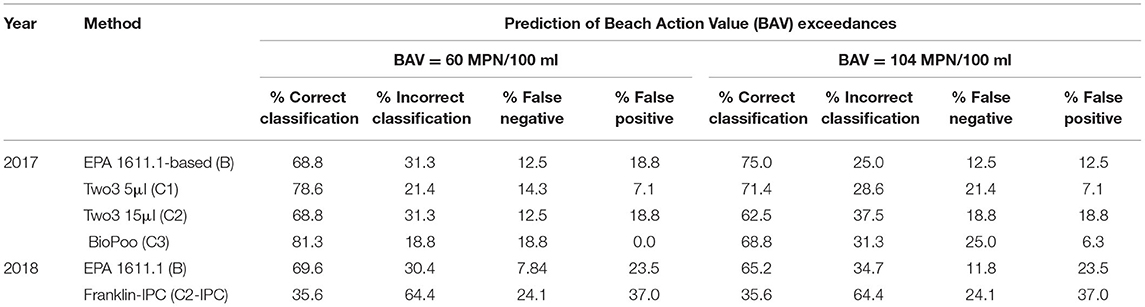
Table 2. Accuracy of qPCR methods for predicting beach action value (BAV) exceedances as compared to the culture-based Enterolert method in fall 2017 and summer 2018 samples.
There was a strong correlation between the results of the various Biomeme qPCR methods with the EPA 1611.1-based method for fall 2017 samples (Figure 5). The correlation was strongest between the EPA 1611.1-based method and the Franklin BioPoo (r2 = 0.647, p = 0.00283) and two3-5 μl (r2 = 0.651, p = 0.0048) and was slightly lower for the two3-5 μl (r2 = 0.404, p = 0.0196). The slopes of the fit-lines were all >1 (two3-5 μl slope = 1.35, intercept = −1.24; two3-15 μl slope= 1.97, intercept = −3.99; Franklin BioPoo slope = 2.49, intercept = −6.47).
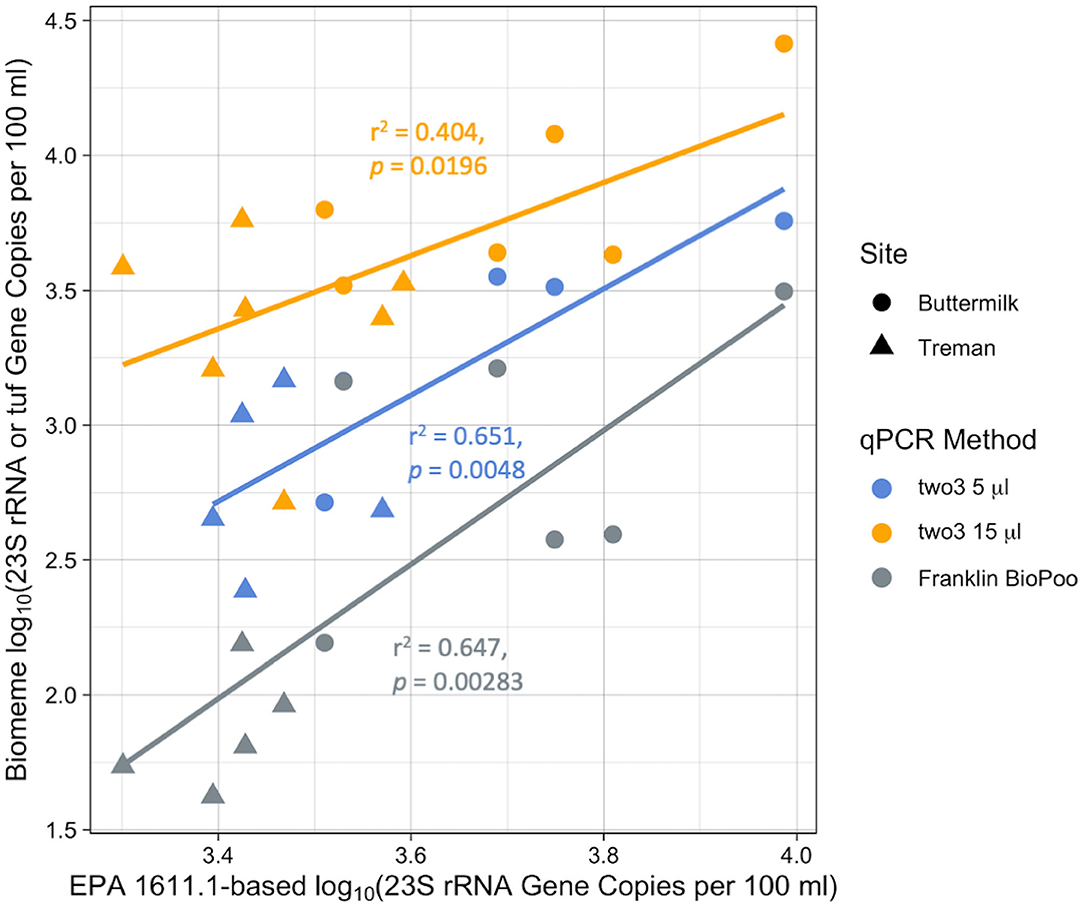
Figure 5. Comparison of novel qPCR methods to the EPA 1611.1-based method for fall 2017 beach samples. log10-log10 plots of Biomeme method (C1, two3-5 μl; C2, two3-15 μl; and C3, BioPoo) results as compared to EPA-based method. The BioPoo assay quantifies the tuf gene while all other assays quantify the 23S rRNA gene for Enterococcus.
The summer 2018 study included more beaches that were also more diverse (i.e., both freshwater and marine across various regions) than the fall 2017 dataset. The Biomeme qPCR results were variable for the Franklin-IPC method and did not correlate (p < 0.05) with the culture-based Enterolert results (Figure 6A). Similar to fall 2017 results, the EPA 1611.1-based method significantly (p = 0.000126) positively correlated with Enterolert results (slope = 0.577, intercept = 3.67, r2 = 0.317), however the correlation was not as strong in 2018 as compared to 2017 (Figure 6A). The Franklin-IPC method did not appear to correlate with EPA 1611.1-based method results (Figure 6B). Interestingly, when only the Finger Lakes beaches were examined, there was a weak, significant correlation between the two qPCR methods (r2 = 0.237, p = 0.0105), however other beach locations did not show any correlations between the two qPCR methods (Supplementary Figure 1). Although there were only three marine sites, all were below the BAV of 60 MPN per 100 ml whereas the freshwater beaches ranged from 0 MPN per 100 ml up to 2420 MPN per 100 ml, the upper limit of the Enterolert kit.
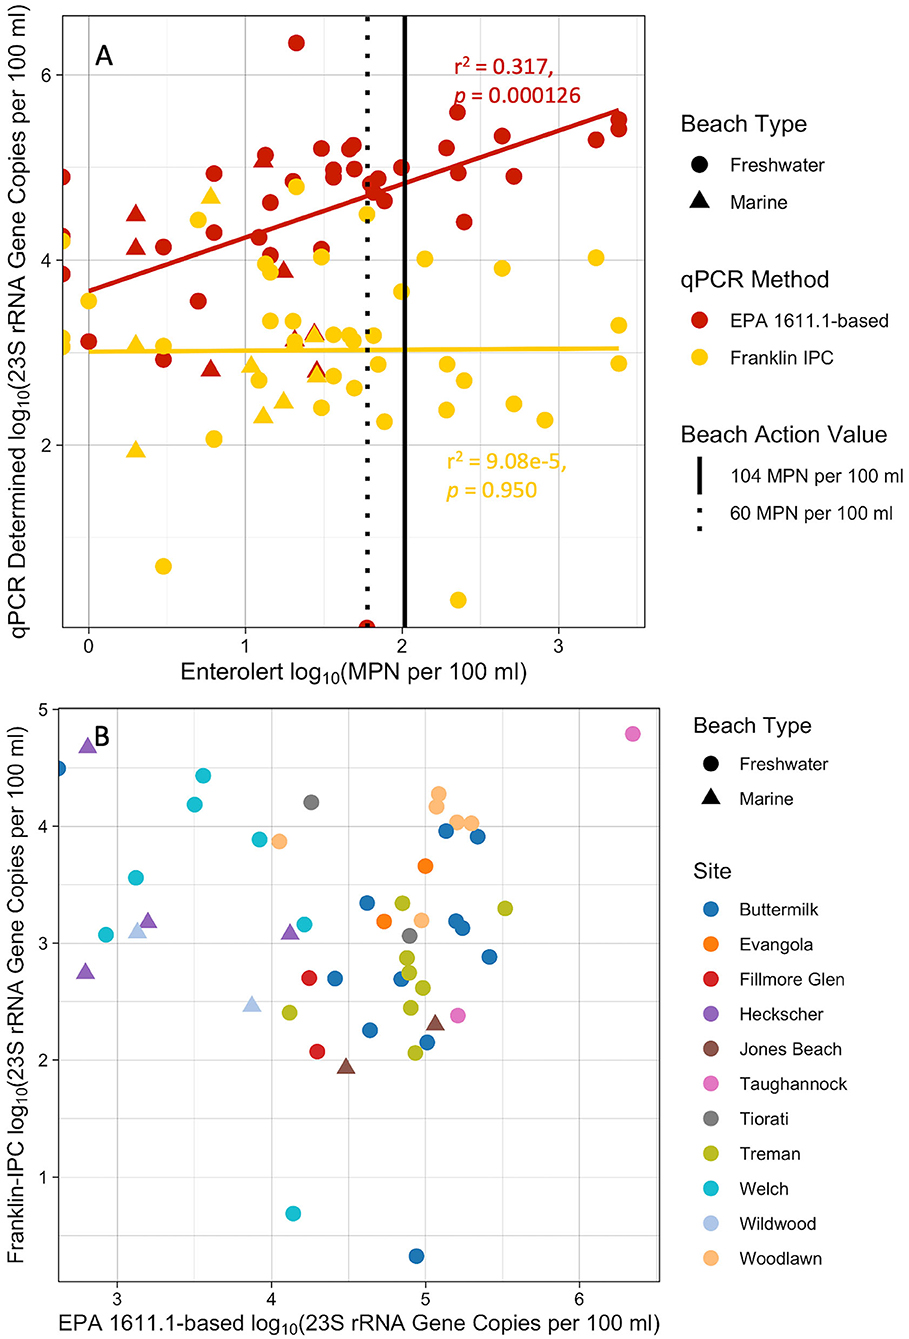
Figure 6. Summer 2018 water sample results from 12 New York State beaches. (A) Comparison of qPCR methods EPA-based and Biomeme Franklin-IPC (Methods B and C2-IPC) to Enterolert. Vertical lines denote beach action values (BAVs) used by different localities, the dotted black line represents a BAV of 60 MPN per 100 ml and the solid line represents a BAV of 104 MPN per 100 ml. (B) Comparison of qPCR methods: Biomeme Franklin-IPC with EPA 1611.1.
Examining the results by geographic region (Supplementary Figures 2A,B) showed that the positive correlation between the EPA 1611.1-based and Enterolert methods was a result of the Finger Lakes', Great Lakes', and Palisades' beach results, whereas the Long Island beaches were more variable. The Finger Lakes, Great Lakes, and Palisades beaches are all freshwater beaches, thus we grouped results by beach type (freshwater vs. marine) (Supplementary Figures 2C,D). When considering only freshwater beaches the correlation between the EPA 1611.1-based assay and Enterolert was stronger (r2 = 0.408, p < 0.0001, Supplementary Figure 2D) than when all sites were grouped together. This grouping also highlighted the lack of correlation between the EPA 1611.1-based assay and Enterolert measurements for marine sites (r2 = 0.204, p = 0.262). The beach type analysis did not change the relationship between Franklin-IPC and Enterolert results which showed no correlation for either freshwater (r2 = 0.000297, p = 0.921) or marine beaches (r2 = 0.00114, p = 0.931) (Supplementary Figures 2C,D, respectively).
Percent correct classifications were again calculated for the summer 2018 dataset (Table 2). The EPA 1611.1-based method performed similarly over the two years with correct classifications of the majority of samples (69.9%) and a relatively low false negative rate (7.84%). In contrast, the Franklin-IPC method correctly classified only 35.6% of samples and incorrectly classified the rest, with 24.1% of those incorrect classifications being false negatives. The EPA 1611.1-based method performed slightly worse for the 104 MPN per 100 ml BAV (65.2% correct classifications) while the Franklin-IPC method performed the same under both BAVs.
Correlations between environmental conditions (i.e., turbidity, water temperature, rainfall over previous 24 h and rainfall over previous 4 d) and measured FIBs (e.g., culture-based and qPCR-based methods) were also examined (Supplementary Figure 3). Enterolert and Colilert were moderately positively correlated (r = 0.25) and both methods were positively correlated with rainfall (r = 0.46 and 0.18 for previous 24 h rainfall, respectively). Water temperature showed weak to moderate correlations with turbidity (r = 0.53), Franklin-IPC (r = 0.36), and EPA 1611.1-based (r = 0.18) results. Turbidity was moderately positively correlated with Colilert (r = 0.43) and Enterolert (r = 0.36) measurements.
Two beaches, Buttermilk and Treman, were examined in both fall 2017 and summer 2018 using the EPA 1611.1-based and Enterolert methods. The summer 2018 EPA 1611.1-based method showed a weaker positive correlation to Enterolert results in 2018 (r2 = 0.208) as compared to 2017 (r2 = 0.59) (Supplementary Figure 4). Unlike in fall 2017, there were several Treman Enterolert samples in 2018 that were above both BAVs. Treman samples in 2018 ranged from as low as 0 up to 2420 MPN per 100 ml, the upper detection limit of the test (average of 324 ± 712 MPN per 100 ml), showing much more variability than in 2017 where samples averaged 28.0 ± 18.0 MPN per 100 ml. Buttermilk Enterolert samples likewise showed more variability in 2018 compared to 2017 (average 369 ± 688 MPN per 100 ml and 210 ± 184 MPN per 100 ml, for 2018 and 2017, respectively). Some of this variability may be explained by having more samples in 2018 (15 and 12 samples for Buttermilk and Treman, respectively) than in 2017 (eight each for Buttermilk and Treman). Additionally, the 2017 samples were taken in the fall during which the beaches were always closed and there were no rain events over the 4-week sampling period. In contrast, in 2018 samples included several rain events and the sampling period spanned 2 months in the summer.
In 2018, four beaches were selected for “intensive” sampling, meaning samples were taken at 8:00 a.m. for 3 consecutive days, and on the second day samples were also taken at 3 h intervals starting from the 8:00 a.m. sample until 8:00 p.m. (i.e., 11:00 a.m., 2:00 p.m., 5:00 p.m., and 8:00 p.m.). All samples were analyzed using three methods: Enterolert, EPA 1611.1-based, Franklin-IPC. The results were mixed, gene copies per 100 ml determined by Franklin-IPC and EPA 1611.1-based methods were similar at Woodlawn but were markedly different at other sites including Buttermilk (Supplementary Figure 5). At each of the four intensive sampling locations, there were rain events during the sampling campaigns; however, they varied in intensity and duration. At Heckscher and Buttermilk rain was light ≤2.54 mm over <4 h. Heckscher had rain before the third day's morning sample (6:00 to 9:00 a.m.) and Buttermilk during the morning of the second day (9:00 to 12:00 p.m.). While Welch had 12.7 mm rain over 5 h (3:00 to 9:00 a.m.) and Woodlawn had 8.89 mm overnight for 12 h (10:00 to 10:00 a.m.). Heckscher was the only marine site included in the intensive sampling campaigns and showed no overlapping trends between the qPCR methods or between the qPCR methods and culture-based methods. Woodlawn was the only site that showed similar trends over time between the methods and did appear to show a spike in FIB concentrations across all three methods following the rain event (Supplementary Figure 5).
The Pathogen Panel results showed there were few pathogens across morning samples from the New York State beaches (Figure 7A). One Treman sample (6/25) and two Fillmore Glen samples showed the highest pathogen counts for Enterococcus spp. and the various E. coli strains, while the other beach samples were relatively low for all pathogens (Figure 7A). Creek samples had higher pathogen counts than other watershed types, and with one exception (Taughannock 6/18) all samples with Bacteroides HumM2 were found in creek samples (Figure 7A). Grouping by geographic regions showed that the Finger Lakes samples had higher pathogen counts overall than the Great Lakes, Long Island, or Palisades regions, however the sampling regime from the Finger Lakes included more rain events (Figure 7B; Supplementary Table 1). Although there were only three marine beach sites, they had much lower pathogen counts overall, and more non-detects than the freshwater sites (Supplementary Figure 6). Several pathogens were never detected and thus were not included in the analysis, they were adenovirus, Brevibacterium spp. LA35 (avian marker), hepA, and Shigella spp. The internal spike-in positive control (MS2 virus) was detected in 20% of samples and 2 of 3 sterile water processing blanks with Cts ranging from 20.75 to 23.43. The majority of samples (80%) had MS2 below detection, possibly due to sample dilution.
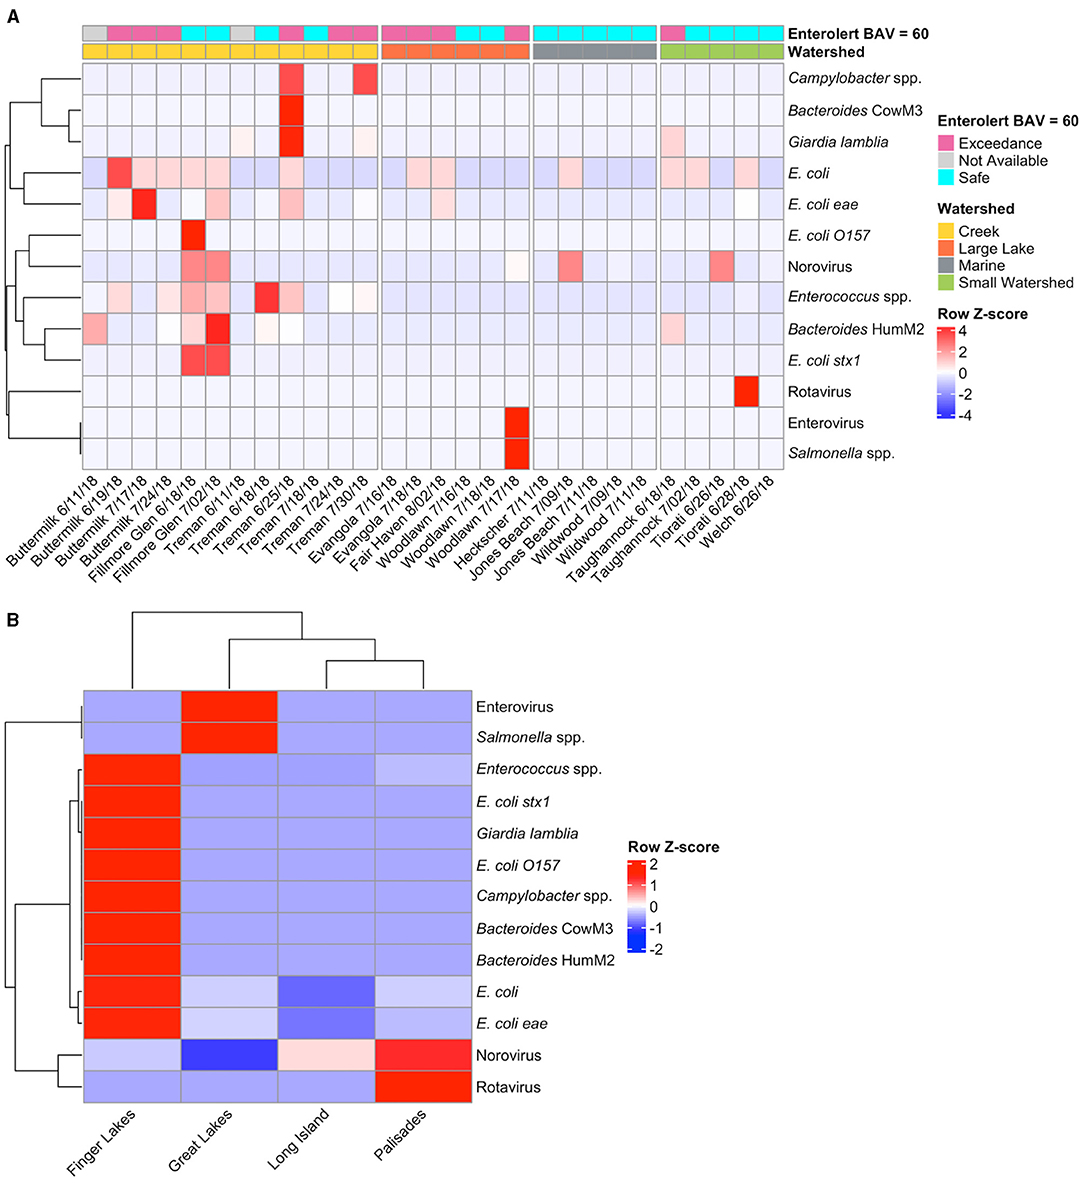
Figure 7. Heat map of Pathogen Panel OpenArray-detected pathogens in the 2018 New York State beach morning samples for (A) individual samples by site and date and (B) samples grouped by region. For each sample, the watershed type (i.e., Creek, Large Lake, Marine, or Small Watershed) and the Enterolert results are shown. Samples were marked as “Safe” if Enterolert results were below a BAV of 60 MPN per 100 ml; “Exceedance” if results exceeded this cutoff and the beach was closed; or “Not Available” if Enterolert results were unavailable at this site.
Samples from the intensive sampling campaign for two Buttermilk, Welch, Heckscher, and all Woodlawn intensive samples were also examined using the Pathogen Panel and only seven pathogens were found across the sites (Supplementary Figure 7). All of the intensive sites captured a rain event, but a spike in pathogen concentrations was only seen at Woodlawn following an overnight rain. At Buttermilk, pathogen levels stayed elevated during an ongoing light morning rain event (Supplementary Figure 7). Pathogens were detected at both Heckscher (enterovirus and Campylobacter spp.) and Welch (Bacteroides HumM2) 2:00 p.m. samples but were not detected in the 8:00 a.m. samples on the same day (Welch) or the day after (Heckscher) with no rain event occurring during this time period. Correlations between detected pathogens and environmental conditions (i.e., turbidity, water temperature, rainfall over previous 24 h and rainfall over previous 4 d) were examined (Supplementary Figure 8). Strong positive correlations were found between Bacteroides CowM3 and Campylobacter spp. (r = 0.7) and Giardia lamblia (r = 0.73). Campylobacter spp. and Giardia lamblia (r = 0.75), and HumM2 with E. coli stx1 and Enterococcus spp. (r = 0.59 and 0.57, respectively).
In 2017, all of the qPCR methods performed similarly when compared to the culture-based Enterolert method. There were significant correlations of the Enterolert results with the EPA 1611.1-based assay (p = 0.00204) and all three Biomeme methods (two3-5 μl, p = 0.0159; two3-15 μl, p = 0.00046; BioPoo, p = 0.00292). The correlation was strongest for the two3-15 μl (r2 = 0.687) and the BioPoo assay (r2 = 0.645), followed by EPA 1611.1-based assay (r2 = 0.594) and the two3-5 μl (r2 = 0.537). Although the qPCR results correlated well overall with the Enterolert data, they had variable performance for correctly predicting BAV exceedances (ranging from 68.8 to 81.3% and 62.5 to 75.0% correct classifications for BAVs of 60 and 104 culturable FIB per 100 ml, respectively). Occurrences of false negatives were higher (12.5 to 18.8% and 12.5 to 25% for BAVs of 60 and 104 MPN per 100 ml, respectively) than false positives (0 to 18.8% and 6.3 to 18.8% for BAVs of 60 and 104 MPN per 100 ml, respectively). Based on these results, adopting any of the qPCR methods as the standard for beach monitoring could increase the potential of swimmer pathogen exposure as we saw in some cases, the qPCR methods would have resulted in a beach opening while the culture-based method would have led to a beach closure. Noble et al. (2010) also found qPCR-based methods underestimated Enterococcus spp. and E. coli concentrations in recreational waters, possibly due to inhibition of the qPCR assays (Noble et al., 2010). On the other hand, qPCR false positives indicate an overestimation of FIBs and studies have likewise shown that qPCR-based methods can overestimate FIB abundance (Lavender and Kinzelman, 2009; Raith et al., 2014). The mixed incidence of both false negatives and false positives in our dataset suggests that qPCR methods may require individualized, assay-specific BAVs based on site-specific studies. The EPA has suggested a qPCR BAV of 640 CCE per 100 ml for the EPA 1611.1 method, however the Biomeme methods currently lack recommended BAVs (US EPA, 2015).
Neither the two3 methods nor the EPA 1611.1-based method used in this study included a sample processing control, thus, we were unable to assess DNA extraction efficiency in these samples. The BioPoo method did include an IPC which informed our sample dilution to reduce or eliminate IPC inhibition and, presumably, tuf assay inhibition. The BioPoo assay had the highest correct BAV classification of all the methods (81.3 and 68.8% for BAVs of 60 and 104 MPN per 100 ml, respectively). Interestingly, the BioPoo method targets a different gene, i.e., the tuf gene, than the two3 and EPA 1611.1 primers and probe, which target the 23S rRNA gene of Enterococcus. The BioPoo assay showed the lowest intercept (0.657) when compared to the Enterolert method out of all the qPCR methods (ranging from 1.99 to 2.44 for the two3 methods and up to 3.07 for the EPA-based method), suggesting the use of the tuf gene could lower the background signal compared to the 23S rRNA gene. Biomeme's research team selected assays with the design objective of reducing the range of the background signal and increasing resolution of results. However, this specificity comes with a cost with respect to sensitivity; the BioPoo assay was more likely than the other qPCR methods to give a false negative, underscoring the importance of creating a different BAV for each qPCR chemistry.
All of the Biomeme methods correlated significantly (p < 0.05 for all) with the EPA 1611.1-based method in 2017 (Figure 5). This relationship was partly driven by differences in FIB concentrations between the two sites. While Treman had relatively low culturable enterococci (average of 24.5 ± 19.4 MPN per 100 ml) Buttermilk had much higher levels (average of 184 ± 182 MPN per 100 ml) which strengthened the correlation between qPCR methods and between qPCR-based methods and Enterolert. The differences observed at these two sites is likely due to land use differences within their respectively watersheds. Buttermilk's watershed has more residential housing and agricultural land compared to Treman's watershed which has more forest cover and is more rural. These differences in land use result in less runoff originating from human-impacted areas in Treman's watershed compared to Buttermilk which could ultimately be reflected in the lower FIB counts observed in Treman's water samples as compared to Buttermilk's.
In summer of 2018, we expanded the monitoring sites from two local, freshwater beaches to 12 beaches across New York State, including nine freshwater and three marine beaches, from four geographic areas (i.e., Great Lakes, Finger Lakes, Palisades, and Long Island), and four watershed types (creek, small watershed, large lake, marine). The diversity of sampling sites likely led to weakening of the correlation between the EPA 1611.1-based assay and Enterolert results from 2017 (r2 = 0.59, Figure 4) to 2018 (r2 = 0.317, Figure 6A). When examining only the two sites studied in both years the correlation was still weaker in 2018 compared to 2017 (r2 = 0.208, Supplementary Figure 4). This variability in correlation may be due to seasonal differences. In summer 2018 the water quality monitoring spanned 8 weeks, during which beaches were in use and rainfall was recorded, while in fall 2017 monitoring spanned 4 weeks, during which the beaches were closed, and no rainfall was recorded. Haugland et al. (2021) found good correlation between qPCR and culture-based methods for quantification of E. coli among freshwater sites in recreational water across Michigan. Because of this we chose to group the 2018 data by beach type (freshwater vs. marine) and found there was an improvement in the correlation between the EPA 1611.1-based assay and Enterolert results for freshwater beaches (r2 = 0.408, p < 0.0001, Supplementary Figure 2D). In contrast, the marine beaches showed no significant correlation (p = 0.262, Supplementary Figure 2D). Differences including tides, salinity, and wrack could all impact the presence, concentration, and quantification of FIBs at marine beaches (Sinton et al., 2002; Boehm, 2007; Imamura et al., 2011; Byappanahalli et al., 2012). These results highlight the importance of creating site-specific correlations to account for the differing characteristics of freshwater and marine beaches, including salinity, which are known to influence FIB quantification (Sinton et al., 2002; Imamura et al., 2011; Byappanahalli et al., 2012).
Unlike in 2017, the Biomeme results of summer 2018 did not correlate with the culture-based (Figure 6A) or EPA-based qPCR (Figure 6B) methods. Even when examining results by beach location or beach type, there did not appear to be a correlation between the Franklin-IPC and Enterolert measurements (Supplementary Figures 2A,C). However, the two qPCR methods (i.e., Franklin-IPC and EPA 1611.1-based assay) showed a moderate, significant correlation when grouping by beach location but only for the Finger Lakes region (r2 = 0.273, p = 0.0105, Supplementary Figure 1). In general, the EPA 1611.1-based method appears to be more robust across different sites than the Franklin-IPC method, however, the Biomeme methods that showed strong correlations in fall of 2017 (i.e., C1, C2, and C3) were not tested in 2018. One of these methods, the BioPoo assay, may hold promise for future testing as it performed well in 2017, simultaneously targets HF183, and includes an IPC to test for inhibition. In this study, an IAC was used in the EPA 1611.1-based assay to assess inhibition in samples and results from the IAC analysis showed no amplification inhibition. However, an IAC cannot account for inefficiencies during DNA extraction. The EPA 1611.1 method prescribes the use of a sample processing control to address this and, additionally, recommends the use of a matrix spike to evaluate and correct for sample site variations. However, in this study we were only able to include the IAC analysis and not the prescribed sample processing control of matrix spikes in our EPA-based qPCR method. Including these additional analyses most likely would have resolved some of the site variability observed. Indeed, including both matrix spikes and sample processing controls may eliminate this issue, not only in the EPA-based assay but also the Biomeme assays.
We examined the impact of rain events, turbidity, and water temperature on the measured FIB concentrations and found rainfall to correlate moderately positively with Enterolert (r = 0.59 for previous 24 h rainfall); whereas only one of the qPCR methods, the EPA 1611.1-based assay, correlated with rainfall (r = 0.37 and −0.09 for EPA 1611.1-based and Franklin-IPC methods, respectively). Lavender and Kinzelman (2009) found that non-consensus between culture- and qPCR-based methods was associated with rainfall among other environmental conditions, thus it is possible that rainfall inhibited one or both of our qPCR measurements.
Indeed, it is likely the Franklin-IPC measurements were inhibited despite the use of sample dilution and IPC analysis. Differential amplification responses to inhibitors commonly found in environmental samples, including humic acids, have previously been described (Huggett et al., 2008; Green and Field, 2012). Green and Field (2012) found qPCR inhibition sensitivity to be assay dependent when comparing HF183 and E. coli amplification in the same sample and suggested it may be due to differing assay sensitivities to humic acids. Cao et al. (2012) suggested current internal control methods to assess Enterococcus inhibition are ineffective and should not be relied upon to determine enterococci inhibition. They recommended using dilutions and robust qPCR chemistries (i.e., those designed for environmental samples) to overcome sample inhibition, instead of relying on internal control assessments. Huggett et al. (2008) found inhibition variability between control and target reactions in which the control showed no inhibition, yet the target was inhibited. Thus, even though we were able to account for IPC inhibition in the Franklin-IPC method it is possible the Enterococcus assay itself was still inhibited, due to differences in assay sensitivities (Huggett et al., 2008; Green and Field, 2012). Huggett et al. (2008) suggest that internal controls should be assessed with their targets to ensure similar sensitivities to inhibitors likely to be present in a given sample. Future testing for the Franklin-IPC method should include some analysis of target and control inhibition as well as analysis of the chemistry's robustness to different environmental samples.
There are many challenges to the implementation of any new technology and/or assay for water quality monitoring. In our study we found some inconsistencies in the correlation between qPCR-based and culture-based methods for FIB quantification across a range of diverse sites. Kinzelman et al. (2011) found there were varying degrees of correlation between the culture- and qPCR-based methods for FIB quantification depending on site (i.e., geographic location), water type (marine vs. fresh), as well as qPCR inhibition, and differences in viable vs. non-viable cells. Additionally, environmental conditions such as recent rainfall and flow rate can impact the background DNA levels (e.g., fragmented DNA or dead cells) and we found greater discrepancies between culture and qPCR methods in 2018 as compared to 2017, possibly due to the multiple rain events recorded in 2018 (Lavender and Kinzelman, 2009). Sunlight is also known to play a role in modulating E. coli and enterococci concentrations, however photoinactivation of these organisms is not well-understood under varying environmental conditions and we did not measure irradiance in our study (Boehm et al., 2009).
The correlation between culture-based and qPCR-based methods was not expected to be 1-to-1 at any given site. qPCR-based methods do not discriminate between live and dead cells in a sample while culture-based methods exclusively quantify viable/culturable cells. However, previous studies have shown strong correlations between culture- and qPCR-based methods (Schang et al., 2016; Haugland et al., 2021). Thus, even though these methods may not necessarily result in the same absolute values for FIB quantification, a strong correlation between the two measurements suggest there is potential for qPCR methods to be used in place of culture-based methods for beach closure and reopening determinations.
Our study included many different sites with unique characteristics, and we were not able to create a universal correlation curve between any qPCR method and Enterolert that would work for all sites. Thus, site-specific studies would need to be completed before the implementation of any new qPCR method. In fact, the EPA recommends that any qPCR method, including EPA 1611.1, be evaluated on a site-specific basis, mainly to assess the extent and frequency of PCR inhibition at the site (US EPA, 2012). As suggested by Ferretti et al. (2013) sampling locations need to be analyzed to determine if inhibition is an issue as well as to measure the variability of qPCR results on a spatial and temporal basis. Future studies of qPCR-based methods, including the rapid in-field Biomeme method, would benefit from extensively studying a few sites rather than studying a number of sites with diverse characteristics as well-including both sample processing controls (to assess DNA extraction variability) and matrix spikes (to assess site differences). Interestingly, Lavender and Kinzelman (2009), successfully applied site-specific corrections to increase correlations between qPCR and culture-based methods. Applying these site-specific correction factors to established correlation curves may be a promising solution to this issue.
For future testing of the Biomeme system, more locations across New York State, including marine beaches, would need to be studied. Additionally, more frequent sampling at each location, as well as method evaluation under different environmental conditions (e.g., rain) would need to be completed. This would allow for a better understanding of the overall performance of the Biomeme system and its applicability for NYS beach safety monitoring in the future. The creation of site-specific correlation curves between qPCR and culture-based FIB measurements would require the commitment and training of staff at each beach site to conduct these studies. Although time-consuming, implementation of qPCR methods necessitates the creation of robust, site-specific correlation curves which, once established, would result in the ability to rapidly test water (under 4 h) using the Biomeme system allowing for more timely closing and reopening of beaches. Of the Biomeme methods tested, the BioPoo assay holds the most promise because of its ability to be deployed on-site, the inclusion of an internal positive control (for inhibition assessment), and quick turnaround time for results. The results of this study suggest there is promise for qPCR-based methods for FIB monitoring, including the rapid, on-site methods tested herein. However, it is essential that future testing of qPCR-based methods rigorously examine site variations before they are employed. It cannot be overstated, that a method which can successfully quantify FIB (from filtration to DNA extraction and quantification) on-site would lead to safer swimming conditions. The ability to test samples without the delay caused by travel times to a lab as well as the ease-of-use of a method such as Biomeme, make more frequent water testing feasible and could eliminate the need for highly technical personnel to conduct testing.
The Pathogen Panel used in this study was previously tested on water samples taken from the Hudson River watershed (Brooks et al., 2020). Here we used the panel to analyze a subset of samples from the 12 New York State beaches examined in summer 2018. We aimed to test the robustness of the panel on a wide range of sample locations which included a minimum of one sample per location, different water types (i.e., marine and freshwater), and rain events. Of the 12 viral, bacterial and protozoal pathogens monitored via the Pathogen Panel only three showed up with any substantial frequency: E. coli eae (25% of samples), norovirus (31.4%), and Giardia lamblia (11.4%), with others (including Campylobacter spp., E. coli O157, E. coli stx1, enterovirus, rotavirus, and Salmonella spp.) present in < 6% of the 35 samples. Three pathogens were not detected in any sample: Shigella spp., adenovirus, and hepatitis A.
Fillmore Glen had a surprisingly high Pathogen Panel gene count for the FIB, Enterococcus spp., (average 7,733 ± 1,283 23S rRNA genes per 100 ml) given the low Enterolert FIB counts (average of 9.25 ± 4.17 culturable enterococci per 100 ml). This suggests that there may be a significant source of FIB upstream of the swimming area, but that most of the intact FIB are not culturable. The human-specific FIB marker, HumM2, was also detected in these samples as were pathogenic E. coli (strains stx1 and eae). The Pathogen Panel cannot distinguish between viable and dead or deactivated cells; thus, the high signal could be due to an upstream wastewater treatment facility that is inactivating, but not effectively removing the pathogens. In addition to Fillmore Glen, HumM2 was found at two other beaches, Buttermilk and Treman, on multiple dates, as well as Taughannock and Welch on one date each (HumM2 was found in 9 of the 35 samples). However, no sample had HumM2 levels above the median concentrations resulting in 30 GI illnesses per 1,000 swimmers (2,800 gene copies per 100 ml), suggesting any potential wastewater contamination is minimal (Boehm et al., 2015). Interestingly, we found weak to moderate positive correlations between the culture-based measurements (Enterolert and Colilert) and some pathogens, including Giardia lamblia and Salmonella spp. (Supplementary Figure 8). However other pathogens and MST markers, such as HumM2, showed no or negative correlations with the culture-based methods. These results indicate that the current water monitoring methods which measure enterococci and E. coli may not be indicative of pathogen presence (and human health risk) as previously suggested by Wu et al. (2011).
At the intensive sampling sites there were changes in the pathogen profile over time (Supplementary Figure 7). This is consistent with previous studies showing concentrations of FIB and pathogens can change within hours (Kim et al., 2009; Converse et al., 2012a; Desai and Rifai, 2013; Dorevitch et al., 2017). A study by Kim et al. (2009) found combined sewer overflow systems showed different diurnal patterns for FIB and pathogens (including noroviruses and enteroviruses), where FIB typically peak in the morning and remain relatively stable through the afternoon before decreasing overnight, whereas pathogens showed more variability. Here, changes in pathogen concentrations were observed over the course of a day at the Woodlawn site. Most notably, concentrations changed between the morning and afternoon samples, which also followed an overnight rain event, potentially amplifying diurnal changes in FIB and pathogen concentrations (Supplementary Figures 5, 7). There was a spike in Enterococcus spp., norovirus, and enterovirus in the first sample following the rain event, whereas later in the day E. coli eae and Campylobacter spp. were detected. If the beach sites in this study are impacted by combined sewer overflows, wastewater treatment plant outfalls, or onsite wastewater treatment systems such as septic systems, diurnal FIB and pathogen patterns could be expected.
The poultry-associated MST marker (Brevibacterium spp. LA35 16S rRNA) was never detected, consistent with a lack of poultry farms around the study beaches. However, the lack of detection of this MST marker does not necessarily suggest poultry are not contributing to water quality issues. As stated in Brooks et al. (2020), the large amplicon size for the poultry associated MST marker (571 bp) may have impacted the detection of this marker. Previous studies have found that the presence of waterfowl significantly negatively impacts water quality and is associated with increased detection of E. coli, Enterococcus spp., and potential human pathogens (human-specific Bacteroides HF183 and Campylobacter spp.) (Hansen et al., 2011; Converse et al., 2012b); however due to the lack of poultry MST marker detection in our study we were unable to find any similar correlation at the NYS beaches. The cow MST marker was only found at one beach on one date (Treman 6/25). This was a date preemptively closed for heavy rain (>17 mm) and showed the presence of other pathogens including Giardia lamblia. The infrequent detection of Bacteroides CowM3 suggests cow feces did not have a major impact on beach water quality at these parks.
The Pathogen Panel positive control, MS2 virus, was only detected in 20% of water samples and was below detection in all other samples. Because the qPCR cycle threshold values for the MS2 virus were large, it is possible that even a small amount of partial inhibition could result in a non-detect of the MS2 target. Huggett et al. (2008) suggested that inhibition compatibility, between controls and targets, is especially important for qPCR array methods which use one control for myriad targets that may have differential inhibitor responses. Although we were able to detect pathogens at low levels in our samples even when MS2 was not detected, there still appeared to be some partial inhibition in samples which could lead to an underestimation of actual target levels. Future ns-qPCR array-based methods with multiple targets should consider the use of several positive controls exhibiting inhibition responses similar to the different target genes.
In general, the Finger Lakes sites had the highest pathogen detection of any of the regions, with Long Island having the least (Figure 7B). This may be due in part to capturing more rain events in the Finger Lakes region than any other region (average rainfall of 8.7 mm over 24 h period prior to sampling and 51.6% of samples capturing a rain event, Supplementary Table 1). There were fewer pathogens detected at marine sites as compared to freshwater sites, and any pathogen detected in marine samples was also detected in freshwater samples (Supplementary Figure 6). Previous studies have found differential decay of the HF183 marker between marine and freshwater samples and although this marker was not included in our Pathogen Panel it does suggest that pathogen marker concentrations can vary substantially by beach type (Shanks et al., 2006; Green et al., 2011). Nine of the 35 samples run on the Pathogen Panel had no detection of any pathogens. This included one Evangola State Park sample which had confirmed good water quality, the MS2 control was positive for both sampling dates while all other targets were negative for the first sample date and had only E. coli present on the second date.
The qPCR method based on EPA 1611.1 in this study yielded E. faecalis quantities that correlated positively with culture-based values in both years, while Biomeme methods showed strong correlations in 2017 and mixed results in 2018. The BioPoo assay (Method C3) had the highest agreement with the Enterolert method on exceedance of the 60 MPN per 100 ml BAV (81.3% agreement of the samples) but also had one of the higher false negative rates (18.8%). The BioPoo assay had the lowest background signal of the qPCR methods tested, demonstrating its potential for beach monitoring, but would require a site-specific correlation curve to avoid the incidences of false negatives.
In 2018, the Biomeme Franklin-IPC results did not correlate with Enterolert results, however they did moderately correlate with the EPA-based qPCR results when considering only the Finger Lakes region (r2 = 0.273, p = 0.0105), indicating site-specific correlation curves are particularly important for this assay. The EPA 1611.1-based assay results correlated weakly with the Enterolert results, suggesting this method is more robust to site differences (r2 = 0.317, p = 0.00012), however this relationship may be improved by the use of a sample processing control and a matrix spike analysis for each site. The Pathogen Panel successfully detected low levels of MST and pathogen markers across a broad range of sites in 2018. Results revealed Finger Lakes creek beaches had greater pathogen detection than other regions while marine beaches had the lowest pathogen detection. A quarter of the samples showed no FIB or pathogens detected with the Pathogen Panel; however, it is possible there was inhibition in some samples.
Of the Biomeme methods tested, the BioPoo assay holds promise for rapid on-site testing due to its ease-of use and the ability to assess qPCR inhibition using the internal positive control. Additionally, it can measure HF183 which could help inform beach sites of potential human fecal contamination. However, prior to implementation of any qPCR-based methods for FIB monitoring it is critical to assess inhibition of qPCR runs to avoid false negatives. Further testing to assess qPCR inhibition of sample controls and sample targets is needed to ensure similar inhibition responses in any qPCR assay for FIB monitoring. Beach-specific correlations must also be established between qPCR and culture-based assays. More testing is needed to evaluate the robustness of the Biomeme workflow for rapid, on-site monitoring of FIB.
The original contributions presented in the study are included in the article/Supplementary Material, further inquiries can be directed to the corresponding author.
CF-B, RR, CS, and YB conceived and designed the experiments. CF-B, ZS, NB, DS, and JB performed the experiments. CF-B, CS, DW, and RR analyzed the data. CF-B wrote the initial manuscript. All authors approved the manuscript for publication.
Funding for this work was provided by Cornell's Atkinson Center for a Sustainable Future (ACSF) via the Academic Venture Fund and the Department of the Interior's US Geological Survey administered through the New York State Water Resources Institute.
The authors declare that the research was conducted in the absence of any commercial or financial relationships that could be construed as a potential conflict of interest.
All claims expressed in this article are solely those of the authors and do not necessarily represent those of their affiliated organizations, or those of the publisher, the editors and the reviewers. Any product that may be evaluated in this article, or claim that may be made by its manufacturer, is not guaranteed or endorsed by the publisher.
We thank the NYS Office of Parks, Recreation & Historic Preservation for access to samples from swimming areas at state beaches. We would also like to thank Susan Foster who ran the internal amplification control in our samples. We would like to acknowledge Cornell's Atkinson Center for a Sustainable Future (ACSF) for funding via its Academic Venture Fund, the Department of the Interior's US Geological Survey administered through the New York State Water Resources Institute. These funding agencies neither directed research nor reviewed this article.
The Supplementary Material for this article can be found online at: https://www.frontiersin.org/articles/10.3389/frwa.2021.711477/full#supplementary-material
Bae, S., and Wuertz, S. (2012). Survival of host-associated bacteroidales cells and their relationship with Enterococcus spp., Campylobacter jejuni, Salmonella enterica, Serovar Typhimurium, and Adenovirus in freshwater microcosms as measured by Propidium Monoazide-Quantitative PCR. Appl. Environ. Microbiol. 78, 922–932. doi: 10.1128/AEM.05157-11
Bernardes, C., Bernardes, R., Zimmer, C., and Dorea, C. C. (2020). A simple off-grid incubator for microbiological water quality analysis. Water 12:240. doi: 10.3390/w12010240
Boehm, A. B. (2007). Enterococci concentrations in diverse coastal environments exhibit extreme variability. Environ. Sci. Technol. 41, 8227–8232. doi: 10.1021/es071807v
Boehm, A. B., Soller, J. A., and Shanks, O. C. (2015). Human-associated fecal quantitative polymerase chain reaction measurements and simulated risk of gastrointestinal illness in recreational waters contaminated with raw sewage. Environ. Sci. Technol. Lett. 2, 270–275. doi: 10.1021/acs.estlett.5b00219
Boehm, A. B., Yamahara, K. M., Love, D. C., Peterson, B. M., McNeill, K., and Nelson, K. L. (2009). Covariation and photoinactivation of traditional and novel indicator organisms and human viruses at a sewage-impacted marine beach. Environ. Sci. Technol. 43, 8046–8052. doi: 10.1021/es9015124
Bramburger, A. J., Brown, R. S., Haley, J., and Ridal, J. J. (2015). A new, automated rapid fluorometric method for the detection of Escherichia coli in recreational waters. J. Great Lakes Res. 41, 298–302. doi: 10.1016/j.jglr.2014.12.008
Brooks, Y. M., Collins, S. M., Mbullo, P., Baoteng, G. O., Young, S. L., and Richardson, S. L. (2017). Evaluating human sensory perceptions and the compartment bag test assays as proxies for the presence and concentration of Escherichia coli in drinking water in Western Kenya. Am. J. Trop. Med. Hyg. 97, 1005–1008. doi: 10.4269/ajtmh.16-0878
Brooks, Y. M., Spirito, C. M., Bae, J. S., Hong, A., Mosier, E. M., Sausele, D. J., et al. (2020). Fecal indicator bacteria, fecal source tracking markers, and pathogens detected in two Hudson River tributaries. Water Res. 71:115342. doi: 10.1016/j.watres.2019.115342
Byappanahalli, M. N., Nevers, M. B., Korajkic, A., Staley, Z. R., and Harwood, V. J. (2012). Enterococci in the environment. Microbiol. Mol. Biol. Rev. 76, 685–706. doi: 10.1128/MMBR.00023-12
Byappanahalli, M. N., Nevers, M. B., Shively, D. A., Spoljaric, A., and Otto, C. (2018). Real-time water quality monitoring at a Great Lakes National Park. J. Environ. Qual. 47, 1086–1093. doi: 10.2134/jeq2017.11.0462
Cao, Y., Griffith, J. F., Dorevitch, S., and Weisberg, S. B. (2012). Effectiveness of qPCR permutations, internal controls and dilution as means for minimizing the impact of inhibition while measuring Enterococcus in environmental waters. J. Appl. Microbiol. 113, 66–75. doi: 10.1111/j.1365-2672.2012.05305.x
Chern, E. C., Siefring, S., Paar, J., Doolittle, M., and Haugland, R. A. (2011). Comparison of quantitative PCR assays for Escherichia coli targeting ribosomal RNA and single copy genes: qPCR assays for E. coli targeting rRNA and single copy genes. Lett. Appl. Microbiol. 52, 298–306. doi: 10.1111/j.1472-765X.2010.03001.x
Converse, R. R., Griffith, J. F., Noble, R. T., Haugland, R. A., Schiff, K. C., and Weisberg, S. B. (2012a). Correlation between quantitative PCR and culture-based methods for measuring Enterococcus spp. over various temporal scales at three California marine beaches. Appl. Environ. Microbiol. 78, 1237–1242. doi: 10.1128/AEM.07136-11
Converse, R. R., Kinzelman, J. L., Sams, E. A., Hudgens, E., Dufour, A. P., Ryu, H., et al. (2012b). Dramatic improvements in beach water quality following gull removal. Environ. Sci. Technol. 46, 10206–10213. doi: 10.1021/es302306b
Desai, A. M., and Rifai, H. S. (2013). Escherichia coli concentrations in urban watersheds exhibit diurnal sag: implications for water-quality monitoring and assessment. J. Am. Water Resour. Assoc. 49, 766–779. doi: 10.1111/jawr.12039
Dorevitch, S., Shrestha, A., DeFlorio-Barker, S., Breitenbach, C., and Heimler, I. (2017). Monitoring urban beaches with qPCR vs. culture measures of fecal indicator bacteria: implications for public notification. Environ. Health 16:45. doi: 10.1186/s12940-017-0256-y
Dreier, J., Störmer, M., and Kleesiek, K. (2005). Use of bacteriophage MS2 as an internal control in viral reverse transcription-PCR assays. J. Clin. Microbiol. 43, 4551–4557. doi: 10.1128/JCM.43.9.4551-4557.2005
Ferretti, J. A., Tran, H. V., Peterson, S. J., and Loftin, V. (2013). Rapid method demonstration project at four New Jersey marine beaches using real time quantitative Polymerase Chain Reaction (qPCR). Mar. Pollut. Bull. 71, 51–63. doi: 10.1016/j.marpolbul.2013.03.038
Frahm, E., and Obst, U. (2003). Application of the fluorogenic probe technique (TaqMan PCR) to the detection of Enterococcus spp. and Escherichia coli in water samples. J. Microbiol. Methods 52, 123–131. doi: 10.1016/S0167-7012(02)00150-1
Goodman, L. B., Anderson, R. R., Slater, M., Ortenberg, E., Renshaw, R. W., Chilson, B. D., et al. (2016). High-throughput detection of respiratory pathogens in animal specimens by nanoscale PCR. J. Vis. Exp. 117:e54781. doi: 10.3791/54781
Green, H. C., and Field, K. G. (2012). Sensitive detection of sample interference in environmental qPCR. Water Res. 46, 3251–3260. doi: 10.1016/j.watres.2012.03.041
Green, H. C., Shanks, O. C., Sivaganesan, M., Haugland, R. A., and Field, K. G. (2011). Differential decay of human faecal Bacteroides in marine and freshwater. Environ. Microbiol. 13, 3235–3249. doi: 10.1111/j.1462-2920.2011.02549.x
Griffith, J. F., and Weisberg, S. B. (2011). Challenges in implementing new technology for beach water quality monitoring: lessons from a California demonstration project. Mar. Technol. Soc. J. 45, 65–73. doi: 10.4031/MTSJ.45.2.13
Hansen, D. L., Ishii, S., Sadowsky, M. J., and Hicks, R. E. (2011). Waterfowl abundance does not predict the dominant avian source of beach Escherichia coli. J. Environ. Qual. 40, 1924–1931. doi: 10.2134/jeq2011.0111
Harwood, V. J., Staley, C., Badgley, B. D., Borges, K., and Korajkic, A. (2014). Microbial source tracking markers for detection of fecal contamination in environmental waters: relationships between pathogens and human health outcomes. FEMS Microbiol. Rev. 38:1–40 doi: 10.1111/1574-6976.12031
Haugland, R., Oshima, K., Sivaganesan, M., Dufour, A., Varma, M., Seifring, S., et al. (2021). Large-scale comparison of E. coli levels determined by culture and a qPCR method (EPA Draft Method C) in Michigan towards the implementation of rapid, multi-site beach testing. J. Microbiol. Methods 184:106186. doi: 10.1016/j.mimet.2021.106186
Huggett, J. F., Novak, T., Garson, J. A., Green, C., Morris-Jones, S. D., Miller, R. F., et al. (2008). Differential susceptibility of PCR reactions to inhibitors: an important and unrecognised phenomenon. BMC Res. Notes 1, 1–9. doi: 10.1186/1756-0500-1-70
Huijsdens, X. W., Linskens, R. K., Mak, M., Meuwissen, S. G. M., Vandenbroucke-Grauls, C. M. J. E., and Savelkoul, P. H. M. (2002). Quantification of bacteria adherent to gastrointestinal mucosa by real-time PCR. J. Clin. Microbiol. 40, 4423–4427. doi: 10.1128/JCM.40.12.4423-4427.2002
Imamura, G. J., Thompson, R. S., Boehm, A. B., and Jay, J. A. (2011). Wrack promotes the persistence of fecal indicator bacteria in marine sands and seawater. FEMS Microbiol. Ecol. 77, 40–49. doi: 10.1111/j.1574-6941.2011.01082.x
Kim, W. J., Managaki, S., Furumai, H., and Nakajima, F. (2009). Diurnal fluctuation of indicator microorganisms and intestinal viruses in combined sewer system. Water Sci. Technol. 60, 2791–2801. doi: 10.2166/wst.2009.732
Kinzelman, J. L., Bushon, R. N., Dorevitch, S., and Noble, R. T. (2011). Comparative Evaluation of Molecular and Culture Methods for Fecal Indicator Bacteria for Use in Inland Recreational Waters. London: Water Intelligence Online. doi: 10.2166/9781843395454
Kolm, C., Martzy, R., Brunner, K., Mach, R. L., Krska, R., Heinze, G., et al. (2017). A complementary isothermal amplification method to the U.S. EPA quantitative polymerase chain reaction approach for the detection of enterococci in environmental waters. Environ. Sci. Technol. 51, 7028–7035. doi: 10.1021/acs.est.7b01074
Lavender, J. S., and Kinzelman, J. L. (2009). A cross comparison of qPCR to agar-based or defined substrate test methods for the determination of Escherichia coli and enterococci in municipal water quality monitoring programs. Water Res. 43, 4967–4979. doi: 10.1016/j.watres.2009.08.010
Mauk, M. G., Liu, C., Sadik, M., and Bau, H. H. (2015). “Microfluidic devices for Nucleic Acid (NA) isolation, isothermal NA amplification, and real-time detection,” in Mobile Health Technologies, eds A., Rasooly and K. E. Herold (New York, NY: Springer New York), 15–40. doi: 10.1007/978-1-4939-2172-0_2
Noble, R. T., Blackwood, A. D., Griffith, J. F., McGee, C. D., and Weisberg, S. B. (2010). Comparison of rapid quantitative PCR-based and conventional culture-based methods for enumeration of Enterococcus spp. and Escherichia coli in recreational waters. Appl. Environ. Microbiol. 76, 7437–7443. doi: 10.1128/AEM.00651-10
Polaczyk, A. L., Narayanan, J., Cromeans, T. L., Hahn, D., Roberts, J. M., Amburgey, J. E., et al. (2008). Ultrafiltration-based techniques for rapid and simultaneous concentration of multiple microbe classes from 100-L tap water samples. J. Microbiol. Methods 73, 92–99. doi: 10.1016/j.mimet.2008.02.014
R Core Team (2013). R: A Language and Environment for Statistical Computing. Vienna: R Foundation for Statistical Computing.
Raith, M. R., Ebentier, D. L., Cao, Y., Griffith, J. F., and Weisberg, S. B. (2014). Factors affecting the relationship between quantitative polymerase chain reaction (qPCR) and culture-based enumeration of Enterococcus in environmental waters. J. Appl. Microbiol. 116, 737–746. doi: 10.1111/jam.12383
Rhodes, E. R., Villegas, L. F., Shaw, N. J., Miller, C., and Villegas, E. N. (2012). A modified EPA method 1623 that uses tangential flow hollow-fiber ultrafiltration and heat dissociation steps to detect waterborne Cryptosporidium and Giardia spp. J. Vis. Exp. 65:e4177. doi: 10.3791/4177
Schang, C., Henry, R., Kolotelo, P. A., Prosser, T., Crosbie, N., Grant, T., et al. (2016). Evaluation of techniques for measuring microbial hazards in bathing waters: a comparative study. PLoS ONE 11:e0155848. doi: 10.1371/journal.pone.0155848
Sepulveda, A., Hutchins, P., Massengill, R., and Dunker, K. (2018). Tradeoffs of a portable, field-based environmental DNA platform for detecting invasive northern pike (Esox lucius) in Alaska. Manage. Biol. Invasions 9, 253–258. doi: 10.3391/mbi.2018.9.3.07
Shanks, O. C., Nietch, C., Simonich, M., Younger, M., Reynolds, D., and Field, K. G. (2006). Basin-wide analysis of the dynamics of fecal contamination and fecal source identification in Tillamook Bay, Oregon. Appl. Environ. Microbiol. 72, 5537–5546. doi: 10.1128/AEM.03059-05
Sinton, L. W., Hall, C. H., Lynch, P. A., and Davies-Colley, R. J. (2002). Sunlight inactivation of fecal indicator bacteria and bacteriophages from waste stabilization pond effluent in fresh and saline waters. Appl. Environ. Microbiol. 68, 1122–1131. doi: 10.1128/AEM.68.3.1122-1131.2002
US EPA (2013). Method 1609: Enterococci in Water by TaqMan® Quantitative Polymerase Chain Reaction (qPCR) with Internal Amplification Control (IAC) Assay. Washington, DC: Office of Water.
US EPA (2015). Method 1611: Enterococci in Water by TaqMan Quantitative Polymerase Chain Reaction (qPCR) Assay. Washington, DC: Office of Water.
US EPA (2019). Method 1696: Characterization of Human Fecal Pollution in Water by HF183/BacR287 TaqMan® Quantitative Polymerase Chain Reaction (qPCR) Assay. Washington, DC: Office of Water.
US EPA OW. (2012). “Microbial (Pathogen)/Recreational Water Quality Criteria.” Reports and Assessments. Washington, DC: US EPA. Available online at: https://www.epa.gov/wqc/microbial-pathogenrecreational-water-quality-criteria (accessed August 31, 2021).
Wang, A., McMahan, L., Rutstein, S., Sobsey, M. D., Stauber, C., and Reyes, J. (2017). household microbial water quality testing in a peruvian demographic and health survey: evaluation of the compartment bag test for Escherichia coli. Am. J. Trop. Med. Hyg. 96, 970–975. doi: 10.4269/ajtmh.15-0717
Wang, D., Yamahara, K. M., Cao, Y., and Boehm, A. B. (2016). Absolute quantification of enterococcal 23S rRNA gene using digital PCR. Environ. Sci. Technol. 50, 3399–3408. doi: 10.1021/acs.est.5b05747
Water Quality Monitoring (2004). Codes Rules and Regulations. New York, NY: Water Quality Monitoring.
Keywords: water quality monitoring, fecal indicator bacteria (FIB), nanoscale qPCR, pathogen abundance, enterococci, beach action value, qPCR (quantitative PCR), E. coli
Citation: Fernández-Baca CP, Spirito CM, Bae JS, Szegletes ZM, Barott N, Sausele DJ, Brooks YM, Weller DL and Richardson RE (2021) Rapid qPCR-Based Water Quality Monitoring in New York State Recreational Waters. Front. Water 3:711477. doi: 10.3389/frwa.2021.711477
Received: 18 May 2021; Accepted: 09 September 2021;
Published: 08 October 2021.
Edited by:
Constantinos V. Chrysikopoulos, Technical University of Crete, GreeceReviewed by:
Vasiliki Syngouna, University of Patras, GreeceCopyright © 2021 Fernández-Baca, Spirito, Bae, Szegletes, Barott, Sausele, Brooks, Weller and Richardson. This is an open-access article distributed under the terms of the Creative Commons Attribution License (CC BY). The use, distribution or reproduction in other forums is permitted, provided the original author(s) and the copyright owner(s) are credited and that the original publication in this journal is cited, in accordance with accepted academic practice. No use, distribution or reproduction is permitted which does not comply with these terms.
*Correspondence: Ruth E. Richardson, cmVyMjZAY29ybmVsbC5lZHU=
Disclaimer: All claims expressed in this article are solely those of the authors and do not necessarily represent those of their affiliated organizations, or those of the publisher, the editors and the reviewers. Any product that may be evaluated in this article or claim that may be made by its manufacturer is not guaranteed or endorsed by the publisher.
Research integrity at Frontiers
Learn more about the work of our research integrity team to safeguard the quality of each article we publish.