 Yolanda M. Brooks
 Joan B. Rose
- 1Department of Microbiology and Molecular Genetics, Michigan State University, East Lansing, MI, United States
- 2Department of Fisheries and Wildlife, Michigan State University, East Lansing, MI, United States
Water quality models use log-linear decay to estimate the inactivation of fecal indicator bacteria (FIB). The decay of molecular measurements of FIB does not follow a log-linear pattern. This study examined the factors associated with the persistence of Escherichia coli uidA, enterococci 23S rDNA, and Bacteroides thetataiotaomicron 1,6 alpha mannanase in microcosms containing 10% (vol/vol) sewage spiked river water stored at 4°C for up to 337 days. The study estimated the markers' persistence with log-linear models (LLMs) to the best-fit models, biphasic exponential decay (BI3) and log-logistic (JM2) and compared the estimates from the models. Concentrations of B. thetataiotaomicon decreased to levels below detection after 31 days in storage and were not fit to models. BI3 and JM2 were fit to E. coli and enterococci, respectively. LLMs had larger Bayesian information criterion values than best-fit models, indicating poor fit. LLMs over-estimated the time required for 90% reduction of the indicators (T90) and did not consider dynamic rates of decay. Time in storage and indicator species were associated with the persistence of the markers (p < 0.001). Using the T90 values of the best-fit models, enterococci was the most persistent indicator. Our data supports the use of best fit models with dynamic decay rates in water quality models to evaluate the decay of enteric markers.
Introduction
In the United States, environmental waters that are impaired or in danger of being impaired are assigned remediation plans aimed at restoring designated uses (United States, 2016). Forecasting the restoration of an impaired watershed is partially dependent on the development of water quality models that estimate the concentrations of fecal indicator bacteria (FIB), while simultaneously calculating the transport and fate (particularly the survival) in the aquatic ecosystem. Water quality models have been slow to adapt data generated from molecular measurements of FIB even as these measurements are finding use in rapid “swimmable” assessments. Compared to concentrations of culturable enterococci, measurements of enterococci 23S rDNA (Entero1) had a stronger correlation to gastrointestinal illness incidence of children visiting beaches near point sources of treated sewage at Lake Michigan, Michigan and Indiana; and Lake Erie, Ohio (Wade et al., 2008). Therefore, water quality models that incorporate molecular measurements of FIB could provide better resolution of the risk of waterborne illness.
Microbial source tracking (MST) with molecular methods can identify and quantify pollution associated with specific hosts in watersheds of impaired rivers (Ballesté et al., 2020; Brooks et al., 2020). Identification of host-associated pollution is important because different origins of pollution are suggested to pose varying risks of adverse health effects (Soller et al., 2010). Multiple studies have demonstrated that human-associated markers can be detected in various types of environmental waters (Reischer et al., 2007; Rusiñol et al., 2014; Ahmed et al., 2019). The concentrations of the markers can also be incorporated into water quality models to improve forecasting of an impaired watershed (Jeong et al., 2019). Such analysis could offer better assessment of pollution associated with higher risk to public health.
Two commonly used water quality models, HSPF, and SWAT, use log-linear models (LLMs) to calculate the survival of culturable FIB in aquatic environments (Johnson et al., 1984; Gassman et al., 2007). A meta-analysis determined that there are three general patterns of survival curves of culturable E. coli in water microcosms: biphasic log-linear, shouldering followed by log-linear decay, and log-linear (Blaustein et al., 2013). These studies suggest that persistence models could accommodate the dynamic decay of enteric markers.
There are few studies that have evaluated the persistence of FIB in water over longer timescales. A previous study determined that the time needed for the 90% reduction (T90) of culturable E. coli (EC) and enterococci (ENT) was > 60 days in microcosms containing sediment covered with freshwater spiked with sewage effluent and stored at 10°C (Pote et al., 2009). Further research of the long-term persistence of FIB would provide better forecasting power for water quality models.
In order to increase the accuracy and precision of water quality models, we describe the long term persistence (up to 337 days) of three enteric molecular markers, B. thetaiotaomicron 1,6 alpha-mannanase, enterococci 23S rDNA, and E. coli uidA, stored in microcosms of 10% (vol/vol) sewage spiked river water stored in the dark and at 4°C. Enterococci 23S rRNA was chosen because it is a standard method to evaluate fecal pollution in recreational waters (USEPA, 2015). E. coli uidA was chosen because the marker is species specific and the United States Environmental Protection Agency established criteria regarding the concentration of culturable E.coli in recreational waters (USEPA, 2012). B. thetaiotaomicron 1,6 alpha-mannanase was chosen to evaluate the persistence of human associated pollution. The temperature was chosen because it represented a conservative estimate of the persistence of enteric markers in many temparate freshwater lakes. Microcosms were stored in the dark during the duration of this study. Sunlight inactivation was not evaluated in this study because previous studies have demonstrated that freshwater microcosms containing either human or cattle sewage demonstrated no significant difference in the decay of molecular targets in the presence of sunlight compared to microcosms stored in the dark (Dick et al., 2010; Korajkic et al., 2019).
The specific objectives of this study were to:
1. Evaluate the mathematical relationships of experimental data of Escherichia coli uidA, enterococci 23S rRNA, and Bacteroides thetataiotaomicron alpha-mannanase measured from microcosms of 10% sewage spiked river water stored for up to 337 days at 4°C using log-linear and best-fit methods. Compare the mathematical relationships of the best-fit models to log-linear models. Compare the times required for 90% and 99% reductions of the initial concentrations of the markers using best-fit models and a corresponding log-linear model.
2. Evaluate the associations of time in storage, and indicator species to the observed persistence of the three markers.
Methods
Microcosm Set-Up
Water from the Red Cedar River (6 L) was autoclaved for 1 h in multiple 2 L plastic containers. After cooling to room temperature, the water was spiked with 10% (vol/vol) raw sewage from the East Lansing Wastewater Treatment and equally divided into 12 autoclaved 1 L Nalgene polypropylene bottles (ThermoFisher Scientific, Waltham, MA). Neither the river water nor the raw sewage were evaluated for the three genetic markers prior to the set-up of the microcosms. Each microcosm contained ~500 mL of liquid and no sediment. All microcosms were stored in the dark at 4°C.
Sample Processing and DNA Extraction
On each of the following days after seeding the raw sewage into the river water: 0, 31, 61, 93, 128, 155, 187, 219, 248, 279, 306, and 337, a microcosm was shaken 25 times (EPA-DNA, USEPA, 2015) and triplicate aliquots of 100 ml from one microcosm were membrane filtered onto three separate Nucleopore Track Etch polycarbonate membrane filters (0.45 μm pore size, 47 mm diameter, Whatman Inc., Piscataway, NJ). The three filters per sampling day represented technical replicates. DNA extraction from all samples was performed using USEPA Method 1611.1 (EPA-DNA, USEPA, 2015). Specifically, three filters were used to concentrate cells within each time point. At each time point, a filtration negative of autoclaved phosphate buffer saline accompanied the filtration of the samples. The extraction method in USEPA Method 1611.1 mechanically shears the cells. The first step is 1 min of bead beating of the filters at max speed in 600 μL DNA extraction buffer with 0.3 mm glass beads. Two centrifugation steps were completed to separate glass beads and other cell debris from the 350 μL-supernatant containing the DNA. The supernatants were diluted 1:5 in AE buffer and were stored at −80°C.
qPCR Quantification of Three Indicators of Fecal Pollution
The primers, probes, amplified sequence length, and qPCR protocols for Bacteroides thetataiotaomicron alpha mannanase (BT-am), Escherichia coli uidA (EC-uidA), and Enterococcus spp. 23S rDNA (ENT-23) are described in Table 1. The qPCR reagents of the ENT-23, EC-uidA and BT-am were: 10 μl of LightCycler 480 Probes 25 MasterMix (Roche, Indianapolis, IN), 0.5 μM of forward and reverse primers (0.3 μM of BT-am forward and reverse primer concentration), 0.2 μM of the probe (0.1 μM BT-am probe), 2 mg/ml bovine serum album (BSA), 1 mM of MgCl2 (EC-uidA only), 5 μl of DNA sample, and enough nuclease free water added to equal a 20 μl reaction volume. The following components were analyzed in each qPCR assay: three wells of a dilution step from the standard curve such as the 106 or 107 copies/rxn for ENT, 105 or 107 copies/rxn for EC, and or 103 or 104 copies/rxn for BT, a well containing nuclease free water, and duplicates of method blanks for each storage timepoint (DNA extracts of sterile phosphate buffer saline membrane filtered at each time point). Each DNA extract from the experiment was run in duplicate to represent analytical replicates. The analytical replicates were averaged to represent each technical replicate. Information regarding the performance of the standards curves, including the theoretical limit of detection, limit of quantification, and efficiency of the standard curve are included in Supplementary Table 1.
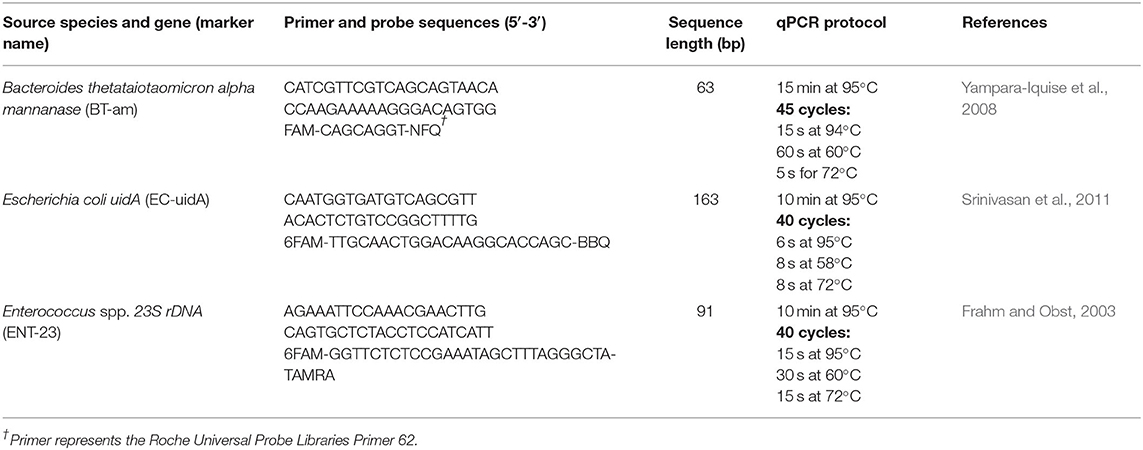
Table 1. Details of the qPCR assays (primers, probes, amplified sequence length, and qPCR protocols) of the genetic markers, enterococci 23S rDNA (ENT-23), Escherichia coli uidA (EC-uidA), and Bacteroides thetataiotaomicron alpha mannanase (BT-am).
Quantification was established with a standard curve. Overnight cultures of Enterococcus faecalis ATCC strain 19433 and E. coli ATCC strain 15597 were made, and genomic DNA was extracted using Qiamp DNA Mini Kit (Qiagen Inc, Valencia, CA). The qPCR measurements were reported as cellular equivalents (CE) of BT, ENT, or EC per 100 ml-water sample to compare the data to survival curves of culturable FIB in previous studies. All DNA extracts were diluted 1:5 before addition to the qPCR reagents to decrease the chances of inhibition, which also decreased the lowest detected concentration of BT, EC, and ENT to 2.68 * 102, 1.30 * 105, and 1.38 * 103 CE/100 ml-water sample, respectively. Genomic DNA was quantified of B. thetataiotaomicron (ATCC, 29148) with NanoDrop 1000 (ThermoFisher Scientific, Waltam, MA) to obtain copy number per rxn. Subsequently, 1:10 serial dilutions with dilution steps of the genomic DNA of the three indicators were made. The dilution steps spanned from 100 to 107 copies/rxn. One standard curve was used for both qPCR runs and contained triplicates of each dilution step. For all standard curves, the R2 was > 0.96. qPCR inhibition (defined as technical duplicates differing by > 3.32 Ct) was not noted in the experiment.
Persistence Modeling and Statistical Analysis
The statistical and modeling analyses considered all data points, including technical replicates that measured ENT, EC, and BT (statistical analysis only). The persistence of BT was not evaluated using a best fit model, or log-linear model because there were only three timepoints that were above the detection limit (Figure 1A). In the EC dataset, non-detects were evaluated at the detection limit in the persistence modeling and statistical analyses, as previously advised (USEPA, 1991). Model selection and shape of best-fit models of EC were affected by non-detect samples that occurred at t = 219 and 248 days (Figure 1C).
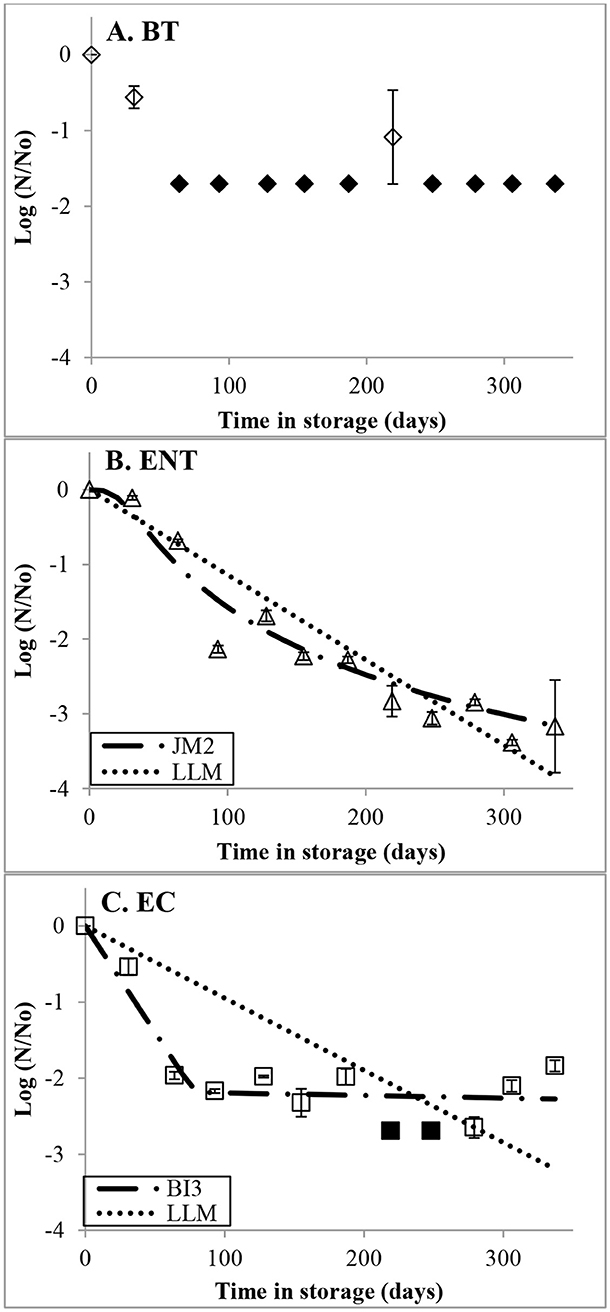
Figure 1. The relative persistence of (A) Bacteroides thetaotiaomicron, BT; (B) enterococci, ENT; and (C) Escherichia coli, EC measured from microcosms containing sewage spike river water stored at 4°C for up to 337 days. Filled in data points illustrate the data that were below the detection limit and represent the indicator specific detection limit. Each data point represents the average relative persistence of three technical replicates. The error bars represent one standard error. The lines represent the following models: log-linear (LLM), biphasic log-linear (BI3), or log-logistic models (JM2).
The average CE concentrations of each indicator were transformed to the relative persistence of the original concentration, N/N0, where N was the average concentration of the indicator from three technical replicates (CE/100 ml-sample) after t days in storage, and N0 was the average concentration of the indicator from three technical replicates at initial sampling (t = 0). A model fitting tool in R (R Development Core Team, 2013) provided by Drs. Kyle Enger and Jade Mitchell used maximum likelihood estimations to evaluate 17 linear and non-linear models (qmra.canr.msu.edu) to the data. The best-fit model with the lowest value of the Bayesian information criterion (BIC) was chosen to represent the persistence of the indicators. If the BIC value of biphasic log-linear model (BI3) was ≤ 2 units from the smallest BIC value, then BI3 was chosen; as ≤ 2 units difference are considered equivalent (Bolker, 2008). These two best-fit models evaluated the indicators: biphasic log linear model, BI3 (Carret et al., 1991); and log-logistic model, JM2 (Juneja et al., 2003). The model fitting tool also evaluated the persistence of the indicators using the log-linear model, LLM (Chick, 1908). Descriptions of the equations are in Table 2. The T90, and T99 values (the time required for 1 and 2 log reductions of the initial concentrations of the indicators, respectively) were calculated by substituting −1.0 (or −2.0 for T99) = Log10(N/N0), and solving for t.
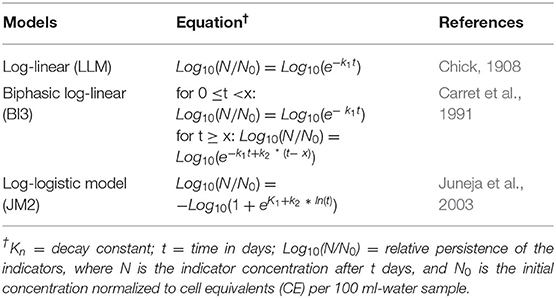
Table 2. Descriptions and properties of the log-linear model and best-fit equations (biphasic log-linear, and log-logistic) that mathematically evaluated the relationship of enterococci 23S rDNA, and Escherichia coli uidA from microcosms containing sewage spike river water stored at 4°C for up to 337 days.
Multiple linear regression analysis evaluated the associations of the observed relative persistence of the indicators to time in storage and indicator species. The analysis was performed with SPSS 22.0 (SPSS, Inc., Chicago, IL) using the following equation: Log10(N/N0) = bS × S + bI × I + bo, where N/N0 = relative persistence as described previously; b0 = Log10(N/N0) intercept; and b with a letter subscript represented the coefficients of the following independent variables: S = time in storage (0 – 337 days) and I = indicator (BT, EC, and ENT).
Results
Multiple Linear Regression Analysis
The regression equation for the dataset was: Log10(N/N0) = 0.006 × S + 0.307 × I −0.146, with R2 = 0.549 (p < 0.001; n = 108). Time in storage and indicator species (p < 0.001) were significantly associated with the relative persistence of the three indicators. This indicates that the longer the time in storage at 4°C, the greater the decrease in the concentration of the genetic marker compared to initial time. The persistence of each marker was significantly different and BT was the least persistent and ENT was the most persistent.
Description of the Observed Persistence of the Three Molecular Markers
At initial sampling, the average concentrations of BT, EC, and ENT (and standard error) were: 6.81 * 104 (5.08 * 10∧3), 3.18 * 108 (3.99 * 10∧7), and 1.01 * 107 CE (2.58 * 10∧6) per 100 ml- water sample, respectively. The average concentrations of BT and EC were below detection in 9 and 2 time-points, respectively, for the complete data set. The most and least persistent markers were EC and BT, respectively (Figures 1A–C). Concentrations of BT were above detection at t = 0, 31, and 219 days (Figure 1A). The average concentration of BT in one technical replicate at t = 219 days was above the detection limit (Figure 1A). At t = 337 days, the observed relative persistence of BT was below detection representing ≤ -1.17 log decay. Overall, the observed relative persistence of EC and ENT decreased over the duration of the experiment by −1.84 log and −3.17 log, respectively, at t = 337 days (Figures 1B,C). The observed relative persistence of EC fluctuated around −2 log during t = 61 – 337 days (Figure 1C).
Comparison of the Persistence of Three Enteric Markers Predicted From the Best-Fit and Log-Linear Models
Table 3 outlines the parameters of the selected best-fit models, log-logistic (JM2), and biphasic log-linear (BI3), and LLM along with their corresponding BIC values, and T90 and T99 values. JM2 and BI3 were selected for ENT and EC, respectively.
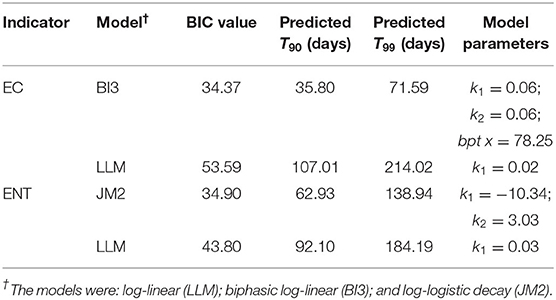
Table 3. Descriptions of the equation parameters, BIC values, predicted T90, and T99 values (days) calculated from the best-fit and log-linear models that evaluated the persistence of the cell equivalents of E. coli (EC) and enterococci (ENT) measured from microcosms containing sewage spiked river water stored at 4°C for up to 337 days.
Non-detects were observed in the EC dataset and affected the decay rates calculated from the best-fit models and LLMs (Figure 1C). After 78.25 days in storage, LLM calculated a faster rate of decay for EC than BI3 (Table 3). Also, LLM calculated a faster decay rate for ENT after ~250 days in storage than JM2. For both datasets, LLMs had larger BIC values than the corresponding best-fit models (Table 3).
The best-fit models demonstrated that the decay of ENT and EC during the experiment's duration was dynamic (Figures 1B,C). During t = 0 – 78.25 days, BI3 calculated a rapid decay of EC, afterwards during t = 78.25 – 337 days the decay waned (Figure 1C, Table 3). JM2 estimated that the relative persistence of ENT experienced shouldering followed by rapid decay, and slower decay toward the end of the experiment (Figure 1B). The best fit models calculated that the concentrations of EC and ENT at t = 337 days relative to the initial concentrations were: −2.27 log and −3.12 logs, respectively, and were larger than the concentrations derived from the corresponding LLMs (−3.15 log and −3.66 log, respectively).
Comparison of the Predicted T90 and T99 Values From the Best-Fit and Log-Linear Models
The T90 and T99 values, time required to reduce the initial concentrations of the indicators by 90%, and 99%, respectively, were calculated from the best-fit models and LLMs of the ENT and EC datasets (Table 3). The T90 and T99 values of ENT calculated from LLM (92.1 and 184.19 days, respectively) were larger than the values from JM2 (62.93 and 138.94 days, respectively). The LLM model of EC predicted that T90 and T99 = 107.01 and 214.02 days, respectively, and were larger than the values predicted from BI3 (35.80, and 71.59 days, respectively). Based on the T90 values calculated from the best-fit models, the relative order of persistence of the indicators was EC < ENT, while the order of persistence based on the T90 values from the LLMs was ENT < EC.
Discussion
This is one of the first studies to use experimental data to describe the long-term persistence of naturally occurring Bacteroides thetataiotaomicron alpha-mannanase, enterococci 23S rRNA, and Escherichia coli uidA measured from microcosms containing sewage spiked river water stored at 4°C. Using linear regression analysis, the time in storage and indicator species (p < 0.001) were significantly related to the persistence of the markers. The order of persistence of the markers was BT < EC < ENT. These results indicate that the persistence of the indicators is specific to the species in a long-term evaluation of persistence. In a 28-day evaluation of persistence of fecal indicator markers in liquid microcosms and storage on solid surface, time in storage was also significantly associated to persistence of the molecular markers of water stored at 4°C while indicator species was not significant (Brooks et al., 2015). The finding in this study and in Brooks et al. (2015) indicate that indicator species significantly affect marker persistence over longer time frames that may not be apparent in shorter time frames such as up to 28 days.
We compared the mathematical relationships between the concentrations of indicators and time in storage (up to 337 days) from log-linear decay models with a constant decay rate to best fit models, biphasic log-linear decay model (BI3) and log-logistic model (JM2). Overall, the best-fit models responded well to changes in decay rates over the course of the experiment including the modeling of effects such as shouldering and slower decay as the experiment progressed (Figures 1B,C). Similarly, a meta-analysis of the inactivation of culturable E. coli in water determined that the most popular inactivation model was biphasic log-linear decay, with an initial rapid decay followed by slower decay (Blaustein et al., 2013). Another meta-analysis of the inactivation of culturable E. coli in water observed that a large portion of the dataset was better represented by “a piecewise log-linear model” (Stocker et al., 2014). Likewise in ENT, inactivation of culturable enterococci and ENT-23 in marine water during winter for up to 8 days demonstrated an initial shouldering of the concentrations of the indicator organisms and markers (Mattioli et al., 2017).
There are a few explanations for the variation of the decay over time. The presence of BT in one technical replicate at t = 219 days could be due to a sub-population more resistant to degradation. Another possible scenario is that cells may have attached to a solid surface such as particulate matter in the water, which could enhance persistence. Previously, a simulation of water columns of brackish and freshwater estimated that the attachment of cells of enterococci to a particle can increase its persistence in the water column (Myers and Juhl, 2020). Additionally, the rapid decay of ENT and EC at the beginning of the experiment may be due to the presence of sub-populations with distinct decay rates (Rogers et al., 2011). Specifically, the survival of cultivable E. coli in microcosms of filtered estuarine water microcosms was increased in cells from the B1 phylotype (Berthe et al., 2013). DNA fingerprinting of cultivable enterococci isolated from the Lake Superior watershed indicated that sub-populations of Enterococcus sp. have differing decay rates and some populations can grow in the watershed (Ran et al., 2013). The rapid decay of the indicators could also be a result of ENT and EC exceeding the carrying capacity of the microcosm, causing rapid decay until the carrying capacity is achieved (Easton et al., 2005). This theory may explain the > 1 log variation of the concentration of EC during t = 61 – 306 days. The increase in the concentration of EC during t = 248 – 337 days could indicate a subpopulation of E. coli that are able to utilize resources to grow in the microcosm to achieve a higher cell density. The above studies suggest that the evaluation of the survival or persistence of FIB in environmental waters may be better represented with water quality models that have dynamic decay rates and scenarios for possible regrowth.
In our study, we compared the T90 and T99 values calculated from the best-fit models and LLMs. Overall, the T90 and T99 values from LLMs were larger than from the corresponding best-fit models, indicating that LLMs overestimated the persistence of ENT and EC. This overestimation could delay progress toward restoring impaired environmental waters. Additionally, the T90 values calculated from LLMs and best-fit models predicted different relative orders of persistence for the enteric markers. A previous study used LLMs to estimate that genetic markers from sewage sourced ENT and EC seeded into marine and freshwater in-situ microcosms had T90 values that ranged 51 – 335 days and 21 – 54 days, respectively (Sagarduy et al., 2019). Similarly, in our study, LLMs calculated a similar fining for EC (T90 = 107.01 days), and the best-fit models for ENT and EC (T90 = 62.93 and 35.8 days, respectively) were within the T90 values of the above-mentioned study.
Currently, LLMs are often used to estimate the persistence and loads of fecal indicators in water quality models that forecast restoration of impaired environmental waters. Our findings indicate that subpopulations of ENT and EC are persistent in microcosm at 4°C for up to 337 days (Figures 1B,C), which provide further evidence that FIB can persist in water at temperatures ≤ 4°C (Davenport et al., 1976). The data from our study indicate that water quality models should make provisions to estimate the role of sub-populations of persistent FIB in maximum daily load assessments and utilize best-fit models with variable decay rates to better estimate the decay of enteric markers in impaired environmental waters. Such information can guide water quality models into a better understanding of more realistic maximum loads of fecal indicators as well as improve forecasting of the time required to remediate impaired environmental waters. Such improvements in the models can allow for the better protection of public health by increasing the accuracy of the estimation of pollution present in impaired watersheds.
Data Availability Statement
The original contributions presented in the study are included in the article/Supplementary Material, further inquiries can be directed to the corresponding author.
Author Contributions
YMB designed and conducted experiment, analyzed the data, and wrote the manuscript. JBR designed the experiment, provided financial support, guided data analysis, and provided critical feedback in writing the manuscript. All authors contributed to the article and approved the submitted version.
Funding
This study was partially funded by the Environmental Protection Agency Great Lakes Restoration Initiative awards #115355 and #3002639641, and the National Science Foundation Water, Sustainability and Climate award (EAR-1039122).
Conflict of Interest
The authors declare that the research was conducted in the absence of any commercial or financial relationships that could be construed as a potential conflict of interest.
Publisher's Note
All claims expressed in this article are solely those of the authors and do not necessarily represent those of their affiliated organizations, or those of the publisher, the editors and the reviewers. Any product that may be evaluated in this article, or claim that may be made by its manufacturer, is not guaranteed or endorsed by the publisher.
Supplementary Material
The Supplementary Material for this article can be found online at: https://www.frontiersin.org/articles/10.3389/frwa.2021.695207/full#supplementary-material
References
Ahmed, W., O'Dea, C., Masters, N., Kuballa, A., Marinoni, O., and Katouli, M. (2019). Marker genes of fecal indicator bacteria and potential pathogens in animal feces in subtropical catchments. Sci. Total Environ. 656, 1427–1435. doi: 10.1016/j.scitotenv.2018.11.439
Ballesté, E., Demeter, K., Masterson, B., Timoneda, N., Sala-Comorera, L., and Meijer, W. G. (2020). Implementation and integration of microbial source tracking in a river watershed monitoring plan. Sci. Total Environ. 736:139573. doi: 10.1016/j.scitotenv.2020.139573
Berthe, T., Ratajczak, M., Clermont, O., Denamur, E., and Petit, F. (2013). Evidence for coexistence of distinct Escherichia coli populations in various aquatic environments and their survival in estuary water. Appl. Environ. Microbiol. 79, 4684–4693. doi: 10.1128/AEM.00698-13
Blaustein, R. A., Pachepsky, Y., Hill, R. L., Shelton, D. R., and Whelan, G. (2013). Escherichia coli survival in waters: temperature dependence. Water Res. 47, 569–578. doi: 10.1016/j.watres.2012.10.027
Brooks, Y., Aslan, A., Tamrakar, S., Murali, B., Mitchell, J., and Rose, J. B. (2015). Analysis of the persistence of enteric markers in sewage polluted water on a solid matrix and in liquid suspension. Water Res. 76, 201–212. doi: 10.1016/j.watres.2015.02.039
Brooks, Y. M., Spirito, C. M., Bae, J. S., Hong, A., Mosier, E. M., Sausele, D. J., et al. (2020). Fecal indicator bacteria, fecal source tracking markers, and pathogens detected in two Hudson River tributaries. Water Res. 171:115342. doi: 10.1016/j.watres.2019.115342
Carret, G., Flandrois, J. P., and Lobry, J. R. (1991). Biphasic kinetics of bacterial killing by quinolones. J. Antimicrob. Chemother. 27, 319–327. doi: 10.1093/jac/27.3.319
Chick, H. (1908). An Investigation of the Laws of Disinfection. J. Hyg. (London) 8, 92–158. doi: 10.1017/S0022172400006987
Davenport, C. V., Sparrow, E. B., and Gordon, R. C. (1976). Fecal indicator bacteria persistence under natural conditions in an ice-covered river. Appl. Envir. Microbiol. 32, 527–536. doi: 10.1128/aem.32.4.527-536.1976
Dick, L. K., Stelzer, E. A, Bertke, E. E., Fong, D. L., and Stoeckel, D. M. (2010). Relative decay of Bacteroidales microbial source tracking markers and cultivated Escherichia coli in freshwater microcosms. Appl. Environ. Microbiol. 76, 3255–3262. doi: 10.1128/AEM.02636-09
Easton, J. H., Gauthier, J. J., Lalor, M. M., and Pitt, R. E. (2005). Die-off of pathogenic E. coli o157:h7 in sewage contaminated waters. J. Am. Water Resour. Assoc. 41, 1187–1193. doi: 10.1111/j.1752-1688.2005.tb03793.x
Frahm, E., and Obst, U. (2003). Application of the fluorogenic probe technique (TaqMan PCR) to the detection of Enterococcus spp. and Escherichia coli in water samples. J. Microbiol. Methods 52, 123–131. doi: 10.1016/S0167-7012(02)00150-1
Gassman, P. W., Reyes, M. R., Green, C. H., and Arnold, J. G. (2007). The soil and water assessment tool: historical development, applications, and future research directions. Invit. Rev. Ser. 50, 1211–1250. doi: 10.13031/2013.23637
Jeong, J., Wagner, K., Flores, J. J., Cawthon, T., Her, Y., Osorio, J., et al. (2019). Linking watershed modeling and bacterial source tracking to better assess E. coli sources. Sci. Total Environ. 648, 164–175. doi: 10.1016/j.scitotenv.2018.08.097
Johnson, R. C., Imhoff, J. L., Kittle, J. L., and Donigan, A. S. (1984). Hydrological Simulation Program–Fortran (HSPF), User Manual for Release 8.0, EPA/600/R-97/080, 755p. Athens, GA: USEPA.
Juneja, V. K., Marks, H. M., Mohr, T., Heiri, O., Lotter, A. F., Lemcke, G., et al. (2003). Predictive thermal inactivation model for effects of temperature, sodium lactate, NaCl, and sodium pyrophosphate on salmonella serotypes in ground beef. Appl. Environ. Microbiol. 69, 5138–5156. doi: 10.1128/AEM.69.9.5138-5156.2003
Korajkic, A., McMinn, B. R., Ashbolt, N. J., Sivaganesan, M., Harwood, V. J., and Shanks, O. C. (2019). Extended persistence of general and cattle-associated fecal indicators in marine and freshwater environment. Sci. Total Environ. 650, 1292–1302. doi: 10.1016/j.scitotenv.2018.09.108
Mattioli, M. C., Sassoubre, L. M., Russell, T. L., and Boehm, A. B. (2017). Decay of sewage-sourced microbial source tracking markers and fecal indicator bacteria in marine waters. Water Res. 108, 106–114. doi: 10.1016/j.watres.2016.10.066
Myers, E. M., and Juhl, A. R. (2020). Particle association of Enterococcus sp. increases growth rates and simulated persistence in water columns of varying light attenuation and turbulent diffusivity. Water Res. 186:116140. doi: 10.1016/j.watres.2020.116140
Pote, J., Haller, L., Kottelat, R., Sastre, V., Arpagaus, P., and Wildi, W. (2009). Persistence and growth of faecal culturable bacterial indicators in water column and sediments of Vidy Bay, Lake Geneva, Switzerland. J. Environ. Sci. (China) 21, 62–69. doi: 10.1016/S.1001-0742(09)60012-7
R Development Core Team (2013). R: A Language and Environment for Statistical Computing. Vienna: R Foundation for Statistical Computing.
Ran, Q., Badgley, B. D., Dillon, N., Dunny, G. M., and Sadowsky, M. J. (2013). Occurrence, genetic diversity, and persistence of enterococci in a Lake Superior watershed. Appl. Environ. Microbiol. 79, 3067–3075. doi: 10.1128/AEM.03908-12
Reischer, G. H., Kasper, D. C., Steinborn, R., Farnleitner, A. H., and Mach, R. L. (2007). A quantitative real-time PCR assay for the highly sensitive and specific detection of human faecal influence in spring water from a large alpine catchment area. Lett. Appl. Microbiol. 44, 351–356. doi: 10.1111/j.1472-765X.2006.02094.x
Rogers, S. W., Donnelly, M., Peed, L., Kelty, C. A, Mondal, S., Zhong, Z., et al. (2011). Decay of bacterial pathogens, fecal indicators, and real-time quantitative PCR genetic markers in manure-amended soils. Appl. Environ. Microbiol. 77, 4839–4848. doi: 10.1128/AEM.02427-10
Rusiñol, M., Fernandez-Cassi, X., Hundesa, A., Vieira, C., Kern, A., Eriksson, I., et al. (2014). Application of human and animal viral microbial source tracking tools in fresh and marine waters from five different geographical areas. Water Res. 59, 119–129. doi: 10.1016/j.watres.2014.04.013
Sagarduy, M., Courtois, S., Del Campo, A., Garmendia, J. M., and Petrau, A. (2019). Differential decay and prediction of persistence of Enterococcus spp. and Escherichia coli culturable cells and molecular markers in freshwater and seawater environments. Int. J. Hyg. Environ. Health 222, 695–704. doi: 10.1016/j.ijheh.2019.04.011
Soller, J. A., Schoen, M. E., Bartrand, T., Ravenscroft, J. E., and Ashbolt, N. J. (2010). Estimated human health risks from exposure to recreational waters impacted by human and non-human sources of faecal contamination. Water Res. 44, 4674–4691. doi: 10.1016/j.watres.2010.06.049
Srinivasan, S., Aslan, A., Xagoraraki, I., Alocilja, E., and Rose, J. B. (2011). Escherichia coli, enterococci, and Bacteroides thetaiotaomicron qPCR signals through wastewater and septage treatment. Water Res. 45, 2561–2572. doi: 10.1016/j.watres.2011.02.010
Stocker, M. D., Pachepsky, Y. A., and Shelton, D. R. (2014). Performance of weibull and linear semi-logarithmic models in simulating inactivation in waters. J. Environ. Qual. 43:1559. doi: 10.2134/jeq2014.01.0023
USEPA (1991). Technical Support Document for Water Quality-Based Toxics Control. Washington, DC: USEPA.
USEPA (2015). Method 1611.1: Enterococci in Water by TaqMan® Quantitative Polymerase Chain Reaction (qPCR). Washington, DC: USEPA.
Wade, T. J., Calderon, R. L., Brenner, K. P., Sams, E., Beach, M., Haugland, R., et al. (2008). High sensitivity of children to swimming-associated gastrointestinal illness: results using a rapid assay of recreational water quality. Epidemiology 19, 375–383. doi: 10.1097/EDE.0b013e318169cc87
Keywords: fecal pollution, persistence time, water quality, best fit analysis, Bacteroides as indicator of fecal matter, enterococci, Escherichia coli, molecular markers
Citation: Brooks YM and Rose JB (2021) Comparing Log-Linear and Best-Fit Models to Evaluate the Long-Term Persistence of Enteric Markers in Sewage Spiked River Water. Front. Water 3:695207. doi: 10.3389/frwa.2021.695207
Received: 14 April 2021; Accepted: 15 June 2021;
Published: 27 July 2021.
Edited by:
Jasna Kovac, Pennsylvania State University (PSU), United StatesReviewed by:
Meredith B. Nevers, United States Geological Survey (USGS), United StatesHyatt Green, SUNY College of Environmental Science and Forestry, United States
Autumn Kraft, United States Department of Agriculture (USDA), United States
Copyright © 2021 Brooks and Rose. This is an open-access article distributed under the terms of the Creative Commons Attribution License (CC BY). The use, distribution or reproduction in other forums is permitted, provided the original author(s) and the copyright owner(s) are credited and that the original publication in this journal is cited, in accordance with accepted academic practice. No use, distribution or reproduction is permitted which does not comply with these terms.
*Correspondence: Yolanda M. Brooks, eWJyb29rc0BzamNtZS5lZHU=