 Alexandra Belias
 Natalie Brassill2
 Martin Wiedmann
 Daniel Weller
- 1Department of Food Science, Cornell University, Ithaca, NY, United States
- 2Department of Environmental Science, University of Arizona, Maricopa, AZ, United States
- 3Department of Biostatistics and Computational Biology, University of Rochester, Rochester, NY, United States
- 4Department of Environmental and Forestry Biology, SUNY College of Environmental Science and Forestry, Syracuse, NY, United States
Pathogen contamination of agricultural water has been identified as a probable cause of recalls and outbreaks. However, variability in pathogen presence and concentration complicates the reliable identification of agricultural water at elevated risk of pathogen presence. In this study, we collected data on the presence of Salmonella and genetic markers for enterohemorrhagic E. coli (EHEC; PCR-based detection of stx and eaeA) in southwestern US canal water, which is used as agricultural water for produce. We developed and assessed the accuracy of models to predict the likelihood of pathogen contamination of southwestern US canal water. Based on 169 samples from 60 surface water canals (each sampled 1–3 times), 36% (60/169) and 21% (36/169) of samples were positive for Salmonella presence and EHEC markers, respectively. Water quality parameters (e.g., generic E. coli level, turbidity), surrounding land-use (e.g., natural cover, cropland cover), weather conditions (e.g., temperature), and sampling site characteristics (e.g., canal type) data were collected as predictor variables. Separate conditional forest models were trained for Salmonella isolation and EHEC marker detection, and cross-validated to assess predictive performance. For Salmonella, turbidity, day of year, generic E. coli level, and % natural cover in a 500–1,000 ft (~150–300 m) buffer around the sampling site were the top 4 predictors identified by the conditional forest model. For EHEC markers, generic E. coli level, day of year, % natural cover in a 250–500 ft (~75–150 m) buffer, and % natural cover in a 500–1,000 ft (~150–300 m) buffer were the top 4 predictors. Predictive performance measures (e.g., area under the curve [AUC]) indicated predictive modeling shows potential as an alternative method for assessing the likelihood of pathogen presence in agricultural water. Secondary conditional forest models with generic E. coli level excluded as a predictor showed < 0.01 difference in AUC as compared to the AUC values for the original models (i.e., with generic E. coli level included as a predictor) for both Salmonella (AUC = 0.84) and EHEC markers (AUC = 0.92). Our data suggests models that do not require the inclusion of microbiological data (e.g., indicator organism) show promise for real-time prediction of pathogen contamination of agricultural water (e.g., in surface water canals).
Introduction
Salmonella spp. and pathogenic Escherichia coli (such as enterohemorrhagic E. coli; EHEC) are common etiological agents of foodborne outbreaks and recalls linked to produce commodities. From 2004 to 2012, Salmonella has caused 71 and 40 outbreaks linked to produce in the United States (US) and European Union (EU), respectively (Callejon et al., 2015). During the same time frame, pathogenic E. coli have caused 46 and 7 outbreaks linked to produce in the US and EU, respectively (Callejon et al., 2015). Both livestock and wildlife have been identified as possible sources of Salmonella and EHEC in preharvest produce environments (Delaquis et al., 2007; Hanning et al., 2009), with fecal matter from livestock operations being a known source of foodborne pathogens in surface water (Lu et al., 2004; Delaquis et al., 2007; Hanning et al., 2009). As such, application of surface waters to in-field produce has been identified as a potential route for pathogen contamination of produce (Mootian et al., 2009; Park et al., 2012; Castro-Ibanez et al., 2015; Liu et al., 2018). In fact, several outbreaks are thought to have been caused by application of contaminated water to preharvest produce (U. S. Centers for Disease Control Prevention, 2006, 2018a,b; Greene et al., 2008), including a 2018 E. coli O157:H7 outbreak linked to romaine lettuce grown in Arizona, which caused 210 illnesses and 5 deaths (U. S. Centers for Disease Control Prevention, 2018b).
While enteric pathogens, such as EHEC and Salmonella, are known surface water contaminants, they are present sporadically and at low levels, complicating detection and limiting the value of testing surface water for pathogens (Jamieson et al., 2004; Pachepsky et al., 2011). Instead, monitoring programs often test for indicator organisms, which are used to assess the hygienic quality of water and the likelihood of fecal contamination; indicator organisms include enterococci, fecal coliforms, and generic E. coli (Jamieson et al., 2004; Pachepsky et al., 2011). E. coli is used as an indicator for monitoring fecal contamination in agricultural water by industry agreements and by government regulations (Tam and Petersen, 2014; U. S. Food Drug Administration, 2015; California Leafy Greens Marketing Agreement, 2020; Freshcare, 2020); see Table 1 for details.
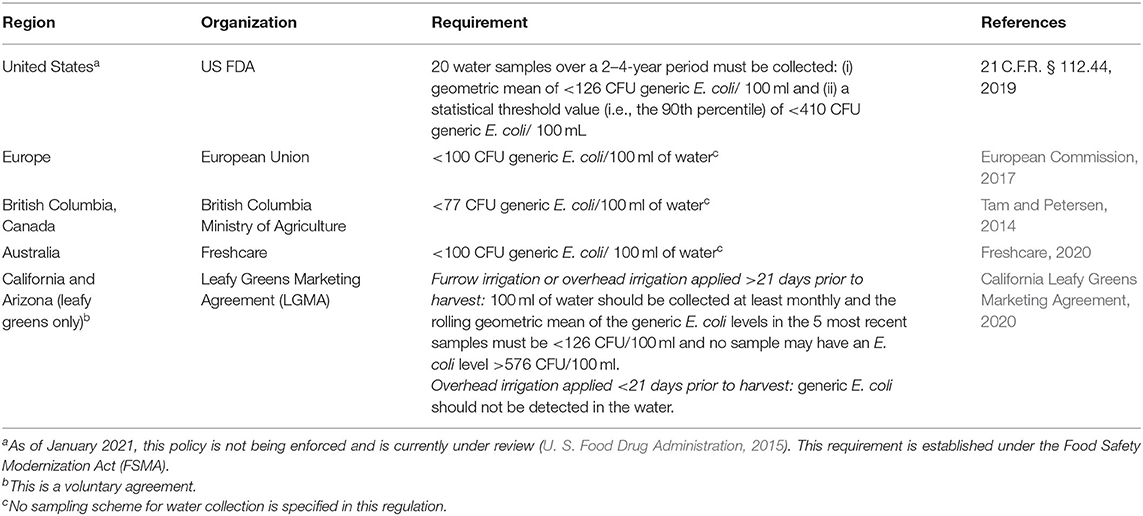
Table 1. Microbial quality requirements or regulations established in different countries or regions for agricultural water applied to pre-harvest produce.
There are however several drawbacks to using generic E. coli as an indicator of fecal contamination for surface water (Pachepsky et al., 2016; Wall et al., 2019). While some studies have established associations between generic E. coli levels and pathogen presence (Holvoet et al., 2014; Lopez-Galvez et al., 2014; Stea et al., 2015; Bradshaw et al., 2016; Truchado et al., 2018; Weller et al., 2020b), several studies have not shown similar associations (Haley et al., 2009; Shelton et al., 2011; Benjamin et al., 2013; Falardeau et al., 2017). E. coli has also been shown to survive for extended periods of time in the preharvest environment (Lu et al., 2004; Franz et al., 2014; Allende et al., 2018); therefore, a high level of generic E. coli does not necessarily indicate recent fecal contamination. High levels of indicator organisms also do not necessarily indicate the presence of pathogens, and alternatively, the absence or low levels of indicator organisms do not necessarily indicate the absence of pathogens (Haley et al., 2009; Shelton et al., 2011; Benjamin et al., 2013; Stea et al., 2015; Falardeau et al., 2017). Lastly, generic E. coli testing takes ~24 h to complete and generic E. coli levels in surface waters can vary substantially over short time periods (Lothrop et al., 2018; Weller et al., 2020b); therefore, it is impossible to know the generic E. coli level in irrigation water at the time of its application.
Two previous studies have proposed the use of machine learning models for predicting pathogen presence in agricultural water; Weller et al. (2020c) utilized machine learning models to predict Salmonella presence and EHEC marker detection in New York streams and Polat et al. (2020) utilized machine learning models to predict Salmonella presence in Florida ponds. While previous studies have explored the use of machine learning models for predicting pathogen contamination in specific produce growing areas, further model development is essential to verify that machine learning represents a viable approach in different locations and types of surface waters. We thus collected data on surface water quality and used several approaches, including machine learning, to model the presence enteric pathogens in southwestern US canal water. Regression was used as a preliminary assessment to determine which variables were associated with pathogen presence. Conditional forest models were used for prediction because they can utilize large numbers of predictors and better able to handle complex and messy data than regression models (Kuhn and Johnson, 2013). While modeling alone will not improve the safety of produce, these models can indicate when corrective actions (e.g., water treatments) should be applied to reduce the risk of recalls and illnesses associated with produce (Savichtcheva et al., 2007; Allende and Monaghan, 2015). The southwestern US was selected for this study, because (i) it is a major produce growing region, (ii) there has been a high-profile outbreak associated with romaine lettuce contamination linked to irrigation water, and (iii) there is limited information on microbial quality of southwestern US canals (Lothrop et al., 2018; Weller et al., 2020b). As such, the specific objectives of this study were to (i) identify land use, water quality, weather, and other sampling site specific variables associated with Salmonella presence and EHEC marker detection (i.e., stx and eaeA detection) in southwestern US canal water, (ii) determine the feasibility of predicting the likelihood of Salmonella presence and EHEC marker detection in southwestern US canal water, and (iii) determine if only real-time variables (i.e., no microbial testing) can be used to predict the likelihood of Salmonella presence and EHEC marker detection.
Materials and Methods
Experimental Design
A longitudinal study was conducted to assess agricultural water quality in the southwestern US. Water was sampled from 60 canals that provide water for irrigation from January 30th to November 19th, 2018; sampling was performed approx. twice a week every 1–2 weeks except in July when no sampling was performed (see Supplementary Figure 1 for the exact sampling dates). Each canal was sampled 1–3 times for a total of 169 samplings; all samples from a given canal were collected at the same site. Sampling sites were randomly selected from irrigation districts where produce was grown and where permission was given using ArcGIS. Ground truthing was then performed to identify a location as close as possible to the randomly generated GPS coordinates for each site. A site survey was conducted to collect information on features present at a given site (see Supplementary Table 1).
Sample Collection and Processing
At each sampling, two 10 L water samples (one per pathogen) and 1 L of water (for enumeration of E. coli and turbidity levels) were collected. Dissolved oxygen, pH, conductivity, and temperature of the canal water were measured using a Hach HQ40d meter (Loveland, CO, United States). Water surface flow was measured using the float method as described by Gore and Banning (2017). After collection, all samples were put on ice until processing. The 10 L samples were processed <18 h after collection and the 1 L sample for E. coli level and turbidity was processed <6 h after collection.
Laboratory testing of all samples was performed as described in Weller et al. (2020b). Briefly, generic E. coli enumeration was performed on a 100 ml aliquot of the 1 L sample using the Colilert Quanti-Tray 2000 kit (IDEXX, Westbrook, ME, United States), according to the manufacturer's instructions. Water turbidity was measured using the Hach 2100Q Portable Turbidimeter. The 10 L water samples were processed using the modified Moore swab (mMS) method (Sbodio et al., 2013). Each water sample was gravity-filtered through a separate mMS, placed in a separate Whirl-Pak bag (Nasco, Fort Atkinson, WI, United States), and processed as described below for either Salmonella presence or EHEC marker detection.
Salmonella Isolation
Briefly, 225 ml of buffered peptone water with 20 mg/L novobiocin (BPW+N) was added to the Whirl-Pak bag with the mMS, followed by incubation at 35°C for 24 h. BPW+N inoculated with Salmonella Typhimurium (FSL F6-0826; http://www.foodmicrobetracker.com) and uninoculated BPW+N were included as positive and negative controls, respectively. Following incubation, a 1 ml aliquot of the enrichment was transferred to a sterile tube and was shipped overnight on ice to Cornell University for further processing. Upon arrival, all enrichments were used within 2 h for a Salmonella screen using the BAX real-time Salmonella assay (Hygiena, Wilmington, DE, United States). BAX PCR-positive samples were culture confirmed. 1 and 0.1 ml of the BPW+N enrichment were added to 9 ml of tetrathionate broth (TT; Oxoid) supplemented with 200 μl of I2-KI and 100 μl of Brilliant Green and 9.9 ml of Rappaport Vassiliadis broth (RV; Acros Organic, Geel, Belgium), respectively. The TT and RV broth were incubated in a shaking water bath at 42°C for 24 h. Following incubation, 50 μl of each broth were streaked onto Salmonella CHROMagar (DRG International, Springfield, NJ, United States) and xylose lysine deoxycholate agar (XLD; Neogen, Lansing, MI, United States) plates (i.e., 1 plate for TT on CHROMagar, 1 plate for TT on XLD, 1 plate for RV of CHROMagar, and 1 plate for RV on XLD). The CHROMagar and XLD plates were then incubated at 37 and 35°C, respectively, for 24 h. After incubation, PCR of the invA gene was performed on presumptive Salmonella colonies according to the protocol described by Kim et al. (2007). If possible, 2 characteristic Salmonella colonies per media type (mauve colonies on CHROMagar and black colonies on XLD) were selected for PCR (4 colonies in total). If no characteristic colonies were present, up to 12 non-characteristic colonies were selected for PCR (blue colonies on CHROMagar and red colonies on XLD). All isolates were stored as 15% glycerol stocks at −80°C.
EHEC Marker Detection
PCR-based detection of stx and eaeA from the mMS was performed. 225 ml of tryptic soy broth with 10 g/L casamino acids and 8 mg/L of novobiocin (TSB+N) was added to the Whirl-Pak bag with the mMS, followed by incubation at 41°C for 24 h. TSB+N inoculated with E. coli O157:H7 (FSL F6-0699; http://www.foodmicrobetracker.com) and uninoculated TSB+N were included as positive and negative controls, respectively. Following incubation, a 1 ml aliquot of the enrichment was shipped overnight on ice to Cornell University for further processing. All enrichments were used within 2 h of arrival to perform a PCR screen using the BAX real-time Shiga-toxin producing E. coli (STEC) assay (Hygiena) according to the manufacturer's instructions to determine if the eaeA and/or stx1/2 genes were present in the sample. If both eaeA and stx1/2 were detected in a sample, the sample was classified as positive for “EHEC markers.” However, such results could indicate either (i) both genes were present in a single organism (indicating presence of EHEC) or (ii) genes were present in separate organisms (e.g., eaeA indicates enteropathogenic E. coli presence, stx1/2 indicates STEC presence).
Land Use Data Collection
Land use data around the sampling sites were extracted from the 2016 National Land Cover Database (NLCD; https://www.mrlc.gov/) and quantified using ESRI ArcGIS Pro 2.4.0. The percentage of land under (i) developed open space, (ii) developed (combines low-, medium-, and high-intensity developed cover), (iii) barren, (iv) natural (combines forest and wetland), (v) pasture/ hay, and (vi) crop cover at various intervals around each sampling site were calculated (Yang et al., 2018). The intervals considered were: <250 ft (< ~75 m), 250–500 ft (~75–150 m), 500–1,000 ft (~150–300 m), 1,000–5,000 ft (~300–1,525 m), and 500–10,000 ft (~1,525–3,050 m). These buffer areas were selected, as they most closely represent the distances included in the California and Arizona Leafy Green Marketing Agreements Food Safety Practices (California Leafy Greens Marketing Agreement, 2020) metrics; while it would have been useful to characterize land use directly adjacent to the canals, an accurate map of the canal networks was not available for the study area. The number of concentrated animal feeding operations (i.e., an animal feeding operation with >1,000 animal units confined on a site for more than 45 days of the year; CAFOs) within 10,000 ft of each site was also calculated.
Weather Data Collection
Temperature, solar radiation, precipitation, wind speed, and vapor pressure data were obtained from the University of Arizona (cals.arizona.edu/AZMET/). ESRI ArcGIS Pro 2.4.0 was used to identify the weather station closest to each of the sampling sites. Weather data were cleaned in R version 4.0.0 (R Core Team, 2021) and used to calculate weather at the time of sample collection and for the (i) 0–12 h, (ii) 12–24 h, (iii) 1–2 days, and (iv) 2–3 days prior to sample collection. Due to the small amount of precipitation during the study, all precipitation variables were converted to a binary factor to indicate if there was precipitation (>0 mm) or if there was no precipitation (=0 mm).
Regression Analysis
All data cleaning, visualization, and analyses were performed in R (R Core Team, 2021). A description of all variables used in analyses are provided in Supplementary Table 1. All analyses were performed separately for Salmonella presence and EHEC marker detection. Logistic regression was used as a preliminary assessment to characterize associations between site specific (i.e., data on features present at each site, see Supplementary Table 1 for details), water quality, land-use, and weather variables and Salmonella presence and EHEC marker detection. Conditional forest analysis was used to determine if these variables could be used to predict Salmonella presence or EHEC marker detection.
For logistic regression, normalization and scaling of all numeric variables was performed using the “caret” package (Kuhn, 2020). Univariable logistic regression was performed, using the “lme4” package (Bates et al., 2015), to determine which of the explanatory variables listed in Supplementary Table 1 were associated with Salmonella and EHEC marker presence. The day of year (number of days since Jan 1st) and irrigation district were included in each univariable model as random effects to account for temporal and spatial autocorrelation. Following univariable regression, continuous variables with P <0.1 were included in a principal component analysis (PCA) for variable reduction. PCA was performed using the prcomp function, such that the number of components retained must explain ≥90% of the variation in the data and each retained variable could only have major loading on one principal component. PCA was performed separately for Salmonella and EHEC marker presence. One representative continuous variable from each principal component, as well as all categorical variables significant at P <0.1 by univariable analysis (categorical variables cannot be included in PCA) were included in the initial multivariable logistic regression models (implanted using the “lme4” package; Bates et al., 2015). Day of year and irrigation district were included each multivariable model as random effects. Backwards selection based on AIC (Akaike Information Criterion) was performed; the final selected model was the simplest model with an AIC value that was at least 2 less than the next simplest model. Model fit was assessed using the protocol described by Beauvais et al. (2018) to determine if model assumptions were met. Variance inflation factors were also calculated to test for multicollinearity.
Conditional Forest Analysis
Conditional forest analysis was used to determine if sampling site, water quality, land-use, and weather variables could be used to predict Salmonella presence and EHEC marker detection, as it can handle missing data, skewed data, and is robust to small sample sizes. Imputation could not be performed because >10% of observations were missing for some variables, and so imputation could introduce bias into the results. No additional machine learning algorithms were tested, as a comprehensive comparison of 23 learners for predicting enteric pathogen presence in New York streams found that conditional forest models performed well for the type of data used in the study presented here (Weller et al., 2020c). The “mlr” (Bischl et al., 2016) and “party” (Hothorn et al., 2006; Strobl et al., 2007, 2008) packages were used for model training and testing. Oversampling was performed to account for imbalanced training data. Repeated (5 iterations) 5-fold cross-validation was used to tune hyperparameters (i.e., mtry, minbucket, and mincriterion) to maximize AUC (area under the curve) and minimize overfitting. For each forest, 20,001 trees were fit. Following hyperparameter tuning, models were trained, and model testing was performed. While a separate testing data set would have been preferable to better evaluate the predictive performance of these models, one was not available. Instead, cross-validation was performed as part of model training to estimate performance measures. Variable importance scores were calculated (Strobl et al., 2007, 2008) and partial dependence plots were fit for the 4 top-ranked variables for each pathogen. While using conditional importance scores would have been preferable to account for correlation between variables, it could not be calculated due to missing data (>10% of observations were missing for some variables); as a result, the variable importance scores reported here may be biased by this correlation. Even with this limitation, we determined conditional forest was a good option in this case due to its ability to handle a large number of predictors and small sample sizes.
We also evaluated if the inclusion of generic E. coli levels as an input variable would substantially improve the performance of the conditional forest models. To do so, separate conditional forest models were re-run (one per pathogen) as described above but excluding generic E. coli level as a predictor. Performance measures were used to compare the models that included and excluded E. coli levels.
All models presented here, were developed as a proof of concept. As such, these models should not be used to guide on-farm decision making, and instead should be used as a starting point for the development of field-ready models (i.e., that can be used by stakeholders to predict pathogen presence in agricultural water) as part of future studies (e.g., using larger datasets, validated using an independent test dataset).
Results
General Water Quality
In total, 169 samples were collected between January 30th and November 19th, 2018 from 60 canals; each canal is referred to as a “site.” The sites were within an ~28,000 km2 area representing 9 irrigation districts. On average, the majority of land in the 10,000 ft surrounding the sites was classified as cropland or natural cover (Supplementary Table 3). The mean generic E. coli level in the water samples was 1.4 log10 MPN/100 ml (standard deviation = 0.7 log10 MPN/100 ml) and the mean turbidity in the water samples was 32.7 NTU (standard deviation = 92.7 NTU); similar statistics for other variables can be found in Supplementary Tables 2–4.
Pathogen Testing Results
The overall prevalence of Salmonella was 36% (60/169). Of the 60 sites, 20 were Salmonella negative on all samplings, however, 2 of those sites were only sampled once. Conversely, 9 sites were positive on all samplings; (1, 5, and 3 of these sites were sampled 1, 2, and 3 times, respectively). The overall prevalence of EHEC markers (i.e., both stx1/2 and eaeA) in the water samples was 21% (36/169). Thirty-three sites were negative for EHEC markers on all samplings, however, 3 of those sites were only sampled once. Conversely, 2 sites were positive on all samplings for EHEC markers (both sites were sampled 3 times).
Regression and Conditional Random Modeling of Salmonella Contamination
Multivariable regression was used to determine which variables were associated with Salmonella presence. The percent of developed open space (e.g., large-lot single family homes, golf courses, parks) in the 1,000–5,000 ft buffer area and precipitation 1–2 days before sample collection were the only variables retained in the final model. The percent of developed open space in the 1,000–5,000 ft buffer area was negatively associated with the log-odds of a sample being Salmonella-positive (P = 0.036, Table 2). Rain 1–2 days before sample collection was positively associated with the log-odds of a Salmonella positive sample (P = 0.015, Table 2). Results of univariable regression and PCA are detailed in Supplementary Table 5.
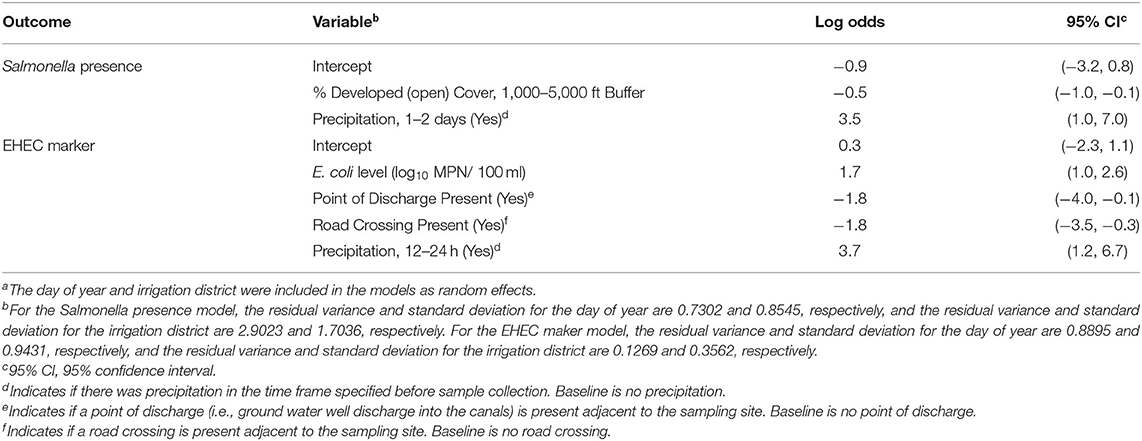
Table 2. Results of mixed effects regression modelsa that characterize the relationship between pathogen detection (Salmonella presence and EHEC marker detection) and environmental variables (e.g., land use, weather, sampling site characteristics, and water quality factors).
In addition to multivariable regression, we performed conditional forest analysis to predict Salmonella presence. The 10 top-ranked predictors included (i) three predictors related to natural cover, (ii) three weather-related predictors, (iii) two water quality related predictors, (iv) one temporal predictor, and (v) one sampling site predictor (Figure 1). Only “precipitation 1–2 days before sampling,” was also retained in the final multivariable regression model and included in the 10 top-ranked predictors by the forest (Figure 1). While not retained in the multivariable regression analysis, several of the 10 top-ranked predictors in the conditional forest were significant according to univariable regression (Supplementary Table 5). Given that conditional forest is better able to handle complex (e.g., interactions between features) and messy (e.g., missing data) data than regression, these differences are not unexpected (see Weller et al. 2020c for more information). Partial dependence plots were fit to visualize the relationship between the 4 top-ranked predictors in the conditional forest model (Figure 2), which were, in order, turbidity, day of year, generic E. coli level, and percent natural cover in the 500–1,000 ft buffer area.
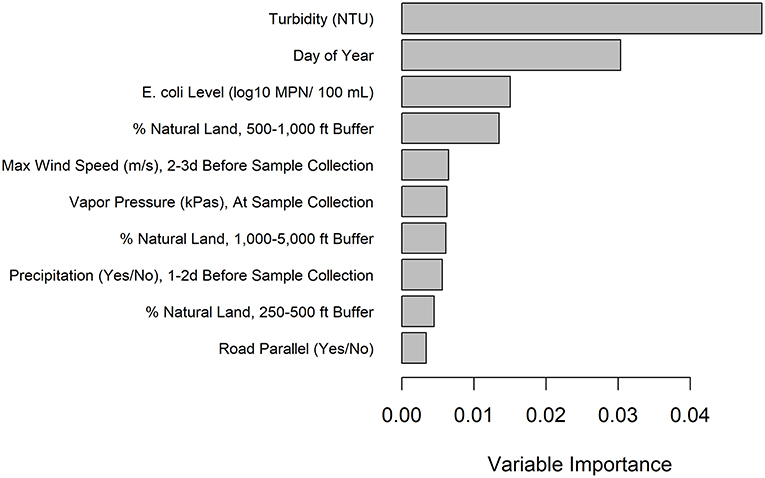
Figure 1. Variable importance values for the Salmonella conditional forest model with generic E. coli included as a predictor. Only the top 10 predictors are included and are listed from most to least important.
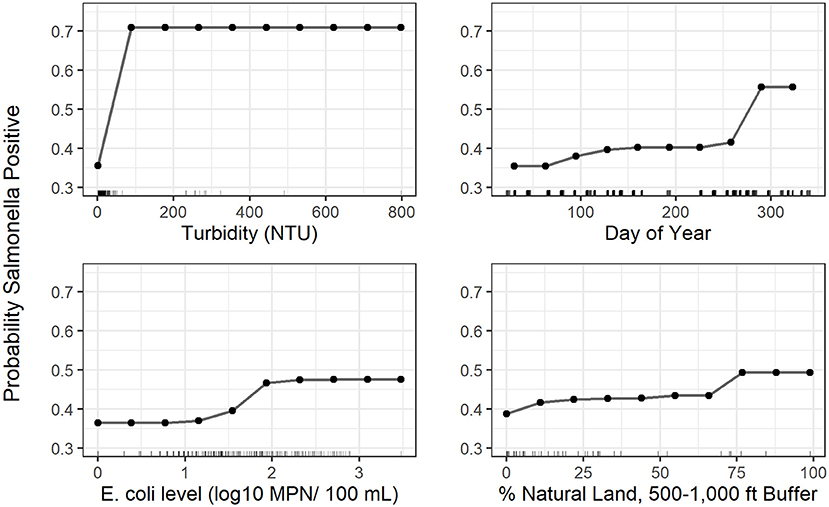
Figure 2. Partial dependence plots for the 4 top-ranked predictors according to variable importance in the Salmonella conditional forest model with generic E. coli included as a predictor; The plots indicate how the predicted probability of a water sample being positive for Salmonella presence changes as the x-axis variable (predictor) changes. The tick marks along the x-axis indicate values of the predictor variable in samples used to fit the conditional forest model.
The AUC (area under the curve) and kappa score for the Salmonella conditional forest model were 0.84 and 0.51, respectively (Table 3). When the probability threshold was set to 0.5 (i.e., to label a sample as positive, the predicted probability of that sample being positive for Salmonella must be 0.5 or greater), the sensitivity, specificity, positive likelihood ratio, and negative likelihood ratio were 0.69, 0.82, 3.83, and 0.38, respectively. The sensitivity of 0.69 indicates there is a 0.31 false negative rate, or 31% of the time the model will predict a sample as being negative for Salmonella when it is truly positive. Since the model predicts the probability of Salmonella being present in a sample (i.e., a continuous outcome), a probability threshold is needed to dichotomize the predicted pathogen status as positive or negative (Table 2). If a binary outcome (as opposed to the continuous outcome generated by the forest algorithm) is needed when applying a predictive model, sensitivity and specificity can be adjusted by changing the threshold value (Table 4). For instance, if the threshold value was set at 0.4, the sensitivity, specificity, positive likelihood ratio, and negative likelihood ratio would be 0.78, 0.71, 2.70, and 0.31, respectively (Table 4).
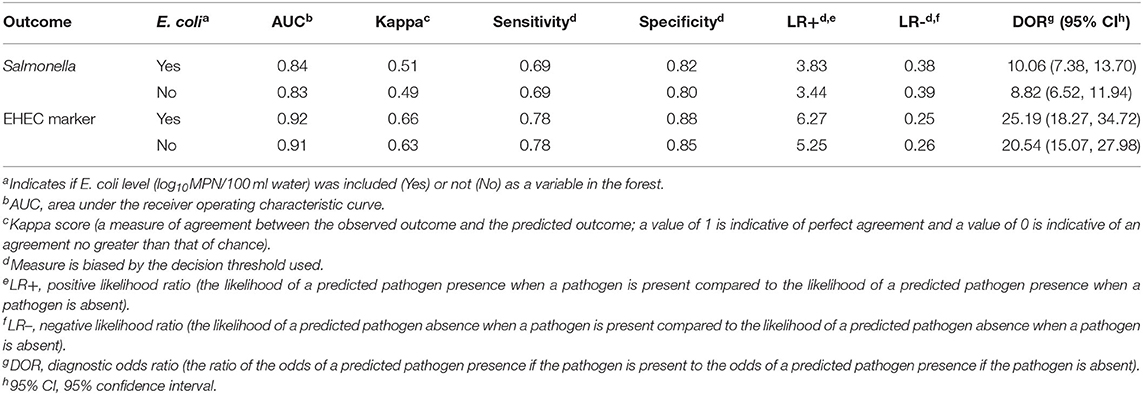
Table 3. Performance measures for the conditional random forest models displaying the relationship of the pathogen detection outcomes (Salmonella presence and EHEC marker detection) with the land use, weather, sampling site characteristics, and water quality predictors with generic E. coli level included and excluded as a predictor.
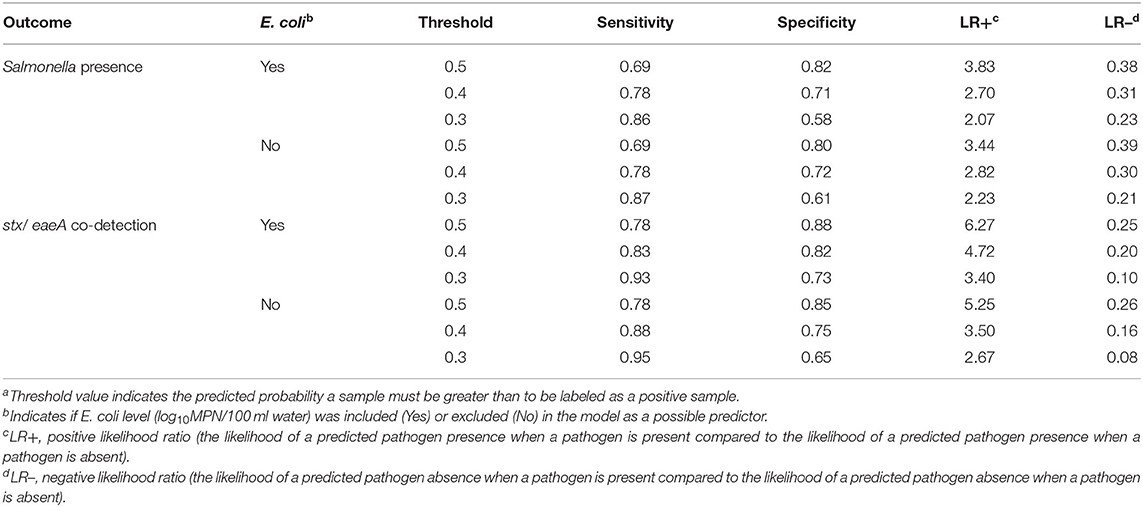
Table 4. Differences in performance measures for the conditional forest models displaying the relationship of the pathogen detection outcomes (Salmonella presence and EHEC marker detection) with the land use, weather, sampling site characteristics, and water quality predictors with generic E. coli level included and excluded as a predictora.
Regression and Conditional Random Modeling of EHEC Marker Presence
Generic E. coli level, precipitation 12–24 h before sample collection, if there was a point of discharge (i.e., there was ground water well discharge into the canal) visible from the site, and if there was a road crossing visible from the site were retained in the final EHEC regression model (Table 2). Generic E. coli level (P < 0.001) and precipitation 12–24 h before sample collection (P = 0.007) were positively associated with the log-odds of EHEC marker detection (P < 0.001). A point of discharge and a road crossing visible from the site were negatively associated with the log-odds of EHEC marker detection.
A conditional forest model was also fit to predict EHEC marker detection. The top 10 ranked predictors included (i) six land cover predictors (five related to natural cover), (ii) one weather predictor, (iii) two water quality predictors, and (iv) one temporal predictor (Figure 3). While generic E. coli level and precipitation 12–24 h before sample collection were included in the 10 top-ranked predictors in the forest model, the presence of a point of discharge and road crossing adjacent to the sampling sites were not among the 10 top-ranked predictors in the forest (Figure 3). For the EHEC forest, partial dependence plots were fit for the 4 predictors, which were (i) generic E. coli level, (ii) day of year, (iii) percent of natural cover in the 250–500 ft buffer area, and (iv) percent of natural cover in the 500–1,000 ft buffer area (Figure 4).
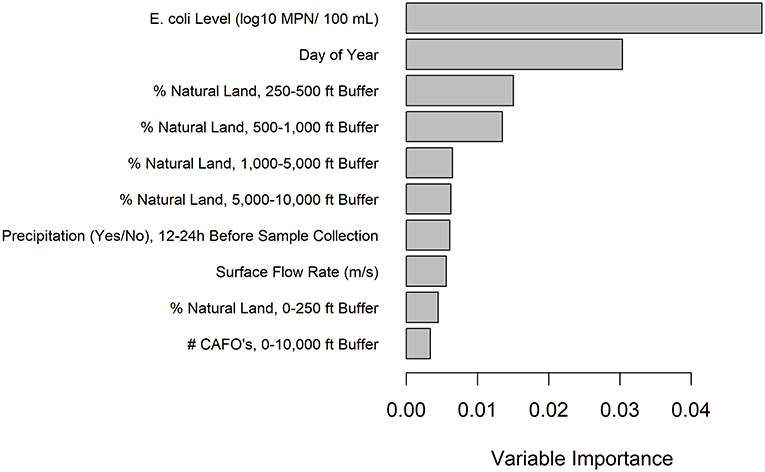
Figure 3. Variable importance values for the EHEC marker conditional forest model with generic E. coli included as a predictor. Only the top 10 predictors are included and are listed from most to least important.
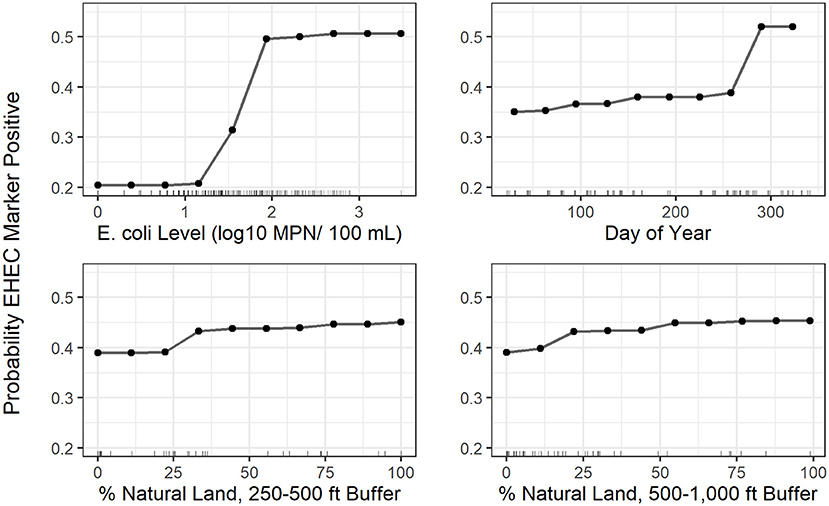
Figure 4. Partial dependence plots for the 4 top-ranked predictors according to variable importance in the EHEC marker conditional forest model with generic E. coli included as a predictor; the plots indicate how the predicted probability of a water sample being positive for EHEC marker detection changes as the x-axis variable (predictor) changes. The tick marks along the x-axis indicate values of the predictor variable in samples used to fit the conditional forest model.
The AUC and kappa score for the EHEC forest were 0.92 and 0.66, respectively (Table 3). The sensitivity, specificity, positive likelihood ratio, and negative likelihood ratio were 0.78, 0.88, 6.27, and 0.25, respectively for the EHEC marker model at a threshold value of 0.5 (Table 4). As with the Salmonella forest, changing the threshold value could improve performance measures that rely on dichotomizing the predicted probability of EHEC marker detection (e.g., sensitivity; Table 4).
Performance of Models That Do Not Include Generic E. coli Levels as a Predictor
To determine if including generic E. coli levels in the conditional forest models substantially improved predictive performance, we re-ran the forest models without generic E. coli level as a predictor (see Supplementary Figures 2–5 for variable importance and partial dependence plots). There were no substantial differences in performance between the models with and without generic E. coli included as a predictor (Table 3). For instance, the AUC values were 0.84 and 0.83 for the Salmonella forests that included and excluded generic E. coli levels, respectively. Similarly, the AUC values were 0.92 and 0.91 for the EHEC forests that included and excluded generic E. coli levels, respectively.
Discussion
The current study assessed Salmonella presence and EHEC marker detection in southwestern US canals used for agricultural water. Regression was used to identify associations between environmental conditions and Salmonella presence and EHEC marker detection. The data were also utilized to determine if forest-based models were a feasible approach for predicting Salmonella presence and EHEC marker detection in canals. While these models were developed as a proof of concept, they provide a conceptual framework on which future work (development of models that can be integrated into on-farm decision-making) can build. Our results can also be used to identify factors important for predicting pathogen presence in southwestern US canal water to guide future data collection to be used to provide maximum value for the refinement of predictive models that can be deployed for industry use.
Salmonella and EHEC Marker Prevalence
Salmonella has been isolated from flowing surface water sources in both this and previous studies (Duffy et al., 2005; Haley et al., 2009; Wilkes et al., 2009, 2011; Benjamin et al., 2013; Strawn et al., 2013a,b; Cooley et al., 2014; Stea et al., 2015; Bradshaw et al., 2016; Falardeau et al., 2017; Tian et al., 2017; Partyka et al., 2018; Truchado et al., 2018; Weller et al., 2020a,b). While Salmonella prevalence varied widely between these studies, the Salmonella prevalence reported here (36%) falls within the range reported by these previous studies, which was between 3% (6/223) (British Columbia, Canada; Falardeau et al., 2017) and 76% (80/105) (Georgia, USA; Bradshaw et al., 2016).
While several studies have attempted to assess the prevalence of EHEC or different EHEC subgroups (e.g., E. coli O157) in surface water, the specific methodologies used can have a considerable impact on prevalence estimates. Some studies reported the percent of culture-confirmed EHEC or STEC positive samples (Wilkes et al., 2009, 2011; Benjamin et al., 2013; Strawn et al., 2013a; Cooley et al., 2014; Tanaro et al., 2014; Nadya et al., 2016; Falardeau et al., 2017; Tian et al., 2017; Partyka et al., 2018; Truchado et al., 2018; Haymaker et al., 2019), others solely relied on PCR screens for either O157 markers (Stea et al., 2015) or EHEC markers (Shelton et al., 2011; Bradshaw et al., 2016; Weller et al., 2020a,b), such as the study reported here. Regardless, most of these previous studies that assessed EHEC in running surface waters have reported lower prevalence than found here (21%). For example, the EHEC prevalence ranged from <1% (5/818) (Ontario, Canada; Wilkes et al., 2009) to 19% (63/330) (British Columbia, Canada; Nadya et al., 2016); both studies utilized culture confirmed EHEC results. While the higher EHEC prevalence in the current study could be due to a truly higher prevalence, the use of a PCR screen for stx and eaeA in a single sample without culture confirmation may overestimate the prevalence of EHEC, as this method may (i) detect stx and eaeA in different organisms and (ii) may detect genetic material from dead organisms. The lower prevalence of EHEC in previous studies that used culture confirmation is also likely explained by the lack of reliable EHEC culture-conformation methods which can underestimate its true prevalence (Muniesa et al., 2006; Bettelheim, 2007; Baker et al., 2019).
The Complexity of Relationships Observed Was Dependent on the Analytical Approach
Two modeling approaches were utilized, including (i) multivariable regression to identify associations between environmental variables and Salmonella presence and EHEC marker detection, and (ii) conditional forest to develop models to predict Salmonella presence and EHEC marker detection. For both Salmonella presence and EHEC marker detection, there were several differences in the variables retained in the regression models and the variables ranked as important by the forests, even though there are some overlaps between important variables between the modeling strategies. This highlights the fact that different modeling strategies are able to detect different relationships in the data (Kuhn and Johnson, 2013). For instance, regression relies on the assumption that there is a linear relationship between independent variables and the log-odds of the dependent variable being detected, and therefore, non-linear relationships cannot be detected. In addition, logistic regression cannot handle a large number of independent variables simultaneously (requiring variable selection before model development), missing data, or correlated variables, and can only account for a limited number of interactions. In comparison, conditional forest utilizes tree-based modeling which does not require the same linear assumption to be met, implicitly accounts for hierarchical relationships and interactions in the data, and can handle missing data, large numbers of independent variables, and correlation. For example, some variables were important by univariable regression but could not be included in final multivariable regression models because they loaded on more than 1 principal component (e.g., percent of natural cover around the sampling site for the Salmonella model). PCA is one strategy used for variable selection in regression analysis, as regression analysis is unable to handle overly complex models (see Kuhn and Johnson, 2013 for additional variable reduction strategies). On the other hand, variable selection is incorporated into the conditional forest algorithm and as such is better able to capture the complex relationships inherent to environmental data (Weller et al., 2020b). However, regression-based analysis does have its advantages, especially for hypothesis testing of the relationships between specific, independent variables and the outcome. Regression models are more interpretable than forests, making it easier to understand the relationships in a regression as opposed to forest models (Kuhn and Johnson, 2013).
Only precipitation 1–2 days before sampling was included among the 10 top-ranked predictors in the Salmonella forest and retained in the final regression model. Several other studies also found an increased likelihood of Salmonella detection following rain events (Haley et al., 2009; Wilkes et al., 2009; Liang et al., 2013; Stea et al., 2015; Weller et al., 2020a). For instance, in a survey of surface water in Georgia, USA, Haley et al. (2009) found significant (P < 0.005) positive correlations between Salmonella levels, and rainfall 1 and 2 days before sample collection. This relationship may be driven by increases in run-off during rain events, which can transfer Salmonella from terrestrial sources to waterways. Unlike rain, developed open space was included in the final Salmonella regression model but was not highly ranked in the Salmonella forest. According to the regression model, as the percent of developed open space increased, the log-odds of detecting Salmonella decreased. Developed open space may act as a proxy for built-landscape features that prevent run-off and microbial contaminants from entering canals, such as vegetative buffers (e.g., in parks) or improved drainage systems. Consistent with these findings, a survey of Central California waterways found a significantly lower prevalence (P < 0.05) of Salmonella in human-impact areas (47%) compared to animal-impacted areas (74%) (Tian et al., 2017). However, several studies have found a positive association between Salmonella presence and variables linked to human presence human presence (Johnson et al., 2003; Weller et al., 2020a). Johnson et al. (2003) speculated this inconsistency between studies could be due to the quality of wastewater removal infrastructure in the sampling area.
For the EHEC models, generic E. coli levels and precipitation before sampling were included in both the regression and forest models. The relationship between precipitation and an increased log-odds of EHEC detection was likely also driven by an increase in run-off during rain events, similar to the relationship between Salmonella and precipitation discussed above. The relationship between EHEC detection and precipitation is also consistent with past studies (Stea et al., 2015; Nadya et al., 2016). Conversely, there is considerable variability between previous studies in the existence, direction, and strength of the relationship between EHEC detection and generic E. coli levels. For example, some studies, like the study presented here, found evidence of a relationship (Holvoet et al., 2014; Stea et al., 2015; Bradshaw et al., 2016; Falardeau et al., 2017; Truchado et al., 2018; Weller et al., 2020b), while others did not (Shelton et al., 2011; Benjamin et al., 2013; Falardeau et al., 2017; Partyka et al., 2018; Weller et al., 2020a).
While there were overall differences in the variables identified as being associated with Salmonella presence or EHEC marker detection by regression analysis and those identified as a top ranked predictor by conditional forest analysis, both modeling strategies used together can provide a more complete understanding of the processes that drive pathogen presence. For instance, the variables associated with pathogen presence via regression provide easy to interpret information on associations between a subset of factors and likelihood of pathogen contamination. On the other hand, the top ranked variables in the Salmonella presence or EHEC marker detection conditional forests may provide insight into what variables are important for inclusion in models that predict pathogen presence in agricultural water. This can be used to determine what additional information should be collected to improve the performance of these predictive models so they can be implemented by industry. However, the complex interactions between variables included in the conditional forest models can make it difficult to assess how a change in one variable alone (e.g., occurrence of rainfall) will impact the outcome (i.e., pathogen presence).
Machine-Learning-Based Models Have Potential for Prediction of Pathogen Contamination Likelihood, Including Real Time Prediction That Does Not Require Microbiological Data
Generic E. coli is traditionally used as a fecal indicator in agricultural water to indicate potentially unhygienic conditions. However, the high cost, slow turnaround time, uneven distribution of generic E. coli in surface waters, and inconsistent relationships between pathogen presence and generic E. coli level limit its value and feasibility of routine use (Pachepsky et al., 2016; Wall et al., 2019). Our data here provide further support that conditional forest models are able to predict the presence of Salmonella and EHEC markers, as supported by AUC values of 0.84 for the Salmonella model and 0.92 for the EHEC marker model (AUC values of 0.8–0.9 are generally indicative of excellent predictive performance; Mandrekar, 2010). Previous studies by Polat et al. (2020) and Weller et al. (2020c) also previously reported that machine learning models show potential as a strategy for identifying contaminated agricultural water in Florida ponds and New York streams, respectively. However, these AUC values from the current study were calculated using cross-validation, as opposed to an independent test dataset, and may be overfit. Regardless, overfitting concerns are mitigated by the fact that the models developed here were developed as a proof of concept and conceptual framework, and not intended for actual use on-farms. If predictive models are going to be developed as an alternative or supplement to indicator-based monitoring, sufficient data is needed, ideally spanning several years and regions, to allow for separate, independent training and test data. Furthermore, additional information is needed to determine if predictive models should be developed for individual waterways, specific regions, or if a standard model can be used across multiple regions.
Importantly, the removal of generic E. coli level as a predictor in the Salmonella presence and EHEC marker detection conditional forests did not substantially decrease predictive performance of either model. This provides evidence that it is possible to eliminate the use of generic E. coli water testing (or other microbial water testing strategies) and replace it with real-time predictive models with limited impact on the accuracy of identifying when water may be contaminated with pathogens and thus at an increased potential risk. These real-time models would be advantageous, as produce growers could estimate the likelihood of pathogen presence in their water sources at the time of water application.
Presenting Predictive Modeling Outcomes as Continuous Risk Measures and Dichotomized Outcomes Have Distinct Advantages
The output of the conditional forest models is the predicted probability that a sample will be positive for Salmonella presence or EHEC marker detection. One method for using this predicted probability for making decisions on how to utilize the water would be to dichotomize the outcome (i.e., pathogen is present or absent) based on if the predicted probability is greater than or less than some set threshold value. If this strategy is used, specificity, sensitivity, positive likelihood ratio, and negative likelihood ratio can be calculated. While the specificity is adequate for our Salmonella model, the sensitivity is low (0.69). This is particularly concerning as this means the model often calls Salmonella-positive samples as negative, and thus may lead to instances where corrective actions (e.g., water treatment) were not performed when they should have been. However, by lowering the threshold value, the sensitivity of the model can be increased, minimizing this risk. A similar phenomenon was observed for the EHEC forest. If predictive models are to be used by produce growers to guide on-farm decision making (e.g., if corrective actions are needed before using water to irrigate crops), optimization of this threshold value is needed. A future quantitative microbial risk assessment would be helpful to identify the risk of illness associated with different threshold values (Uyttendaele et al., 2015; Rock et al., 2019). This information could then be used to optimize what threshold value should be used to balance the predicted number of illnesses vs. the costs associated with different corrective actions (e.g., water treatment). While dichotomizing the outcome of the model, as described above, creates an easier to interpret model, it does cause a loss of information. As an alternative, the predicted probability of a sample being positive could instead be directly used for decision making; however, this would also require quantitative risk assessment to determine how predicted probabilities should be used.
Natural Cover and the Day of Year Are Important for Prediction of Salmonella Presence and EHEC Marker Detection
As previously discussed, there were some differences in variables associated with pathogen presence by multivariable regression and the top ranked variables for predicting pathogen presence by conditional forest. However, a specific discussion of the top ranked variables is important for informing what information should be collected for future refinement of models used to predict pathogen presence in agricultural water. Natural cover variables and the day of year were included in the ten top-ranked predictors in the Salmonella and EHEC forests. For both Salmonella and EHEC, there was a positive monotonic relationship between the percent of natural cover around the sampling site and pathogen presence. Since natural cover may function as habitat for wildlife, this may indicate wildlife is acting as a pathogen source in southwestern US canals; this is supported by the limited number of past studies that examined the prevalence of enteric pathogens in southwestern wildlife (e.g., Jay et al., 2007; Jay-Russell et al., 2014). For example, an Arizona study found 32% (N = 103 total samples) of coyote fecal samples were positive for Salmonella, while none were STEC-positive and 4.9% were enteropathogenic E. coli-positive (Jay-Russell et al., 2014). On the other hand, in a study investigating E. coli O157:H7 in feral swine in the central California coast, 14.9% (13/87) of samples were positive for E. coli O157:H7 (Jay et al., 2007). Since, in the current study, the relationship between natural cover and Salmonella presence and EHEC marker detection is weak, additional research is needed to fully characterize the role wildlife plays as a source of enteric pathogen contamination for southwestern canals. Given the need for additional research, and the important ecosystem services provided by natural cover (e.g., water filtration) and wildlife (e.g., pest control, pollination), the authors want to emphasize we are not advocating the removal of natural cover or wildlife from growing areas (Aarons and Gourley, 2012; Allende et al., 2018; Navarro-Gonzalez et al., 2020).
Temporal trends in Salmonella presence and EHEC marker detection were accounted for by including the day of year each sample was collected on as a predictor in the forests. The day of year was used instead of season, as seasons are arbitrary periods of time; the end of a season is more similar to the beginning of the subsequent season than the beginning of the season itself. As such, using the day of year as a continuous variable reduces bias in the final model by not forcing the data into arbitrary categories. For both models, the probability of a sample being pathogen-positive remained low until approx. September, after which the probability of a positive increased. This likely indicates some event occurs during early fall that leads to an increased likelihood of pathogen contamination of southwestern US canals. For instance, it is possible the canals are cleaned at this time of year, which causes the sediments at the bottom to re-distribute and re-contaminate the water. However, the current study only spanned 1 year so additional research is needed to determine if this relationship holds across time. Despite this limitation, our finding of intra-annual trends in microbial water quality is consistent with past studies that looked at Salmonella (Wilkes et al., 2009; Liang et al., 2013; Cooley et al., 2014; Stea et al., 2015; Tian et al., 2017; Weller et al., 2020b) and EHEC (Shelton et al., 2011; Stea et al., 2015; Nadya et al., 2016; Tian et al., 2017). For instance, Cooley et al. (2014) found a higher Salmonella prevalence in the spring and summer compared to the fall and winter in Central California surface water samples. Furthermore, consistent with our current study, Stea et al. (2015) found a higher prevalence of STEC in the later summer and fall compared to all other seasons in Nova Scotia, Canada. Overall, the data collected to date appear to indicate that enteric pathogen contamination of surface water often shows some type of seasonality, although the specific trends appear to differ across locations and studies.
Limitations
While a large area (~28,000 km2) of the produce growing region in the southwestern US is represented here, stratification for certain land-use or sample site factors was not performed during sample site selection. As such, this could have biased the results (i.e., some potentially important factors could have been missed due to underrepresentation of certain variables). Additionally, since this is a proof of concept, only a small number of samples were collected (N = 169) and each site was only visited few times (1–3 times), which could result in combinations of factors associated with an altered likelihood of pathogen presence being missed (e.g., if the greatest likelihood of Salmonella contamination is after a rain event next to a dairy farm but no samples were collected after a rainfall from a site next to a dairy farm, this signal would have been missed). Therefore, further studies, with larger sampling efforts and spanning multiple years and geographical locations or growing regions, are needed to yield models appropriate for industry use and to answer key questions such as if a single model can be used from water source to water source, if a single model can be used from climate to climate (or region to region), and if a single model can be used over several years. In addition, there are other factors that may be important for pathogen presence in canals such as difference in elevation between surrounding land and the canal, livestock density surrounding the canals (instead of just CAFO presence), land use along canal flow paths, and relative humidity; future model building efforts should consider collecting these data to include in their models. Furthermore, there were several factors with missing data (e.g., flow rate could not be measured at all sites due to safety concerns). This could lead to information bias (i.e., bias caused by a lack of correct or complete information) in logistic regression, but we expect this to be non-differential (i.e., the bias direction is independent of the model outcome), indicating it should not have impacted the results of the study.
Conclusions
Machine learning-based predictive models, such as conditional forest models show promise for predicting Salmonella presence and EHEC marker detection in southwestern US canals used as sources for agricultural water. The use of machine learning models, in addition to regression analysis, provides a more complete assessment of the relationships between spatial and temporal factors and foodborne pathogen presence in agricultural water due to the complexity in the system. Furthermore, the use of predictive modeling, and real-time predictive models (using no microbiological data), may provide an alternative or supplement to traditional generic E. coli testing for fine-tuning when and where food safety hazards may be present in agricultural water and corrective action is needed. The forests developed in the current study specifically indicate that use around the sampling site and day of the year are important predictors for both Salmonella presence and EHEC marker detection in southwestern US canal water. Despite the promising results in this and previous studies, these studies were proof of concept. Therefore, before predictive models can be deployed on farms and integrated into on-farm risk management plans additional research is needed to determine if models can predict pathogen presence accurately for regions, water types (e.g., canal, stream, pond), and years, other than the region(s), water type(s), and year(s) where the training data were collected.
Data Availability Statement
The raw data supporting the conclusions of this article will be made available by the authors, without undue reservation.
Author Contributions
CR, DW, NB, and MW: conceptualized and designed the study. CR and NB: collected the samples. NB, AB, SR, and DW: processed the samples. AB: performed data analysis and model development under the guidance of DW and MW. AB, DW, and MW: wrote the manuscript and all authors assisted in revising the manuscript. All authors contributed to the article and approved the submitted version.
Funding
This study was funded by the Center for Produce Safety (2017CPS09). Data analysis, manuscript preparation, and revision were also partially supported by the National Institute of Environmental Health Sciences, National Institutes of Health (NIH) under award number T32ES007271. This work is supported by the Specialty Crop Research Initiative program, Award Number: 2019-51181-30016 from the USDA National Institute of Food and Agriculture. Any opinions, findings, conclusions, or recommendations expressed in this publication are those of the author(s) and do not necessarily reflect the view of the U.S. Department of Agriculture.
Conflict of Interest
The authors declare that the research was conducted in the absence of any commercial or financial relationships that could be construed as a potential conflict of interest.
Publisher's Note
All claims expressed in this article are solely those of the authors and do not necessarily represent those of their affiliated organizations, or those of the publisher, the editors and the reviewers. Any product that may be evaluated in this article, or claim that may be made by its manufacturer, is not guaranteed or endorsed by the publisher.
Acknowledgments
We would like to thank Maureen Gunderson, Kayla Ferris, Nathanael Henderson, Julia Muuse, and Sriya Sunil for their help on various aspects of this project. We would also like to acknowledge the various irrigation districts within the Southwest growing region for allowing our team to collect agricultural water samples and providing guidance on sampling locations appropriate for the study.
Supplementary Material
The Supplementary Material for this article can be found online at: https://www.frontiersin.org/articles/10.3389/frwa.2021.693631/full#supplementary-material
References
Aarons, S. R., and Gourley, C. J. P. (2012). The role of riparian buffer management in reducing off-site impacts from grazed dairy systems. Renew. Agric. Food Syst. 28, 1–16. doi: 10.1017/S1742170511000548
Allende, A., Datta, A. R., Smith, W. A., Adonis, R., MacKay, A., and Adell, A. D. (2018). Implications of new legislation (US FSMA) and guidelines (EC) on the establishment of management systems for agricultural water. Food Microbiol. 75, 119–125. doi: 10.1016/j.fm.2017.10.002
Allende, A., and Monaghan, J. (2015). Irrigation water quality for leafy crops: a perspective of risks and potential solutions. Int. J. Environ. Res. Public. Health. 12, 7457–7477. doi: 10.3390/ijerph120707457
Baker, C. A., De, J., Bertoldi, B., Dunn, L., Chapin, T., Jay-Russell, M., et al. (2019). Prevalence and concentration of stx+ E. coli and E. coli O157 in bovine manure from Florida farms. PLoS ONE. 14:e0217445. doi: 10.1371/journal.pone.0217445
Bates, D., Maechler, M., Bolker, B., and Walker, S. (2015). Fitting linear mixed-effects models using lme4. J. Stat. 67, 1–48. doi: 10.18637/jss.v067.i01
Beauvais, W., Gart, E. V., Bean, M., Blanco, A., Wilsey, J., McWhinney, K., et al. (2018). The prevalence of Escherichia coli O157:H7 fecal shedding in feedlot pens is affected by the water-to-cattle ratio: a randomized controlled trial. PLoS ONE. 13:e0192149. doi: 10.1371/journal.pone.0192149
Benjamin, L., Atwill, E. R., Jay-Russell, M., Cooley, M., Carychao, D., Gorski, L., et al. (2013). Occurrence of generic Escherichia coli, E. coli O157 and Salmonella spp. in water and sediment from leafy green produce farms and streams of the Central California Coast. Int. J. Food Microbiol. 165, 65–76. doi: 10.1016/j.ijfoodmicro.2013.04.003
Bettelheim, K. A. (2007). The non-O157 shiga-toxigenic (verotoxigenic) Escherichia coli; under-rated pathogens. Crit. Rev. Microbiol. 33, 67–87. doi: 10.1080/10408410601172172
Bischl, B., Lang, M., Kotthoff, L., Schiffner, J., Richter, J., Studerus, E., et al. (2016). mlr: Machine Learning in R. J. Mach. Learn. Res. 17, 1–5. Available online at: http://jmlr.org/papers/v17/15-066.html.
Bradshaw, J. K., Snyder, B. J., Oladeinde, A., Spidle, D., Berrang, M. E., Meinersmann, R. J., et al. (2016). Characterizing relationships among fecal indicator bacteria, microbial source tracking markers, and associated waterborne pathogen occurrence in stream water and sediments in a mixed land use watershed. Water Res. 101, 498–509. doi: 10.1016/j.watres.2016.05.014
California Leafy Greens Marketing Agreement (2020). Commodity Specific Food Safety Guidelines for Production and Harvest of Lettuce and Leafy Greens. Available online at: https://lgma-assets.sfo2.digitaloceanspaces.com/downloads/CA_LGMA_METRICS_FINAL_VERSION_Accessible_Jan2020.pdf (accessed on July 2, 2020).
Callejon, R. M., Rodriguez-Naranjo, M. I., Ubeda, C., Hornedo-Ortega, R., Garcia-Parrilla, M. C., and Troncoso, A. M. (2015). Reported foodborne outbreaks due to fresh produce in the United States and European Union: trends and causes. Foodborne Pathog. Dis. 12, 32–38. doi: 10.1089/fpd.2014.1821
Castro-Ibanez, I., Gil, M. I., Tudela, J. A., Ivanek, R., and Allende, A. (2015). Assessment of microbial risk factors and impact of meteorological conditions during production of baby spinach in the Southeast of Spain. Food Microbiol. 49, 173–181. doi: 10.1016/j.fm.2015.02.004
Cooley, M. B., Quinones, B., Oryang, D., Mandrell, R. E., and Gorski, L. (2014). Prevalence of shiga toxin producing Escherichia coli, Salmonella enterica, and Listeria monocytogenes at public access watershed sites in a California Central Coast agricultural region. Front. Cell. Infect. Microbiol. 4:30. doi: 10.3389/fcimb.2014.00030
Delaquis, P., Bach, S., and Dinu, L. D. (2007). Behavior of Escherichia coli O157:H7 in leafy vegetables. J. Food Prot. 70, 1966–1974. doi: 10.4315/0362-028X-70.8.1966
Duffy, E. A., Lucia, L. M., Kells, J. M., Castillo, A., Pillai, S. D., and Acuff, G. R. (2005). Concentrations of Escherichia coli and genetic diversity and antibiotic resistance profiling of Salmonella isolated from irrigation water, packing shed equipment, and fresh produce in Texas. J. Food Prot. 68, 70–79. doi: 10.4315/0362-028X-68.1.70
European Commission (2017). Commission Notice on Guidance Document on Addressing Microbiological Risks in Fresh Fruits and Vegetables at Primary Production Through Good Hygiene. Official Journal of the European Union.
Falardeau, J., Johnson, R. P., Pagotto, F., and Wang, S. (2017). Occurrence, characterization, and potential predictors of verotoxigenic Escherichia coli, Listeria monocytogenes, and Salmonella in surface water used for produce irrigation in the Lower Mainland of British Columbia, Canada. PLoS ONE. 12:e0185437. doi: 10.1371/journal.pone.0185437
Franz, E., Schijven, J., de Roda Husman, A. M., and Blaak, H. (2014). Meta-regression analysis of commensal and pathogenic Escherichia coli survival in soil and water. Environ. Sci. Technol. 48, 6763–6771. doi: 10.1021/es501677c
Freshcare (2020). Food Safety and Quality Standard Edition 4.2. Available online at: https://www.freshcare.com.au/wp-content/uploads/Freshcare-Food-Safety-Quality-Standard-Edition-4.2-JAN-2021.pdf (accessed May 22, 2021).
Gore, J. A., and Banning, J. (2017). Discharge measurements and streamflow analysis, in Methods in Stream Ecology, 3rd ed, eds F. R. Hauer, and G. Lamberti (Salt Lake City, UT: Academic Press), 49–70.
Greene, S. K., Daly, E. R., Talbot, E. A., Demma, L. J., Holzbauer, S., Patel, N. J., et al. (2008). Recurrent multistate outbreak of Salmonella Newport associated with tomatoes from contaminated fields, 2005. Epidemiol. Infect. 136, 157–165. doi: 10.1017/S095026880700859X
Haley, B. J., Cole, D. J., and Lipp, E. K. (2009). Distribution, diversity, and seasonality of waterborne Salmonellae in a rural watershed. Appl. Environ. Microbiol. 75, 1248–1255. doi: 10.1128/AEM.01648-08
Hanning, I. B., Nutt, J. D., and Ricke, S. C. (2009). Salmonellosis outbreaks in the United States due to fresh produce: sources and potential intervention methods. Foodborne Pathog. Dis. 6, 635–648. doi: 10.1089/fpd.2008.0232
Haymaker, J., Sharma, M., Parveen, S., Hashem, F., May, E. B., Handy, E. T., et al. (2019). Prevalence of shiga-toxigenic and atypical enteropathogenic Escherichia coli in untreated surface water and reclaimed water in the Mid-Atlantic U.S. Environ. Res. 172, 630–636. doi: 10.1016/j.envres.2019.02.019
Holvoet, K., Sampers, I., Seynnaeve, M., and Uyttendaele, M. (2014). Relationship among hygiene indicators and enteric pathogens in irrigation water, soil and lettuce and the impact of climatic conditions on contamination in the lettuce primary production. Int. J. Food Microbiol. 171, 21–31. doi: 10.1016/j.ijfoodmicro.2013.11.009
Hothorn, T., Buehlmann, P., Dudoit, S., Molinaro, A., and Van Der Laan, M. (2006). Survival Ensembles. Biostatistics 7, 355–373. doi: 10.1093/biostatistics/kxj011
Jamieson, R., Gordon, R., Joy, D., and Lee, H. (2004). Assessing microbial pollution of rural surface waters: a review of current watershed scale modeling approaches. Agric. Water Manag. 70, 1–17. doi: 10.1016/j.agwat.2004.05.006
Jay, M. T., Cooley, M., Carychao, D., Wiscomb, G. W., Sweitzer, R. A., Crawford-Miksza, L., et al. (2007). Escherichia coli O157:H7 in feral swine near spinach fields and cattle, central California coast. Emerg. Inf. Dis. 13, 1908–1911. doi: 10.3201/eid1312.070763
Jay-Russell, M. T., Hake, A. F., Bengson, Y., Thiptara, A., and Nguyen, T. (2014). Prevalence and characterization of Escherichia coli and Salmonella strains isolated from stray dog and coyote feces in a major leafy greens production region at the United States–Mexico border. PLoS ONE. 9:e113433. doi: 10.1371/journal.pone.0113433
Johnson, J. Y. M., Thomas, J. E., Graham, T. A., Townshend, I., Byrne, J., Selinger, L. B., et al. (2003). Prevalence of Escherichia coli O157:H7 and Salmonella spp. in surface waters of southern Alberta and its relation to manure sources. Can. J. Microbiol. 49, 326–335. doi: 10.1139/w03-046
Kim, J. S., Lee, G. G., Park, J. S., Jung, Y. H., Kwak, H. S., Kim, S. B., et al. (2007). A novel multiplex PCR assay for rapid and simultaneous detection of five pathogenic bacteria: Escherichia coli O157:H7, Salmonella, Staphylococcus aureus, Listeria monocytogenes, and Vibrio parahaemolyticus. J. Food Prot. 70, 1656–1662. doi: 10.4315/0362-028X-70.7.1656
Kuhn, M. (2020). caret: Classification and Regression Training. R package version 6.0–86. Available online at: https://CRAN.R-project.org/package=caret (accessed March 01, 2021).
Liang, Z., He, Z., Zhou, X., Powell, C. A., Yang, Y., He, L. M., et al. (2013). Impact of mixed land-use practices on the microbial water quality in a subtropical coastal watershed. Sci. Total Environ. 449, 426–433. doi: 10.1016/j.scitotenv.2013.01.087
Liu, H., Whitehouse, C. A., and Li, B. (2018). Presence and persistence of Salmonella in water: the impact on microbial quality of water and food safety. Front. Public Health. 6:159. doi: 10.3389/fpubh.2018.00159
Lopez-Galvez, F., Allende, A., Pedrero-Salcedo, F., Alarcon, J. J., and Gil, M. I. (2014). Safety assessment of greenhouse hydroponic tomatoes irrigation with reclaimed and surface water. Int. J. Food Microbiol. 191, 97–102. doi: 10.1016/j.ijfoodmicro.2014.09.004
Lothrop, N., Bright, K. R., Sexton, J., Pearce-Walker, J., Reynolds, K. A., and Verhougstraete, M. P. (2018). Optimal strategies for monitoring irrigation water quality. Agric. Water Manag. 199, 86–92. doi: 10.1016/j.agwat.2017.12.018
Lu, L., Hume, M. E., Sternes, K. L., and Pillai, S. D. (2004). Genetic diversity of Escherichia coli isolates in irrigation water and associated sediments: implications for source tracking. Water Res. 38, 3899–3908. doi: 10.1016/j.watres.2004.06.020
Mandrekar, J. N. (2010). Receiver operating characteristic curve in diagnostic test assessment. J Thorac. Oncol. 5, 1315–1316. doi: 10.1097/JTO.0b013e3181ec173d
Mootian, G., Wu, W. H., and Matthews, K. R. (2009). Transfer of Escherichia coli O157:H7 from soil, water, and manure contaminated with low numbers of the pathogen to lettuce plants. J. Food Prot. 72, 2308–2312. doi: 10.4315/0362-028X-72.11.2308
Muniesa, M., Jofre, J., Garcia-Aljaro, C., and Blanch, A. R. (2006). Occurrence of Escherichia coli O157:H7 and other enterohemorrhagic Escherichia coli in the environment. Environ. Sci. Technol. 40, 7141–7149. doi: 10.1021/es060927k
Nadya, S., Delaquis, P., Chen, J., Allen, K., Johnson, R. P., Ziebell, K., et al. (2016). Phenotypic and genotypic characteristics of shiga toxin-producing Escherichia coli isolated from surface waters and sediments in a Canadian urban-agricultural landscape. Front. Cell. Infect. Microbiol. 6:36. doi: 10.3389/fcimb.2016.00036
Navarro-Gonzalez, N., Wright, S., Aminabadi, P., Gwinn, A., Suslow, T. V., and Jay-Russell, M. T. (2020). Carriage and subtypes of foodborne pathogens identified in wild birds residing near agricultural lands in California: a repeated cross-sectional study. Appl. Environ. Microbiol. 86, e01678–e01619. doi: 10.1128/AEM.01678-19
Pachepsky, Y., Shelton, D., Dorner, S., and Whelan, G. (2016). Can E. coli or thermotolerant coliform concentrations predict pathogen presence or prevalence in irrigation waters? Crit. Rev. Microbiol. 42, 384–393. doi: 10.3109/1040841X.2014.954524
Pachepsky, Y., Shelton, D. R., McLain, J. E. T., Patel, J., and Mandrell, R. E. (2011). Irrigation waters as a source of pathogenic microorganisms in produce: a review. Adv. Agron. 113, 73–138. doi: 10.1016/B978-0-12-386473-4.00002-6
Park, S., Szonyi, B., Gautam, R., Nightingale, K., Aniciso, J., and Ivanek, R. (2012). Risk factors for microbial contamination in fruits and vegetables at the preharvest level: a systematic review. J. Food Prot. 75, 2055–2081. doi: 10.4315/0362-028X.JFP-12-160
Partyka, M. L., Bond, R. F., Chase, J. A., and Atwill, E. R. (2018). Spatiotemporal variability in microbial quality of western U.S. agricultural water supplies: a multistate study. J. Environ. Qual. 47, 939–948. doi: 10.2134/jeq2017.12.0501
Polat, H., Topalcengiz, Z., and Danyluk, M. D. (2020). Prediction of Salmonella presence and absence in agricultural surface waters by artificial intelligence approaches. J. Food Saf. 40:e12733. doi: 10.1111/jfs.12733
R Core Team (2021). R: A Language and Environment for Statistical Computing. Vienna: Foundation for Statistical Computing. Available online at: https://www.R-project.org/ (accessed March 01, 2021).
Rock, C. M., Brassill, N., Dery, J. L., Carr, D., McLain, J. E., Bright, K. R., et al. (2019). Review of water quality criteria for water reuse and risk-based implications for irrigated produce under the FDA Food Safety Modernization Act, produce safety rule. Environ. Res. 172, 616–629. doi: 10.1016/j.envres.2018.12.050
Savichtcheva, O., Okayama, N., and Okabe, S. (2007). Relationships between Bacteroides 16S rRNA genetic markers and presence of bacterial enteric pathogens and conventional fecal indicators. Water Res. 41, 3615–3628. doi: 10.1016/j.watres.2007.03.028
Sbodio, A., Maeda, S., Lopez-Velasco, G., and Suslow, T. V. (2013). Modified Moore swab optimization and validation in capturing E. coli O157:H7 and Salmonella enterica in large volume field samples of irrigation water. Food Res. Int. 51, 654–662. doi: 10.1016/j.foodres.2013.01.011
Shelton, D. R., Karns, J. S., Coppock, C., Patel, J., Sharma, M., and Pachepsky, Y. A. (2011). Relationship between eae and stx virulence genes and Escherichia coli in an agricultural watershed: implications for irrigation water standards and leafy green commodities. J. Food Prot. 74, 18–23. doi: 10.4315/0362-028X.JFP-10-241
Stea, E. C., Truelstrup Hansen, L., Jamison, R. C., and Yost, C. K. (2015). Fecal contamination in the surface waters of a rural and an urban-source watershed. J. Environ. Qual. 44, 1556–1567. doi: 10.2134/jeq2014.11.0459
Strawn, L. K., Fortes, E. D., Bihn, E. A., Nightingale, K. K., Grohn, Y. T., Worobo, R. W., et al. (2013a). Landscape and meteorological factors affecting prevalence of three food-borne pathogens in fruit and vegetable farms. Appl. Environ. Microbiol. 79, 588–600. doi: 10.1128/AEM.02491-12
Strawn, L. K., Grohn, Y. T., Warchocki, S., Worobo, R. W., Bihn, E. A., and Wiedmann, M. (2013b). Risk factors associated with Salmonella and Listeria monocytogenes contamination of produce fields. Appl. Environ. Microbiol. 79, 7618–7627. doi: 10.1128/AEM.02831-13
Strobl, C., Boulesteix, A.L, Kneib, T., Augustin, T., and Zeileis, A. (2008). Conditional variable importance for random forests. BMC Bioinform. 9:307. doi: 10.1186/1471-2105-9-307
Strobl, C., Boulesteix, A. L., Zeileis, A., and Hothorn, T. (2007). Bias in random forest variable importance measures: illustrations, sources and a solution. BMC Bioinform. 8:25. doi: 10.1186/1471-2105-8-25
Tam, S., and Petersen, A. (2014). B.C. Sprinkler Irrigation Manual. British Columbia Ministry of Agriculture. Available online at: https://www2.gov.bc.ca/assets/gov/farming-natural-resources-and-industry/agriculture-and-seafood/agricultural-land-and-environment/water/irrigation/sprinkler-irrigation-manual/563000-1_web_titlepage_preface_tofc.pdf (accessed July 2, 2020).
Tanaro, J. D., Piaggio, M. C., Galli, L., Gasparovic, A. M. C., Procura, F., Molina, D. A., et al. (2014). Prevalence of Escherichia coli O157:H7 in surface water near cattle feedlots. Foodborne Pathog. Dis. 11, 960–965. doi: 10.1089/fpd.2014.1770
Tian, P., Yang, D., Shan, L., Wang, D., Li, Q., Gorski, L., et al. (2017). Concurrent detection of human norovirus and bacterial pathogens in water samples from an agricultural region in Central California Coast. Front. Microbiol. 8:1560. doi: 10.3389/fmicb.2017.01560
Truchado, P., Hernandez, N., Gil, M. I., Ivanek, R., and Allende, A. (2018). Correlation between E. coli levels and the presence of foodborne pathogens in surface water: establishment of a sampling program. Water Res. 128, 226–233. doi: 10.1016/j.watres,.2017.10.041
U. S. Centers for Disease Control Prevention (2006). Multistate Outbreak of E. coli O157:H7 Infections Linked to fResh Spinach (Final Update). Available online at: https://www.cdc.gov/ecoli/2006/spinach-10-2006.html (accessed July, 2, 2020).
U. S. Centers for Disease Control Prevention (2018a). Multistate Outbreak of Shiga Toxin—Producing Escherichia coli O157:H7 Infections Linked to Leafy Greens (Final Update). Available online at: https://www.cdc.gov/ecoli/2017/o157h7-12-17/index.html (accessed July 2, 2020).
U. S. Centers for Disease Control Prevention (2018b). Multistate Outbreak of E. coli O157:H7 Infections Linked to Romaine Lettuce (Final Update). Available online at: https://www.cdc.gov/ecoli/2018/o157h7-04-18/index.html (accessed July, 2, 2020).
U. S. Food Drug Administration (2015). Standards for the Growing, Harvesting, Packing, and Holding of Produce for Human Consumption. Final Rule, Docket No. FDA-2011-N-0921. Available online at: https://www.federalregister.gov/documents/2015/11/27/2015-28159/standards-for-the-growing-harvesting-packing-and-holding-of-produce-for-human-consumption (accessed on July 2 2019).
Uyttendaele, M., Jaykus, L. A., Amoah, P., Chiodini, A., Cunliffe, D., Jacxsens, L., et al. (2015). Microbial hazards in irrigation water: standards, norms, and testing to manage use of water in fresh produce primary production. Compr. Rev. Food Sci. Food Saf. 14, 336–356. doi: 10.1111/1541-4337.12133
Wall, G. L., Clements, D. P., Fisk, C. L., Stoeckel, D. M., Woods, K. L., and Bihn, E. A. (2019). Meeting report: key outcomes from a collaborative summit on agricultural water standards for fresh produce. Compr. Rev. Food Sci. Food Saf. 18, 723–737. doi: 10.1111/1541-4337.12434
Weller, D., Belias, A., Green, H., Roof, S., and Wiedmann, M. (2020a). Landscape, water quality, and weather factors associated with an increased likelihood of foodborne pathogen contamination of New York streams used to source water for produce production. Front. Sustain. Food Syst. 3:124. doi: 10.3389/fsufs.2019.00124
Weller, D., Brassill, N., Rock, C., Ivanek, R., Mudrak, E., Roof, S., et al. (2020b). Complex interactions between weather, and microbial and physicochemical water quality impact the likelihood of detecting foodborne pathogens in agricultural water. Front. Microbiol. 11:134. doi: 10.3389/fmicb.2020.00134
Weller, D., Love, T., Belias, A., and Wiedmann, M. (2020c). Predictive models may complement existing E. coli water quality testing for managing enteric pathogen contamination of Northeastern streams used for produce production. Front. Sustain. Food Syst. 4:561517. doi: 10.3389/fsufs.2020.561517
Wilkes, G., Edge, T., Gannon, V., Jokinen, C., Lyautey, E., Medeiros, D., et al. (2009). Seasonal relationships among indicator bacteria, pathogenic bacteria, Cryptosporidium oocysts, Giardia cysts, and hydrological indices for surface waters within an agricultural landscape. Water Res. 43, 2209–2223. doi: 10.1016/j.watres.2009.01.033
Wilkes, G., Edge, T. A., Gannon, V. P. J., Jokinen, C., Lyautey, E., Neumann, N. F., et al. (2011). Associations among pathogenic bacteria, parasites, and environmental and land use factors in multiple mixed-use watersheds. Water Res. 45, 5807–5825. doi: 10.1016/j.watres.2011.06.021
Yang, L., Jin, S., Danielson, P., Homer, C., Gass, L., Bender, S. M., et al. (2018). A new generation of the United States National Land Cover Database: requirements, research priorities, design, and implementation strategies. ISPRS J. Photogramm. Remote Sens. 146, 108–123. doi: 10.1016/j.isprsjprs.2018.09.006
Keywords: Salmonella, E. coli, agricultural water, Arizona, produce safety, predictive modeling
Citation: Belias A, Brassill N, Roof S, Rock C, Wiedmann M and Weller D (2021) Cross-Validation Indicates Predictive Models May Provide an Alternative to Indicator Organism Monitoring for Evaluating Pathogen Presence in Southwestern US Agricultural Water. Front. Water 3:693631. doi: 10.3389/frwa.2021.693631
Received: 11 April 2021; Accepted: 07 July 2021;
Published: 05 August 2021.
Edited by:
Nynke Hofstra, Wageningen University and Research, NetherlandsReviewed by:
Petros Kokkinos, Hellenic Open University, GreeceBaiba Vilne, Riga Stradiṇš University, Latvia
Copyright © 2021 Belias, Brassill, Roof, Rock, Wiedmann and Weller. This is an open-access article distributed under the terms of the Creative Commons Attribution License (CC BY). The use, distribution or reproduction in other forums is permitted, provided the original author(s) and the copyright owner(s) are credited and that the original publication in this journal is cited, in accordance with accepted academic practice. No use, distribution or reproduction is permitted which does not comply with these terms.
*Correspondence: Daniel Weller, d2VsbGVyZDJAZ21haWwuY29t