
95% of researchers rate our articles as excellent or good
Learn more about the work of our research integrity team to safeguard the quality of each article we publish.
Find out more
ORIGINAL RESEARCH article
Front. Water , 07 July 2021
Sec. Water and Critical Zone
Volume 3 - 2021 | https://doi.org/10.3389/frwa.2021.675284
This article is part of the Research Topic Watershed and Stream: the Inseparable Functional/Biogeochemical Unit View all 9 articles
 Nolan J. T. Pearce1*
 Daniel E. Spooner1†Jessica M. Plourde1Henry F. Wilson2†
 Paul C. Frost1
 Marguerite A. Xenopoulos1
The intersection between land cover and topography at the subcatchment scale can generate spatial heterogeneity in carbon (C), nitrogen (N), and phosphorus (P) supplies and alter ecological stoichiometry within river networks. Recognition of spatial patterns in the balance of energy and elements at the stream network scale is needed to increase our comprehension of the importance that watershed physiography has on stream functionality. Here we assessed the influence of topographically weighted land cover on the ecological stoichiometry of stream water, periphyton, and benthic macroinvertebrates among 18 stream segments within the Beaver River watershed (Ontario, Canada). Natural and anthropogenic land cover classes were topographically weighted within each subcatchment by increasing the weight of land cover located in hydrologically connected areas of the landscape (i.e., proximity to stream network, flow distance to sampling location, and flow accumulation). Univariate regression models were used to evaluate the influence of topographically weighted land cover and land use on the C, N, and P content and ratios of stream water, periphyton, and benthic macroinvertebrate consumers while accounting for spatial autocorrelation within the river network. We found that topographically weighted developed land was largely associated with the balance and concentrations of nutrients in stream water and primary consumer nutrient ratios, whereas topographically weighted agriculture inversely correlated with natural and wetland cover was associated with periphyton stoichiometry in addition to that of stream water and primary consumers. Spatial patterns in primary consumer elemental composition coincided with that of stream water and periphyton indicating a potential intermediary effect of land use on resource quality. Our results suggest that heterogeneity in the spatial arrangement of land cover within river networks can influence the ecological stoichiometry of stream water, periphyton, and benthic macroinvertebrates at the subcatchment scale.
The spatial arrangement of land cover and/or land use within stream catchments can strongly influence water chemistry (King et al., 2005). Areas on the landscape with topographic characteristics that increase hydrologic connectivity to stream networks (e.g., slope, flow accumulation, flow/Euclidean distance to streams, and soil infiltration capacity) appear to have a disproportionate influence on stream ecosystem conditions (King et al., 2005; Peterson et al., 2011; Staponites et al., 2019). Accounting for spatial considerations when linking catchment land cover to stream ecosystems has thus regularly increased the amount of variance explained in statistical models resulting in an improved understanding of landscape drivers of stream chemistry (Peterson et al., 2011; Yates et al., 2014; Staponites et al., 2019).
Nutrient enrichment is widespread and ubiquitous in streams draining agricultural and developed watersheds (Paul and Meyer, 2001; Allan, 2004). Moreover, some types of human activities can disproportionately increase nitrogen and phosphorus loads and, in combination with diverse hydrologic transport pathways, can result in altered ratios of C, N, and P exported from the landscape (Arbuckle and Downing, 2001; Green et al., 2007; Green and Finlay, 2010). Differences in the concentration and balance of nutrients in streams draining human altered landscapes may further influence the elemental composition of periphyton and detritus (Stelzer and Lamberti, 2001; Cross et al., 2003; Chiandet and Xenopoulos, 2011; Prater et al., 2017), which can affect how nutrients are incorporated at higher trophic levels (Frost et al., 2002; Small and Pringle, 2010; Spooner et al., 2013). These hierarchical changes to the elemental composition of stream ecosystems may consequently have implications for stream food webs and nutrient cycling along river networks (Cross et al., 2005; Wilson and Xenopoulos, 2011; Spooner et al., 2013).
Ecological stoichiometry has previously been used as a framework to examine the influence of land use on the balance of nutrients in stream ecosystems (Frost et al., 2009; O'Brien and Wehr, 2010; Milanovich et al., 2014; Ren et al., 2020). Human land use, and corresponding changes in stream water nutrient supplies, have been regularly shown to influence periphyton nutrient content and ratios (O'Brien and Wehr, 2010; Liess et al., 2012; Spooner et al., 2013), but this is less clear for benthic macroinvertebrate consumers (Persson et al., 2010). For example, some benthic macroinvertebrate taxa appear to exhibit relatively strong elemental homeostasis (Cross et al., 2005; Persson et al., 2010). Many factors may influence variability in the elemental composition of benthic macroinvertebrates (e.g., population genetics, ontogeny, adaptive feeding regimes, and post-assimilative metabolism; Hessen et al., 2013; Halvorson and Small, 2016); however, there is much interest in the effect of resource stoichiometry on benthic macroinvertebrates as an intermediary bottom-up effect of nutrient enrichment (Evans-White and Halvorson, 2017). Indeed, laboratory research has shown deviations in consumer stoichiometry with resource quality (Frost et al., 2002; Liess and Hillebrand, 2006); an observation also noted in some experimentally controlled field studies (Cross et al., 2003; Small and Pringle, 2010). Human modification of stream catchments can affect spatial variability in nutrient supplies in addition to the severity of other physiological stressors, thus land use has the potential to explain spatial variation in the elemental composition of stream food webs. Although past studies have linked land use to changes in the stoichiometry of streams at regional scales (O'Brien and Wehr, 2010; Liess et al., 2012), few studies have examined how the topographic position of land use can influence nutrient sources and processing at the local scale within mixed land use watersheds.
The goal of our study was to describe the association between the elemental composition of multiple stream trophic levels and the spatial arrangement of land cover along a single river network at the subcatchment scale. We measured the molar ratios of carbon (C), nitrogen (N), and phosphorus (P) and the nutrient content/concentrations of stream water, periphyton, primary consumers, and secondary consumers in 18 stream segments. Topographically weighted land cover and land use (i.e., agriculture, urban, natural, and wetland) was regressed with the C, N, and P content and ratios of each trophic position to describe spatial patterns in ecological stoichiometry within a river network. We hypothesized that stream segments draining more connected anthropogenic land uses would have increased nutrient concentrations and have periphyton and consumers assemblages with higher nutrient contents and lower C: nutrient ratios. We further expected that the variation explained in elemental composition would decrease or be absent at higher trophic positions because consumers are less flexible in their elemental composition than periphyton.
Our study took place in the mixed-wood plains ecoregion of south-central Ontario, Canada. Regional climate is temperate with a mean annual temperature and precipitation that ranges from 4.9 to 7.8°C and 759 to 1,087 mm, respectively (Crins et al., 2009). South-central Ontario is reflective of a post-glacial landscape with a rolling terrain underlain by dolomitic and limestone bedrock (Crins et al., 2009). We sampled 18 stream segments within the Beaver River watershed located in the center of the mixed-wood plains ecoregion which flows northwest into Lake Simcoe (Figure 1). The Beaver River watershed drains about 327 km2 of a largely agricultural landscape (64%) with remnant natural areas (32%) and dispersed developed centers (1.7%) throughout (Lake Simcoe Conservation Authority, 2012). Study sites were selected within the Beaver River network to capture stream segments that differed in Strahler order and local land cover composition. Eleven sites were located within the main branch of the Beaver River network (East) and seven sites were located within the Vrooman Creek tributary network (West).
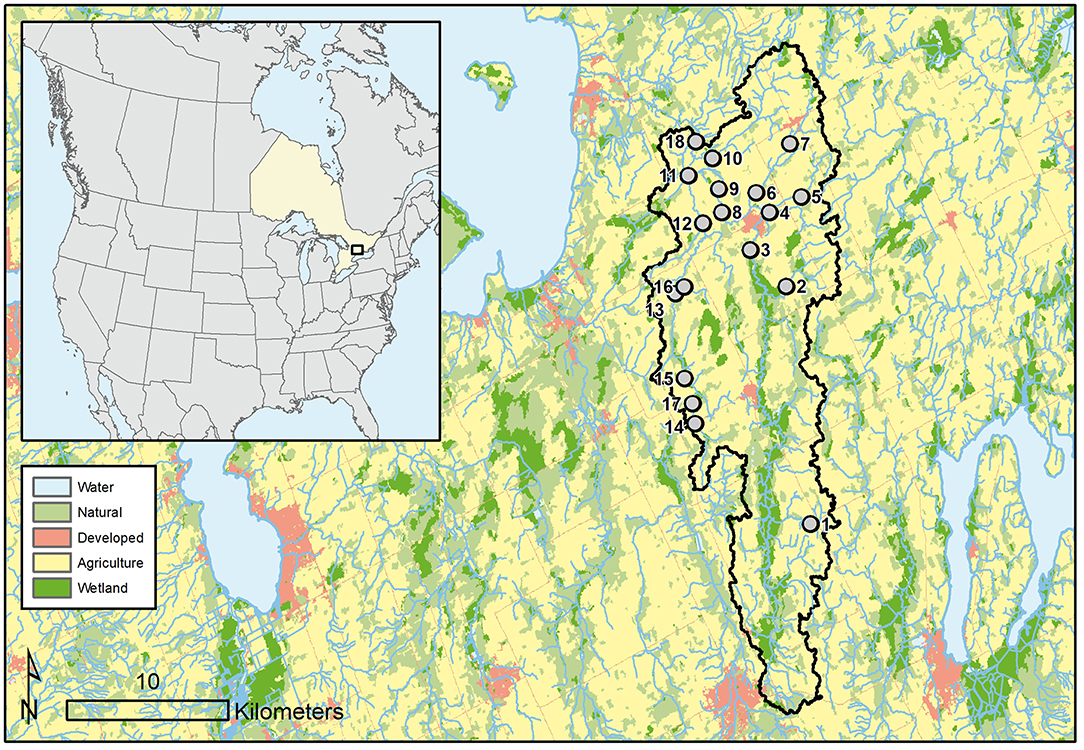
Figure 1. Location of the Beaver River watershed (Ontario, Canada) and the position of the 18 sampled stream segments along the river network.
Subcatchment boundaries of each study site were delineated in ArcGIS (Environmental Systems Research Institute, 2019) with geospatial data obtained from the Ontario Ministry of Natural Resources and Forestry (watercourse; Ontario Ministry of Natural Resources Forestry, 2019) and National Aeronautics and Space Administration (30 m digital elevation model; ASTER Science Team, 2019). Land cover and land use information was obtained from Agriculture and Agri-food Canada's Annual Crop Inventory (Agriculture and Agri-Food Canada, 2011) and aggregated into five classes: agriculture, natural, wetland, developed, and water. Because land cover located in hydrologically connected areas within stream catchments can disproportionately influence stream ecosystems, land cover composition was weighted based on the local topography and hydrological connectivity within stream subcatchments [see Peterson et al. (2011), Staponites et al. (2019)]. With our approach, the landscape within the 18 delineated subcatchments was inversely weighted (exponent: −0.75) based on the Euclidian distance of each raster cell to the stream network multiplied by the inverse weighted (exponent: −0.75) flow distance to the sampling location (subcatchment outlet) and by natural log of the cell's associated flow accumulation. Prior to product computation, inverse Euclidian distance, inverse flow distance, and natural log transformed flow accumulation were normalized with additional weight (5×) given to the flow accumulation layer. Weighted raster values were then summed within each land class and expressed as a proportion of the total weighted surface to describe the topographically weighted land cover and land use composition (Figure 2). Weighting coefficients were selected to best represent the influence of land cover and land use at the local (i.e., segment and/or reach) scale (Yates et al., 2014).
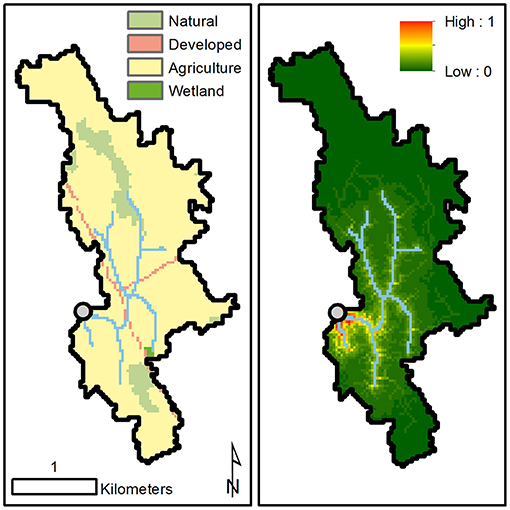
Figure 2. Illustration of the land cover and land use composition within a stream subcatchment (left) and the most influential spatial locations (right) based on the topographic weighing scheme used in this study. Highly influential areas (weight = 1 and/or warmer colors) indicate hydrologically connected areas that are proximal to the stream network based on Euclidean distance, are proximal to the sampling point based on flow distance, and have large flow accumulation areas. Site 1 is shown.
Field sampling at each study site took place over a ~2-week period in mid-summer (August). Benthic macroinvertebrates were collected within a riffle habitat using a traveling kick method with a 500 μm D-frame mesh kick net. Collected macroinvertebrates were sorted in the field according to commonly found orders (i.e., Anisoptera, Arhynchobdellida, Decapoda, Diptera (Tipulidae), Ephemeroptera, Gastropoda, Megaloptera, Trichoptera, and Zygoptera) and placed into separate Whirl Pak bags on ice to allow for stomach evacuation (several hours or overnight, see Evans-White et al., 2005). Following stomach evacuation, benthic macroinvertebrates (snail shells removed) were immediately placed in a drying-oven (60°C) and dried for 24 h or until consistent dry weights were attained using a digital microbalance (Mettler Toledo mx5; ± 1 μg). Dried macroinvertebrates were used for nutrient content analysis.
Immediately upstream of benthic macroinvertebrate collection, several rocks (~ 10) were collected to obtain a sample of periphyton (i.e., an aggregate or mixture of benthic algae, bacteria, detritus, and inorganic material) that represented one potential basal food source available to the macroinvertebrate community at each study site. Periphyton samples were placed in plastic Nalgene bottles and stored on ice for transport. In the laboratory, periphyton samples were filtered onto Whatman GF/F glass fiber filter papers (0.7 μm) and dried at 60°C for 24 h or until consistent dry weights were attained using a digital microbalance. Dried periphyton was used for nutrient content analysis.
Water samples were also collected at each study site to measure major nutrient concentrations (TDN, DOC, and TP). A 1 L grab sample of stream water was collected from the thalweg at 60% depth and stored on ice in an acid washed Nalgene bottle (<24 h) prior to laboratory processing. Water samples were first filtered using Whatman GF/F glass fiber filters (0.7 μm) and then polycarbonate membrane filters (0.22 μm) and analyzed for DOC and TDN by combustion (OI Analytical Aurora model 1030) (Wilson and Xenopoulos, 2008). TP was measured from the unfiltered water using an autoclaved persulfate (10%) digestion and a molybdate blue-ascorbic acid colorimetric technique with a Varian Cary 50 Bio UV-Visible Spectrophotometer (American Public Health Association, 1992).
Dried benthic macroinvertebrates (grouped by order) and periphyton samples were crushed into a fine homogeneous powder prior nutrient content analysis. Two subsamples were used as analytical replicates and processed for C, N, and P content. Whole individuals were used as analytical replicates for small bodied invertebrate taxa (Trichoptera and Ephemeroptera). C and N content of dried biological samples were measured using a Elementar Vario EL III CN analyzer and expressed as a percentage of dry weight (%C and %N). P content per dry weight (%P) was measured using molybdate blue-ascorbic acid colorimetry following an autoclaved persulfate (%10) digestion on a Varian Cary 50 Bio UV–Visible Spectrophotometer (American Public Health Association, 1992). We focused our statistical analyses on broad functional feeding groups representing the trophic position of macroinvertebrates common to most of our study sites: primary consumers [Decapoda, Diptera (Tipulidae), Ephemeroptera, Gastropoda, and Trichoptera] and secondary consumers (Anisoptera, Arhynchobdellida, Megaloptera, and Zygoptera). Nutrient content of trophic groups was calculated as the average nutrient content of all corresponding taxa (Supplementary Figures 1, 2). Then, the molar ratios of C:N, C:P, and N:P were calculated for benthic macroinvertebrate primary and secondary consumers in addition to periphyton, and water chemistry samples.
Univariate generalized additive models (GAM) were used to evaluate the association between topographically weighted land cover and the ecological stoichiometry of stream water, periphyton, and benthic macroinvertebrate consumers. In brief, GAMs use a penalized smoothing function to identify significant linear or non-linear associations between independent and dependent variables. The estimated degrees of freedom (edf) in GAMs indicates the extent of non-linearity where 1 is linear and values >1 represent increased non-linearity. Because our study sites were selected along the same river network, our dataset lacks spatial independence. We therefore included a spatial autocorrelation term in each GAM to account for the spatial dependence of nested observations on model results. An interpoint distance matrix between pairwise combinations of study sites along the dendritic stream network was calculated to characterize the spatial autocorrelation structure in GAMs. Likewise, as catchment land cover classes are often collinear, significant associations between dependent variables and one land cover class may occur alongside significant associations with other land cover classes (King et al., 2005). In these situations, principal components analysis (PCA) is often used to reduce redundancy in the number of collinear land cover variables prior to further statistical analyses (Afed Ullah et al., 2018). Because land cover classes were intercorrelated within the Beaver River watershed, a PCA was first used to describe the variance in topographically weighted agriculture and developed land use and wetland and natural land cover among stream subcatchments, then to attain independent land cover and land use variables for univariate GAMs. Site scores on the first (PC 1) and second (PC 2) principal components were then extracted to represent gradients in land cover and land use composition among subcatchments and used as independent variables in GAMs.
Prior to all statistical analyses, nutrient ratios were natural log transformed, nutrient content and land cover/use were arcsine transformed, and nutrient concentrations were log10 transformed to improve normality. Transformed land cover and land use variables were then mean centered and standardized to achieve dimensional homogeneity in the PCA. PCA and GAM analyses were completed in R with the stats and mgcv packages, respectively (R Core Team, 2020; Wood, 2020).
Topographically weighted land cover and land use composition varied among subcatchments within the Beaver River watershed and ranged from 40 to 93% agriculture, 4 to 47% natural cover, <1 to 36% wetland, and <1 to 11% developed land (Table 1). Topographically weighted agricultural land use had a strong negative correlation with natural (r = −0.82, p < 0.01) and wetland (r = −0.79, p < 0.01) cover. Natural and wetland cover were not correlated, similarly developed land use was not correlated with any topographically weighted land cover/use class (p > 0.05). PCA explained 59.6% of the variance in topographically weighted land cover and land use composition on PC 1 and 25.5% on PC 2 (Figure 3A). Agriculture had a strong positive loading (PC 1, PC 2) on PC 1 (0.629, 0.212) whereas natural (−0.551, 0.188) and wetland (−0.517, −0.269) cover had negative loadings. Developed land use was orthogonal to the other land classes and was negatively loaded on PC 2 (0.183, −0.921). Pearson correlation analyses further showed strong correlations between PC 1 and agriculture (r = 0.97, p < 0.001), natural (r = −0.85, p < 0.001), and wetland (r = −0.80, p < 0.001) but not developed land use (r = 0.28, p = 0.255). PC 2 was only correlated with developed land use (Developed: r = −0.93, p < 0.001; Agriculture: r = 0.21, p = 0.394; Natural: r = 0.19, p = 0.450; Wetland: r = −0.27, p = 0.277). Therefore, PC 1 represented a gradient from natural/wetland cover to agricultural land use in stream subcatchments with higher scores on PC 1 associated with hydrologically connected agricultural land use and lower scores indicative of a greater topographic connection to natural and wetland cover. Similarly, values of PC 2 represented a gradient in developed land use and were multiplied by negative 1 such that higher PC 2 scores indicated greater hydrologic connectivity to developed lands. PC 1 and PC 2 hereafter refer to gradients in natural/wetland cover and agricultural land use, and developed land use, respectively (Figure 3B).
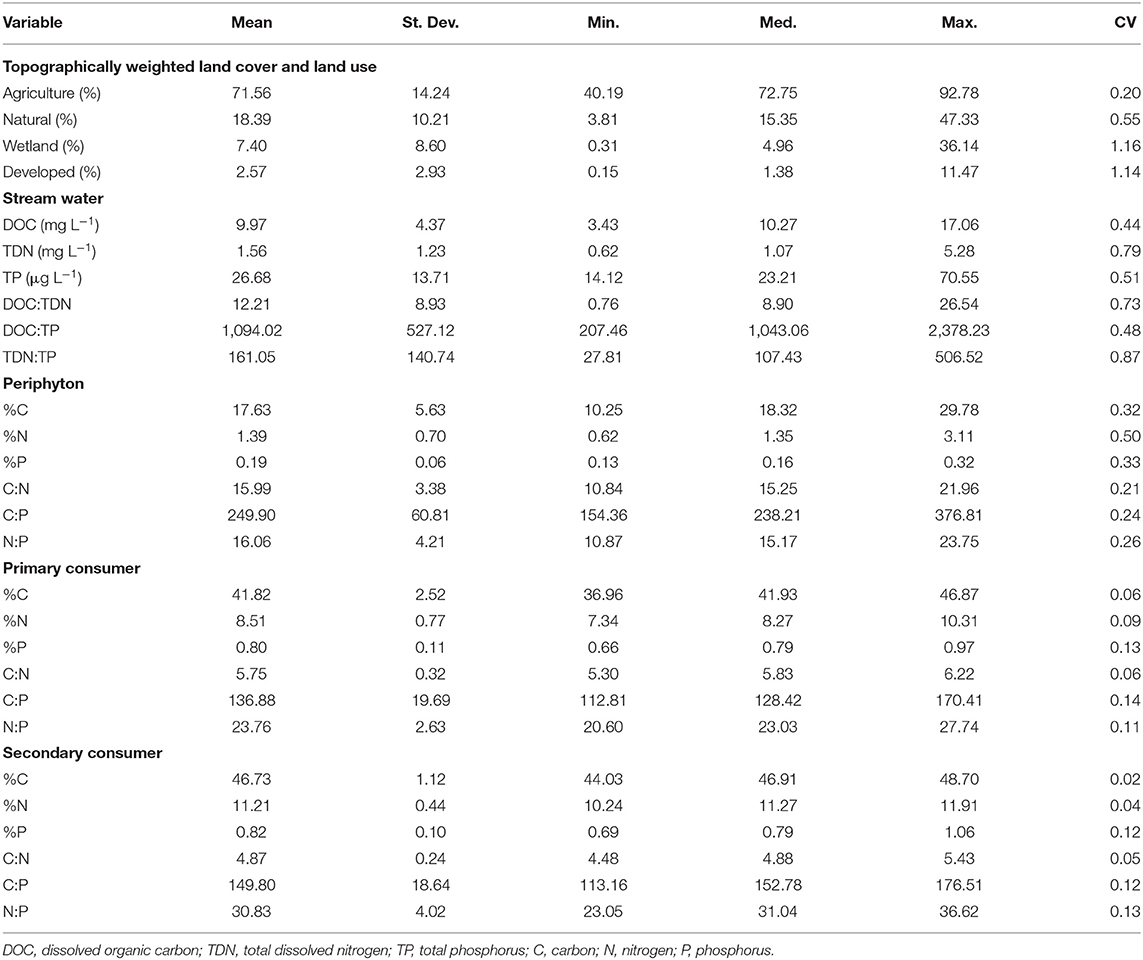
Table 1. Descriptive statistics of topographically weighted land cover and land use classes (n = 18), and the nutrient concentrations/content and ratios stream water (n = 18), periphyton (n = 17), primary consumers (n = 17), and secondary consumers (n = 18).
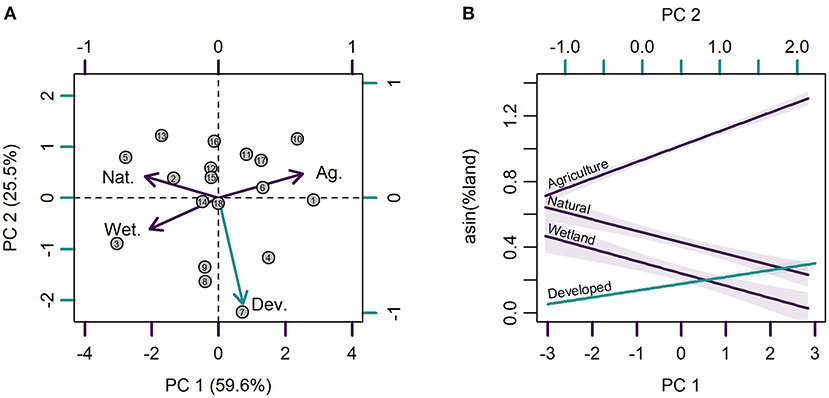
Figure 3. (A) Principal components analysis (PCA) of topographically weighted agricultural (Ag.), natural (Nat.), wetland (Wet.), and developed (Dev.) land classes among studied subcatchments of the Beaver River watershed. Purple represents strong loadings on PC 1 and blue represents strong loadings on PC 2. Numbers correspond to the study area map in Figure 1. (B) Relationship between subcatchment land classes and associated PC scores. PC 2 scores were multiplied by negative 1 such that both PC scores had a positive relationship with human land use.
Mean (± standard deviation) stream water nutrient concentrations were 9.97 ± 4.37 mg L−1 for DOC, 1.56 ± 1.23 mg L−1 for TDN, and 26.68 ± 13.71 μg L−1 for TP (Table 1). TDN was most variable and ranged about 8-fold among stream segments whereas DOC and TP ranged ~5-fold. Stream water nutrient concentrations were not significantly associated with PC 1 (Supplementary Table 1, Figure 4), whereas DOC had a negative linear association with PC 2 (p = 0.039, R2 = 0.135) and TDN had a positive linear association with PC 2 at an increased probability of type I error (p = 0.090, R2 = 0.160).
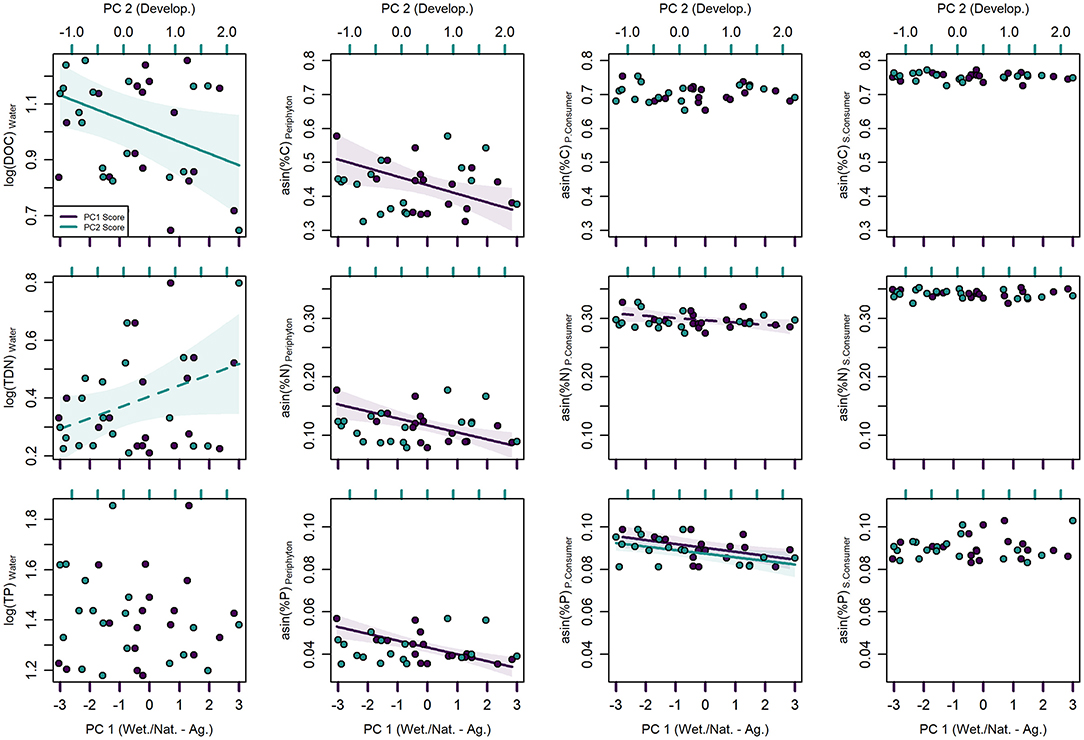
Figure 4. Univariate generalized additive regression models between principal component (PC) scores of topographically weighted land cover and carbon (C), nitrogen (N), and phosphorus (P) concentrations/contents of stream water, periphyton, primary consumers (P. Consumer), and secondary consumers (S. Consumer). PC 1 (purple) is positively associated with agriculture and negatively associated with wetland, and natural land classes, whereas PC 2 (blue) is positively associated with developed land use. Solid regression lines indicate significance at p < 0.05 and dashed regression lines indicate significance at p < 0.10. Shaded areas represent 95% confidence intervals.
Stream water nutrient ratios ranged from 0.76 to 26.54, 207.46 to 2378.23, and 27.81 to 506.52 for DOC:TDN, DOC:TP, and TDN:TP, respectively, with most of the variation in ratios associated with differences in TDN (Table 1). PC 2 had a negative linear association with DOC:TDN (p = 0.021, R2 = 0.172) but had a positive linear association with TDN:TP (p = 0.045, R2 = 0.205). Likewise, DOC:TP had a negative linear association with PC 1 (p = 0.032, R2 = 0.028), but did not explain much variation among stream segments (Supplementary Table 1, Figure 5).
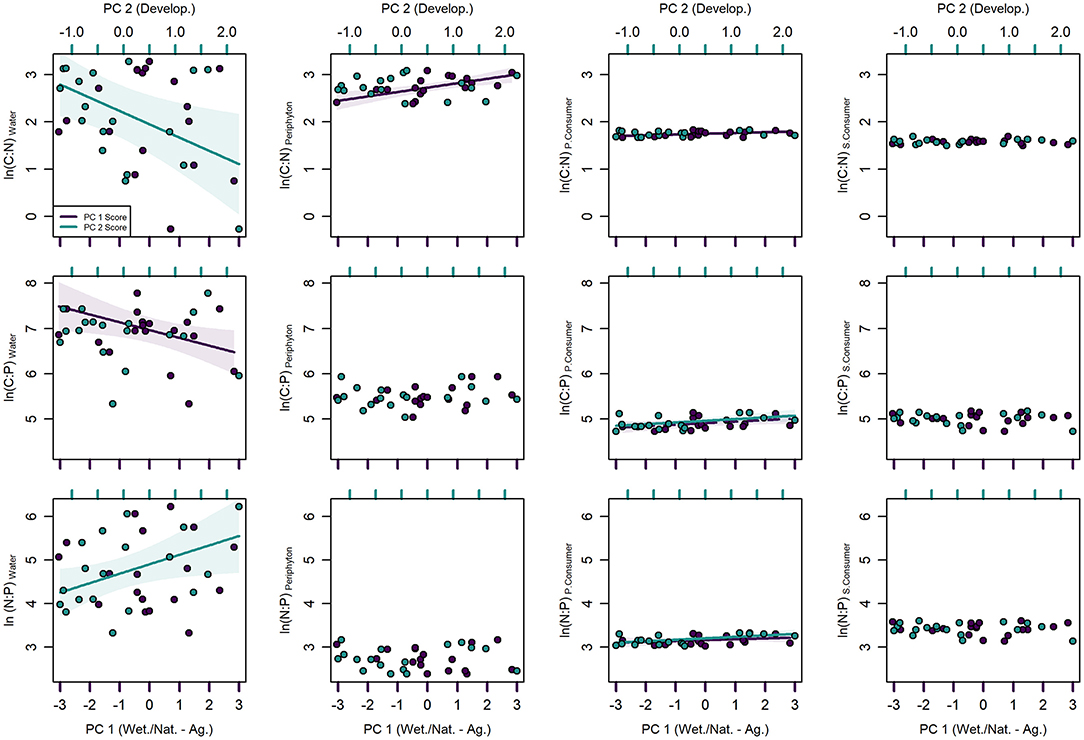
Figure 5. Univariate generalized additive regression models between principal component (PC) scores of topographically weighted land cover and carbon (C), nitrogen (N), and phosphorus (P) ratios of stream water, periphyton, primary consumers (P. Consumer), and secondary consumers (S. Consumer). PC 1 (purple) is positively associated with agriculture and negatively associated with wetland, and natural land classes, whereas PC 2 (blue) is positively associated with developed land use. Solid regression lines indicate significance at p < 0.05 and dashed regression lines indicate significance at p <0.10. Shaded areas represent 95% confidence intervals.
Mean periphyton nutrient content was 17.63 ± 5.63%C, 1.39 ± 0.70%N, and 0.19 ± 0.06%P and ranged from 3 to 5-fold among stream segments (Table 1). Periphyton C (p = 0.032, R2 = 0.259), N (p = 0.005, R2 = 0.396), and P (p < 0.001, R2 = 0.501) content all had negative linear associations with PC 1 (Supplementary Table 1, Figure 4). However, despite periphyton nutrient ratios ranging from 10.84 to 21.96 for C:N, 154.36 to 376.81 for C:P, and 10.87 to 23.75 for N:P (Table 1), only periphyton C:N had a significant linear association with PC 1 (Supplementary Table 1, Figure 5).
Nutrient content of primary consumers varied <2-fold among stream segments and was on average 41.51 ± 2.23, 8.40 ± 0.63, and 0.79 ± 0.10%, for C, N, and P, respectively (Table 1). Primary consumer N (p = 0.093, R2 = 0.167) and P (p = 0.017, R2 = 0.205) content both had negative linear associations with PC 1, but the association between N content and PC 1 was significant at an increased probably of type I error (Supplementary Table 1, Figure 4). In addition, primary consumer P content had a significant negative linear association with PC 2 (p = 0.021, R2 = 0.208).
Nutrient ratios of primary consumers also varied <2-fold among stream segments and ranged from 5.33 to 6.22 for C:N, 112.81 to 170.41 for C:P, and 20.60 to 27.74 for N:P (Table 1). Despite the small amount of variation observed in primary consumer nutrient ratios, C:N had a positive linear association with PC 1 (p = 0.020, R2 = 0.232) and N:P had a positive linear association with PC 2 (p = 0.008, R2 = 0.301) (Supplementary Table 1, Figure 5). Primary consumer C:P had a positive linear association with both PC 1 (p = 0.065, R2 = 0.138) and PC 2 (p = 0.024, R2 = 0.217) but the association with PC 1 was significant at a lower probability of type I error.
Secondary consumer nutrient stoichiometry did not vary greatly among stream segments (<2-fold) and was more conserved in comparison to that of primary consumers. Mean nutrient content of secondary consumers was 46.81 ± 1.10, 11.19 ± 0.43, and 0.81 ± 0.10% for C, N, and P, respectively (Table 1). Similarly, nutrient ratios ranged from 4.48 to 5.43 for C:N, 113.16 to 176.51 for C:P, and 23.05 to 36.62 for N:P (Table 1). No significant associations were observed between secondary consumer nutrient stoichiometry and PC scores (Supplementary Table 1, Figures 4, 5).
Within the Beaver River watershed, we found that variation in the elemental composition (content and ratios) of streams and their food webs decreased from lower to higher trophic positions. The elemental compositions of stream water, periphyton, and primary consumers, but not secondary consumers, were related to subcatchment land cover and land use located in hydrologically connected areas of the landscape. Spatial variation in stream water nutrient concentrations and ratios were associated with developed land use. In contrast, variation in periphyton stoichiometry was related to agricultural land use and wetland/natural land covers. Similarly, while primary consumers showed little spatial variation in elemental composition, relationships were observed between nutrient content and ratios and the amount of agriculture and developed land use in connected areas of stream subcatchments. Overall, our results suggest that heterogeneity in the spatial arrangement of land cover and land use at the subcatchment scale can influence nutrient stoichiometry of streams, but these effects become muted with increasing trophic position.
Hydrologically connected developed land use in subcatchments of the Beaver River watershed was related to the concentration and ratios of nutrients in stream segments. Although developed land use occupied a small proportion of stream subcatchments, we found lower DOC and higher TDN concentrations, along with higher TDN:TP and lower DOC:TDN ratios, in stream segments connected to developed landscapes. Several past studies have also reported increased N concentrations and higher N:P ratios in streams draining developed/urbanized catchments (Paul and Meyer, 2001; Thomas et al., 2018; Manning et al., 2020). However, unlike some past studies (Johnson et al., 1997; Bellmore et al., 2018; Thomas et al., 2018; Pearce and Yates, 2020), we did not observe any association between developed land use and TP nor agricultural land use and measured stream water nutrient concentrations or ratios. The lack of land use-nutrient associations could be due to the relatively low range of highly urbanized land and the type or amount of agriculture, considered to be of low intensity in this particular stream network (Wilson and Xenopoulos, 2008, 2009). Moreover, nutrients are largely exported from landscape sources through water runoff events (Withers and Jarvie, 2008), thus the frequency and time of year (base flow, mid-summer) that we sampled captured a period of weaker landscape connectivity. Agricultural impacts and/or potential benefits of hydrologically connected natural and wetland cover on water quality may be more pronounced during wetter seasons and following precipitation events. Nevertheless, we found stream water nutrient concentrations and ratios to be locally variable among stream segments within the Beaver River watershed.
The elemental composition of periphyton also varied widely among stream segments, but unlike stream water nutrient concentrations and ratios, spatial variation in periphyton nutrient content was associated with topographically weighted agricultural land use and wetland/natural land cover. Past studies have observed greater periphyton N and P content in more nutrient enriched streams draining agricultural and developed catchments (O'Brien and Wehr, 2010; Liess et al., 2012). Yet, we found that periphyton C, N, and P content were negatively associated with topographically weighted agricultural land use and positively associated with natural and wetland cover in stream subcatchments. Agricultural activities also increase the deposition of fine sediments in streams (Allan, 2004), thus increased sediment disturbance in more connected agricultural stream segments likely resulted in more inorganic material in periphyton matrices decreasing the content of all nutrients per dry weight. However, periphyton C:N ratios were also associated with subcatchment land cover indicating that decreased periphyton nutrient content was not strictly proportional. Landscape effects on other periphyton components (e.g., detritus, heterotrophic microbes, and algae) may therefore be responsible for some spatial variation in the elemental composition of periphyton among streams. For example, increased organic matter subsidies and/or deposition in streams more connected to wetlands and riparian areas may stimulate microbial nutrient processing (Stutter et al., 2018) and increase periphyton nutrient content and C: nutrient ratios through heterotrophic pathways. Reach-scale complexity in environmental conditions and community composition may also be responsible for some variation in periphyton elemental composition and outweigh heterogeneity in land use at larger spatial scales (Frost et al., 2005; Tsoi et al., 2011). Future research would need to couple elemental composition with periphyton structure to disentangle diverse land cover effects on stream ecosystems.
The elemental composition of primary and secondary consumers was much less variable than stream water and periphyton. Past studies have also found limited variation in the elemental composition of benthic macroinvertebrates within and between trophic levels (Frost et al., 2002; Evans-White et al., 2005; Persson et al., 2010). We also found the nutrient content and ratios of benthic macroinvertebrates to be within the range of those reported in other temperate regions (e.g., Cross et al., 2003; Evans-White et al., 2005). However, despite minimal spatial variation in consumer nutrient content and ratios, land cover composition explained among stream differences in the elemental composition of primary consumer at the subcatchment scale. In particular, topographically weighted agricultural land use was associated with lower primary consumer N and P content and higher C:N and C:P ratios; likewise, developed land use was associated with lower P content and higher C:P and N:P ratios. Spatial patterns observed in primary consumer elemental composition were analogous with those observed for periphyton and stream water. Several other studies have also shown some degree of coupling between the elemental composition of primary consumers and their resources (e.g., Cross et al., 2003; Small and Pringle, 2010; Evans-White and Halvorson, 2017). Subcatchment land use may therefore have an intermediary effect on spatial variation in primary consumer elemental composition through bottom-up effects on resource quality. Although investigative constraints limited certain taxa from consistently being included in estimates of trophic level elemental composition, we found nominal variation in nutrient content and ratios among taxa suggesting that these inconsistencies would have little effect on the spatial patterns observed in estimates at the primary and secondary consumer level.
Periphyton C:N and C:P ratios were about 2-fold greater than the Redfield ratio and elevated in comparison to C:N and C:P ratios of primary consumers. Despite a presumably higher nutrient supply in more developed and agricultural subcatchments, increased C: nutrient ratios suggests that periphyton was somewhat depleted of N and P and would be a relatively poor-quality resource for primary consumers. Conversely, periphyton N:P ratios were about 16:1 and more aligned with N:P ratios in primary consumers. Therefore, primary consumers would likely be more N-limited than P-limited when consuming periphyton as a resource in the Beaver River watershed. Differences in elemental composition were muted between primary and secondary consumers and suggests that elemental imbalances decrease with trophic level. Although taxa included in our study may not be fully representative of dominant trophic interactions, past research has also found that consumer-resource imbalances decline with increasing trophic position (Lauridsen et al., 2012). Therefore, while land use effects on elemental compositions should be in agreement among stream trophic positions, we expect lower and negligible effect sizes to be largely generalizable at higher trophic levels because of their stronger tendency to maintain homeostasis.
The spatial arrangement of human land use on the landscape can have disproportionate effects on nutrient export to streams (King et al., 2005; Peterson et al., 2011; Staponites et al., 2019) and may lead to spatial heterogeneity in ecological stoichiometry within river networks. Our finding that land cover and land use located in hydrologically connected areas of stream subcatchments explained considerable variation in stream water, periphyton, and primary consumer elemental composition has implications for food web dynamics and nutrient cycling in stream ecosystems. For example, our observation that greater connectivity to wetlands and natural areas increased periphyton nutrient content and decreased C:N ratios at the subcatchment scale suggests that periphyton stoichiometry in these streams may better support primary consumer growth. However, we also observed considerable spatial variation in the elemental composition of streams that was not associated with subcatchment land use. Future studies should therefore consider heterogeneity across multiple spatial scales to explain further variation in the ecological stoichiometry of streams.
Compared to other settled areas in southern Ontario, the Beaver River watershed is minimally developed and less agriculturally intensive. Here, we observed that relatively small amounts of human land use located in hydrologically connected areas of the landscape could alter the balance of nutrients in stream ecosystems. However, land use effects should be more pronounced, and perhaps different, in streams draining more intensively altered landscapes throughout our study region and broadly across other temperate regions. For example, strong nutrient enrichment effects of human land use that were beyond what was observed within the Beaver River watershed could outweigh site specific complexities and other agricultural stressors (e.g., sediments) increasing the nutrient content and lowering the C: nutrient ratios of basal resources (O'Brien and Wehr, 2010; Liess et al., 2012). Spatial patterns in the elemental composition of streams may therefore become increasing non-linear over larger gradients in hydrologically connected natural land cover and human land use. More nuanced spatial considerations (e.g., flow accumulation, flow direction, and soil permeability) that explicitly link terrestrial processes to stream ecosystems will continue to further our understanding of stream-landscape interactions and improve watershed management with greater success on stabilizing stream functionality in the face of anthropogenic change.
The original contributions generated for the study are included in the article/Supplementary Material, further inquiries can be directed to the corresponding author.
NP: conceptualization, data curation, formal analysis, methodology, software, visualization, and writing—original draft. DS: conceptualization and writing—review and editing. JP and HW: conceptualization and investigation. PF: conceptualization, project administration, resources, supervision, and writing—review and editing. MX: conceptualization, funding acquisition, project administration, resources, supervision, and writing—review and editing. All authors contributed to the article and approved the submitted version.
Funded by Canada's Natural Sciences and Engineering Research Council (NSERC) Discovery grant (NSERC). In addition, HW was supported by an NSERC postgraduate scholarship and JP acknowledges support from an NSERC Undergraduate Research Award.
The authors declare that the research was conducted in the absence of any commercial or financial relationships that could be construed as a potential conflict of interest.
We thank Michael White, Steve Marson, Stephanie Lyons, Stephen McCarthy, and Melanie Kingsbury for laboratory and field assistance.
The Supplementary Material for this article can be found online at: https://www.frontiersin.org/articles/10.3389/frwa.2021.675284/full#supplementary-material
Afed Ullah, K., Jinag, J., and Wang, P. (2018). Land use impacts on surface water quality by statistical approaches. Global J. Environ. Sci. Manage. 4, 231–250. doi: 10.22034/gjesm.2018.04.02.010
Agriculture Agri-Food Canada (2011). Annual Crop Inventory, Government of Canada. Avilable online at: https://open.canada.ca/data/en/dataset/ba2645d5-4458-414d-b196-6303ac06c1c9
Allan, J. D. (2004). Landscapes and riverscapes: the influence of land use on stream ecosystems. Annu. Rev. Ecol. Evol. Syst. 35, 257–284. doi: 10.1146/annurev.ecolsys.35.120202.110122
American Public Health Association (1992). Standard Methods for the Examination of Water and Wastewater, 18th Edn. Washington, DC: American Public Health Association.
Arbuckle, K. E., and Downing, J. A. (2001). The influence of watershed land use on lake N:P in a predominantly agricultural landscape. Limnol. Oceanog. 46, 970–975. doi: 10.4319/lo.2001.46.4.0970
ASTER Science Team (2019). ASTER Global Digital Elevation Model—ASTGTM v002. National Aeronautics and Space Administration Earth Data. doi: 10.5067/ASTER/ASTGTM.002
Bellmore, R. A., Compton, J. E., Brooks, J. R., Fox, E. W., Hill, R. A., Sobota, D. J., et al. (2018). Nitrogen inputs drive nitrogen concentrations in U.S. streams and rivers during summer low flow conditions. Sci. Total Environ. 639, 1349–1359. doi: 10.1016/j.scitotenv.2018.05.008
Chiandet, A. S., and Xenopoulos, M. A. (2011). Landscape controls of seston stoichiometry in urban stormwater management ponds. Freshw. Biol. 56, 519–529. doi: 10.1111/j.1365-2427.2010.02519.x
Crins, W. J., Gray, P. A., Uhlig, P. W., and Wester, M. C. (2009). The Ecosystems of Ontario, Part 1: Ecozones and Ecoregions. Ministry of Natural Resources Science and Information Branch, Inventory, Monitoring and Assessment Section. Technical Report SIB TER IMA TR-01 1-76. Available online at: https://www.ontario.ca/page/ecosystems-ontario-part-1-ecozones-and-ecoregions
Cross, W. F., Benstead, J. P., Frost, P. C., and Thomas, S. A. (2005). Ecological stoichiometry in freshwater benthic systems: recent progress and perspectives. Freshw. Biol. 50, 1895–1912. doi: 10.1111/j.1365-2427.2005.01458.x
Cross, W. F., Benstead, J. P., Rosemond, A. D., and Wallace, J. B. (2003). Consumer-resource stoichiometry in detritus-based streams. Ecol. Lett. 6, 721–732. doi: 10.1046/j.1461-0248.2003.00481.x
Environmental Systems Research Institute (2019). ArcGIS Desktop: Version 10.7.1. Redlands, CA: Environmental Systems Research Institute.
Evans-White, M. A., and Halvorson, H. M. (2017). Comparing the ecological stoichiometry in green and brown food webs—a review and meta-analysis of freshwater food webs. Front. Micobiol. 8:1184. doi: 10.3389/fmicb.2017.01184
Evans-White, M. A., Stelzer, R. S., and Lamberti, G. A. (2005). Taxonomic and regional patterns in benthic macroinvertebrate elemental composition in streams. Freshw. Biol. 50, 1786–1799. doi: 10.1111/j.1365-2427.2005.01455.x
Frost, P. C., Hillebrand, H., and Kahlert, M. (2005). Low algal carbon content and its effect on the C:P stoichiometry of periphyton. Freshw. Biol. 50, 1800–1807. doi: 10.1111/j.1365-2427.2005.01449.x
Frost, P. C., Kinsman, L. E., Johnston, C. A., and Larson, J. H. (2009). Watershed discharge modulates relationships between landscape components and nutrient ratios in stream seston. Ecology 90, 1631–1640. doi: 10.1890/08-1534.1
Frost, P. C., Stelzer, R. S., Lamberti, G. A., and Elser, J. J. (2002). Ecological stoichiometry of trophic interactions in the benthos: understanding the role of C:N:P ratios in lentic and lotic habitats. J. North Am. Benthol. Soc. 21, 515–528. doi: 10.2307/1468427
Green, M. B., and Finlay, J. C. (2010). Patterns of hydrologic control over stream water total nitrogen to total phosphorus ratios. Biogeochemistry 99, 15–30. doi: 10.1007/s10533-009-9394-9
Green, M. B., Nieber, J. L., Johnson, G., Magner, J., and Schaefer, B. (2007). Flow path influence on an N:P ratio in two headwater streams: a paired watershed study. J. Geophys. Res. Biogeosci. 112:G03015. doi: 10.1029/2007JG000403
Halvorson, H. M., and Small, G. E. (2016). Observational field studies are not appropriate tests of consumer stoichiometric homeostasis. Freshw. Sci. 35, 1103–1116. doi: 10.1086/689212
Hessen, D. O., Elser, J. J., Sterner, R. W., and Urabe, J. (2013). Ecological stoichiometry: an elementary approach using basic principles. Limnol. Oceanog. 58, 2219–2236. doi: 10.4319/lo.2013.58.6.2219
Johnson, L. B., Richards, C., Host, G. E., and Arthur, J. W. (1997). Landscape influences on water chemistry in midwestern stream ecosystems. Freshw. Biol. 37, 193–208. doi: 10.1046/j.1365-2427.1997.d01-539.x
King, R. S., Baker, M. E., Whigham, D. F., Weller, D. E., Jordan, T. E., Kazyak, P. F., et al. (2005). Spatial considerations for linking watershed land cover to ecological indicators in streams. Ecol. Appl. 15, 137–153. doi: 10.1890/04-0481
Lake Simcoe Conservation Authority (2012). Beaver River Subwatershed Plan. Lake Simcoe Conservation Authority. Available online at: https://www.lsrca.on.ca/Pages/Subwatershed-Plans.aspx
Lauridsen, R. B., Edwards, F. K., Bowes, M. J., Woodward, G., Hildrew, A. G., Ibbotson, A. T., et al. (2012). Consumer–resource elemental imbalances in a nutrient-rich stream. Freshw. Sci. 31, 408–422. doi: 10.1899/11-052
Liess, A., and Hillebrand, H. (2006). Role of nutrient supply in grazer-periphyton interactions: reciprocal influences of periphyton and grazer nutrient stoichiometry. J. North Am. Benthol. Soc. 25, 632–642. doi: 10.1899/0887-3593(2006)25[632:RONSIG]2.0.CO;2
Liess, A., Le Gros, A., Wagenhoff, A., Townsend, C. R., and Matthaei, C. D. (2012). Landuse intensity in stream catchments affects the benthic food web: consequences for nutrient supply, periphyton C:nutrient ratios, and invertebrate richness and abundance. Freshw. Sci. 31, 813–824. doi: 10.1899/11-019.1
Manning, D. W. P., Rosemond, A. D., Benstead, J. P., Bumpers, P. M., and Kominoski, J. S. (2020). Transport of N and P in U.S. streams and rivers differs with land use and between dissolved and particulate forms. Ecol. Appl. 30:e02130. doi: 10.1002/eap.2130
Milanovich, J. R., Berland, A., and Hopton, M. E. (2014). Influence of catchment land cover on stoichiometry and stable isotope compositions of basal resources and macroinvertebrate consumers in headwater streams. J. Freshw. Ecol. 29, 565–578. doi: 10.1080/02705060.2014.933450
O'Brien, P. J., and Wehr, J. D. (2010). Periphyton biomass and ecological stoichiometry in streams within an urban to rural land-use gradient. Hydrobiologia 657, 89–105. doi: 10.1007/s10750-009-9984-5
Ontario Ministry of Natural Resources Forestry (2019). Ontario Hydro Network (OHN)—Watercourse. Ontario GeoHub. Available online at: https://geohub.lio.gov.on.ca/datasets/a222f2996e7c454f9e8d028aa05995d3_26
Paul, M. J., and Meyer, J. L. (2001). Streams in the urban landscape. Annu. Rev. Ecol. Syst. 32, 333–365. doi: 10.1146/annurev.ecolsys.32.081501.114040
Pearce, N. J. T., and Yates, A. G. (2020). Spatial and temporal patterns in macronutrient concentrations and stoichiometry of tributaries draining the lower great lakes-St. Lawrence basin. J. Great Lakes Res. 46, 989–1000. doi: 10.1016/j.jglr.2020.05.002
Persson, J., Fink, P., Goto, A., Hood, J. M., Jonas, J., and Kato, S. (2010). To be or not to be what you eat: Regulation of stoichiometric homeostasis among autotrophs and heterotrophs. Oikos 119, 741–751. doi: 10.1111/j.1600-0706.2009.18545.x
Peterson, E. E., Sheldon, F., Darnell, R., Bunn, S. E., and Harch, B. D. (2011). A comparison of spatially explicit landscape representation methods and their relationship to stream condition. Freshw. Biol. 56, 590–610. doi: 10.1111/j.1365-2427.2010.02507.x
Prater, C., Frost, P. C., Howell, E. T., Watson, S. B., Zastepa, A., King, S. S. E., et al. (2017). Patterns in C:N:P stoichiometry across the lake erie watershed from tributaries to its outflow. Limnol. Oceanog. 62, S194–S206.10628. doi: 10.1002/lno.10628
R Core Team (2020). R: A Language and Environment for Statistical Computing. Vienna, Austria: R Foundation for Statistical Computing. Available online at: www.R-project.org/
Ren, Z., Niu, D., Ma, P., Wang, Y., Wang, Z., Fu, H., et al. (2020). C:N:P stoichiometry and nutrient limitation of stream biofilms impacted by grassland degradation on the Qinghai-Tibet Plateau. Biogeochemistry 150, 31–44. doi: 10.1007/s10533-020-00685-4
Small, G. E., and Pringle, C. M. (2010). Deviation from strict homeostasis across multiple trophic levels in an invertebrate consumer assemblage exposed to high chronic phosphorus enrichment in a neotropical stream. Oecologia 162, 581–590. doi: 10.1007/s00442-009-1489-4
Spooner, D. E., Frost, P. C., Hillebrand, H., Arts, M. T., Puckrin, O. P., and Xenopoulos, M. A. (2013). Nutrient loading associated with agriculture land-use dampens the importance of consumer-mediated niche construction. Ecol. Lett. 16, 1115–1125. doi: 10.1111/ele.12146
Staponites, L. R., Barták, V., Bíl,ý, M., and Simon, O. P. (2019). Performance of landscape composition metrics for predicting water quality in headwater catchments. Sci. Rep. 9:14405. doi: 10.1038/s41598-019-50895-6
Stelzer, R. S., and Lamberti, G. A. (2001). Effects of N:P ratio and total nutrient concentration on stream periphyton community structure, biomass, and elemental composition. Limnol. Oceanogr. 46, 356–367. doi: 10.4319/lo.2001.46.2.0356
Stutter, M. I., Graeber, D., Evans, C. D., Wade, A. J., and Withers, P. J. A. (2018). Balancing macronutrient stoichiometry to alleviate eutrophication. Sci. Total Environ. 634, 439–447. doi: 10.1016/j.scitotenv.2018.03.298
Thomas, K. E., Lazor, R., Chambers, P. A., and Yates, A. G. (2018). Land-use practices influence nutrient concentrations of southwestern Ontario streams. Can. Water Resour. J. 43, 2–17. doi: 10.1080/07011784.2017.1411211
Tsoi, W. Y., Hadwen, W. L., and Fellows, C. S. (2011). Spatial and temporal variation in the ecological stoichiometry of aquatic organisms in an urban catchment. J. N. Am. Benthol. Soc. 30, 533–545. doi: 10.1899/10-085.1
Wilson, H. F., and Xenopoulos, M. A. (2008). Ecosystem and seasonal control of stream dissolved organic carbon along a gradient of land use. Ecosystems 11, 555–568. doi: 10.1007/s10021-008-9142-3
Wilson, H. F., and Xenopoulos, M. A. (2009). Effects of agricultural land use on the composition of fluvial dissolved organic matter. Nat. Geosci. 2, 37–41. doi: 10.1038/ngeo391
Wilson, H. F., and Xenopoulos, M. A. (2011). Nutrient recycling by fish in streams along a gradient of agricultural land use. Glob. Chang. Biol. 17, 130–139. doi: 10.1111/j.1365-2486.2010.02284.x
Withers, P. J. A., and Jarvie, H. P. (2008). Delivery and cycling of phosphorus in rivers: a review. Sci. Total Environ. 400, 379–395. doi: 10.1016/j.scitotenv.2008.08.002
Wood, S. (2020). mgcv: Mixed GAM Computation Vehicle with Automatic Smoothness Estimation. Version 1.8-33.
Keywords: ecological stoichiometry, land cover, nutrients, periphyton, benthic macroinverbrates, hydrologic connectivity
Citation: Pearce NJT, Spooner DE, Plourde JM, Wilson HF, Frost PC and Xenopoulos MA (2021) Association Between Subcatchment Land Cover and Ecological Stoichiometry Along a Human Modified Stream Network. Front. Water 3:675284. doi: 10.3389/frwa.2021.675284
Received: 02 March 2021; Accepted: 08 June 2021;
Published: 07 July 2021.
Edited by:
Clara Mendoza-Lera, University of Koblenz Landau, GermanyReviewed by:
Knut Mehler, University at Buffalo, United StatesCopyright © 2021 Pearce, Spooner, Plourde, Wilson, Frost and Xenopoulos. This is an open-access article distributed under the terms of the Creative Commons Attribution License (CC BY). The use, distribution or reproduction in other forums is permitted, provided the original author(s) and the copyright owner(s) are credited and that the original publication in this journal is cited, in accordance with accepted academic practice. No use, distribution or reproduction is permitted which does not comply with these terms.
*Correspondence: Nolan J. T. Pearce, bm9sYW5wZWFyY2VAdHJlbnR1LmNh
†Present address: Daniel E. Spooner, Department of Biology, Lock Haven University, Lock Haven, PA, United States Henry F. Wilson, Brandon Research and Development Center, Agriculture and Agri-Food Canada, Brandon, MB, Canada
Disclaimer: All claims expressed in this article are solely those of the authors and do not necessarily represent those of their affiliated organizations, or those of the publisher, the editors and the reviewers. Any product that may be evaluated in this article or claim that may be made by its manufacturer is not guaranteed or endorsed by the publisher.
Research integrity at Frontiers
Learn more about the work of our research integrity team to safeguard the quality of each article we publish.