 Ryo Inoue
 Kohei Hatori
- Graduate School of Information Sciences, Tohoku University, Sendai, Japan
To quantify the flood risk awareness of real estate market participants and residents, previous studies analyzed the effect of flood risks on residential property values. However, most studies focused on the impact of recent flood events and the publication of new flood risk information; the behavior in flood-prone regions in which repeated damages occurred and lessons learned consequently has not been the focus of analysis. Moreover, there is a growing national concern in Japan about an increase in future flood risks due to climate change, although their effect on property values has not been discussed. In this study, we analyzed residential property values in Nagoya City (Aichi Prefecture, Japan), a megacity that has experienced significant flood damage in major historical and recent floods. The main objective of this study is to determine the effects of past and recent flood experiences and the increasing concerns about flood risks on recent residential property values. The results revealed that historical flood damage had the largest impact on residential property values in Nagoya City, and devaluation increased due to growing concerns about natural disasters in Japan. The disclosure of flood risk information also had an impact on property values, increasing devaluation after disclosure. On the contrary, the occurrence of recent floods did not have an impact on property values, suggesting that flood risk awareness had already been strong in the target area. These findings are different from those of many previous studies. The observed trends in residential property values in the target area are likely a characteristic response in flood-prone regions, where flood risk awareness is enhanced due to repeated flood damage.
Introduction
Global warming has increased the frequency and intensity of heavy rainfall and associated flooding events, which cause significant damage to property and will continue to increase the flood risk in the future (IPCC, 2013). To mitigate future damage and protect the lives and assets of residents, governments are proactively sharing flood risk-related information as flood risk maps and flood history maps in addition to constructing flood prevention facilities such as dams, levees, and retarding basins. These efforts aim to support the residents' short-term decisions on evacuation timings, places, and routes, as well as long-term decisions on housing locations. However, shared flood risk information has an insufficient impact on residents' decisions; for example, a certain number of residents lived in the area inundated by the “Heavy Rain of July 2018” in Mabi District, Kurashiki City of Okayama Prefecture in Japan; many of them did not evacuate before flooding occurred, even though the flood risk of the area had been indicated on the published flood risk map (The Asahi Shimbun Digital, 2018). Thus, the flood risk awareness level of residents is unclear, and the effectiveness of providing proper information for flood risk reduction needs to be evaluated.
Several studies have analyzed real estate property values, mostly residential property transaction prices, to quantify the flood risk awareness of homebuyers and residents based on hedonic pricing models (Rosen, 1974). Real estate property values reflect the evaluations by real estate market participants for property attributes, such as size, zoning, and accessibility. Flood risk is also an attribute that can affect real estate property values. The relationship between real estate property values and flood risk has been analyzed under the assumption that properties with flood risk are valued low only when the risk is considered by market participants and residents.
Many studies have focused on the timing of floods and analyzed the changes in residential property values after the occurrence of flood events and the publication of new flood risk information. Most of these studies (e.g., Kousky, 2010; Atreya et al., 2013; Bin and Landry, 2013; Nyce et al., 2015; Votsis and Perrels, 2016) confirmed that flood damage reduces residential property values and is an opportunity for residents to recognize the danger of flooding. Atreya and Ferreira (2015) found that residential transaction prices within the disaster area of Hurricane Albert (1994) in Georgia, USA fell after the hurricane. Comparison of the prices in flood-damaged areas with those in estimated flood hazard areas showed that the actual flood damage had a negative impact on residential property values, while the flood hazard designation did not. Ortega and Tapinar (2018) conducted an analysis of the area affected by Hurricane Sandy (2012) in New York, USA, and found that prices in flooded areas fell immediately after the hurricane, and the price decline in affected areas continued for 5 years. These studies have confirmed the impact of flood occurrence on residential property values. To investigate the effect of the disclosure of flood risk information on real estate property prices, Hill (2015) showed that real estate property values fell after the release of the 2013 update of the US Federal Emergency Management Agency (FEMA) flood risk maps. Indaco et al. (2019) reported that the prices of properties whose flood risk was downgraded in the updated FEMA flood risk maps increased. Gibson et al. (2019) showed that properties that did not flood during Hurricane Sandy in 2012 but included in the new floodplain maps suffered price drops after the release of the new maps. These studies have confirmed that the disclosure of new flood risk information affects real estate property values.
In summary, various factors related to flood risks, such as the actual damage caused by flood events and the disclosure of flood risk information, trigger the depreciation of real estate property values owing to the increased awareness of real estate market participants and residents. However, in flood-prone regions, in which residents have experienced flood continuously and recognized the danger of flood damage, residential property values seem to react differently to the occurrence of floods. Inoue and Komori (2017) analyzed the Kanda River basin in Tokyo, Japan, which is a flood-prone region, and found that the values of residential properties flooded by previous flood events during the analysis period were lower than those of properties not flooded by such events. Moreover, property values did not change, even if the properties were damaged in new flood events. These findings contradict the results of most previous studies; the authors assumed that new flood events may not decrease property values further as the flood risk is already considered while valuing these properties.
In regions where historic floods have occurred, the danger of flood damage is intended to be passed down from generation to generation by building memorial monuments to the victims and promoting disaster awareness. If such an approach is effective, it is expected to cause a low property valuation. Because most previous studies, including Inoue and Komori (2017), have only focused on recent flood events that occurred during the analysis period, the influence of historic flood events on residential property values and flood risk awareness remains to be investigated.
Additionally, the concerns about flood risk have grown owing to the rapid increase in the number and intensity of flood events in recent years in Japan due to climate change, and the Japanese government adopted flood risk disclosure requirements for real estate transactions in July 2020 (Ministry of Land, Infrastructure, Transport and Tourism, 2020). The impact of flood risk communication on residential property values in Japan remains to be studied to address the growing concerns on flood risk.
Therefore, in this study, we selected Nagoya City of Aichi Prefecture in Japan as the target region as an example of a flood-prone region, where a historic typhoon that occurred more than 60 years ago and subsequent frequent heavy rains caused enormous flood damages, and analyzed the impacts of historical and recent flooding events, the disclosure of flood risk maps, and the increasing concerns about flood risk on residential property values. Hatori and Inoue (2020) analyzed the relationship between residential values and recent flood damage in Nagoya City and confirmed that the values did not fall after flooding; however, the impact of historical floods has not been considered. This study builds on the past research by examining the effects of historical floods and by extending the analysis period to 2020 using the latest data.
Materials and Methods
Target Area, Period, Events, and Datasets
The target of the analysis was the residential property values in Nagoya City, Japan, from 1995 to 2020. Nagoya City is the largest city in the Tokai area, with a population of more than two million, and the third largest metropolitan area in Japan. The area has experienced frequent flooding events that caused significant damage.
Three types of events that likely influenced residential property values were analyzed in this study: historical flood events that occurred before 1995 when the analysis period started, a major flood in 2000 that occurred during the analysis period, and the publication of flood risk maps in 2010 during the analysis period.
One of the focuses of the study was the impact of historical floods in the region; we selected three flood events before the analysis period. In 1959, the Isewan Typhoon caused enormous flood damage, including 1851 dead and missing people, 34,883 damaged houses with inundation above floor level, and 32,469 damaged houses with inundation below floor level (Nagoya City, 2020a). The typhoon resulted in the largest damage caused by natural disasters after World War II in Japan at the time. Although more than 60 years have passed since then, it is still recognized as one of the largest flood events. Many signboards indicating the flood depth caused by the Isewan Typhoon are found in many places in Nagoya City, and many events to convey the flood experience to successive generations are conducted. Hereafter, we refer to the flood by the Isewan Typhoon as the “Isewan flood.” In addition, heavy rains that occurred in 1974 and 1976 also caused severe flood damages in Nagoya City, with the former damaging 2,884 houses with inundation above floor level and 40,463 houses with inundation below floor level, and the latter damaging 3,610 houses with inundation above floor level and 62,959 houses with inundation below floor level (Nagoya City, 2017). Because the floods in 1974 and 1976 caused damages to the same parts of Nagoya City in quick succession, we aggregated these floods and refer to them as the “1970's floods.”
In 2000, during the analysis period, “the Tokai heavy rainfall” event killed one person, damaged 9,818 buildings flooded above floor level and 21,852 buildings flooded below floor level. This rainfall caused the largest economic loss by flood damage after the Isewan Typhoon, flooding about 37% of the houses in the city (Nagoya City, 2001). In this study, we refer to the flood caused by the Tokai heavy rainfall as the “recent flood.”
The inundated areas by the Isewan, 1970's, and recent floods are shown in Figures 1A–C, respectively, which were recorded in Nagoya Hokubu (North) and Nanbu (South) in the “Map of Natural Disasters (Flood and Sediment Disasters)” surveyed by the MLITT (Ministry of Land, Infrastructure, Transport and Tourism, 2012).
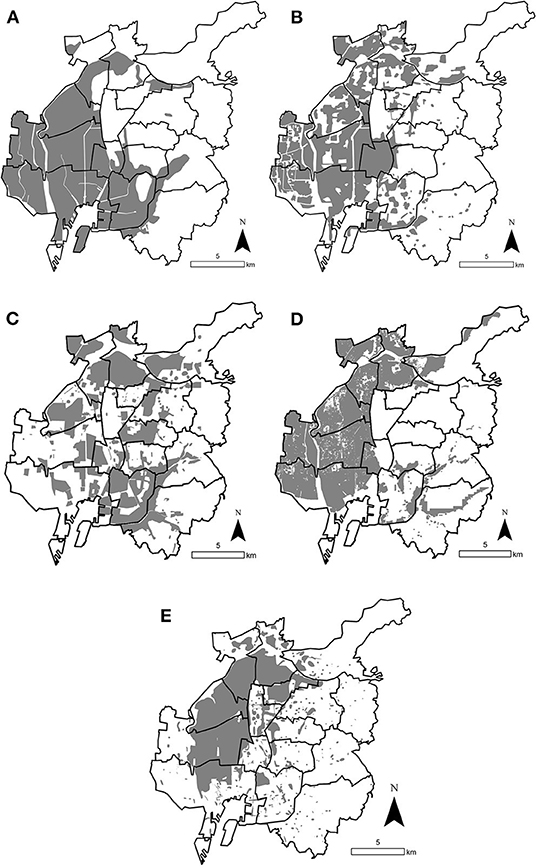
Figure 1. Inundated areas and flood risk zones. (A) Inundated areas during the Isewan flood in 1959. (B) Inundated areas during the 1970's floods. (C) Inundated areas during the recent flood in 2000. (D) Flood risk zones published in 2010. (E) Areas inundated by heavy rains in 2008, 2009, 2011, and/or 2013.
In 2010, the Nagoya City government published flood risk maps and distributed them to all households, referred to as the “disclosure of flood risk information” in this study. The flood risk zones are shown in Figure 1D and presented in the “Inland Waters/Flood Risk Map” (Nagoya City, 2010) and “Nagoya City Disaster Prevention App” (Nagoya City, 2012). There were four flood events before and after the publication of the disclosure of flood risk information. As it is necessary to separate the impacts of these floods from the disclosure of flood risk information, the areas inundated by heavy rains in 2008, 2009, 2011, and/or 2013 (Figure 1E), which are recorded in the “Maps of Inundation Records” (Nagoya City, 2020b), were excluded from the analysis. Figure 2 indicates the timeline of events analyzed in this study.
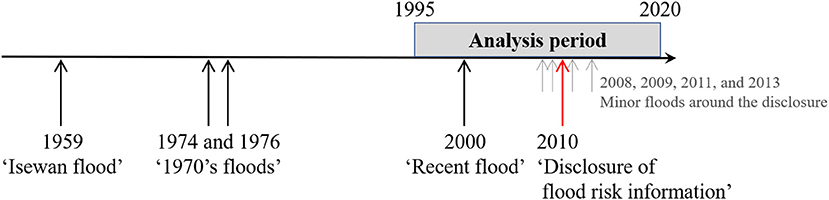
Figure 2. Timeline of events.
The residential property values used in this study are included in the appraisal land price datasets, “Chika-koji (Land Market Value Publication)” based on the Public Notice of Land Prices Act and “Chika-chosa (Prefectural Land Price Survey)” based on the Order for Enforcement of the National Land Use Planning Act, released by the MLITT and the Aichi Prefectural Government Office, respectively (Ministry of Land, Infrastructure, Transport and Tourism, 2021). Note that these values are not transaction prices but appraised prices that are based on the transaction prices in neighborhoods. The first objective of publishing these data was “to publish the market value index for ordinary land transactions” (Ministry of Land, Infrastructure, Transport and Tourism, 2008). The Land Appraisal Committee of MLITT and the governors of prefectures select the properties with standard attributes in their neighborhoods. In residential areas, residential properties whose attributes such as size, width of frontage road, floor area ratio, and surrounding environment are close to the normal property attributes in their neighborhood are selected. Then, the real estate appraisers are requested to assess property values based on the surveys of the real estate transaction prices in their neighborhoods, and the values as of January 1 and July 1 are published each year. These data reflect the evaluation by market participants; therefore, it is expected that the price with flood risks would be cheaper only if the risk is considered in the market. The properties included in the publication are usually fixed, unless their attributes are altered; this is advantageous when observing the annual changes in property values.
In this study, the residential properties located inside residential zones designated by the city were selected. Note that the residential property is not necessarily a property in residential use. The number of residential properties differed by year during the study period: 14,601 from 1995 to 2020 (entire analysis period) and 603 properties in 2001, soon after the recent flood (Figure 3). However, the number of properties whose values had been published during the entire analysis period was limited to 181; we utilized all residential property value data.
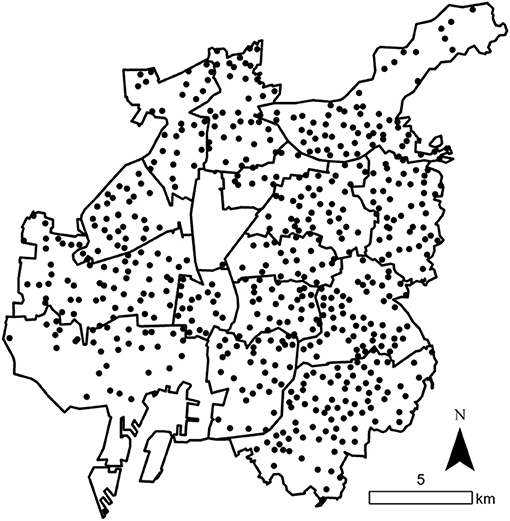
Figure 3. Spatial distribution of properties for which values were published in 2001.
Models and Setting of Analysis
We intend to quantify the impact of the occurrence of floods and the disclosure of flood risk information on residential property prices and discuss the factors of the generation of the flood risk awareness of real estate market participants and residents. We utilized a hedonic pricing model to evaluate the economic values of environmental attributes that are non-marketed goods. It is effective in removing the effects of property attributes that are not related to flood risk, such as size and traffic convenience from property values, and extracting the impact of flood risk-related events on property values. The basics of the linear regression model used in this study can be described as follows:
where yit denotes the explained variable, which is the natural logarithm of the property value per square meter at location i in year t; α is a constant term; xit,j denotes the j-th explanatory variable that represents a property attribute at location i in year t (Table 1); βj denotes a parameter of the j-th explanatory variable j; Yearit denotes a dummy variable that sets the reference year at 1995, indicating that the year of the property value data is t; γt denotes a parameter for year t that represents the property values compared to those in 1995; Floodκit denotes a dummy variable indicating that the property at location i in year t belongs to the treatment group κ; δκt denotes a parameter for the difference of values of the treatment group κ from the reference group in year t; εit is the disturbance; and σ2 is the variance of the disturbance. The parameters were estimated by ordinary least squares. Note that parameters α and β in Equation (1) were estimated at a significance level of 5% or less in all analyses.
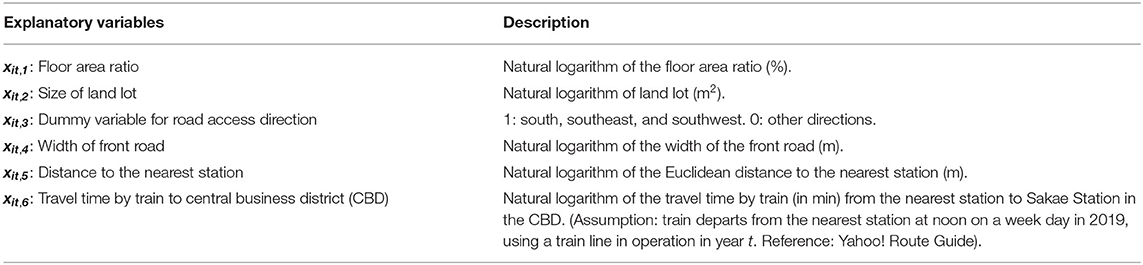
Table 1. Explanatory variables.
This analysis focuses on the transition of the estimated parameters of δκt and considers their relationships with flood-related events. As the natural logarithm of the residential property values is used as the explained variable, δκt indicates that the property values of treatment group κ in year t are exp(δκt) times larger than the property values of the reference group. When the estimated value of δκt is −0.1, the property values of the treatment group κ in year t are ~10% lower than the values of the reference group.
Analysis 1 was performed to determine the differences in the impacts of the Isewan, 1970's, and recent floods on property values. We hypothesized that the impact of floods on residential property values differs by the number and magnitude of experienced floods. If a property was damaged by the Isewan and 1970's floods, which occurred before the analysis period, the recent flood would not affect the values, and as the damage by the Isewan flood was more severe than that by the 1970's floods, there might be a difference in their impacts on property values. Properties were categorized into seven treatment groups and a reference group based on their flood experience (Table 2). By setting the properties that were not damaged during the three flood events as a reference group, the differences in the values of properties that experienced damages by the three flood events were determined.
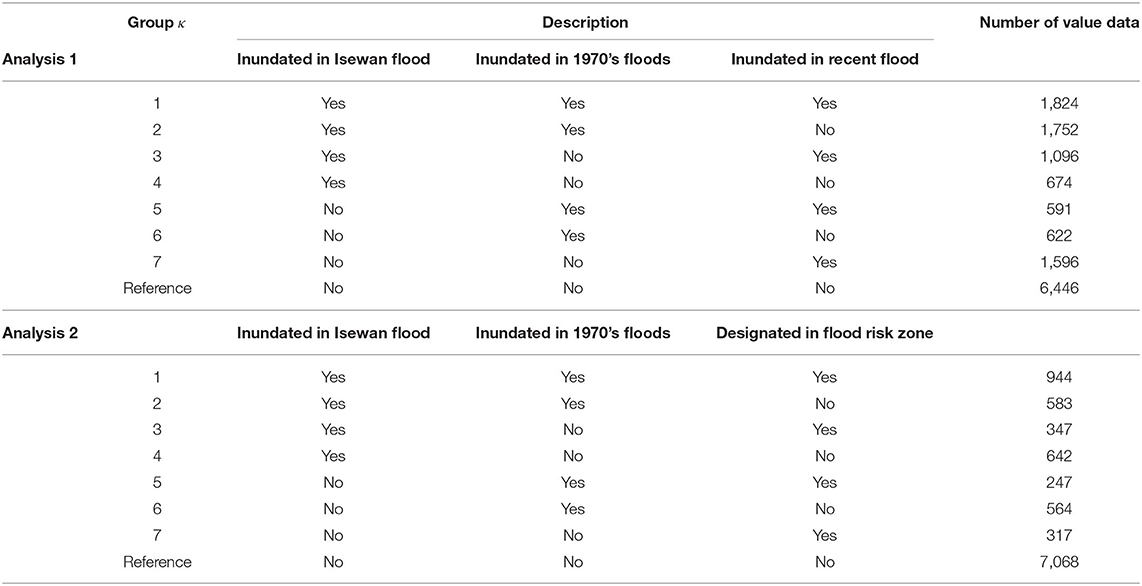
Table 2. Settings of treatment and reference groups.
Analysis 2 was performed to determine the impact of the disclosure of new flood risk information after 2010. The areas inundated by heavy rains in 2008, 2009, 2011, and 2013 were excluded from the target area to remove the impact of these flood events and focus on the impact of the disclosure of flood risk information on property values. A total of 3,889 cases were removed, and 10,712 cases were utilized in analysis 2. We hypothesized that the impact of disclosure differs depending on the previous flood experience. If a property was damaged in any previous flood, the flood zone designation would be trivial, so that property values would not be affected, while no flood risk designation would increase property values. With an improvement in flood mitigation and prevention measures, many areas fall in the latter category. On the contrary, if a property was not damaged by floods previously, but placed in a designated flood zone, its value was likely to fall. In this analysis, the values of the properties without flood damage during the Isewan and 1970's floods and flood zone designation were taken as a reference. The differences in the values of the properties that previously experienced the Isewan and/or 1970's floods and were placed in designated flood zones, those that experienced flood damage but were not located in flood risk zones, and those that did not experience flood damage but were located in flood risk zones were estimated (Table 2).
Results
Analysis 1: Impact of Inundation in the Three Flood Events
The estimated parameters of δκt indicate the devaluation of properties in areas inundated during the three flood events compared to the properties located outside of those areas. Figure 4 shows the transition of the estimated parameter δκt with bars indicating the 95% confidence interval.
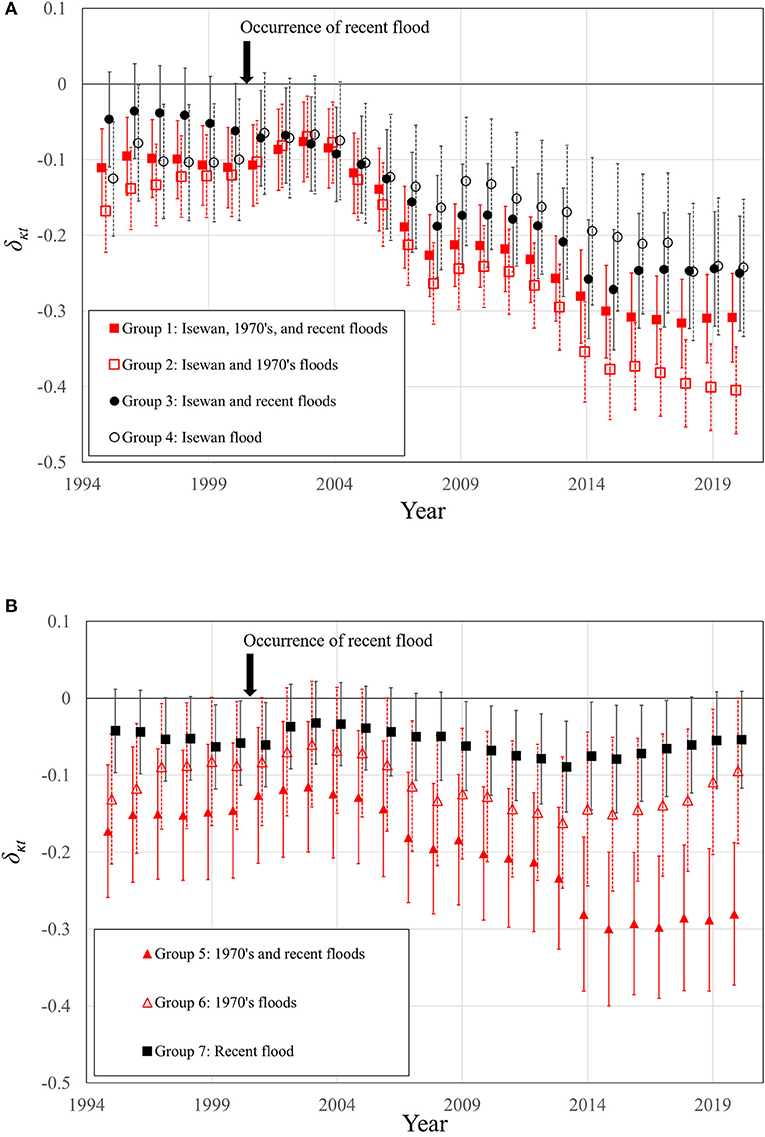
Figure 4. Estimated parameters of the devaluation of properties in seven groups compared with properties that were not inundated in the Isewan, 1970's, or recent floods. (A) Groups 1–4. (B) Groups 5–7.
The parameters in treatment groups 1 and 2 (δ1t and δ2t, respectively), both located in the inundated areas of the Isewan and 1970's floods, were estimated to be negative in all years at a significance level of 5%. Both treatment groups showed similar variations in property values after the recent flood in 2000, regardless of being damaged during that flood event, and the degree of devaluation increased.
The parameters in treatment groups 3 and 4 (δ3t and δ4t, respectively), both located in the inundated areas of the Isewan flood but not in those of the 1970's floods, were estimated to be negative in most years at a significance level of 5%. Similar to treatment groups 1 and 2, treatment groups 3 and 4 showed similar variations in property values after the recent flood in 2000, regardless of being damaged during that flood event.
However, the parameters in treatment groups 5 and 6 (δ5t and δ6t, respectively) were different. Both were located in the inundated areas of the 1970's floods but not in those of the Isewan flood. Similar to the above-mentioned results, they did not respond to the recent flood soon after its occurrence, but after 2014, the parameter of treatment group 6, where there were no damages by the recent flood, converged to zero. The difference in the transition of devaluations after 2010 might be affected by the disclosure of flood risk information, which is further investigated in analysis 2.
The parameters of treatment group 7 (δ7t), which was only affected by the recent flood, were estimated as small negative values; most of them were not significant and did not change throughout the entire analysis period. This group did not respond to the occurrence of the recent flood.
In summary, the following results are observed from analysis 1. The Isewan flood had a large impact on property values, while the 1970's floods had smaller impacts. The property values in the groups with multiple floods had a large impact, which declined in the latter half of the analysis period. The recent flood did not have impact on property values in any treatment group.
Analysis 2: Impact of Flood Risk Map Publication
The reference group of analysis 2 included properties that were not flooded in Isewan and the 1970's floods and were not located in flood risk zones. The estimated parameters of δκt indicate a devaluation of properties compared to the reference group. As the recent flood did not have an impact, it was removed as a control group in analysis 2. Figure 5 shows the transition of the estimated parameter δκt, with bars indicating 95% confidence interval.
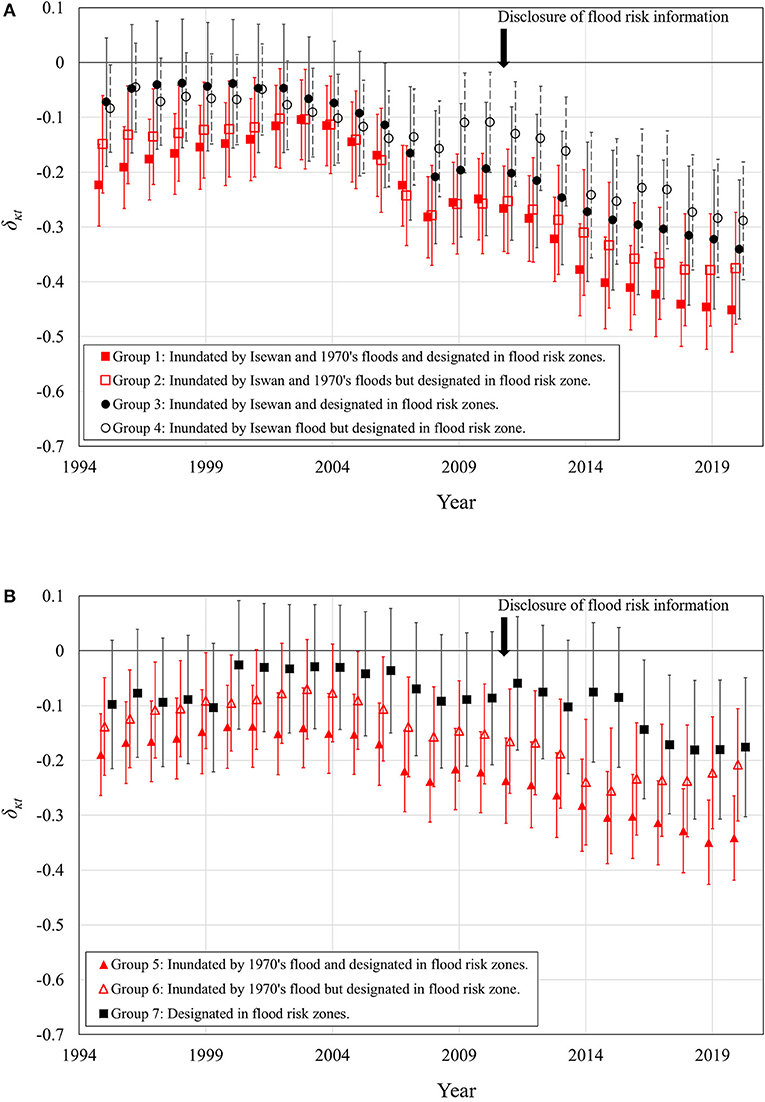
Figure 5. Estimated parameters of the devaluation of properties in seven groups compared with properties that were not inundated in the Isewan and 1970's floods and were not designated in flood risk zones, after excluding the properties in areas inundated by heavy rains in 2008, 2009, 2011, and 2013. (A) Groups 1–4. (B) Groups 5–7.
As the number of data points in several treatment groups was small, their estimated parameters were strongly influenced by the value of each property, and the confidence intervals were large. For example, there were only 317 properties during the entire analysis period (26 years) in treatment group 7 (number of properties that were not flooded by Isewan or 1970's floods but were located in designated flood risk zones), i.e., ~12 properties each year, which was <2% of the total data points. It has to be noted that the estimated parameters for treatment group 7 changed greatly between 1999 and 2000. Although the properties whose values were published were not usually altered, which made it easier to observe annual variations in the values, one property in treatment group 7 was replaced in 2000; that is, a property whose value was lower than the average value of treatment group 7 was replaced by a property whose value was higher than the average. However, as the focus of analysis 2 was the impact of flood risk publication in 2010, we do not discuss the change in parameters for treatment group 7 in 2000 hereafter.
Although the impact of disclosure of flood risk information was not detected in the analysis, the devaluation of treatment group 7 from the reference group after 2017 had a significance level of 5%, suggesting that the disclosure of flood risk information impacted the valuation of properties that were not damaged by previous floods. Additionally, the expansion of devaluation of treatment group 1 from treatment group 2, that of treatment group 3 from treatment group 4, and that of treatment group 5 from treatment group 6 was observed in the latter half of the analysis period, although it was not significant. The devaluations of all treatment groups from the reference group appeared to be increasing, but the magnitude of devaluations of the treatment groups whose properties were not designated in flood risk zones tended to be lower; however, significant recovery in property values was not observed if properties were not located in the designated flood risk zones.
Discussion
The properties that were flooded and/or located in designated flood risk zones were further devalued after 2005 because of the damages caused by the largest category 5 typhoon that hit eastern Japan (October 2004) after World War II. There were no severe damages in Nagoya City during that specific event, but the significant increase in the number of typhoons that approached Japan in recent years increased the national interest in flood risk mitigation efforts. In addition, property values started to decrease in 2011 after the Great East Japan Earthquake that intensified the interest in natural disaster risk awareness as well as the disclosure of flood risk information in 2010.
Analysis 1 performed in this study suggests that the properties flooded before the analysis period were always valued lower, even after a long time had passed since the disaster. The flood damage experienced especially in the “historical” Isewan flood had a great impact on communities many years later, and previously flooded areas are still recognized as high flood-risk areas.
The values of properties did not respond to the occurrence of the recent flood. This suggests that flood risk awareness was not updated for those properties after the new event. This result is consistent with that of the study by Inoue and Komori (2017), which targeted a flood-prone region and observed no impacts on the values of properties at flood occurrences, but differs from most of previous studies that observed devaluation of properties after flood occurrences (e.g., Bin and Polasky, 2004; Kousky, 2010; Atreya et al., 2013; Bin and Landry, 2013; Atreya and Ferreira, 2015; Nyce et al., 2015; Votsis and Perrels, 2016; Ortega and Tapinar, 2018). In addition, the values of properties that were not flooded in the past but in the recent flood were lower (not always statistically significant). This suggests that the flood risk is considered in the evaluation of properties, even before they experience any damage. The properties that were not located in the inundation area of floods before the analysis period but in those of the recent flood may have experienced flood damage in other, smaller events that had not been recorded because Nagoya City experienced frequent flood damages in recent years. Even the values of properties with relatively low flood risks might have been affected.
In analysis 2, the values of properties that had not flooded previously but were designated as flood-risk zones declined. This finding is consistent with that of Gibson et al. (2019). The values of the properties that were inundated by previous floods and were located in the designated flood risk zones continuously declined, whereas the values of properties that were inundated by previous floods but were not located in the designated flood zones displayed a slower decline after the disclosure of flood risk information, although the difference was not statistically significant. This indicates that informing the public about the flood risk impacts residential property values, although no-flood-zone designation did not increase property values. The first finding is consistent with that of Hill (2015), but the second finding is different from that of Indaco et al. (2019), who observed increasing property prices following the downgrading of the flood risk. The target area in this study has frequently been affected by floods, and the flood damage experience has not been forgotten.
Finally, the comparison of the results of all analyses suggests that the inundation by the Isewan flood had the largest impact on residential property values in Nagoya City, even in recent years. The long-lasting effects of floods continue to raise flood risk awareness in the target area. The disclosure of flood risk information also had a large impact, while recent flood damage had the smallest impact on residential property values. This finding is different from the results of Atreya and Ferreira (2015), which indicated that the actual flood damage had a negative impact on residential property values, while the flood hazard designation did not. Although these results may reflect the general characteristics of flood-prone regions, they need to be validated with further case studies for other flood-prone regions.
Conclusions
This study analyzed the impact of flood events on residential property values in Nagoya City, Aichi Prefecture, Japan. The target area was in the flood-prone region and had experienced frequent flood damage. We analyzed the impacts of four events, the Isewan and 1970's floods that occurred before the analysis period, the recent flood that occurred during the analysis period, and the disclosure of flood risk information during the analysis period. The results revealed that the damage by the Isewan flood had the largest impact on residential property values in Nagoya City, and the devaluation recently increased due to the growing concern about natural disasters in Japan. The disclosure of flood risk information also impacted property values, increasing devaluation after disclosure. In contrast, the occurrence of the recent flood did not influence property values, suggesting that flood risk awareness had already been strong in the target area before the recent event.
The findings of this study are different from those of most previous studies, which mainly targeted flood events in regions where floods have not frequently occurred, while the findings of this study enforced previous findings on the relationship between the devaluation of residential properties and flood risk awareness by depicting the pattern in the flood-prone region. The reaction of residential property values observed in this study might be a common characteristic of flood-prone regions, where flood risk awareness is enhanced due to repeated flood damage. Because only a few studies targeting flood-prone regions have been conducted, further analyses are required to verify these results. Comparative studies between regions with different levels of flood risks are also required to find common responses of residential property values to flood risk awareness.
Considering that the relationship between the devaluation of residential properties and flood risk awareness holds in many regions, despite the frequency of floods, the devaluation trend after the disclosure of flood risk information could be utilized to quantify the spread of information. The results would be useful in detecting subregions into which information has not diffused and building strategies to promote publicity of flood risk information.
Data Availability Statement
Publicly available datasets were analyzed in this study. This data can be found at: Nagoya Hokubu (North) and Nanbu (South) of Map of Natural Disaster (Flood and Sediment Disaster) https://nlftp.mlit.go.jp/kokjo/inspect/landclassification/land/saigai_rireki.html. Nagoya City: Flood/Inland Water Hazard Map. http://www.city.nagoya.jp/kurashi/category/405-5-11-0-0-0-0-0-0-0.html; Maps of inundation records in Nagoya City. https://www.city.nagoya.jp/ryokuseidoboku/page/0000021585.html. “Chika-koji” and “Chika-chosa,” released by the MLITT and the Aichi Prefectural Government Office https://www.land.mlit.go.jp/landPrice/AriaServlet?MOD=2&TYP=0.
Author Contributions
RI contributed to conception and design of the study. KH organized the database, performed the statistical analysis, and wrote the first draft of the manuscript. RI and KH wrote sections of the manuscript. Both authors contributed to manuscript revision, read, and approved the submitted version.
Conflict of Interest
The authors declare that the research was conducted in the absence of any commercial or financial relationships that could be construed as a potential conflict of interest.
Abbreviations
FEMA, Federal Emergency Management Agency; MLITT, Ministry of Land, Infrastructure, Transport and Tourism.
References
Atreya, A., and Ferreira, S. (2015). Seeing is believing? evidence from property prices in inundated areas. Risk Anal. 35, 828–848. doi: 10.1111/risa.12307
Atreya, A., Ferreira, S., and Kriesel, W. (2013). Forgetting the flood? an analysis of the flood risk discount over time. Land Econ. 89, 577–596. doi: 10.3368/le.89.4.577
Bin, O., and Landry, C. E. (2013). Changes in implicit flood risk premiums: empirical evidence from the housing market. J. Environ. Econ. Manage. 65, 361–376. doi: 10.1016/j.jeem.2012.12.002
Bin, O., and Polasky, S. (2004). Effects of flood hazards on property values: evidence before and after Hurricane Floyd. Land Econ. 80, 480–500. doi: 10.2307/3655805
Gibson, M., Mullins, J. T., and Hill, A. (2019). Climate Risk and Beliefs: Evidence from New York Floodplains. Working Paper 2019-02. Williamstown, MA: Williams College, Department of Economics.
Hatori, K., and Inoue, R. (2020). Impact of flood experiences and risks on land prices in frequently-flooded areas: a case study on Nagoya City. J. Jpn. Soc. Civil Eng. Ser. B1 76, 703–708. doi: 10.2208/jscejhe.76.I_703
Hill, A. (2015). Do Floodplain Delineations Decrease Property Values? Evidence From New York City After Hurricane Sandy. Working Paper. Williamstown, MA: Center for Environmental Studies, Williams College. Available online at: https://ces.williams.edu/files/2009/08/Hill_Hurricane_Sandy_floodplains_propvalue-2.pdf (accessed January 21, 2021).
Indaco, A., Ortega, F., and Taşpinar, S. (2019). The effects of flood insurance on housing markets. Cityscape 21, 129–156. Available online at: https://www.huduser.gov/portal/periodicals/cityscpe/vol21num2/article6.html
Inoue, R., and Komori, D. (2017). “Flood impacts on residential property prices in frequently flooded areas: evidences from Kanda river basin, Tokyo,” in Proceedings of the 15th International Conference on Computers in Urban Planning and Urban Management, Paper A63 (Adelaide SA).
IPCC (2013). Climate Change 2013: The Physical Science Basis. Contribution of Working Group I to the Fifth Assessment Report of the Intergovernmental Panel on Climate Change. Cambridge University Press.
Kousky, C. (2010). Learning from extreme events: risk perceptions after the flood. Land Econ. 86, 395–422. doi: 10.3368/le.86.3.395
Ministry of Land Infrastructure Transport Tourism. (2008). Land Market Value Publication (Previously called the “Land price public notice system”). Available online at: https://www.mlit.go.jp/en/totikensangyo/totikensangyo_fr4_000001.html (accessed March 17, 2021).
Ministry of Land Infrastructure Transport Tourism. (2012). Nagoya Hokubu (North) and Nanbu (South) of Map of Natural Disaster (Flood and Sediment Disaster). Available online at: https://nlftp.mlit.go.jp/kokjo/inspect/landclassification/land/saigai_rireki.html (accessed January 21, 2021).
Ministry of Land Infrastructure Transport Tourism. (2020). Press Release: Mandatory Explanation of the Location of the Target Property on the Flood Risk Map at the Time of Real Estate Transaction (不動産取引時において、水害ハザードマップにおける対象物件の所在地の説明を義務化). Available online at: https://www.mlit.go.jp/report/press/content/001354556.pdf (accessed January 21, 2021).
Ministry of Land Infrastructure Transport Tourism. (2021). Land Market Value Publication and Prefectural Land Price Survey (国土交通省地価公示, 都道府県地価調査). Available online at: https://www.land.mlit.go.jp/landPrice/AriaServlet?MOD=2andTYP=0 (accessed March 22, 2021).
Nagoya City (2001). Record of Tokai Heavy Rain and Flood Damage (東海豪雨水害に関する記録). Available online at: https://www.city.nagoya.jp/bosaikikikanri/cmsfiles/contents/0000127/127712/kirokusyu.pdf (accessed January 21, 2021).
Nagoya City (2010). Nagoya City: Flood/Inland Water Risk Map (洪水・内水ハザードマップ). Available online at: http://www.city.nagoya.jp/kurashi/category/405-5-11-0-0-0-0-0-0-0.html (accessed January 21, 2021).
Nagoya City (2012) Nagoya City Disaster Prevention App. (名古屋市防災アプリ). Available online at: https://www.city.nagoya.jp/bosaikikikanri/page/0000057745.html (accessed January 21, 2021).
Nagoya City (2017). Flood Damage Chronology That Caused Damage to the Nagoya City Area (名古屋市域に被害をもたらした水害年表). Available online at: https://www.city.nagoya.jp/bosaikikikanri/cmsfiles/contents/0000093/93310/75-77_husuigainenpyo.pdf (accessed January 21, 2021).
Nagoya City (2020a). Isewan Typhoon (伊勢湾台風について). Available online at: https://www.city.nagoya.jp/bosaikikikanri/page/0000128318.html (accessed January 21, 2021).
Nagoya City (2020b). Maps of Inundation Records in Nagoya City(名古屋市浸水実績図). Available online at: https://www.city.nagoya.jp/ryokuseidoboku/page/0000021585.html (accessed March 22, 2021).
Nyce, C., Dumm, R. E., Sirmans, G. S., and Smersh, G. (2015). The capitalization of insurance premiums in house prices. J. Risk Insur. 82, 891–919. doi: 10.1111/jori.12041
Ortega, F., and Tapinar, S. (2018). Rising sea levels and sinking property values: hurricane sandy and New York's housing. J. Urban Econ. 106, 81–100. doi: 10.1016/j.jue.2018.06.005
Rosen, S. (1974). Hedonic prices and implicit markets: product differentiation in pure competition. J. Polit. Econ. 82, 34–55. doi: 10.1086/260169
The Asahi Shimbun Digital (2018). Inundation Area That Overlaps With the Flood Risk Map, but Cannot prevent Victims (ハザードマップと重なった浸水域、それでも犠牲者防げず). Available online at: https://www.asahi.com/articles/ASL7956K2L79PTIL02N.html (accessed January 21, 2020).
Keywords: residential property values, flood risk, flood-prone regions, historical flood, flood risk information, Nagoya City
Citation: Inoue R and Hatori K (2021) How Does Residential Property Market React to Flood Risk in Flood-Prone Regions? A Case Study in Nagoya City. Front. Water 3:661662. doi: 10.3389/frwa.2021.661662
Received: 31 January 2021; Accepted: 12 May 2021;
Published: 09 June 2021.
Edited by:
James Andrew Griffiths, National Institute of Water and Atmospheric Research (NIWA), New ZealandReviewed by:
Heidi Kreibich, German Research Centre for Geosciences, Helmholtz Centre Potsdam, GermanyAnamika Barua, Indian Institute of Technology Guwahati, India
Copyright © 2021 Inoue and Hatori. This is an open-access article distributed under the terms of the Creative Commons Attribution License (CC BY). The use, distribution or reproduction in other forums is permitted, provided the original author(s) and the copyright owner(s) are credited and that the original publication in this journal is cited, in accordance with accepted academic practice. No use, distribution or reproduction is permitted which does not comply with these terms.
*Correspondence: Ryo Inoue, cmlub3VlJiN4MDAwNDA7dG9ob2t1LmFjLmpw