 Grith Martinsen1,2,3,4*
 Suxia Liu2,4
 Xingguo Mo2,4
 Claus Davidsen1
 Raphaël Payet-Burin1
 Peter Bauer-Gottwein1
- 1Air, Land and Water Resources, Department of Environmental Engineering, Technical University of Denmark (DTU), Lyngby, Denmark
- 2Key Laboratory of Water Cycle and Related Land Surface Processes, Institute of Geographic Sciences and Natural Resources Research, Chinese Academy of Sciences (CAS), Beijing, China
- 3Sino-Danish Center for Education and Research, Aarhus, Denmark
- 4Sino-Danish College, University of Chinese Academy of Sciences, Beijing, China
This study analyses the impact of assuming perfect foresight of future agro-hydrological events in hydroeconomic analysis of water infrastructure projects. The impact is evaluated based on the estimated monetary benefits of a proposed water infrastructure investment diverting Yellow River water to the Hai River basin in China, resulting in supply augmentation and improved water quality. The impact of foresight is quantified as the change in project benefits, evaluated with different assumed lengths of future foresight compared to a perfect foresight benchmark. A hydroeconomic optimization model formulated as a deterministic Linear Program, LP, is optimized to represent the perfect foresight benchmark. Imperfect foresight is modeled by wrapping the hydroeoconomic optimization model in a Model Predictive Control, MCP, framework. Using this LP-MPC framework, different lengths of foresight can be modeled by continuous re-optimizations with updated forecasts over a planning horizon. The framework is applied to the water-scarce and polluted Hai River basin in China, which is suffering from groundwater overdraft and is dominated by agricultural irrigation demands. The hydroeconomic optimization model describes the nine largest reservoirs in conjunctive use with the major groundwater aquifers. The water infrastructure project, allowing transfers of Yellow River water to the plain area of the Hai River basin, is evaluated under long-term sustainable groundwater abstraction constraints, and joint water allocation and water quality management. The value of foresight in agricultural water allocations is represented, using a model that links yield response to water allocations, accounting for delayed yields in agricultural irrigation. Estimated benefits of the proposed project evaluated with decreasing lengths of foresight and compared to the perfect foresight benchmark show that an assumption of perfect foresight underestimates the actual benefits of the water infrastructure investment in the irrigation intensive Hai River basin. This study demonstrates that it is important to evaluate the impact of assuming perfect foresight in any hydroeconomic analysis, to avoid misleading conclusions regarding the costs and benefits of planned projects.
Introduction
Water resources planning often deals with the question of “how to best adapt to future conditions?” Such adaptation can include investments in new water infrastructure or modified water allocation schemes. Decision support models for water resources management address questions about future decisions of “what if?” and “what is best?,” but often assume perfect foresight of future conditions (e.g. Medellin-Azuara et al., 2015; Burek et al., 2018). The impact of assuming perfect foresight of future agro-hydrological events in hydroeconomic modeling is the focus of this study.
Hydroeconomic optimization models can identify optimal water resources management strategies under one or several objectives, subject to system constraints. In highly engineered river basins with multiple surface water reservoirs and strong interactions between the hydrological cycle and human abstractions, the level of future foresight will influence the performance of the water resources management and water infrastructure investments. With an assumption of perfect foresight, all decisions of storage and release will be based on an anticipation of all future droughts and floods. In reality, water managers are not able to predict exactly how the future will play out, which might result in significant costs for the water users in the system. Such unforeseen costs might also be reflected in inaccurate estimates of water infrastructure investments benefits in a dynamic system.
The effect of future uncertainties is a continuous subject of research in reservoir operation. Methods based on Stochastic Dynamic Programming, SDP, were developed to account for the stochastic properties of reservoir inflow. These methods are limited by the curse of dimensionality, which is inherent in Dynamic Programming (Bellman, 1961). The method has been used, in combination with the water value method (Stage and Larsson, 1961), to optimize and simulate water resource management in systems with a limited number of surface water reservoirs. An example is the study by Davidsen et al. (2015), which had to be aggregated into one synthetic reservoir, to mitigate the curse of dimensionality. Faber and Stedinger (2001) contributed to the representation of stochastic water availability in SDP by integrating ensemble stream flow prediction forecast in Sampling Stochastic Dynamic Programming, SSDP, instead of applying the more widespread Markov Chain probabilities. With the development of Stochastic Dual Dynamic Programming, SDDP, (Pereira and Pinto, 1991), more complex systems with multiple reservoirs could be represented in optimization problems (e.g., Tilmant et al., 2008; Pereira-Cardenal et al., 2016). The SDDP method is sensitive to initial reservoir storage conditions as discussed by Rougé and Tilmant (2016) and yields the highest accuracy around the optimal solution, making it less suitable for adaptive management. Management of complex water systems is often formulated as deterministic perfect foresight model, but such models will underestimate system costs if not modified to consider the stochasticity of water availability. Khadem et al. (2018) is an example of a study that used evolutionary algorithms to estimate carry-over storage value functions in a complex water system model, in order to represent inter-annual uncertainties of water availability. Alemu et al. (2011) accounted for future uncertainties by applying a continuous control strategy, similar to the concept of Model Predictive Control, MPC, to a water resources management problem. They used continuous re-optimization with ensemble forecasts of hydrological inflow and energy prices to demonstrate the value of foresight on a single reservoir operation system for hydropower benefits over one hydrological year.
MPC is a well-known control strategy for optimization problems. It has its origin in industrial operation control, developed with the purpose of keeping desired output trajectories despite system disturbances (Richalet et al., 1978). It can be viewed as a system-wide control strategy of a dynamic system, designed for adaptive management. MPC operates with a control loop that continuously re-optimizes the system influenced by future disturbances. These disturbances can be stochastic variables, such as climate, hydrological inflow, demands etc. The use of MPC has previously been demonstrated in energy systems with hydropower benefits (Arnold and Andersson, 2011) and in real-time control of surface water in channeled/piped systems (Tian et al., 2017; Schou et al., 2018). Biglarbeigi et al. (2018) quantified the impact of future hydrological inflow and evapotranspiration uncertainties on multi-purpose reservoir operation from future ensemble simulations.
This study demonstrates the impact of assuming perfect foresight in hydroeconomic analysis by comparing a deterministic benchmark model with perfect foresight to an MPC-based model framework that simulates system operation under imperfect foresight. Imperfect foresight is modeled with an MPC framework wrapped around a deterministic Linear Programming, LP, model that is continuously fed with updated forecasts of climate and water availability and re-optimized over a planning horizon. The deterministic hydroeconomic model optimizes a multi-reservoir, dynamic system with conjunctive use of surface water and groundwater, that is challenged by water pollution and water scarcity. The model framework is used to quantify the differences in estimated benefits from a water infrastructure project with and without the assumption of perfect foresight. Re-optimization of the system performance over a planning horizon with different lengths of foresight provides quantitative estimates of the costs of adapting to unexpected future agro-hydrological events. The model is applied to the complex water management system of the Hai River basin in China, where a water infrastructure project “Yellow-into-Jin” is proposed to divert water from the Yellow River to the plain area of the basin. Irrigation agriculture is a major water user in the Hai River basin. The costs of uncertain future water availability will be especially pronounced among the agricultural users where unforeseen droughts can result in the loss of a full growth season yield. In the model framework, the agricultural scarcity costs are represented through the concept of delayed yield, where the crop yield is dependent on all previous water allocations during the entire growing season. By quantifying optimal operation under perfect foresight using LP and under imperfect foresight with the LP-MPC model, we are able to compare the resulting economic benefits, hence the impact of assuming perfect foresight. Additionally, comparing different lengths of foresight enables us to estimate the direct case-specific value of improved forecasts.
Data and Methods
Study Area
The Hai River basin, outlined in Figure 1, is one of the seven major Chinese river basins. It is located in a semi-arid continental monsoon climate with a highly seasonal precipitation pattern, resulting in 70–85% of the precipitation falling between June and September. The river basin contributes to around 10% of China's agricultural output (White et al., 2015) and is a part of the North China Plain, which is China's most intensively used agricultural area. A double-cropping system with irrigation-intensive winter wheat and dominantly rainfed summer maize has been identified as one of the major drivers for the groundwater depletion that has been going on for decades. On average, ~5.5 km3 groundwater has been overexploited every year from 2002 to 2013 in the Hai River basin, according to Shen et al. (2015). Surface water resources are mostly generated in the mountainous regions and the majority of the runoff is stored and regulated by the nine largest reservoirs of the basin, each with a capacity >1 km3. The intensively cultivated fields surround megacities as Beijing and Tianjin, and the area is densely populated. To alleviate the water scarcity in the region the South-to-North Water Transfer Project (SNWTP) was constructed to transfer water from the Yangtze River basin to the thirsty north (NSBD, 2001a,b). The middle and eastern routes of the SNWTP terminate in Beijing and Tianjin and the transfer of water all the way to Beijing has been functional since 2014 (NSBD, 2017). The Yellow River basin also feeds the Hai River basin with inter-basin transfers, both as abstractions along the lower reaches of the Yellow River, which makes up the southern fringe of the Hai River basin, as well as via an underground channel system, the “Yellow-into-Jin” project, further upstream the Yellow River. In addition to water scarcity, the Hai River basin also has the overall worst surface water quality of the major river basin in China. Chinese water quality standards classify surface water into six classes ranging from class I to < IV (Ministry of Environmental Protection, 2002), corresponding to good to very bad water quality, respectively, based on a set of water quality parameters. In the Hai River basin 36.8% of the monitored river network in a state of bad or very bad water quality (Ministry of Water Resources, 2016).
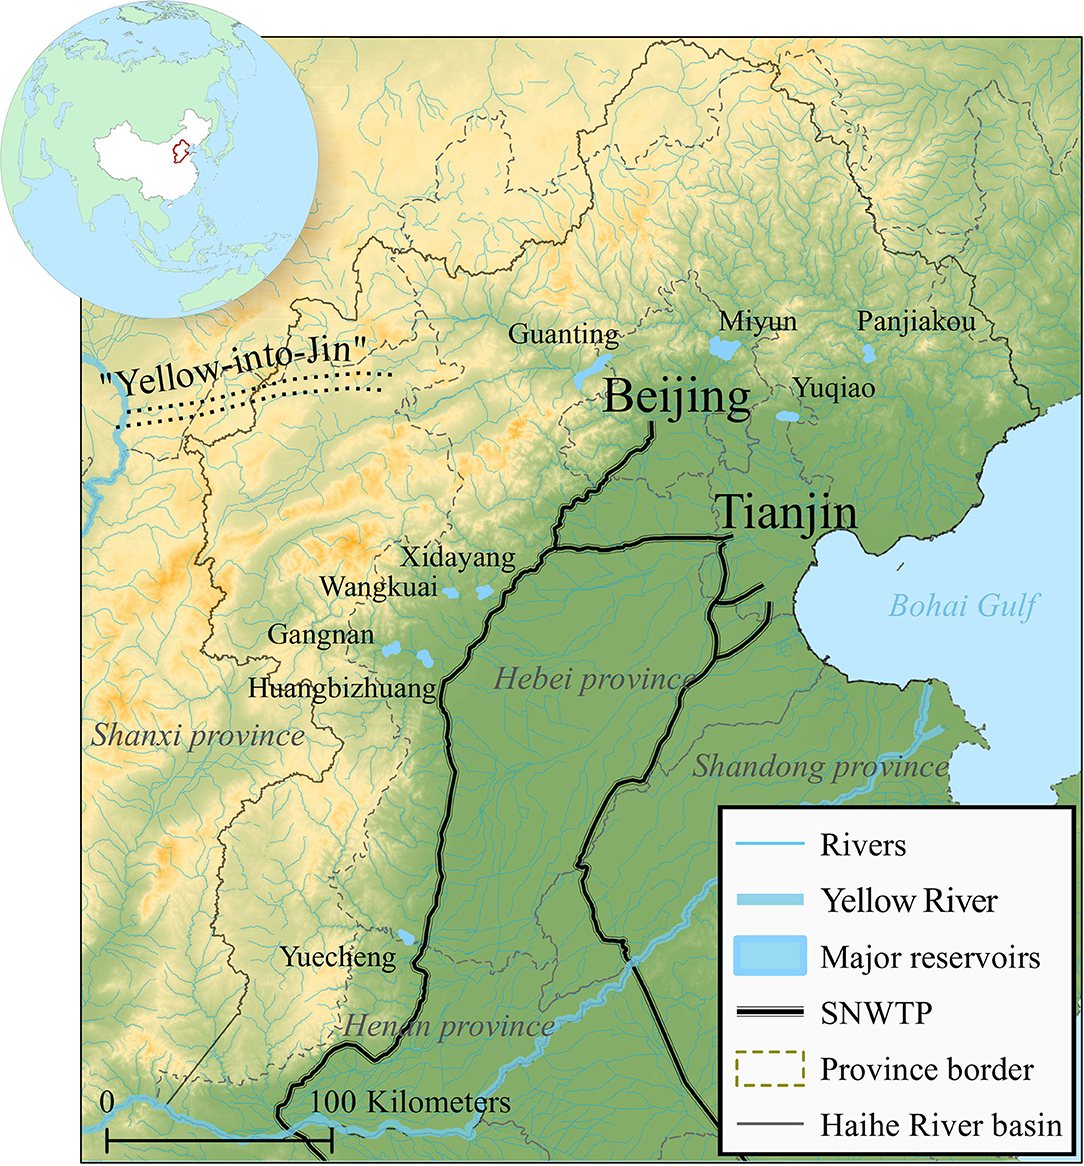
Figure 1. Map of the Hai River basin, the nine major surface water reservoirs and the inter-basin transfers from the Yellow River “Yellow-into-Jin” and the South to North Water Transfer Project (SNWTP). Modified from Martinsen (2019).
Hydroeconomic Model Input Data
The following sub-sections describe the data and methods used to represent all water availability, water demands and water associated costs in the hydroeconomic optimization model at monthly time steps. This study builds on top of previously published work by Martinsen et al. (2019a,b). For an elaboration on the methods used to generate model input data of water demands and water resources estimates the reader is referred to Martinsen et al. (2019b). A detailed description of the methods used to represent water quality data in the model and the implementation of water quality constraints in the hydroeconomic optimization model can be found in Martinsen et al. (2019a). Table 1 provides an overview of all acronyms and abbreviations used in the paper.
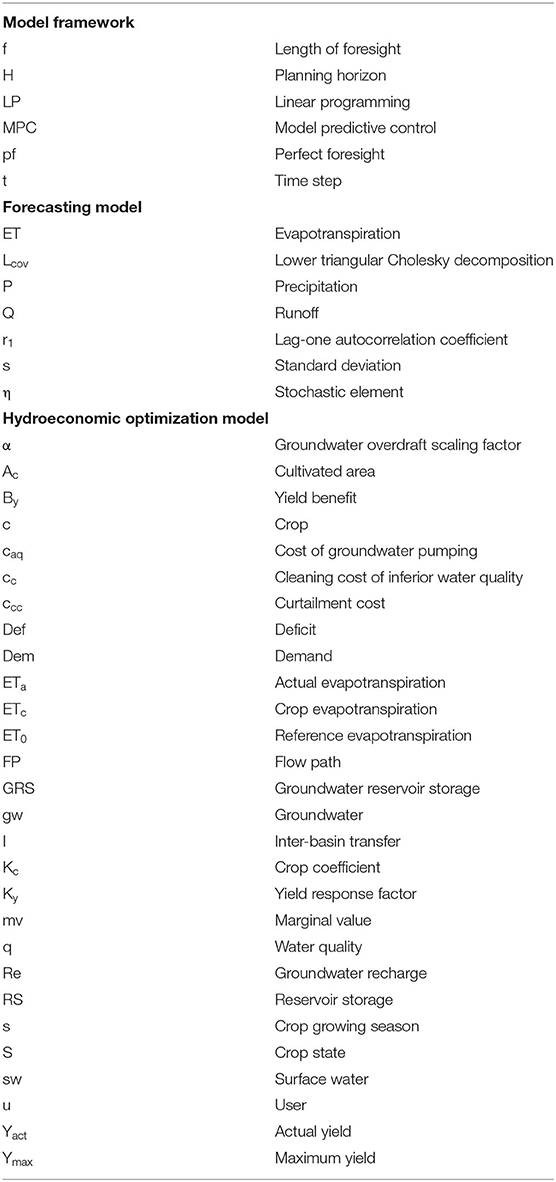
Table 1. List of acronyms and abbreviations used in the paper.
Water Demands
Water demands in the Hai River basin were described by four sectors of urban domestic, industrial, ecological and agricultural water demands. Agriculture was further subdivided into wheat, maize, vegetables, and orchards. Monthly time series of the non-agricultural water demands were estimated based on statistical data from the Chinese Statistical Yearbook (National Bureau of Statistics of China, 2015). Urban, industrial and ecological water demands were distributed spatially by scaling statistics on per capita water use with the 1 × 1 km resolution Landscan2016 population density product (Bright et al., 2017) and subsequently aggregated to the 16 model sub-basins (see Figure 2). Agricultural water demands, Demagr, were determined from the FAO 56 method (Allen et al., 1998) based on the cultivated area, Ac, for each crop, c, regional crop specific coefficients, Kc, and monthly precipitation and reference evapotranspiration time series, P and ET0, for each time step, t:
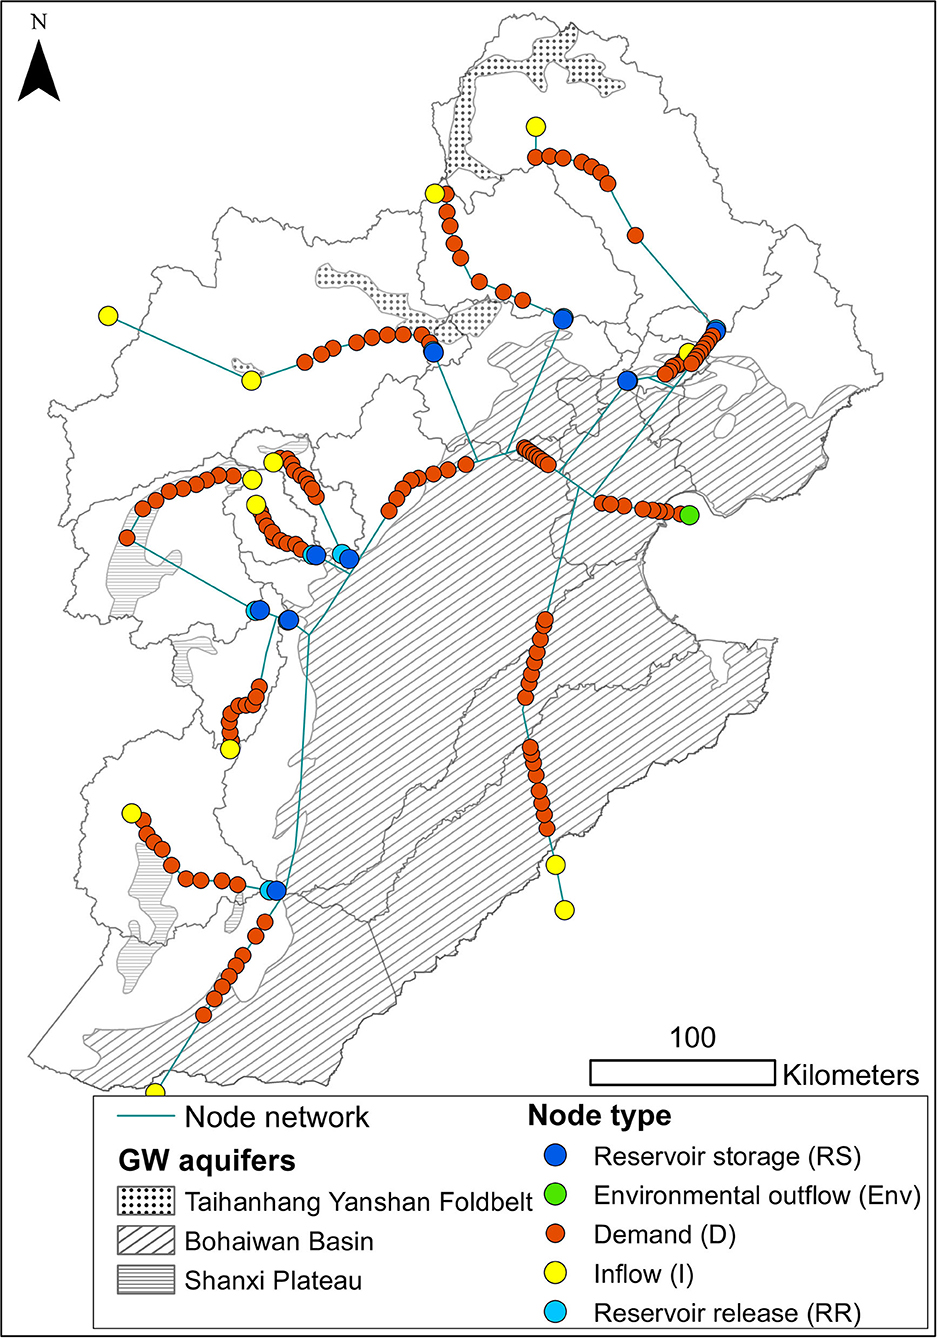
Figure 2. Conceptual illustration of the 16 sub-basins of the optimization model, the major groundwater recharge areas and the network of water sources (RR, I) and sinks (RS, Env, D) used to formulate the model flow path decision variables.
Water Availability
Runoff Modeling
The mountainous sub-basins upstream each of the nine largest reservoirs were assumed to be the major runoff generating areas within the model region. Surface water availability for use and storage within the Hai River basin was simulated with a Budyko rainfall-runoff model (Zhang, 2008). Three hydrological stations Goutaizi (41°35'N, 117°03'E), Pingshan (38°15'N, 114°12'E), and Kuangmenkou (36°27'N, 113°47'E) were chosen for model parameter calibration. The three minor sub-basins upstream these stations were located distant from each other in the mountainous region and their hydrographs seemed relatively undisturbed by human abstractions. Daily in-situ observed runoff at the three hydrological stations were split into a calibration period from 1971 to 1991 and a validation period from 2006 to 2011. Meteorological forcing data from the China Meteorological Agency (2017) consisted of daily precipitation as well as mean, maximum and minimum temperature data, which was interpolated at a 0.5 degree resolution by Mo et al. (2015). A proxy-basin validation was subsequently used to populate all nine upstream sub-basins with the best suitable rainfall-runoff model parameter sets for surface water runoff modeling using the meteorological forcing data. The meteorological forcing data was used to generate historical sub-basin time series of runoff, evapotranspiration and precipitation for an 8-years period covering 2007–2014. A detailed description of the rainfall-runoff calibration can be found in Martinsen et al. (2019b).
Groundwater Recharge
Groundwater availability in the model region was based on recharge rates for the major groundwater recharge areas in the Hai River basin. Three major recharge areas were delineated from the map “Maps Showing Geology, Oil and Gas Fields, and Geologic Provinces of the Asia Pacific Region” completed by the U.S. Geological Survey (Steinshouer et al., 1997). These include the Taihang Yanshan Fold Belt and Bohaiwan Basin which can be seen as hatched areas in Figure 2. Cao et al. (2013) have conducted a study using numerical groundwater modeling to estimate a recharge rate to the plain region of the Hai River basin, defining recharge as the main calibration parameter. Based hereon, and on other studies on groundwater recharge in the region by Shu et al. (2012) and Kendy et al. (2003), an average recharge rate of 120 mm/years was applied to the Bohaiwan Basin recharge area. The recharge rate to the smaller mountainous recharge areas were estimated by scaling the aforementioned recharge rate using precipitation to recharge ratios in the areas missing information on recharge.
Economic Data Set
A spatially distributed data set of economic costs and benefits associated with water allocations in the Hai River basin was collected and can be seen in Table 2. Curtailment costs cover the unit cost of not covering the full water demand. Water curtailments in grain producing agriculture is formulated as lost benefits from reduced yield. Curtailment costs for grain producing water users are based on Gan et al. (2008), and related to yield benefits by scaling the marginal value of irrigation water to the water demand of the cultivated area of each agricultural water user represented in the model setup. Yield benefits are further elaborated on in section Delayed Yield of Agricultural Grain Production. Groundwater pumping costs were 0.1 and 0.8 yuan/m3 for the shallow and deep plain aquifer units, respectively. For the mountainous groundwater aquifers it was 0.4 yuan/m3 (Martinsen et al., 2019a). Sub-basin specific treatment costs for water allocations with water qualities inferior to user water quality demands are based on data from H2O China (2000) and can be found in Martinsen et al. (2019a).
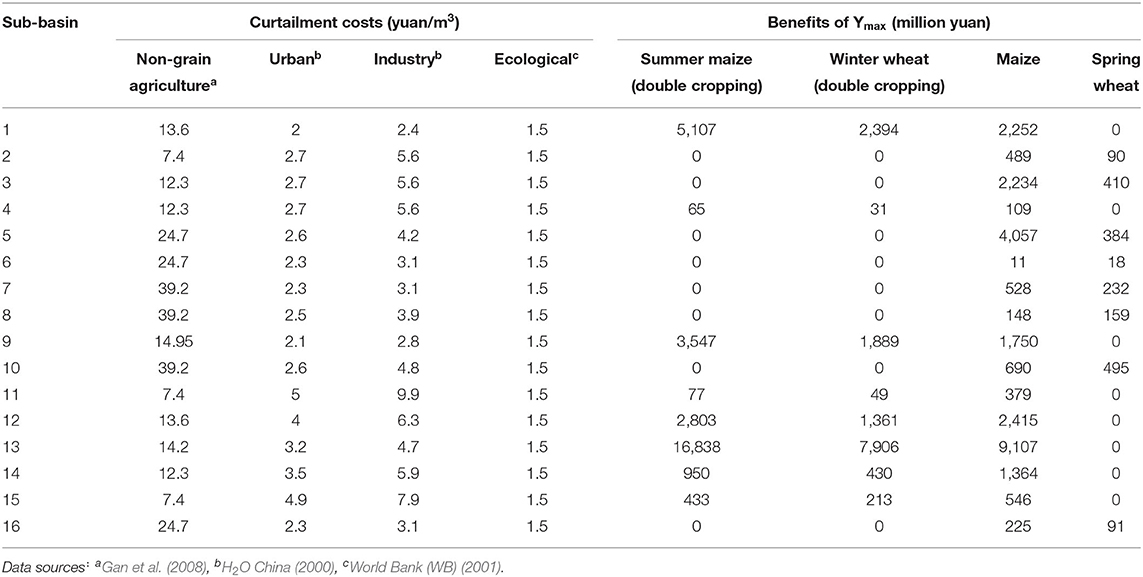
Table 2. Economic input data of curtailment costs of monthly curtailments and yield benefits at the end of the growing season.
Concept and Model Framework
This section explains the conceptual modeling framework of this study. In the subsequent sections each model component is described in more detail. The conceptual model framework developed in this study consists of three main components: (1) A statistical forecasting model used to simulate synthetic ensemble forecasts of climate and runoff data, (2) a deterministic hydroeconomic optimization model, formulated as an LP, optimizing water allocations in the Hai River basin, and (3) an MPC routine, also described as the LP-MPC framework, developed to continuously re-optimize the deterministic model (component 2) with updated ensemble forecasts (component 1) in each time step, t, over a moving horizon within a fixed planning horizon, H. The model framework was used to evaluate the impact of having “imperfect foresight,” as more representative of the reality, compared to assuming perfect foresight in the deterministic LP model. A flowchart of describing the model components (rainfall-runoff model and statistical forecasting model) and input data, as well as data coverage periods, for generating the synthetic runoff time series can be seen in Figure 3. Simulated runoff from the rainfall-runoff model was used in the parameterization of the statistical forecasting model to generate synthetic forecasts. A schematic illustration of the setup used to evaluate the impact of “imperfect foresight” vs. perfect foresight can be seen in Figure 4. The statistical forecasting model was used to generate synthetic monthly forecasts of runoff, Q, precipitation, P, and evapotranspiration, ET. For the perfect foresight benchmark a single synthetic data set of Q, P and ET was generated, covering the planning horizon of 10 years. This time series represented a “true” perfect foresight benchmark and was used as runoff and climate input data in the deterministic LP hydroeconomic optimization model. Imperfect foresight was modeled by the LP-MPC framework with a moving horizon performing continuous re-optimization over each time step of the planning period. Imperfect foresight was represented by f months of foresight, informed by the “true” perfect foresight time series, followed by a future ensemble with 50 equally likely forecasts generated by the auto-regressive statistical forecasting model. In order to quantify the impact of different forecast qualities, the LP-MPC framework was run using different lengths of foresight, f, varying from 1 to 12 months, followed by the ensemble forecast in each moving time step. Figure 5 shows a conceptual illustration of the moving horizon imperfect foresight with continuous ensemble forecasting used for the LP-MPC framework, compared to perfect foresight time series. End-constraints of model surface water reservoir and groundwater aquifer storages in the final time step of the planning horizon were based on pre-optimized average yearly storage policies of an ensemble of 50 synthetic time series over a sufficiently long period, to represent a wide range of climate conditions. The deterministic perfect foresight benchmark was optimized using the same initial and end storage constraints matching the LP-MPC model. Both the perfect foresight and LP-MPC routine were run for a range of groundwater scenarios, representing a transition from unlimited groundwater overdraft to sustainable abstractions. The whole setup was run with and without the proposed water infrastructure project implemented in the hydroeconomic optimization model, to quantify the difference in estimated project benefit between the perfect foresight benchmark and the imperfect foresight scenarios. The impact analysis (see Figure 4) of having imperfect foresight was evaluated as the difference in project benefits estimated with the LP-MPC model framework compared to the project benefits with the perfect foresight benchmark. Each component of the model framework is explained in more detail in the following sections. First, the statistical forecasting model is introduced in section Forecasts of Synthetic Runoff and Climate Data. The deterministic LP hydroeconomic optimization model, optimizing water allocations in the Hai River basin is introduced in section Deterministic LP Hydroeconomic Optimization Model. Then the implementation of agricultural crop states in the deterministic model, representing delayed yield in the LP-MPC framework, is explained in section Delayed Yield of Agricultural Grain Production. Lastly, a more detailed description of the LP-MPC re-optimization routine is presented algorithmically in section Implementation of the Model Predictive Control Re-Optimization Routine.
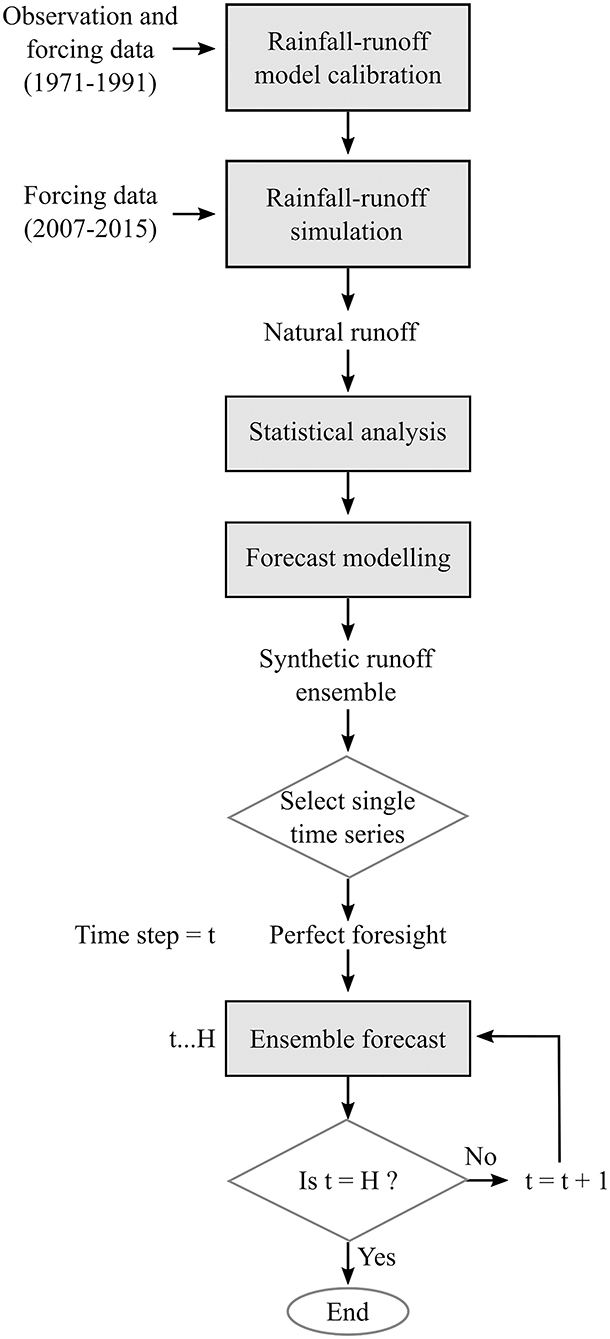
Figure 3. Flowchart describing the generation of synthetic forecasting data. Processes are shown in gray rectangles, decisions in diamond shapes and input/outputs as free text.
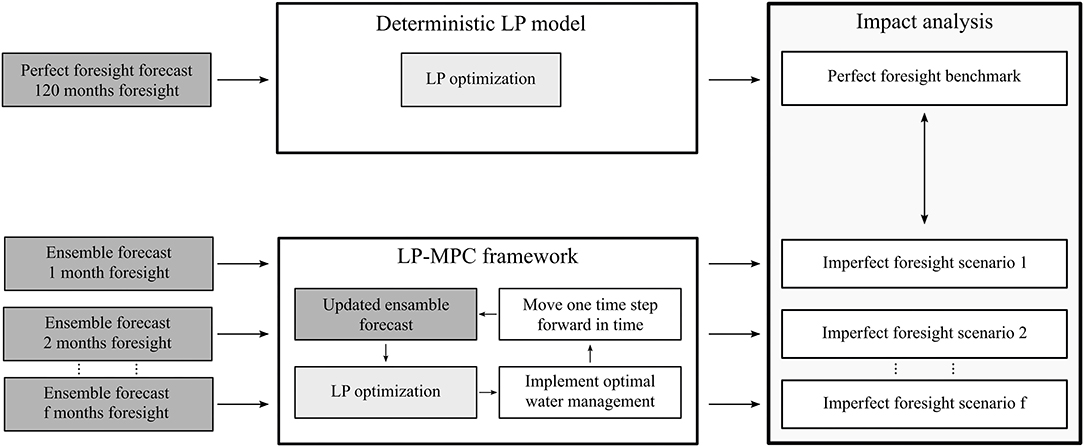
Figure 4. Conceptual illustration of the model framework for the impact analysis of imperfect foresight vs. perfect foresight. Model outputs from the statistical forecast model are shaded in dark gray whereas the process of optimization with the deterministic LP hydroeconomic model is shaded in light gray.
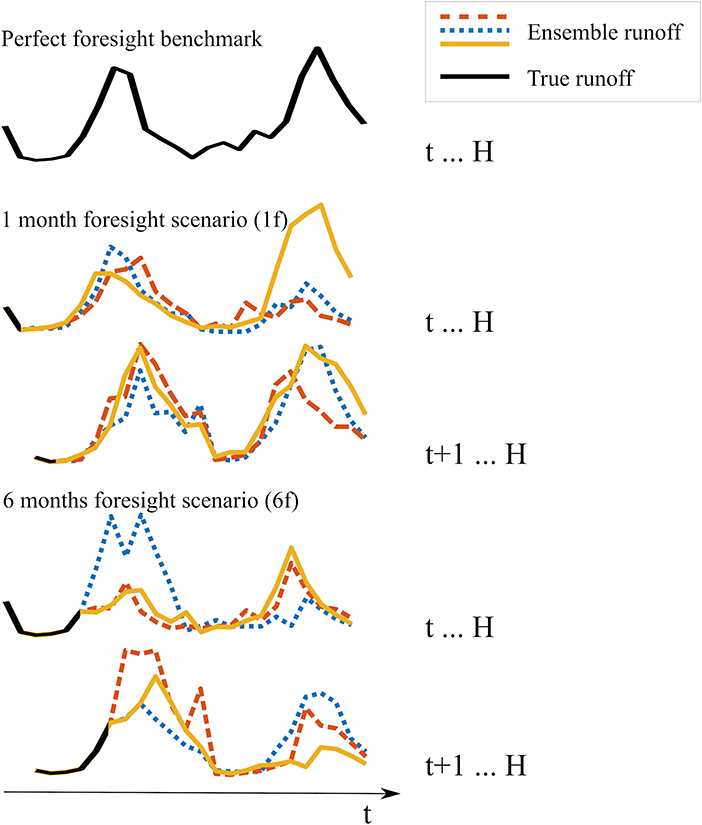
Figure 5. Conceptual illustration of the continuous imperfect forecasting used in the LP-MPC framework, compared to the deterministic perfect foresight.
Forecasts of Synthetic Runoff and Climate Data
The first order periodic autoregressive Thomas-Fiering model (Harms and Campbell, 1967) was used for two purposes: (1) To simulate synthetic future time series of P, ET, and Q for each sub-basin used to represent a wide range of hydrological conditions in the LP optimization model, and (2) as a forecasting tool in the LP-MPC framework.
An example of the calculation for runoff can be seen below:
For a monthly hydrological time series, 36 parameters had to be estimated: the standard deviation sm and the average runoff Qm for each month, m, of the year, and the lag-one autocorrelation coefficient r1,m between each month. The data was log-transformed prior to applying the Thomas-Fiering model to ensure non-negative runoff data. The correlation between the time series in each sub-basin was modeled with correlated random numbers. The stochastic element, random numbers η with a zero mean and unit variance, was correlated by multiplication with the lower triangular Cholesky decomposition of the sub-basin time series' covariance matrix, Lcov (Loucks et al., 1981). The covariance was computed from the seasonal standardized P, ET and Q time series in each model sub-basin. Historical climate data and rainfall-runoff simulations for 2007–2014, described in section Runoff Modeling, were used to estimate the parameters of the Thomas-Fiering model.
Deterministic LP Hydroeconomic Optimization Model
The hydroeconomic optimization model is the core of the model framework, optimizing water allocations for any given water availability and climate input data. It was based on a model set up for the same case study area and water management problem, which is described in two recent publications (Martinsen et al., 2019a,b). The model setup optimized water allocations according to the model objective and a set of model constraints. It was formulated as a Linear Programming optimization problem, as:
The model objective was subject to a set of equality, and inequality constraints described by the Aeq and beq as well as the A and b terms. These constraints defined the water availability and water infrastructure of the system. The decision variables of the model, x, were water demand deficits, agricultural crop states, groundwater aquifer storages as well as surface water and groundwater allocations. All water allocations were formulated as flow paths, FP [m3], from a source of surface water, sw, or groundwater, gw, to a water user demand, Dem [m3], in each monthly time step. Water balances in the model were flow path based, as in Cheng et al. (2009), in contrast to node based water balances. A conceptual illustration of the source-sink network used to formulate the flow path decision variables, the delineation of the 16 model sub-basins along with the major groundwater recharge areas can be seen in Figure 2. For each of the 16 sub-basins represented by the model, water demands were aggregated in each of the water use sectors described in section Water Demands.
In each monthly time step 1,737 decision variables were optimized. The model objective was to minimize total water associated costs:
There are three cost categories in the cost vector, f, of this objective function: Curtailment costs, ccc, of water demand deficits, Def, cleaning costs of inferior water qualities, cc [yuan/m3], and groundwater pumping costs, caq [yuan/m3]. Cleaning costs were added to surface water and groundwater flow paths that could not meet downstream water quality requirements (FPsw < q and FPgw < q). Groundwater pumping costs were aggregated into pumping from the shallow and deep aquifer unit, respectively, with an increasing cost with lift to the surface. These costs were minimized for all users, u, for all time steps, t. Additional costs come from lost benefits from agricultural yields of grain producers, ug, By [yuan], proportional to the end-of-season crop state, Send [–], for each growing season, s.
Water demands, deficits and allocations for every user in every time step were linked in the water demand equality constraints.
Surface water availability in each sub-basin was constrained by direct allocation of monthly runoff, Q, allocation of water stored in the sub-basin surface water reservoirs, RS [m3], as well as the capacity of inter-basin transfers, I. The storage was found from allocations into the reservoir, FPup,RS, which also included carry-over storage from t-1, subtracted downstream allocations, FPdown,RS:
The upstream surface water allocations in each time step to the reservoir storages were limited by their total storage capacity, RSvol [m3].
Various groundwater overdraft scenarios could be modeled by using the constraining method. In this method, groundwater availability was constrained by the groundwater recharge, Regw [m3/month], and the groundwater overdraft, GRSoverdraft [m3]. The groundwater overdraft was the difference between the initial groundwater aquifer storage, GRS0 [m3], and the groundwater storage in the last time step of the planning horizon, GRSend [m3], in an optimization run with unconstrained groundwater end-storage.
Setting the α [–] parameter between 0 and 1, represented long-term groundwater sustainability and unlimited overdraft, respectively. This assumes an initially recharged aquifer. The constraint is also applicable to simulate recharge of an already over pumped groundwater aquifer, by reversing the sign of α.
The optimization problem was solved deterministically with the built-in linear programming solver linprog in MATLAB R2018a (MathWorks, 2018), using the dual-simplex optimization algorithm.
Delayed Yield of Agricultural Grain Production
To represent the true value of foresight for agricultural water allocations, the concept of delayed yield was introduced to the model setup. In reality, foresight of a near-future drought will increase the value of irrigation while a barren field will have no value of irrigation. The value of irrigation is so to speak only as valuable as the final crop produced. To account for the value of foresight in irrigation, agricultural water allocations are not valued at the monthly time step but based on the yield in the final time step of the growing season. The concept was only applied to the agricultural grain producers since other crops, such as orchards with permanent root systems, will have carry-over effects from previous growing seasons (Doorenbos and Kassam, 1979).
The agricultural grain producers were formalized using the yield response to water allocations, a concept that was developed by Doorenbos and Kassam (1979) in the FAO 33 Irrigation and Drainage Paper. The ratio between actual yield, Yact [kg/m2], and maximum yield, Ymax [kg/m2], was in this study defined as the crop state, S, as done by Schneider (2013). According to Doorenbos and Kassam (1979) the relationship between water deficits and the yield reduction can be determined by a yield response factor, Ky, in a crop water production function:
The fraction of actual evapotranspiration, ETa [mm/month], over crop evapotranspiration, ETc [mm/month], express the crop water stress. Determining the exact ETa is difficult, and requires soil-water balance modeling (Steduto et al., 2012). As an approximation, we can express crop yield as a function of water allocation in a water production function (e.g., Kipkorir et al., 2002). Expressing yield as a response to water allocation relative to water demand was demonstrated by Ghahraman and Sepaskhah (2004). In this way, yield is a function of all water allocations plus natural precipitation, P [mm/month], over the crop water demand ETc, based on the FAO 56 Irrigation and Drainage paper (Allen et al., 1998), scaled to the cultivated area, Ac [m2]. The resulting model formalization of the grain producers' crop state was:
The Minimum Approach (Allen, 1994) was implemented by an additional constraint linking each crop state in time, carrying over the largest yield reduction during the growing season to the end. In the beginning of each growing season, the yield always starts at its maximum potential. The initial crop state, S0, was therefore set to 1 in the beginning of each growth season:
The cost of lost yield, cy [yuan], of each of the agricultural user's grain production was monetarized by:
The benefit of a maximum yield, BYmax,u is found from the marginal value of irrigation, mvirr,u [yuan/m3], based on Gan et al. (2008), and the total crop water demand of an average hydrological year, Demavg,u [m3/month], found from an ensemble of 50 synthetic time series of a 50 years period:
Ky-values were all set equal to 1, assuming that yield reduction was directly proportional to the water deficit throughout the growing season. This rough assumption was necessary due to insufficient local data availability, and is not a requirement in the proposed modeling framework.
Implementation of the Model Predictive Control Re-optimization Routine
By continuously re-adapting to unforeseen future disturbances, the concept of MPC is used in this study to represent the continuous adaption in water management to newly updated hydrological forecasts. Such continuous forecasts affecting water availability and irrigation water demands will be more representative of the reality faced by water managers than perfect foresight. In the LP-MPC framework presented in section Concept and Model Framework, different lengths of future foresight, f, of the climate-dependent variables P, ET, and Q were simulated. At time t, a foresight horizon, f, was represented by a synthetic “true” time series, Qtrue(t..t+f−1), followed by a synthetic ensemble simulated with the Thomas-Fiering model, Qens(t+f..H), running all the way to the end of the planning horizon, H. The ensemble represented future knowledge, extending beyond the foresight horizon, only relying on historical climatology. The foresight horizon represented forecasting of time steps, resembling the “truth.” The full ensemble was optimized over H, with fixed end-constraints on reservoir and groundwater aquifer storages. An average ensemble optimum of the agricultural crop states, surface water reservoir, and groundwater aquifer storages over the full ensemble was found. A one-time step ahead re-optimization of the “true” time series in t, with fixed one-time-step-ahead end-constraints for crop states, reservoir, and groundwater aquifer storages, found from the average ensemble optimum, was implemented. This step represented the actual water management, facing the true reservoir inflow and meteorological conditions during that month, and the reservoir operations based on the available future foresight. The water management decision of time step t was saved in a decision matrix, representing optimal water management decisions over the planning horizon with imperfect foresight. The MPC optimizer proceeded to t+1, using the implemented crop states and reservoir and groundwater aquifer storages as initial conditions. Continuous re-optimization continued until H, the end of the planning horizon. Figure 6 illustrates the concept of the MPC routine for a single imperfect foresight scenario with foresight f, alongside an algorithmic flow chart of the process.
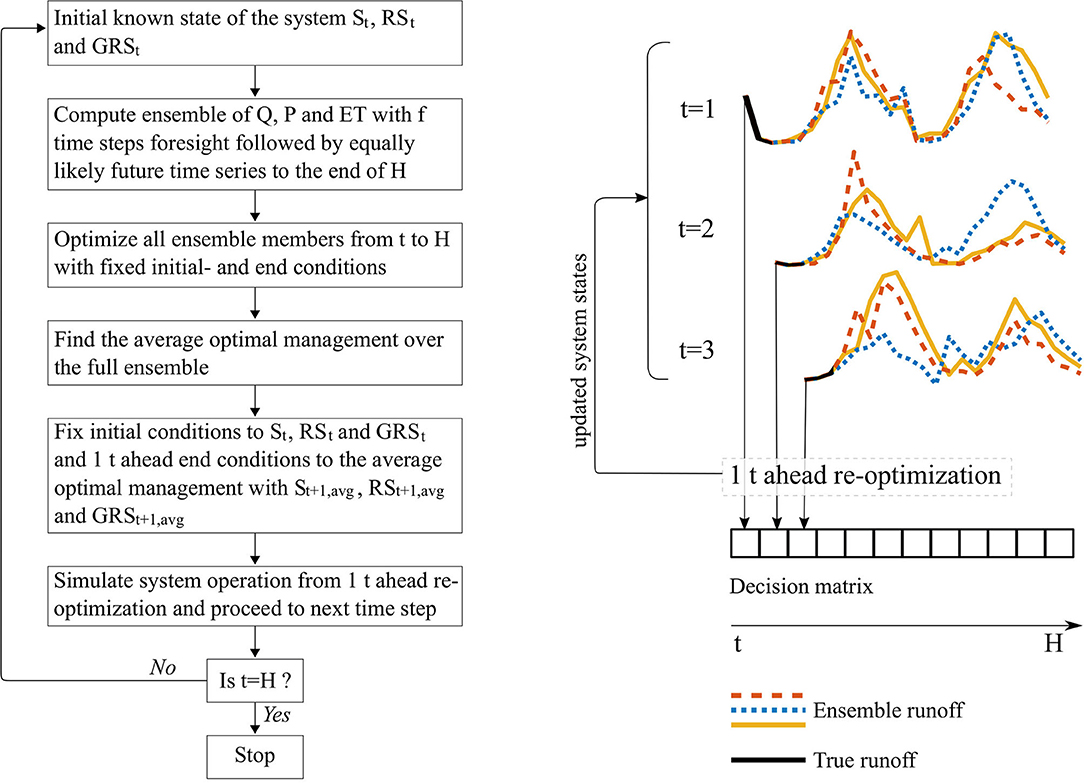
Figure 6. Flowchart and visual illustration of the MPC routine. The visual illustration illustrates a 1-month (1f) foresight horizon.
The whole model framework was parallelized in MATLAB2018a. Hydrological variations over an 80-years planning horizon were represented by averages over eight parallelized LP perfect foresight “truths” with 10-years planning horizons and their respective LP-MPC imperfect foresight scenarios. Imperfect foresight scenarios were run with foresight, f, of 1, 2, 3, 6, and 12 months and a forecast ensemble size of 50 members. Computation time for the whole parallelized LP-MPC setup was ~360 CPU hours using a 12-core Intel Xeon E5-2650 v4 processor with 256 GB memory.
Results
Cost Estimates With and Without Perfect Foresight
A wide range of forecast and management scenarios were run with the LP-MPC model set-up. The perfect foresight benchmark, pf, and imperfect foresight scenarios with forecast horizons of 1 month, 1f, and 3 months, 3f, were run for all groundwater scenarios, ranging from sustainable groundwater abstractions to a scenario with unlimited groundwater overdraft. The resulting Pareto optimal fronts from managing the Hai River basin water resources in the most cost-efficient way while gradually constraining the allowed groundwater overdraft can be seen in Figure 7. The Pareto fronts illustrate simulations of water management with perfect foresight, pf, foresight limited to the present time step, 1f, as well as management with two additional months of foresight, 3f. Assuming perfect foresight will underestimate the true costs of managing water resources. An additional cost of 1.5 billion yuan/year is seen in the sustainable groundwater scenario when water allocations are managed according to the 1f foresight scenario in contrast to having perfect foresight. The “1f” costs might be more representative for the costs actually occurring in a managed reservoir system, where release decisions are taken according to a set of heuristic rules. Having foresight for additional months reduces costs compared to the “1f” management, highlighting the value of foresight in water resources management. What can also be seen from Figure 7 is the diminishing difference in cost between foresight scenarios, when the system is managed under groundwater overdraft. The buffering capacity of the large plain area groundwater aquifer limits the value of foresight. This also reflects the value of the groundwater resources in covering water deficits costs during drought events.
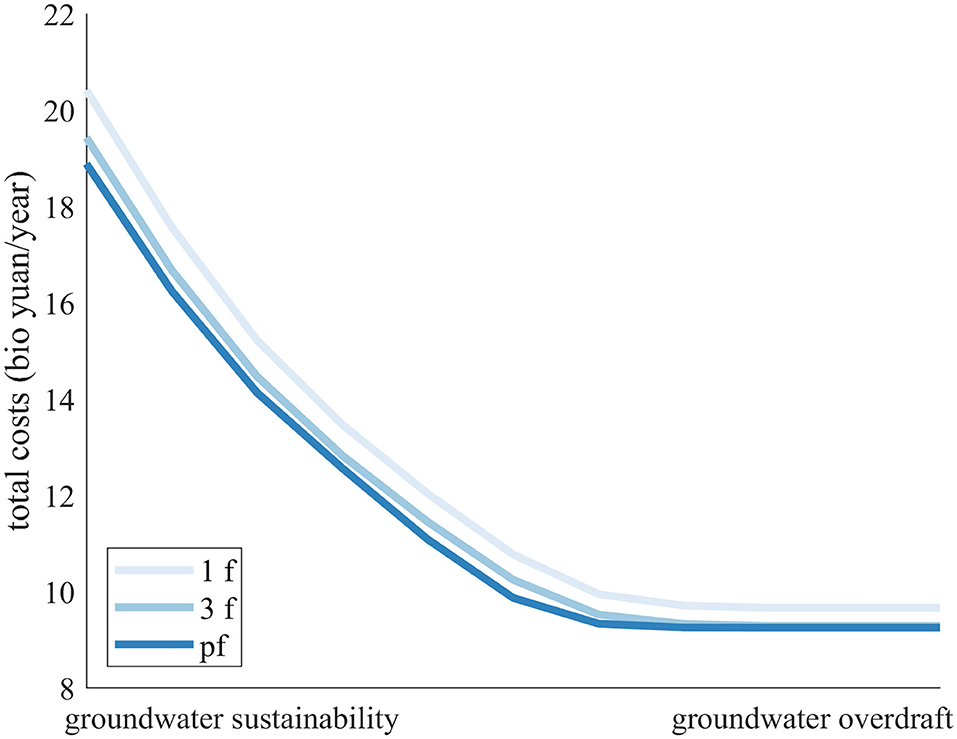
Figure 7. Pareto optimal solutions ranging from sustainable groundwater abstractions to unlimited overdraft.
The model framework includes both conjunctive use of groundwater and surface water runoff as well as yield response to water allocations for the agricultural grain producers. The effect on the value of foresight from the different model components can be analyzed from Figure 8. A model setup run with monthly water demands and curtailment costs, in contrast to the concept of delayed yield, does not show a significant decrease in costs with increased foresight (Figure 8 group a). This is despite constraining groundwater allocations to a sustainable level. Adding delayed yield to the model framework, while constraining groundwater allocations to a sustainable scenario, increases impact of foresight on the cost estimates (Figure 8 group c). The impact of foresight on cost estimates becomes less pronounced when groundwater overdraft is allowed (Figure 8 group b). When evaluating the effect of foresight in an agriculture-dominated river basin, such as the Hai River basin, a refined understanding of the relationship between yield and water allocations is important. The model of agricultural operations used here does not consider sunk costs, i.e., costs that are incurred in one time step of the growing season, but cannot be recovered in subsequent time steps of the same growing season (e.g., costs for fertilizers, seeds, machinery etc.). The value of foresight would have been even more significant if time dependent sunk cost functions were implemented for agricultural operations.
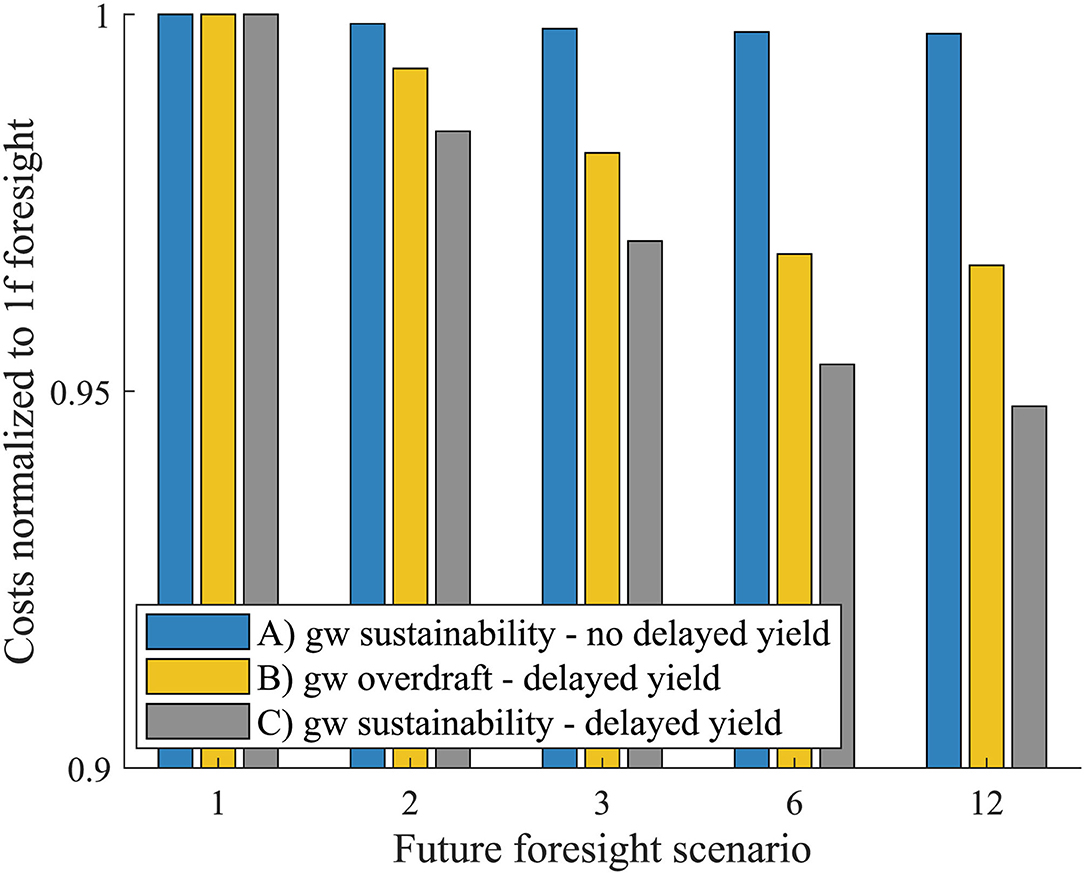
Figure 8. The effect of foresight on total cost estimates from a model setup with (a) monthly yield losses in agriculture, (b) delayed yield for agricultural water allocations and groundwater overdraft, and (c) delayed yield for agricultural water allocations and sustainable groundwater allocations. All series of results are normalized to their respective “1f” scenario.
Evaluation of Infrastructure Investments
Hydroeconomic optimization models can be used to support evaluation of water infrastructure investments. In a classical cost-benefit approach, one would compare total costs of system operation in the with and without project scenario and hold those up against the investment costs (Griffin, 2006). Often, costs of system operation in the with and without project scenarios are determined under the assumption of perfect foresight, which can potentially lead to unrealistic cost estimates.
The water infrastructure of the Hai River basin is highly engineered, and water is transferred to the water scarce basin from neighboring river basins. One of these inter-basin water transfers is the “Yellow-into-Jin” (引黄入晋), transferring water from the Yellow River basin to the northeastern region of the Hai River basin. An illustration of the Yellow River inter-basin transfers to the water users in the sub-basin upstream Guanting reservoir is seen in Figure 9. Water managers have publicly discussed whether to allow the “Yellow-into-Jin” inter-basin transfers to flow down to the plain area and Beijing via the Guanting reservoir (Renmin, 2015).
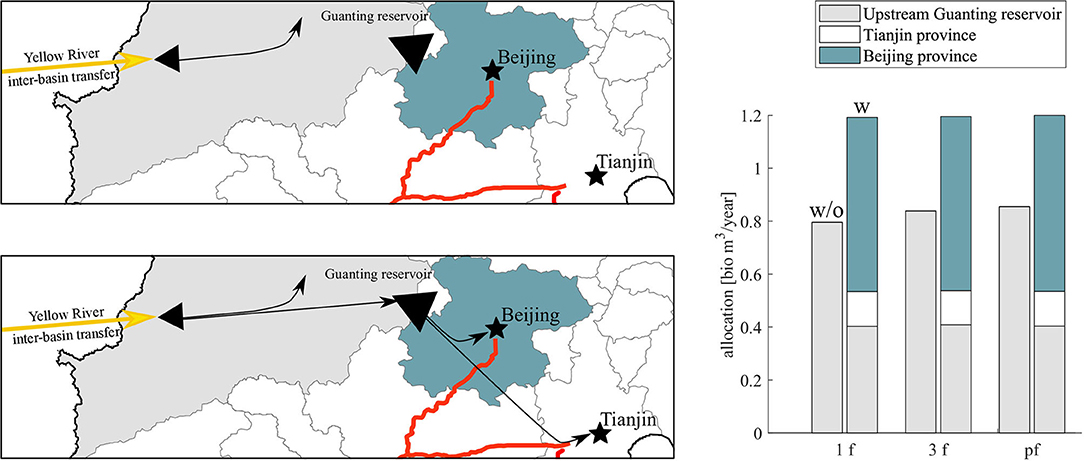
Figure 9. Left upper and lower figure shows the major flow path of the Yellow river inter-basin transfers without (w/o) and with (w) the water infrastructure project, respectively. Right bar plot shows the optimal sub-basin allocations for the Yellow River inter-basin transfers without and with the project, and for the 1f, 3f, and pf foresight scenarios.
Figure 9 shows the additional flow paths represented in the model to allow “Yellow-into-Jin” inter-basin transfers to flow to the downstream plain area provinces of Beijing and Tianjin through the Guanting reservoir. The inter-basin transfer has a design capacity of 1.2 billion m3/years (Baike, 2017), and the bars in Figure 9 indicate the resulting allocation of the inter-basin transfer with and without the project investment. Allowing the inter-basin transfer to flow through Guanting reservoir results in downstream use of the water source in the optimization model results, indicating that the water infrastructure project can aid more cost-efficient water resources management.
The estimated benefits of the project are shown in Figure 10 as the differences in yearly cost with and without the water infrastructure investment. Project benefits are only shown for sustainable groundwater abstractions, since project benefits are diminishing when managed under groundwater overdraft. From the figure it can be seen that a project evaluation assuming perfect foresight will underestimate the project benefits. The project is mainly for the purpose of supply augmentation, and additional water resources will be especially beneficial in a system with short foresight horizons, compared to a system managed under perfect foresight of all future hydrological events. Under sustainable groundwater abstractions, the difference in project benefits between perfect foresight and a 1f scenarios system management can be up to 46.7 million yuan/year. This might alter the decisions of the feasibility of the project, when evaluated in a cost-benefit context.
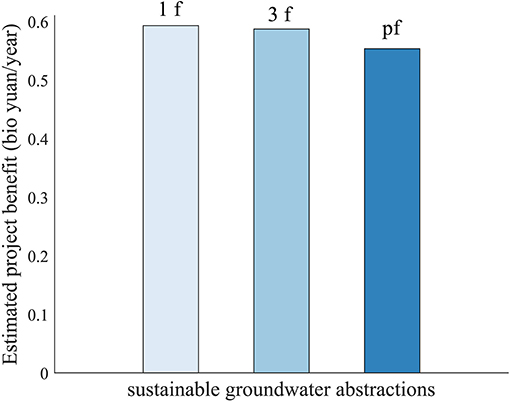
Figure 10. Project benefits with 1f, 3f, and perfect foresight (pf) scenarios, all representing results in the sustainable groundwater abstraction scenario.
Discussion and Conclusion
This study evaluated the impact of perfect foresight assumptions on project benefits in hydroeconomic analyses, illustrated by a case study of a water infrastructure project in China. Using a combined LP-MPC framework, the effect of different lengths of foresight could be compared to a perfect foresight benchmark. The model framework was used to evaluate the benefits of a water infrastructure project in the water-scarce Hai River basin, considering both the cost of delivering water qualities fit for purpose as well as the concept of delayed yield among agricultural users. The water infrastructure project benefits were increased when evaluated under management with limited knowledge of future agro-hydrological events. An increase in project benefits of around 46.7 million yuan/year was found, compared to benefits under perfect foresight. The project benefits evaluated under an imperfect foresight scenario will vary depending on the type of project, as well as the design of the LP-MPC framework. Evaluating the expansion of a reservoir with limited storage capacity will most likely result in even more foresight-sensitive project benefit estimates. Contrary, for different kinds of projects not involving a storage capacity expansion, project benefits could also be overestimated under an assumption of perfect foresight. An example could be a project involving a fixed expansion of agricultural areas with irrigation demands. In such a case, agricultural benefits would be overestimated, if estimated with perfect knowledge of all future agro-hydrological events. Running the LP-MPC model framework with longer planning horizons would result in less impact on cost and benefit estimates from end-storage constraints. A planning horizon of 10 years chosen for this study will show less difference between foresight scenarios than a longer planning horizon, where end-storage constraints would be located in a further future for most of the planning period time steps. Infinite forecast horizons, extending beyond the planning horizon, or probabilistic end-storage constraints could be a way to overcome this limitation in the proposed model framework. However, the study still illustrates that a perfect foresight assumption results in inaccurate project benefit estimates for the type of hydroeconomic analysis done for the Hai River basin. Adding delayed yield to the model framework substantially increased the effect of foresight on total cost estimates. In a region dominated by irrigation water demands, like the Hai River basin, the yield response to water allocations becomes increasingly important in project evaluation when moving away from the perfect foresight assumption. While the perfect foresight assumption is demonstrated to lead to inaccurate project benefit estimates other political factors like groundwater management and modeling concept, like delayed yield, also play an important role in hydroeconomic analysis.
Data Availability Statement
The raw data supporting the conclusions of this article will be made available by the authors, without undue reservation.
Author Contributions
CD developed the original LP-MPC framework, in collaboration with RP-B. GM collected the input data, developed the LP model, further developed the LP-MPC framework, and carried out the simulations. SL and XM assisted with input data. PB-G conceived the idea and supervised the findings of this work. GM wrote the manuscript. All authors discussed the results and contributed to the final manuscript.
Funding
This work was supported by the National Key Research and Development Program of China [No. 2018YFE0106500 and 2016YFC0401402], the National Natural Science Foundation of China [No. 41790424 and 41471026], and the Danida Fellowship Center EO For China project [No. 18-M01-DTU].
Conflict of Interest
The authors declare that the research was conducted in the absence of any commercial or financial relationships that could be construed as a potential conflict of interest.
References
Alemu, E. T., Palmer, R. N., Polebitski, A., and Meaker, B. (2011). Decision support system for optimizing reservoir operations using ensemble streamflow predictions. J. Water Resour. Plann. Manag. 137, 72–82. doi: 10.1061/(ASCE)WR.1943-5452.0000088
Allen, R. G. (1994). Memorandum on Application of FAO-33 Yield Functions. Logan, UT: Department of Biological and Irrigation Engineering, Utah State University.
Allen, R. G., Pereira, L. S., Raes, D., and Smith, M. (1998). Crop Evapotranspiration-Guidelines for Computing Crop Water Requirements. FAO Irrigation and drainage paper 56. Rome: FAO.
Arnold, M., and Andersson, G. (2011). “Model predictive control of energy storage including uncertain forecasts,” in 17th Power Systems Computation Conference (Zürich), 1–7.
Baike. (2017). Yellow-Into-Jin. Available online at: https://baike.baidu.com/item/????/3545322 (accaessed October 8, 2018)
Biglarbeigi, P., Giuliani, M., and Castelletti, A. (2018). Partitioning the impacts of streamflow and evaporation uncertainty on the operations of multipurpose reservoirs in arid regions. J. Water Resour. Plann. Manag. 144:05018008. doi: 10.1061/(ASCE)WR.1943-5452.0000945
Bright, E. A., Rose, A. N., Urban, M. L., and McKee, J. J. (2017). LandScan 2016 (2016 RI-). 2016 RI-. Retrieved from: https://landscan.ornl.gov/landscan-datasets
Burek, P., Greve, P., Wada, Y., Krey, V., Fischer, G., Parkinson, S., et al. (2018). A continental-scale hydroeconomic model for integrating water-energy-land nexus solutions. Water Resour. Res. 54, 7511–7533. doi: 10.1029/2017wr022478
Cao, G., Zheng, C., Scanlon, B. R., Liu, J., and Li, W. (2013). Use of flow modeling to assess sustainability of groundwater resources in the North China Plain. Water Resour. Res. 49, 159–175. doi: 10.1029/2012WR011899
Cheng, W.-C., Hsu, N.-S., Cheng, W.-M., and Yeh, W. W.-G. (2009). A flow path model for regional water distribution optimization. Water Resour. Res. 45:n/a-n/a. doi: 10.1029/2009WR007826
China Meteorological Agency (2017). Dataset of daily climate data from Chinese surface stations for global exchange (V3.0). Available online at: http://data.cma.cn/en/?r=data/detail&dataCode=SURF_CLI_CHN_MUL_DAY_CES_V3.0 (accessed February 17, 2017)
Davidsen, C., Pereira-Cardenal, S. J., Liu, S., Mo, X., Rosbjerg, D., and Bauer-Gottwein, P. (2015). Using stochastic dynamic programming to support water resources management in the Ziya River Basin, China. J. Water Resour. Plann. Manag. 141:04014086. doi: 10.1061/(ASCE)WR.1943-5452.0000482
Doorenbos, J., and Kassam, A. H. (1979). Yield Response to Water - FAO Irrigation and Drainage Paper No. 33. Rome: FAO.
Faber, B. A., and Stedinger, J. R. (2001). Reservoir optimization using sampling SDP with ensemble streamflow prediction (ESP) forecasts. J. Hydr. 249, 113–133. doi: 10.1016/S0022-1694(01)00419-X
Gan, H., Wang, L., Ni, H. Z., and Zhang, C. L. (2008). Assessment on methods for calculating economic value of water. J. Hydr. Eng. 39, 1160–1166.
Ghahraman, B., and Sepaskhah, A.-R. (2004). Linear and non-linear optimization models for allocation of a limited water supply. Irrig. Drainage 53, 39–54. doi: 10.1002/ird.108
Griffin, R. C. (2006). Water Resources Economics - The Analysis of Scarcity, Policies, and Projects. Cambridge, MA: The MIT Press.
H2O China (2000). H2O China Water Prices. Available online at: http://price.h2o-china.com/ (Accessed October 31, 2017).
Harms, A. A., and Campbell, T. H. (1967). An extension to the Thomas-Fiering Model for the sequential generation of streamflow. Water Resour. Res. 3, 653–661. doi: 10.1029/WR003i003p00653
Kendy, E., Gérard-Marchant, P., Todd Walter, M., Zhang, Y., Liu, C., and Steenhuis, T. S. (2003). A soil-water-balance approach to quantify groundwater recharge from irrigated cropland in the North China Plain. Hydrol. Proc. 17, 2011–2031. doi: 10.1002/hyp.1240
Khadem, M., Rougé, C., Harou, J. J., Hansen, K. M., Medellin-Azuara, J., and Lund, J. R. (2018). Estimating the economic value of interannual reservoir storage in water resource systems. Water Resour. Res. 54, 8890–8908. doi: 10.1029/2017WR022336
Kipkorir, E. C., Raes, D., and Massawe, B. (2002). Seasonal water production functions and yield response factors for maize and onion in Perkerra, Kenya. Agricult. Water Manag.56, 229–240. doi: 10.1016/S0378-3774(02)00034-3
Loucks, D. P., Stedinger, J., and Haith, D. A. (1981). Water Resources Systems Planning and Analysis. Englewood Cliffs, NJ: Prentice Hall International.
Martinsen, G. (2019). Hydroeconomic evaluation of projects and policies in the water-scarce and polluted Haihe River basin, China (PhD thesis). Technical University of Denmark, Kgs. Lyngby. Retrieved from: https://findit.dtu.dk/en/catalog/2451188121
Martinsen, G., Liu, S., Mo, X., and Bauer-Gottwein, P. (2019a). Joint optimization of water allocation and water quality management in Haihe River basin. Sci. Total Environ. 654, 72–84. doi: 10.1016/j.scitotenv.2018.11.036
Martinsen, G., Liu, S., Mo, X., and Bauer-Gottwein, P. (2019b). Optimizing water resources allocation in the Haihe River basin under groundwater sustainability constraints. J. Geograph. Sci. 29, 935–958. doi: 10.1007/s11442-019-1638-6
Medellin-Azuara, J., Herman, J., Lund, J. R., Howitt, R. E., and Jenkins, M. W. (2015). CALVIN Project Overview. Available online at: https://watershed.ucdavis.edu/shed/lund/CALVIN/ (accessed September 25, 2018)
Ministry of Environmental Protection (2002). Environmental quality standards for sw - 3838-2002.pdf. Retrieved from: http://english.mee.gov.cn/Resources/standards/water_environment/quality_standard/200710/W020061027509896672057.pdf
Ministry of Water Resources (2016). Water Resources in China. Retrieved from: http://www.mwr.gov.cn
Mo, X., Liu, S., Lin, Z., Wang, S., and Hu, S. (2015). Trends in land surface evapotranspiration across China with remotely sensed NDVI and climatological data in 1981-2010. Hydrol. Sci. J. 60, 2163–2177. doi: 10.1080/02626667.2014.950579
National Bureau of Statistics of China (2015). China Statistical Yearbook 2015. Available online at: http://www.stats.gov.cn/tjsj/ndsj/2015/indexeh.htm (accessed February 17, 2016).
NSBD (2001a). Brief Introduction of the Planning of the Eastern Route Project of the South to North Water Transfer Project. Available online at: http://www.nsbd.gov.cn/zx/gcgh/200308/t20030825_195172.html (accessed February 17, 2018).
NSBD (2001b). Brief Introduction of the Planning of the Middle Route Project of the South to North Water Transfer Project. Available online at: http://www.nsbd.gov.cn/zx/gcgh/200308/t20030825_195173.html (accessed May 17, 2018).
NSBD (2017). South-to-North Water Transfer Middle Line Project starts water transfer from 2017 to 2018. Available online at: http://www.nsbd.gov.cn/zx/zxdt/201711/t20171103_493979.html (accessed January 11, 2019).
Pereira, M. V. F., and Pinto, L. M. V. G. (1991). Multi-stage stochastic optimization applied to energy planning. Math. Programm. 52, 359–375. doi: 10.1007/BF01582895
Pereira-Cardenal, S. J., Mo, B., Gjelsvik, A., Riegels, N. D., Arnbjerg-Nielsen, K., and Bauer-Gottwein, P. (2016). Joint optimization of regional water-power systems. Adva. Water Resour. 92:4. doi: 10.1016/j.advwatres.2016.04.004
Renmin, W. (2015). Beijing Guanting Reservoir Intends to “Bring Yellow Into Beijing” to Transfer Water From Three Surrounding Provinces - 北京官厅水库拟“引黄入京” 从周边3省调水. Available online at: http://env.people.com.cn/n/2015/0928/c1010-27641474.html (accessed December 4, 2018).
Richalet, J., Rault, A., Testud, J. L., and Papon, J. (1978). Model predictive heuristic control. Automatica, 14, 413–428. doi: 10.1016/0005-1098(78)90001-8
Rougé, C., and Tilmant, A. (2016). Using stochastic dual dynamic programming in problems with multiple near-optimal solutions. Water Resour. Res. 52, 4151–4163. doi: 10.1002/2016WR018608
Schneider, R. (2013). Optimizing Water Allocation to Agricultural Users Accounting for Crop- Yield Response to Water. Technical University of Denmar, Kgs. Lyngby.
Schou, N., Lund, V., Katrine, A., Falk, V., Borup, M., Madsen, H., et al. (2018). Critical Reviews in Environmental Science and Technology Model predictive control of urban drainage systems: a review and perspective towards smart real-time water management Model predictive control of urban drainage systems: a review and perspective tow. Environ. Sci. Techn. 48, 279–339. doi: 10.1080/10643389.2018.1455484
Shen, H., Leblanc, M., Tweed, S., and Liu, W. (2015). Groundwater depletion in the Hai River Basin, China, from in situ and GRACE observations. Hydrol. Sci. J. 60, 671–687. doi: 10.1080/02626667.2014.916406
Shu, Y., Villholth, K. G., Jensen, K. H., Stisen, S., and Lei, Y. (2012). Integrated hydrological modeling of the North China Plain : Options for sustainable groundwater use in the alluvial plain of Mt. Taihang. J. Hydrol. 464–465, 79–93. doi: 10.1016/j.jhydrol.2012.06.048
Stage, S., and Larsson, Y. (1961). Incremental cost of water power. Trans. Am. Instit. Electr. Engin. Part III Power Appar. Syst. 80, 361–364. doi: 10.1109/AIEEPAS.1961.4501045
Steduto, P., Hsiao, T. C., Fereres, E., and Raes, D. (2012). “Crop yield response to water,” in FAO Irrigation and Drainage Paper (Rome), 66. doi: 10.1016/j.ecolmodel.2004.06.005
Steinshouer, D. W., Qiang, J., McCabe, P. J., and Ryder, R. T. (1997). “Maps showing geology, oil and gas fields, and geologic provinces of the Asia Pacific region,” in USGS Open File Report (Denver).
Tian, X., Negenborn, R. R., Van Overloop, P.-J., Maestre, J. M., Sadowska, A., and Van De Giesen, N. (2017). Efficient multi-scenario Model Predictive Control for water resources management with ensemble streamflow forecasts. Adv. Water Res. 109, 58–68. doi: 10.1016/j.advwatres.2017.08.015
Tilmant, A., Pinte, D., and Goor, Q. (2008). Assessing marginal water values in multipurpose multireservoir systems via stochastic programming. Water Resour. Res. 44:n/a-n/a. doi: 10.1029/2008WR007024
White, D. J., Feng, K., Sun, L., and Hubacek, K. (2015). A hydro-economic MRIO analysis of the Haihe River Basin's water footprint and water stress. Ecol. Model. 318, 1–11. doi: 10.1016/j.ecolmodel.2015.01.017
World Bank (WB) (2001). Agenda for Water Sector Strategy for North China - Volume 2: Main report. Report no. 22040-CHA.
Keywords: hydroeconomic optimization, model predictive control, water resources management, integrated modeling, China, irrigation, groundwater overdraft, perfect foresight
Citation: Martinsen G, Liu S, Mo X, Davidsen C, Payet-Burin R and Bauer-Gottwein P (2021) The Impact of Assuming Perfect Foresight in Hydroeconomic Analysis of Yellow River Diversions to the Hai River Basin, China: A Framework Combining Linear Programming and Model Predictive Control. Front. Water 3:648934. doi: 10.3389/frwa.2021.648934
Received: 02 January 2021; Accepted: 07 May 2021;
Published: 09 June 2021.
Edited by:
Amaury Tilmant, Laval University, CanadaReviewed by:
Alban Kuriqi, Universidade de Lisboa, PortugalGeorgia A. Papacharalampous, Roma Tre University, Italy
Copyright © 2021 Martinsen, Liu, Mo, Davidsen, Payet-Burin and Bauer-Gottwein. This is an open-access article distributed under the terms of the Creative Commons Attribution License (CC BY). The use, distribution or reproduction in other forums is permitted, provided the original author(s) and the copyright owner(s) are credited and that the original publication in this journal is cited, in accordance with accepted academic practice. No use, distribution or reproduction is permitted which does not comply with these terms.
*Correspondence: Grith Martinsen, Z3JpdGhtYXJ0aW5zZW5AZ21haWwuY29t