 Joost Buitink
 Theresa C. van Hateren
 Adriaan J. Teuling1*
- 1Hydrology and Quantitative Water Management Group, Wageningen University, Wageningen, Netherlands
- 2Department of Environmental Research and Innovation, Luxembourg Institute of Science and Technology, Esch-sur-Alzette, Luxembourg
Droughts occur as a result of a lack of water compared with normal conditions. Whilst this appears trivial, the exact drought definition of drought is not. Especially as different drought types are present, resulting from the different variables in a hydrological system, each with unique characteristics. We use a common drought definition, the percentile score, and apply the same definition across all drought types, to study whether the actual occurrence of droughts matches the definition. We focus on the data-rich Dutch province of Gelderland, to study droughts from observations across five major components of the terrestrial hydrological cycle. When a percentile threshold of 20% is used as drought definition, corresponding to a mild drought, droughts anywhere in the system occur at least three times more frequently (73% of the time). On the other hand, the situation where drought occurs across all components of the terrestrial hydrological cycle is more than four times less likely than the drought threshold of 20% (namely 5% of the time). This can be attributed by both (1) the different responses across the hydrological system, and (2) the spatial variability present within each component of the hydrological system. With this study, we show the existence of the drought frequently paradox: although droughts are seen and defined as rare from a scientific perspective, when viewed from a societal or operational water management perspective in typical hydrological systems subject to spatial variability and other system complexity, droughts become common, rather than rare. This paradox is a consequence of an inconsistent use of the percentile score drought definition between research and operational water management, and better communication between the two domains is needed in search for a universally accepted drought definition.
1. Introduction
Droughts are among the extreme natural events with the most widespread impact, both on socio-economic sectors as well as on natural ecosystems. Due to the strong coupling between drought and heat, the impacts of drought are expected to worsen with climate change (Teuling, 2018; Miralles et al., 2019). In spite of the relevance of drought, its exact definition has been, and still is, subject to debate (Dracup et al., 1980). In a review on the use of drought indices in the U.S., Heim (2002) provides several possible and widely used definitions: drought can be defined as a “prolonged absence or marked deficiency of precipitation,” a “deficiency of precipitation that results in water shortage for some activity or for some group,” or a “period of abnormally dry weather sufficiently prolonged for the lack of precipitation to cause a serious hydrological imbalance.” More recently, Van Loon et al. (2016) argued that drought “is … simply an exceptional lack of water compared with normal conditions,” to allow for the possibility that drought is induced by human activity rather than rainfall deficiency. Additionally, different drought types are identified, corresponding to different components of the hydrological system: meteorological (precipitation, evaporation), agricultural (soil moisture, vegetation) and hydrological drought (groundwater, surface water) (van Loon, 2015). A general feature of these different drought definitions is the notion that drought is a deviation from normal, and relatively rare.
As these definitions are more descriptive of the cause of droughts, they do not help with classifying certain events as droughts. Within drought classifications, two main perspectives can be distinguished: a more research-oriented perspective which sees drought as a multivariate phenomenon, and a operational water management perspective were drought is treated as a univariate phenomenon. In the research perspective on drought, drought is usually defined using drought indices. Developments in the use of drought indices reflect the changing attitude toward drought definition. Whereas, early drought indices were often based on absolute values of precipitation characteristics (Heim, 2002), the use of standardized indices has become commonplace over the past decades (Hayes et al., 2011). It is believed that standardization facilitates the comparison of drought impact between climates and seasons. In terms of standardized indices, drought conditions typically start whenever the standardized index falls below minus one standard deviation, or −1.5 for moderate drought. On the other hand, drought is defined as a rare event in water management practise, as it is often related to its impacts. Typically, multiple univariate drought indicators are used to monitor drought conditions. However, these indicators reflect physical drought impacts in various sectors that cannot easily be weighted or aggregated. As a result, droughts might be felt in different sectors at different times, and the effective drought frequency might be at odds with the definition of drought as extreme event.
The typical complexity and variability found in hydrological systems causes different drought types to show diverging dynamics. A first example of this is the relation between precipitation deficit and evapotranspiration and vegetation productivity. Because of the non-linear relation between soil moisture and evapotranspiration, the latter will respond to absolute values of soil moisture (i.e., below a critical soil moisture content, see Denissen et al., 2020) rather than anomalously low precipitation. This is reflected in the observation that in the humid Central-Western Europe, total evapotranspiration during drought summers might show positive anomalies—in response to increased energy due to reduced cloud cover and high temperatures—rather than negative anomalies due to low soil moisture (Teuling et al., 2013). Similar findings of increased evapotranspiration and vegetation productivity during drought in (pre-)Alpine regions were reported by Jolly et al. (2005), Buitink et al. (2018), and Mastrotheodoros et al. (2020). The complex and climate-dependent relation between soil moisture and vegetation provides an argument to consider vegetation and soil moisture separately in analyses of agricultural drought (van Hateren et al., 2020). Hydrological drought dynamics also differ from meteorological drought. Because of the large size of most groundwater systems, meteorological drought is often delayed and attenuated with timescales involved ranging from several months to over a year. However, an analysis for Germany and the Dutch province of Gelderland revealed that the transformation is subject to considerable spatial variability, and that even a locally optimized transformation of the precipitation signal is a poor predictor of groundwater drought (Kumar et al., 2016). Adding to the complexity of hydrological droughts is the situation in which a region receives surface water that depends on non-local weather conditions. This is typical for downstream lowland and delta regions where most of the global agricultural production takes place, and where the impact of a drought can be large. These downstream regions can experience a hydrological drought in the surface water, even when local precipitation has been normal. Clearly, hydrological systems complexity poses a challenge to drought identification and effective regional water management when drought observations cover a limited number of drought types, or when spatial variability is not taken into account.
Typically, drought is classified using different drought types, which represent different components of the hydrological system: meteorological, agricultural, vegetation, and hydrological drought (for an overview of the different drought types, see Wilhite and Glantz, 1985; van Loon, 2015). Spatial complexity and different drought characteristics ensure that each drought type has a unique drought occurrence. When we classify the hydrological system to be in drought conditions when at least one of these types is classified as a drought, the spatial complexity might cause droughts to occur a lot more frequently when the entire system is considered. A visualization of this is presented in Figure 1, which shows a typical hydrological response across five different components of a hydrological system. We hypothesize that a drought frequency paradox exists: even though drought events are generally considered to be relatively rare, drought occurrence could become relatively common when viewed across the hydrological system due to inherent spatial variability and complexity. The last panel in Figure 1 highlights that the hydrological system is in drought conditions for the majority of the time. As commonly used indices are likely to show this signal, we investigate the existence of a possible drought frequency paradox. Specifically, we aim to identify the effective frequency at which drought conditions might occur within any of the possible drought types. The existence of this paradox has consequences for the perception of drought frequency by e.g., stakeholders and public attention. We investigate this paradox for the Dutch province of Gelderland. This region has not only experienced recent droughts (including the 2018 European summer drought, Buitink et al., 2020), but in addition has typical variability in soil, vegetation, and drainage properties, while being located in the downstream part of three river basins. While past studies covering all different drought types were limited by spatial or temporal coverage, we were able to combine a large number of local precipitation, surface water and groundwater observations with climate records of vegetation greenness and soil moisture derived from Earth observation. This resulted in a combined dataset that allows for the first time to study different drought types and their spatial variability in a historical perspective, solely from observations.
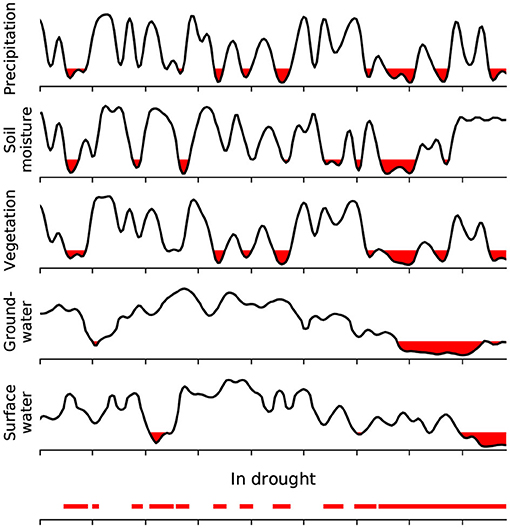
Figure 1. Conceptual illustration of drought propagation. Time series can be interpreted as percentile values for each particular month. Red areas indicate periods below the drought threshold (here 20% reflecting mild drought and worse). Note that propagation increases the fraction of time that any of the variables is in drought to more than 20% (lower panel).
2. Methods and Data
2.1. Study Area
In this study, we focus on a single data-rich region in the Netherlands: the province of Gelderland (see Figure 2). As mentioned earlier, this region experienced the recent droughts of 2018 and 2019 that affected much of Western Europe. The region is small enough for the meteorological drought conditions to be fairly homogeneous (so spatial variability in other drought types is not induced by spatial variability in precipitation), yet large enough to have considerable variation in soil, vegetation, and drainage properties. The extensive groundwater system under the Veluwe Massif, where the depth to the groundwater table can reach tens of meters (Kumar et al., 2016) is an important resource for drinking water and irrigation (van Engelenburg et al., 2018), while its location downstream of three river basins (the Rhine, Meuse, and Berkel) makes it an important hub for shipping and surface water management. The three river systems vary considerably in size: 900 km2 for the Berkel, 34,500 km2 for the Meuse, and 185,000 km2 for the Rhine. The Rhine is the largest river entering both Gelderland and the Netherlands, and the country largely depends on water from this river. The southwestern region of Gelderland is dominated by floodplains of the large Rhine and Meuse rivers, the northwestern part is dominated by a sandy moraine, and the northeastern part is dominated by sandy soils.
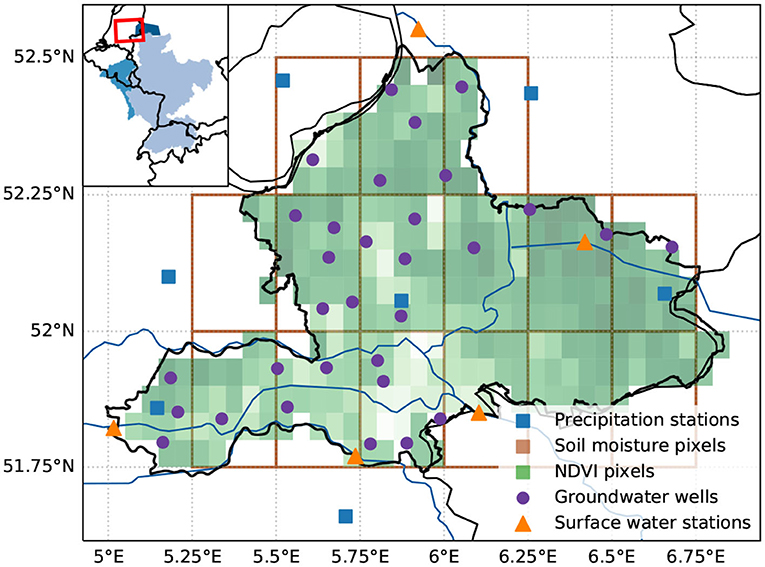
Figure 2. Map of the study region and measurement locations. Inset figure shows the location of the main panel, including the three river basins corresponding to the water level and discharge stations: the Rhine (light blue), Meuse (medium blue), and Berkel (dark blue). Both soil moisture and NDVI products are gridded datasets. NDVI pixels are shaded based on their mean value over the entire period, ranging from 0.5 to 0.75.
2.2. Data
We investigate drought across five major components of the hydrological cycle: precipitation, soil moisture, vegetation greenness, groundwater, and surface water. Below, we describe the data of each component.
Precipitation data were obtained from the Royal Netherlands Meteorological Institute (KNMI), and seven stations were selected based on their location in or near the study area (blue squares in Figure 2). Daily precipitation values were summed to obtain total monthly precipitation.
Groundwater levels were obtained from the Dutch institute TNO (www.dinoloket.nl), and selected based on available data (purple dots in Figure 2). We selected groundwater wells such that they had sufficient data to cover the period 2000–2019, and measured data at regular temporal intervals. Data records were averaged to obtain monthly mean groundwater levels.
Surface water observations were obtained from the Directorate-General for Public Works and Water Management, and from the water board Rijn en IJssel (orange triangles in Figure 2). These observations cover three river systems, varying in size. The catchment areas of these systems are presented in the inset in Figure 2: Berkel, Meuse, and Rhine (from smallest to largest). These were selected to cover the different types of river systems present in the study area. The most eastern surface water station is situated in the Berkel river, the most southern station in the Meuse, and the three remaining stations in branches of the Rhine river. For stations located in the downstream areas of the Rhine and Meuse basins, surface water levels were obtained. For the Berkel, however, no surface water level observations were available, so discharge observations were used instead. The surface water records were averaged to obtain monthly mean values.
Both soil moisture and vegetation greenness were based on remotely sensed data. Soil moisture data were obtained from the ESA Climate Change Initiative soil moisture data set (CCI SM v05.2, Gruber et al., 2017; Dorigo et al., 2017; Gruber et al., 2019). These data are available on a monthly 0.25 × 0.25° resolution (brown squares in Figure 2). The most southwestern pixel was omitted due to insufficient data. We selected the Normalized Difference Vegetation Index (NDVI) to represent vegetation greenness. Monthly 0.05 × 0.05° NDVI data were retrieved from the MODIS/Terra Vegetation indices data set (MOD13C2 v006, Didan, 2015), as indicated by the shaded pixels in Figure 2. As mentioned earlier, NDVI had the shortest period of available data (2000–2019).
2.3. Drought Definition
We investigate the spatio-temporal variability in five different drought types to cover all major components of the hydrological cycle: precipitation, soil moisture, vegetation greenness, groundwater and surface water levels (or discharge, we assume no difference in percentile scores between the two). To understand the different drought types and their spatial variability, we have split the analysis in two parts. First, we investigate the recent severe droughts of 2018 and 2019 to understand the general behavior of, and interaction between the five variables. Next, we use the longest available period of overlapping records to understand how different drought thresholds affect the resulting frequency of droughts.
The period of overlapping records was limited by the data product to measure vegetation greenness (more in section 2.2), which was limited to 2000–2019, yielding 20 years of monthly data. Many different drought indicators are available (Zargar et al., 2011), ranging from standardized variable-specific indices (such as the Standardized Precipitation Index) to non-variable-specific indices (such as percentiles). In this study, we selected the percentile score for our drought metric based on two important factors. Firstly, we want to compare droughts across different components of the hydrological system. By using the same index for all variables, we minimize any deviations caused by different index calculations for different variables. Secondly, our data period covers 20 years of data, which is considerably shorter than the period typically used for robust determination of standardized indices. With our shorter period, we cannot ensure to correctly define the underlying distributions that are required for standardized indices. These two arguments considered, we decided to use the percentile score as our drought indicator. A similar approach is commonly used in typical retrospective drought analysis studies (e.g., Gibbs and Maher, 1967; Steinemann, 2003; Steinemann et al., 2015; Kumar et al., 2016), where a drought threshold is set based on a percentile score. This threshold (the 20th percentile, for example) is based on observation time series, and each value can be compared to be above or below this threshold. In our study, as we are investigating the link between drought threshold and resulting frequency, we invert this method: for each data point we calculate the matching percentile score. This implies that this data point would classify as a drought when the drought threshold matches the percentile score. To account for seasonal variability (especially present in vegetation data), values were grouped by month, and the percentile score is calculated based on these 20 monthly values. The percentile score is calculated over the time series of each station/pixel using the following equation:
where ϕ is the percentile score, C is the number of values equal or less than the value of interest, and N is the total number of values considered. This is in line with the variable threshold approach used in many hydrological drought analyses (e.g., van Huijgevoort et al., 2014). It should be noted that the 20 year record length in combination with a variable threshold approach results in percentile scores only being defined in steps of 5% (1/20).
With the percentile score for each time step, we need to define a drought threshold. We defined a location to be in drought when the percentile score is at or below 20%. This threshold corresponds to mild drought, and is a typical value in drought studies (van Loon, 2015; Huijgevoort et al., 2013; Corzo Perez et al., 2011; Sheffield et al., 2009; Tallaksen et al., 2009; Fleig et al., 2006; Andreadis et al., 2005; Hisdal et al., 2001). As each variable has multiple stations or pixels, an additional threshold is required to determine whether that variable is in drought conditions. For this threshold, we defined that at least 20% of the stations/pixels should be in drought conditions. As not all variables had the same number of stations/pixels, exactly 20% of the stations was not possible for all variables (e.g., precipitation with seven stations). To account for this, we calculate the value corresponding to the 20% quantile range. The value is calculated based on linear interpolation in the case when this point sits between two stations, as is explained in more detail by Schoonjans et al. (2011). This should correspond to a value where 20% of the stations are in drought, when sufficient stations are available. This way, we account for any outliers within each variable (i.e., drought conditions in a single groundwater well would not indicate regional groundwater drought, but several would), while respecting the spatial variability.
Finally, to test whether there is a change in drought frequencies between the first and second 10 years of our study period, we split the dataset into two 10 year periods. This way, we can compare the relative drought frequencies, both for droughts within each variable, as for the number of co-occurring droughts.
3. Results
We first illustrate how the recent severe droughts of 2018 and 2019 have impacted the different parts of the hydrological system in Gelderland. To understand the severity and duration of the drought impact, we compare the time series with the long term average of the entire data period (see Figure 3). Only for visualization purposes, the groundwater and surface water data are normalized, to be able to ensure meaningful comparisons between the different stations. For all variables, we see deviations from the climatology during those 2 years, but the deviations vary in timing, duration and severity. Precipitation (Figure 3A) was not only extremely low during July 2018, but was also below the mean monthly precipitation for the majority of the months in 2018. Precipitation volumes recovered during 2019, but were below mean monthly volumes again during spring and summer.

Figure 3. Temporal evolution of the drought over 2018-2019 for the different variables. The gray line shows the monthly mean over the entire period, where the colored line represents the mean time series for 2018 and 2019. The gray shaded area shows the monthly temporal variability, using the 20-80% quantile range. Precipitation, soil moisture and NDVI (A-C) are shown as their observed values. Groundwater and surface water levels (D,E) are normalized using the mean and standard deviations of each station. The two highlighted areas indicate the periods used in Figure 4.
Surface soil moisture values seem to follow the climatology during most parts of the year, except for July 2018 where they show a sharp decline (Figure 3B). Soil moisture remained below the 20% climatology quantile for several months, but did not show a clear deviation from normal during 2019. Similarly to the soil moisture, NDVI shows a reduction during the summer of 2018 (Figure 3C). However, NDVI recovers quickly to the monthly mean values, and even remained above the 80% climatology quantile during the winter months. During the summer of 2019 values were again reduced below the 20% climatology quantile, but the anomaly was not as large as in 2018. Both groundwater (Figure 3D) and surface water (Figure 3E) show similar responses: starting from relatively high water levels in early 2018, dropping to nearly two standard deviations below the mean at the end of the year. These low values continue into 2019, where the anomalies in surface water levels were not as severe as the groundwater level anomalies. Interestingly, even though the surface water level stations are situated in different river basins, they all show a similar response during this drought.
While Figure 3 provides an important first insight into the differences in temporal drought evolution, it does not provide insight into the underlying spatial variability at the regional scale. The evolution of the spatial drought distributions in 2018 and 2019 are visualized in Figure 4. Here, the months surrounding the meteorological drought peak are depicted, as this is when the drought was generally most severe. This figure shows how the drought propagates through the hydrological cycle, starting from a slight reduction in precipitation in May 2018. When precipitation reaches its minimum in July 2018 (Figure 3A), both the soil moisture and NDVI follow quickly. However, in the preceding months, both variables did not respond directly to the reduced precipitation, indicating the flexibility and buffering capacity of these variables. Additionally, in response to the low precipitation during July 2018, a direct anomaly in both groundwater and surface water levels is present. Both variables remain on the lower end of the percentile score, while the soil moisture and NDVI values slightly recover toward the end of 2018.
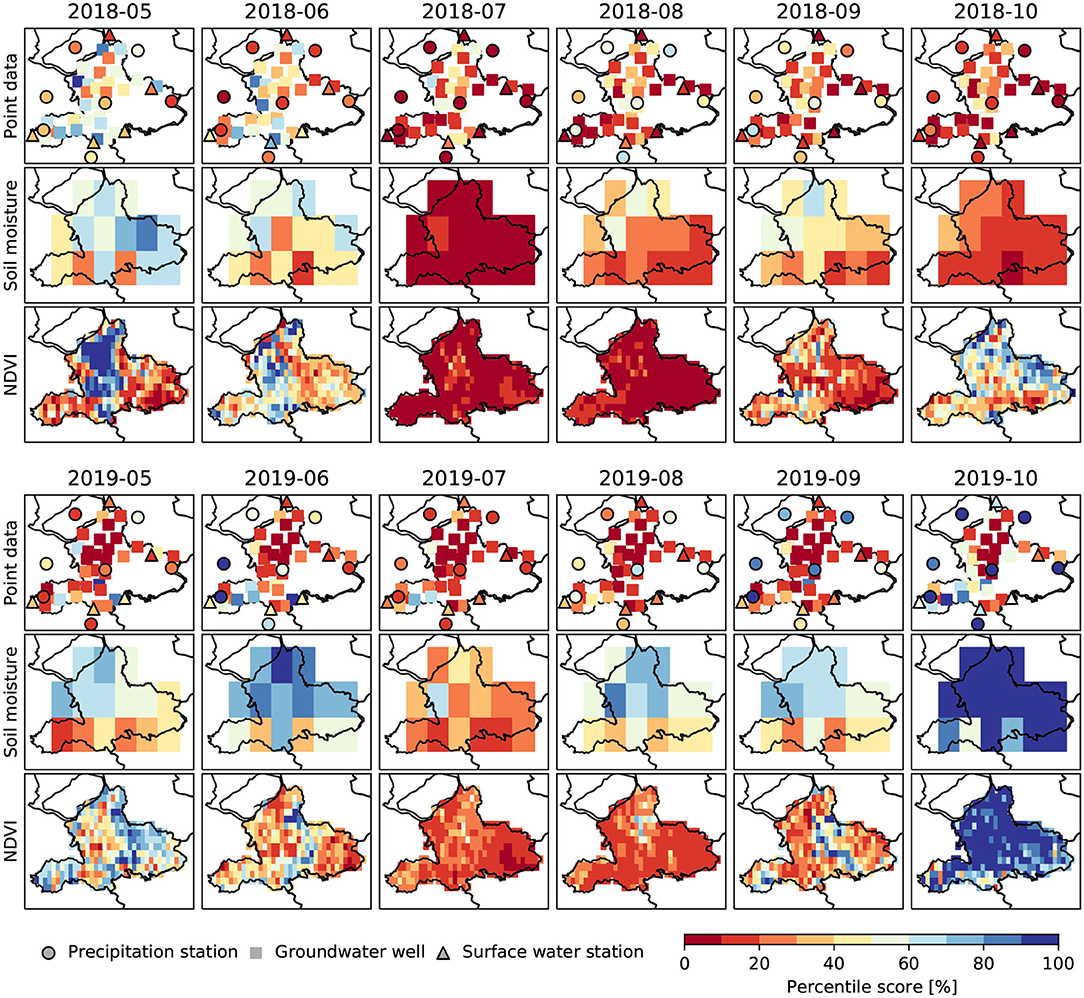
Figure 4. Spatio-temporal evolution of the drought during May-October in 2018 and 2019.
Similar to 2018, precipitation values showed low percentile scores in July 2019, and both soil moisture and NDVI reached low percentile scores in the same month. Groundwater levels, on the other hand, were already low at the start of 2019, as they had not yet recovered from the drought of the previous year (also visible in Figure 3). Despite higher precipitation values in September and October 2019, the majority of the groundwater levels did not recover and remained below the 20% percentile score. Surface water shows a similar response as the groundwater, starting already at low percentile scores in May 2019. Only in October 2019, the percentile scores for the large rivers start to recover, while the Berkel river was still showing low percentile scores.
The complete time series for all variables and measurement stations/pixels are presented in the left column of Figure 5. These panels show both the spatial and temporal variability within the different stations/pixels of a single variable, but also shows the interaction between the five variables. Overall, all variables show relatively low variability between the stations, but show substantial differences in terms of temporal variability. Most striking is the temporal variability in precipitation (Figure 5A): percentile scores can jump from extremely high percentile scores to extremely low percentile scores, from 1 month to the next. Soil moisture and NDVI show a more smooth temporal signal. This is as expected, as these variables have a “memory” and are therefore unlikely to move from one end of the spectrum to the other in a single month. It is noteworthy that the relatively high soil moisture values around 2010 are not matched with high NDVI values in the same period, but rather the opposite. Likewise, NDVI shows high values around 2014–2016, while soil moisture values show a rather dry signal. The drought of 2018 is clearly visible in both, while the drought of 2019 is only clearly visible in the NDVI signal. Both groundwater and surface water percentiles again show similar dynamics. Both start relatively wet at the early years of our analysis, and move toward predominantly low percentile values at the end of the time series. Both variables stay longest in drought conditions during 2018 and 2019, as is also visible in Figure 3.
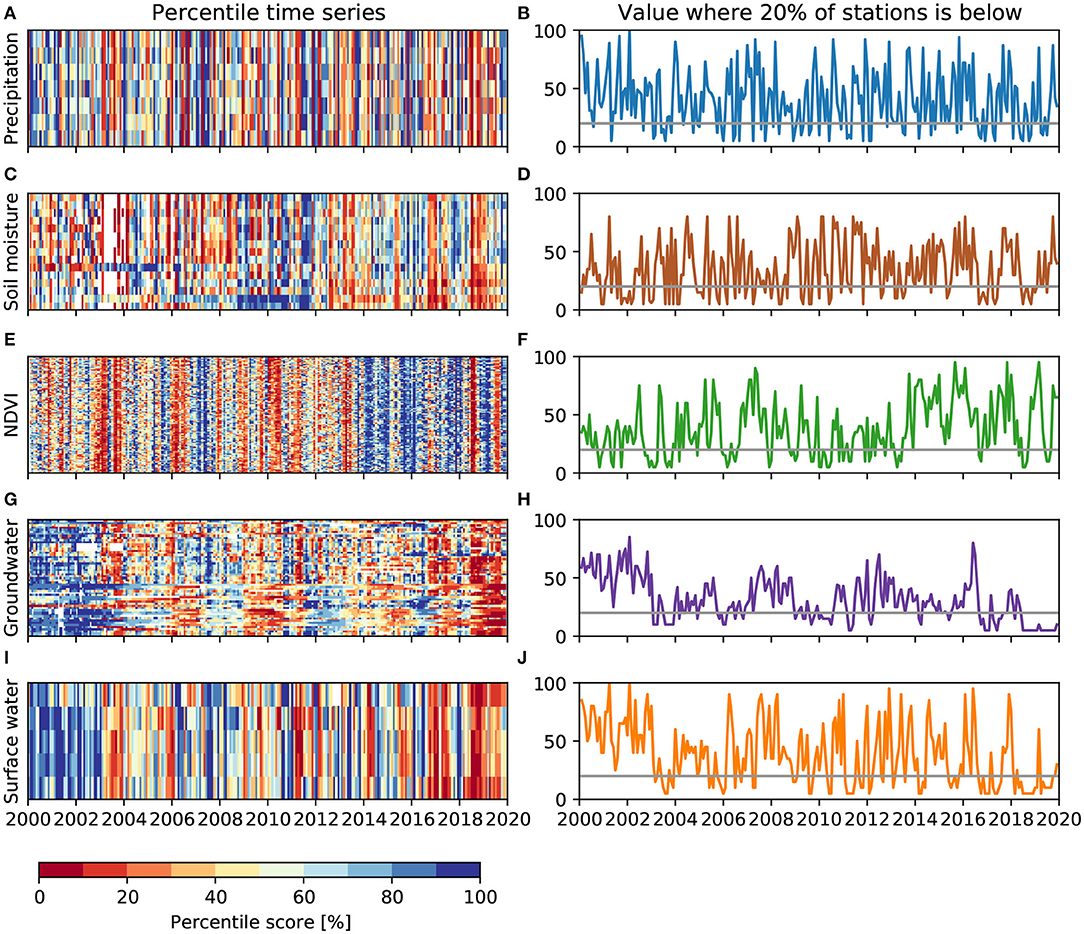
Figure 5. Spatial and temporal variability in percentile scores across all variables. (A,C,E,G,I) Show the time series of all stations over the entire data period, where each row in each panel represents an individual measurement point/pixel. (B,D,F,H,J) Show the value that represents the point where 20% of the stations/pixels in that variable are below this value.
The right column of Figure 5 shows the value where 20% of the stations have a value equal or lower to this value. A variable is in drought conditions whenever at least 20% of the stations of that variable are in drought conditions, resulting in Figure 6A. Resulting from the spatial variability, all variables are more frequently in drought conditions than the percentile score suggests: ranging between 27 and 38% of the time, while the percentile score suggests 20% of the time. The fact that the drought frequency is higher than the percentile score, indirectly indicates that there is variability between measurement stations/pixels.
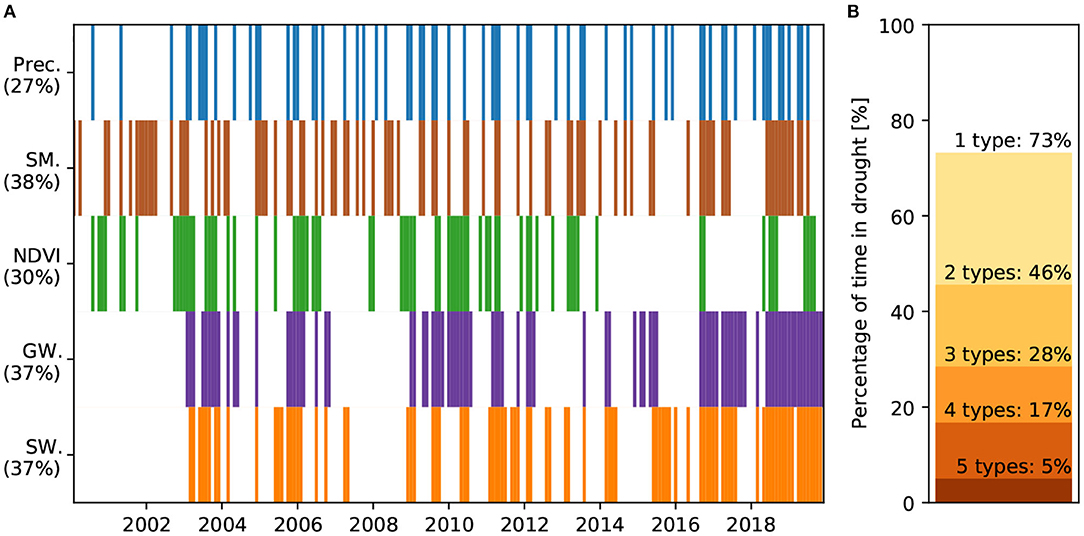
Figure 6. Temporal evolution of drought conditions over the entire study period. (A) Highlights the months where the variable is considered to be in drought conditions. Percentages on the y-axis indicate the percentage of time that each variable is in drought conditions. (B) Shows the percentage of time the study area is in drought conditions, depending on how many variables are below the drought threshold.
Figure 6B shows the percentage of time that x variables are meeting the drought condition. Despite that the drought threshold is set to be at a percentile score of 20%, the study area is considered to be in drought conditions for 73% of the time. This can be attributed to the different variables considered, which do not always have overlapping droughts. The percentage of time in drought is reduced when more variables have overlapping droughts. In order to match the percentage of time in drought with the drought threshold, three to four variables need to have overlapping droughts. When all five variables have overlapping droughts, the region is only considered to be in drought conditions for 5% of the time.
The results in Figure 6, where the number of droughts seems to have increased in recent years, raise the question whether there has been a change in the frequency of co-occurring droughts within our study period (see Figure 7). The number of droughts in both groundwater and surface water increased substantially, mostly due to the 2018 and 2019 droughts (Figure 6A). The highlighted green bar in Figure 7 shows that the droughts of 2018 and 2019 can partly be attributed to this increase. The last 10 years also had more frequent co-occurrences of droughts, with the years 2018 and 2019 again playing a substantial role. Even without these years, 2010–2019 had more frequent droughts where at least 4 variables were in drought conditions.
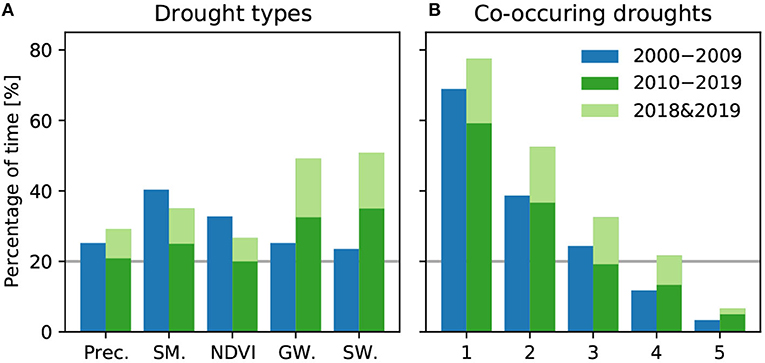
Figure 7. Change in drought frequency between 2000–2009 and 2010–2019. (A) Shows the percentage of time each variable is below the drought threshold, and (B) shows the percentage of time at least x variables are in drought conditions. The horizontal line corresponds with the expected frequency based on the 20% percentile threshold. The entire green bar represents the 2010–2019 period, and the highlighted green bar represents the contribution of the recent droughts over the last 2 years.
When plotting the percentile threshold to define drought against the percentage of time that the data is below this threshold, we see that this relation is consistent across all threshold values (Figure 8). In this figure, we plot the percentile threshold from 0 to 100% for completeness, but percentile thresholds above roughly 30% would not be relevant for drought studies. However, showing the entire range facilitates the understanding of how the drought threshold and percentage of time in drought relate. In Figure 8A, we see that groundwater levels deviate farthest from the 1:1 line, followed by NDVI and soil moisture values. Both precipitation and surface water show a similar deviation from the 1:1 line. As mentioned earlier, this deviation can be attributed to variation between the different measurement stations/pixels. Plotting the values from Figure 6B as a function of the percentile threshold to define drought, we get the results in Figure 8B. At a percentile threshold of just above 30% percent, there is at least one variable in drought conditions nearly 90% of the time. At the more commonly used 20% threshold, this number reduces somewhat to 73% of the time. This confirms our hypothesis that droughts are occurring more often than the threshold would suggest, when multiple variables in the hydrological cycle are considered. When a threshold of 20% is used as drought definition, droughts anywhere in the system occur at least three times more frequently. On the other hand, the situation where drought occurs across all components of the terrestrial hydrological cycle is four times less likely than the drought threshold of 20% (namely 5%).

Figure 8. Relation between drought threshold and percentage of time in a drought. (A) Shows the percentage of time each variable is below the corresponding threshold. (B) Shows how often the area is in drought conditions for a different number of variables considered. The dotted line in both panels shows the 1:1 line. Value between brackets shows the percentage of time each variable in drought conditions at the 20% percentile threshold.
4. Discussion
In this study, we investigate droughts in five different variables in the hydrological cycle: precipitation, soil moisture, vegetation, groundwater, and surface water. We show how these variables interact, and how the propagation and spatial variability of each of these variables influence the (co-)occurrence of drought and the effective drought frequency in Gelderland, the Netherlands. Our results show that droughts, when viewed across a complex hydrological system, are common rather than rare. This is of course dependent on the exact definition of a drought. In our study, we used the 20th percentile as drought threshold, meaning that mild droughts are included as well. This could potentially entail that events without clear impacts are classified as droughts, something that was highlighted as a challenge in drought definition by Stahl et al. (2020). Despite this, our drought definition still reflects common practices in water management, and we therefore emphasize that this practice is susceptible to a drought frequency paradox. Given our results, two obvious questions can be raised: are the results representative for other regions, and what are possible solutions for drought monitoring?
At first glance, the Dutch province of Gelderland is a unique region in the Netherlands, with geomorphological features ranging from floodplains to the sandy moraine (the Veluwe Massif), and substantial regions that are used for agriculture. Additionally, it is situated in the downstream areas of several rivers. While this may perhaps be unique for the Netherlands, the general features that influence drought are less unique. The majority of agricultural production occurs in downstream regions of river systems, due to the relatively flat land and availability to water, and it is in these regions that drought is highly relevant since agriculture could be impacted by both local droughts (e.g., soil moisture), but also by drought occurring upstream of the river basin, through its impact on river discharge. Furthermore, much of the signal is caused by spatial variability in the groundwater response to drought. But in the study by Kumar et al. (2016), also partly in Gelderland, similar variability in groundwater response was found for many regions in Germany. And while we did not investigate the dependency of our results on the size of the study region, we expect that most regions with variability in soil, vegetation, and depth to the groundwater table will show similar behavior. At larger scales, possible spatial variability in meteorological drought conditions might even become an additional factor that contributes to a higher frequency of co-occurring droughts.
As for the monitoring of droughts, several attempts have been made to either extend or improve common indices. Meteorological drought indicators are most frequently used (Bachmair et al., 2016), as meteorological drought is typically the driver of the other drought types, has usually longer available data records, and is generally easiest to measure. However, our results show that meteorological droughts do not correctly represent droughts in the four other considered variables. This is in line with other studies. For example, Kumar et al. (2016) used SPI to estimate the Standardized Groundwater Index (SGI). They found that long SPI accumulation times were required to reach high correlation with SGI, but failed to correctly predict the actual SGI values. Furthermore, Bachmair et al. (2018) conclude that using meteorological indices to represent agricultural and forest droughts highly varied with climate. Stagge et al. (2015) created a model using meteorological drought data as input to predict different drought types. They show promising results, but also note that their model needs to be re-calibrated for different regions. Given the conclusions of these studies, and the results from our study, we stress the importance of drought monitoring across all relevant components of the hydrological cycle. Even if meteorological drought could be used for extrapolation to other drought types, correct understanding of the link between these drought types—and hence the monitoring—is a requirement.
A possible solution to this paradox would be the use of compound drought indices. Two approaches are possible here, although they both have important disadvantages. In the first approach, a compound index can be calculated similar to our current approach, i.e., identify a drought whenever there are serious drought conditions in one or more parts of the hydrological system. The disadvantage of this approach is that the effective drought frequency might increase to levels that are incompatible with current drought definitions that define drought as a rare event. In the second approach, a compound drought index can be transformed such that the effective drought frequency is exactly the pre-defined value. While this approach might seem intuitive, it likely will require local calibration and an (arbitrary) weighing between different parts of the hydrological system and the relative impact of drought on certain economic sectors. The above suggests that tailor-made solutions remain necessary for effective drought monitoring and management at regional scales. Furthermore, the impact of a drought does not necessarily correspond with the occurrence of a drought as measured with an index, as this also depends on the socio-economic value. Therefore, we stress the importance of monitoring all relevant variables in the area of interest, involving both satellite remote sensing (West et al., 2019) and local observations, in close collaboration with stakeholders to quantify the impacts. Impacts are ultimately the most relevant aspect of droughts from a societal or operational water management perspective, which implies that a drought index should reflect the impacts rather than raise an unwanted drought frequency paradox.
5. Conclusions
An overview of five major variables in the hydrological cycle (precipitation, soil moisture, vegetation greenness, groundwater, and surface water levels) allows us to study a possible drought frequency paradox. The analysis focused on the Dutch province of Gelderland. Using the recent droughts of 2018 and 2019 as case studies, we show that each variable operates with typical temporal and spatial variability. Precipitation is rather homogeneous in space, but highly variable in time. Soil moisture and NDVI both are more spatially variable, but their temporal signal is smoother with respect to precipitation. Despite difference in underlying processes and scale, groundwater and surface water levels show very similar responses during these droughts. Inter- and intra-variability of these five variables causes different types of droughts in different parts of both space and time.
With a percentile score of 20% as the drought threshold at the pixel/point level, we show that each variable can be considered to be in drought at the regional scale for 26–38% of the time depending on the variable, which is more frequent than the 20% of the time the percentile threshold suggests. When all relevant variables are considered, at least one variable is in drought conditions for 73% of the time. Both of these values can lead to a perception of a drought frequency paradox, where drought occurs much more frequently than would be expected based on the used main drought threshold. The percentage of time matches the drought (frequency) threshold only when three to four variables are in drought conditions. We showed that the usage of a common drought definition (albeit for mild droughts) can lead to a perception of a drought frequency paradox. This might not be representative for the actual drought conditions, and we therefore stress the importance of close collaboration between scientists, water managers and stakeholders to ensure correct drought detection within a hydrological system. This can be achieved through correctly calibrated compound indices, as multiple univariate indices can lead to a drought frequency paradox.
Data Availability Statement
The raw data supporting the conclusions of this article will be made available by the authors, without undue reservation.
Author Contributions
JB and AT designed the study with input from TvH, and JB performed the analysis. JB drafted the manuscript, with a substantial input from AT and TvH. All authors critically revised the manuscript, gave final approval for publication, and agree to be held accountable for the work performed therein.
Funding
We acknowledged funding from Wageningen University and Research through the wild-card project Improved drought monitoring.
Conflict of Interest
The authors declare that the research was conducted in the absence of any commercial or financial relationships that could be construed as a potential conflict of interest.
References
Andreadis, K. M., Clark, E. A., Wood, A. W., Hamlet, A. F., and Lettenmaier, D. P. (2005). Twentieth-century drought in the conterminous United States. J. Hydrometeorol. 6, 985–1001. doi: 10.1175/JHM450.1
Bachmair, S., Stahl, K., Collins, K., Hannaford, J., Acreman, M., Svoboda, M., et al. (2016). Drought indicators revisited: the need for a wider consideration of environment and society. WIREs Water 3, 516–536. doi: 10.1002/wat2.1154
Bachmair, S., Tanguy, M., Hannaford, J., and Stahl, K. (2018). How well do meteorological indicators represent agricultural and forest drought across Europe? Environ. Res. Lett. 13:034042. doi: 10.1088/1748-9326/aaafda
Buitink, J., Swank, A. M., van der Ploeg, M., Smith, N. E., Benninga, H. J. F., van der Bolt, F., et al. (2020). Anatomy of the 2018 agricultural drought in The Netherlands using in situ soil moisture and satellite vegetation indices. Hydrol. Earth Syst. Sci. 24, 6021–6031. doi: 10.5194/hess-24-6021-2020
Buitink, J., Uijlenhoet, R., and Teuling, A. J. (2018). Evaluating seasonal hydrological extremes in mesoscale (pre-)Alpine basins at coarse 0.5° and fine hyperresolution. Hydrol. Earth Syst. Sci. 23, 1593–1609. doi: 10.5194/hess-2018-407
Corzo Perez, G. A., van Huijgevoort, M. H. J., Vo?, F., and van Lanen, H. a. J. (2011). On the spatio-temporal analysis of hydrological droughts from global hydrological models. Hydrol. Earth Syst. Sci. 15, 2963–2978. doi: 10.5194/hess-15-2963-2011
Denissen, J. M. C., Teuling, A. J., Reichstein, M., and Orth, R. (2020). Critical soil moisture derived from satellite observations over Europe. J. Geophys. Res. Atmos. 125:e2019JD031672. doi: 10.1029/2019JD031672
Didan, K. (2015). MOD13C2 MODIS/Terra Vegetation Indices Monthly L3 Global 0.05Deg CMG V006 Sioux Falls, SD: NASA EOSDIS Land Processes DAAC.
Dorigo, W., Wagner, W., Albergel, C., Albrecht, F., Balsamo, G., Brocca, L., et al. (2017). ESA CCI soil moisture for improved earth system understanding: state-of-the art and future directions. Rem. Sens. Environ. 203, 185–215. doi: 10.1016/j.rse.2017.07.001
Dracup, J. A., Lee, K. S., and Paulson, E. G. (1980). On the definition of droughts. Water Resour. Res. 16, 297–302. doi: 10.1029/WR016i002p00297
Fleig, A. K., Tallaksen, L. M., Hisdal, H., and Demuth, S. (2006). A global evaluation of streamflow drought characteristics. Hydrol. Earth Syst. Sci. 10, 535–552. doi: 10.5194/hess-10-535-2006
Gibbs, W. J., and Maher, J. V. (1967). Rainfall Deciles as Drought Indicators. Bulletin No. 48. Melbourne, VIC: Bureau of Meteorology.
Gruber, A., Dorigo, W. A., Crow, W., and Wagner, W. (2017). Triple collocation-based merging of satellite soil moisture retrievals. IEEE Trans. Geosci. Rem. Sens. 55, 6780–6792. doi: 10.1109/TGRS.2017.2734070
Gruber, A., Scanlon, T., van der Schalie, R., Wagner, W., and Dorigo, W. (2019). Evolution of the ESA CCI soil moisture climate data records and their underlying merging methodology. Earth Syst. Sci. Data 11, 717–739. doi: 10.5194/essd-11-717-2019
Hayes, M., Svoboda, M., Wall, N., and Widhalm, M. (2011). The Lincoln Declaration on drought indices: universal meteorological drought index recommended. Bull. Am. Meteorol. Soc. 92, 485–488. doi: 10.1175/2010BAMS3103.1
Heim, R. R. (2002). A review of twentieth-century drought indices used in the United States. Bull. Am. Meteorol. Soc. 83, 1149–1166. doi: 10.1175/1520-0477-83.8.1149
Hisdal, H., Stahl, K., Tallaksen, L. M., and Demuth, S. (2001). Have streamflow droughts in Europe become more severe or frequent? Int. J. Climatol. 21, 317–333. doi: 10.1002/joc.619
Huijgevoort, M. H. J. v., Hazenberg, P., Lanen, H. A. J. v., Teuling, A. J., Clark, D. B., Folwell, S., et al. (2013). Global multimodel analysis of drought in runoff for the second half of the twentieth century. J. Hydrometeorol. 14, 1535–1552. doi: 10.1175/JHM-D-12-0186.1
Jolly, W. M., Dobbertin, M., Zimmermann, N. E., and Reichstein, M. (2005). Divergent vegetation growth responses to the 2003 heat wave in the Swiss Alps. Geophys. Res. Lett. 32:L18409. doi: 10.1029/2005GL023252
Kumar, R., Musuuza, J. L., van Loon, A. F., Teuling, A. J., Barthel, R., ten Broek, J., et al. (2016). Multiscale evaluation of the Standardized Precipitation Index as a groundwater drought indicator. Hydrol. Earth Syst. Sci. 20, 1117–1131. doi: 10.5194/hess-20-1117-2016
Mastrotheodoros, T., Pappas, C., Molnar, P., Burlando, P., Manoli, G., Parajka, J., et al. (2020). More green and less blue water in the Alps during warmer summers. Nat. Clim. Change 10, 155–161. doi: 10.1038/s41558-019-0676-5
Miralles, D. G., Gentine, P., Seneviratne, S. I., and Teuling, A. J. (2019). Land-atmospheric feedbacks during droughts and heatwaves: state of the science and current challenges. Ann. N. Y. Acad. Sci. 1436, 19–35. doi: 10.1111/nyas.13912
Schoonjans, F., De Bacquer, D., and Schmid, P. (2011). Estimation of population percentiles. Epidemiology 22, 750–751. doi: 10.1097/EDE.0b013e318225c1de
Sheffield, J., Andreadis, K. M., Wood, E. F., and Lettenmaier, D. P. (2009). Global and continental drought in the second half of the twentieth century: severity area duration analysis and temporal variability of large-scale events. J. Clim. 22, 1962–1981. doi: 10.1175/2008JCLI2722.1
Stagge, J. H., Kohn, I., Tallaksen, L. M., and Stahl, K. (2015). Modeling drought impact occurrence based on meteorological drought indices in Europe. J. Hydrol. 530, 37–50. doi: 10.1016/j.jhydrol.2015.09.039
Stahl, K., Vidal, J. P., Hannaford, J., Tijdeman, E., Laaha, G., Gauster, T., et al. (2020). “The challenges of hydrological drought definition, quantification and communication: an interdisciplinary perspective,” in Proceedings of the International Association of Hydrological Sciences (Beijing), Vol. 383, 291–295. doi: 10.5194/piahs-383-291-2020
Steinemann, A. (2003). Drought indicators and triggers: a stochastic approach to evaluation. J. Am. Water Resour. Assoc. 39, 1217–1233. doi: 10.1111/j.1752-1688.2003.tb03704.x
Steinemann, A., Iacobellis, S. F., and Cayan, D. R. (2015). Developing and evaluating drought indicators for decision-making. J. Hydrometeorol. 16, 1793–1803. doi: 10.1175/JHM-D-14-0234.1
Tallaksen, L. M., Hisdal, H., and Lanen, H. A. J. V. (2009). Space-time modelling of catchment scale drought characteristics. J. Hydrol. 375, 363–372. doi: 10.1016/j.jhydrol.2009.06.032
Teuling, A. J. (2018). A hot future for European droughts. Nat. Clim. Change 8, 364–365. doi: 10.1038/s41558-018-0154-5
Teuling, A. J., van Loon, A. F., Seneviratne, S. I., Lehner, I., Aubinet, M., Heinesch, B., et al. (2013). Evapotranspiration amplifies European summer drought. Geophys. Res. Lett. 40, 2071–2075. doi: 10.1002/grl.50495
van Engelenburg, J., Hueting, R., Rijpkema, S., Teuling, A. J., Uijlenhoet, R., and Ludwig, F. (2018). Impact of changes in groundwater extractions and climate change on groundwater-dependent ecosystems in a complex hydrogeological setting. Water Resour. Manage. 32, 259–272. doi: 10.1007/s11269-017-1808-1
van Hateren, T. C., Chini, M., Matgen, P., and Teuling, A. J. (2020). Ambiguous agricultural drought: characterising soil moisture and vegetation droughts in Europe from earth observation. Hydrol. Earth Syst. Sci. doi: 10.5194/hess-2020-583
van Huijgevoort, M. H. J., van Lanen, H. A. J., Teuling, A. J., and Uijlenhoet, R. (2014). Identification of changes in hydrological drought characteristics from a multi-GCM driven ensemble constrained by observed discharge. J. Hydrol. 512, 421–434. doi: 10.1016/j.jhydrol.2014.02.060
van Loon, A. F. (2015). Hydrological drought explained. WIREs Water 2, 359–392. doi: 10.1002/wat2.1085
Van Loon, A. F., Gleeson, T., Clark, J., Van Dijk, A. I. J. M., Stahl, K., Hannaford, J., et al. (2016). Drought in the anthropocene. Nat. Geosci. 9, 89–91. doi: 10.1038/ngeo2646
West, H., Quinn, N., and Horswell, M. (2019). Remote sensing for drought monitoring & impact assessment: progress, past challenges and future opportunities. Rem. Sens. Environ. 232:111291. doi: 10.1016/j.rse.2019.111291
Wilhite, D. A., and Glantz, M. H. (1985). Understanding: the drought phenomenon: the role of definitions. Water Int. 10, 111–120. doi: 10.1080/02508068508686328
Keywords: drought, drought frequency, drought characterization, hydrological complexity, European 2018 summer drought
Citation: Buitink J, van Hateren TC and Teuling AJ (2021) Hydrological System Complexity Induces a Drought Frequency Paradox. Front. Water 3:640976. doi: 10.3389/frwa.2021.640976
Received: 12 December 2021; Accepted: 21 April 2021;
Published: 24 May 2021.
Edited by:
Johnna Maria Infanti, National Oceanic and Atmospheric Administration (NOAA), United StatesReviewed by:
Gregor Laaha, University of Natural Resources and Life Sciences Vienna, AustriaCharles Onyutha, Kyambogo University, Uganda
Copyright © 2021 Buitink, van Hateren and Teuling. This is an open-access article distributed under the terms of the Creative Commons Attribution License (CC BY). The use, distribution or reproduction in other forums is permitted, provided the original author(s) and the copyright owner(s) are credited and that the original publication in this journal is cited, in accordance with accepted academic practice. No use, distribution or reproduction is permitted which does not comply with these terms.
*Correspondence: Adriaan J. Teuling, cnlhbi50ZXVsaW5nQHd1ci5ubA==