
94% of researchers rate our articles as excellent or good
Learn more about the work of our research integrity team to safeguard the quality of each article we publish.
Find out more
ORIGINAL RESEARCH article
Front. Water, 27 August 2021
Sec. Water and Hydrocomplexity
Volume 3 - 2021 | https://doi.org/10.3389/frwa.2021.640736
This article is part of the Research TopicChallenges of Hydrological Drought Monitoring and PredictionView all 7 articles
 Daniel P. Sarmiento1,2*
 Kimberly Slinski1,3
 Amy McNally2,4
 Jossy P. Jacob1,5Chris Funk6Pete Peterson6Christa D. Peters-Lidard1
Many precipitation-driven data products from land data assimilation systems support assessments of droughts, floods, and other societally-relevant land-surface processes. The accumulated precipitation used as input to these products has a significant impact on water budgets; however, the effects of daily distribution of precipitation on these products are not well known. A comparison of the Integrated Multi-satellite Retrievals for GPM (IMERG) and Climate Hazards Group InfraRed Precipitation with Stations version 2 (CHIRPS2) rainfall products over the continental United States (CONUS) was performed to quantify the impacts of the daily distribution of precipitation on biases and errors in soil moisture, runoff, and evapotranspiration (ET). Since the total accumulated precipitation between the IMERG and CHIRPS product differed, a third precipitation product, CHIRPS-to-IMERG (CHtoIM), was produced that used CHIRPS2 accumulated precipitation totals and the daily precipitation frequency distribution of IMERG. This new product supported a controlled analysis of the impact of precipitation frequency distribution on simulated hydrological fields. The CHtoIM had higher occurrences of precipitation in the 0–5 mm day−1 range, with a lower occurrence of dry days, which decreased soil moisture and surface runoff in the land-surface model. The surface soil layer had a tendency to reach saturation more often in the CHIRPS2 simulations, where the number of moderate to heavy precipitation days (>5 mm day−1) was increased. Using the blended CHtoIM product as input reduced errors in surface soil moisture by 5–15% when compared to Soil Moisture Active/Passive (SMAP) data. Similarly, ET errors were also slightly decreased (~2%) when compared to SSEBop data. Moderate changes in daily precipitation distributions had a quantifiable impact on soil moisture, runoff, and ET. These changes usually improved the model when compared to other modeled and observational datasets, but the magnitude of the improvements varied by region and time of year.
Accurate precipitation data is critical for simulations of land-surface processes and hydrometeorological phenomena. Precipitation forcing products integrate ground, remotely-sensed, radar, and other observations produce reasonably accurate estimates of rainfall. While in some regions increases in the accuracy and number of observations have allowed these precipitation forcing datasets to more accurately represent precipitation patterns (e.g., Fekete et al., 2004; Feidas, 2010; Huffman et al., 2010), large differences between the products still occur, especially when looking at precipitation rates on shorter time scales or over certain regions (e.g., Feidas, 2010; Manz et al., 2017; Iqbal and Athar, 2018). Quantification of these errors is usually done by comparing in-situ measurements (e.g., Dezfuli et al., 2017; Manz et al., 2017; Iqbal and Athar, 2018; Rivera et al., 2018) but error quantification using statistical or ensemble-based approaches has also been documented (e.g., Bellerby and Sun, 2005; Maggioni et al., 2014). Discrepancies between precipitation products cause differences to occur in land-surface models, especially in simulated hydrological fields.
An example of differences in prescribed rainfall data leading to differences in other simulated fields can be seen in the extensive global study by Fekete et al. (2004). This study compared simulations of hydrologic variables by models forced with six precipitation products. The precipitation products used in the study were the Climate Research Unit (New et al., 2000), Global Precipitation Climate Center (Rudolf et al., 1994), Global Precipitation Climatology Project (Huffman et al., 1995), National Centers for Environmental Prediction–Department of Energy Atmospheric Model Intercomparison Project (AMIP-II) Reanalysis (Kanamitsu et al., 2002), Tropical Rainfall Measuring Mission (Huffman et al., 1997), and the Willmott–Matsuura (Willmott and Matsuura, 2001) rainfall products. While the largest differences in precipitation were over the wet tropics, a notoriously difficult area to accurately estimate precipitation, the largest impact to simulated runoff occurred in arid and semi-arid areas. Errors in arid regions were also non-linear and could either produce either large errors or no errors in runoff depending on the time scale and magnitudes of the precipitation rates being used. The potential for non-linear sensitivity to errors in precipitation makes quantification of errors in precipitation forcing products important when trying to understand the potential hydrological field errors that can occur in land-surface models, such as impacts on simulated soil moisture (e.g., Gebregiorgis et al., 2012).
Another study over Greece (Feidas, 2010) found a strong intra-annual cycle within six different remotely-sensed rainfall products and that the magnitude of the errors had a seasonal dependence. Most of the satellite products used in this study were found to overestimate precipitation in the summer and spring months while errors were at a minimum during the winter months. Error sensitivity to time of year (e.g., Tian et al., 2007; Dezfuli et al., 2017; Watters et al., 2018) and rainfall frequency distributions (e.g., Tian et al., 2007; Tan et al., 2016) have been reported by other studies and should be considered when trying to quantify the errors in precipitation products.
The Integrated Multi-satellite Retrievals for GPM (IMERG) product is a remotely-sensed precipitation product that integrates passive microwave and infrared satellite data with surface station observations (Huffman et al., 2015, 2019a,b, 2020). The IMERG precipitation product has been used in numerous verification studies, including studies over Africa (Dezfuli et al., 2017), South America (Manz et al., 2017; Gadelha et al., 2019), Spain (Tapiador et al., 2020), and the mid-Atlantic region of the United States (Tan et al., 2016). These studies demonstrated that IMERG was generally able to capture large spatial and low temporal frequency patterns of rainfall. Tan et al. (2016) found that the IMERG product overestimates drizzle and other low rainfall conditions while underestimating higher rainfall magnitude events for the mid-Atlantic region of the US.
The Climate Hazards Group InfraRed Precipitation with Stations (CHIRPS) rainfall product also integrates remotely-sensed data with station data to create a global precipitation product (Funk et al., 2014, 2015). This rainfall product has been used in for numerous studies in Africa (e.g., Shukla et al., 2014; Maidment et al., 2017; McNally et al., 2017, 2019; Dinku et al., 2018; Arsenault et al., 2020) and other regions around the globe (e.g., Katsanos et al., 2016; Beck et al., 2017; Paredes-Trejo et al., 2017). Errors in the CHIRPS dataset were found to vary by region, season, and temporal scale, but this is common with all remotely-sensed rainfall datasets. Most of the previously mentioned studies only focused on the total rainfall accumulation of these products and the effects that these differences had on other simulated processes. The effects of precipitation distribution biases (such as those mentioned in Tan et al., 2016) on simulated hydrological processes are still not thoroughly documented.
The objectives of this study were the following:
1) If the amount of precipitation is held constant but the daily rainfall distribution is changed, would the modeled hydrological variables in a land-surface model change?
2) Which hydrological variables are most affected by the change in daily rainfall distribution and what is the magnitude of the change?
We hypothesized that differences in the daily precipitation distribution will result in quantifiable changes in surface soil moisture, runoff, and evapotranspiration (ET).
In this study, the daily version of CHIRPS2 (CHIRPS2-Daily) was used to prescribe the precipitation in one set of land-surface model simulations. For the second set of simulations, we used both the CHIRPS2 (publicly-available pentad rainfall product; version 2) and IMERG-Final rainfall products to create a new adjusted precipitation dataset, CHIRPS-to-IMERG (CHtoIM). The CHIRPS and IMERG products were chosen because both products have been well-studied in the broader meteorological and hydrological community. Both products use independent methods of estimating rainfall with satellite data and provided high quality data to use in this study. We then compared the daily precipitation distributions of the two experiments (CHIRPS2-Daily and CHtoIM). Differences in the experiments due to changes in daily precipitation distribution were quantified. The quantification of these impacts can motivate future work and will be important as precipitation products continue to improve and converge on accumulated precipitation on an annual and monthly scale.
Finally, we compared the modeled outputs to two observational datasets and quantified the errors in surface soil moisture and ET for the domain. Quantification of these changes led to a better understanding of the more generalized errors that were seen when hydrological and land-surface models were initialized with different remotely-sensed precipitation products.
The study examined two sets of land-surface model simulations whose only difference was the precipitation forcing. These two forcings had equivalent precipitation accumulations at a 5-day temporal scale but the precipitation distributions differed on a daily scale. The first precipitation forcing used was a daily product of CHIRPS2 (CHIRPS2-Daily). The second precipitation dataset was created by using precipitation totals from the CHIRPS2 pentad product and the daily distribution of the IMERG-Final product. Comparisons of surface soil moisture, runoff, and ET were made for the two experiments. Satellite-derived products of soil moisture and ET were used to quantify the errors in the simulated outputs of both experiments.
The NASA Land Information System (LIS) software framework (Kumar et al., 2006) was used to run the land-surface simulations used in this study. The LIS framework allows simple integration of land-surface models with multiple meteorological forcings and parameterizations. The domain for the study was configured for continental United States (CONUS) with a grid spacing of 10 km. The northwest and southeast corners of the domain were located at 49.85°N 124.95°W and 25.05°N 67.05°W respectively. The Noah 3.6 land-surface model (Chen and Dudhia, 2001) was used to simulate the land-surface processes in the simulations. The land-surface model uses parameterized values for soil properties to simulate runoff and water percolation in the soil. The Noah LSM uses four soil layers with depths of 10, 30, 60, and 100 cm. Soil texture information for the runs were developed using the Food and Agriculture Organization (FAO) of the United Nations definitions. All other soil properties used default Noah 3.6 parameter values. Landcover data is MODIS-derived (Friedl et al., 2010) using the International Geosphere Biosphere Program (IGBP) 17-class category convection. All meteorological fields except precipitation were taken from MERRA-2 [Bloom et al., 2005; Bosilovich et al., 2015; Global Modeling Assimilation Office (GMAO), 2015]. The simulations were spun-up for 30 years to ensure a stable soil moisture profile and were then run for 4 years (January 2016–December 2019). This initial spin-up was performed to ensure that the soil moisture profiles were at an equilibrium and that the subsequent changes in hydrological variables in the land-surface model were a direct response to precipitation. Most of the variables that will be discussed in this paper were chosen due to their quick response time to changes in precipitation. With a quick response to changes in precipitation rates, we can ensure that the changes in the 4 years of the study are representative of changes that would be seen for any time period of interest.
We ran the model with CHIRPS2-Daily (referred to hereafter as “ExpC2D”) and CHtoIM (described in next section; referred to hereafter as “ExpCHtoIM”) to produce daily hydrologic outputs: four layers of soil moisture (0–10, 10–40, 40–100, and 100–200 cm), surface and subsurface runoff, and total ET. The outputs of the two models were compared to assess their sensitivity to different daily rainfall distributions. This was done by analyzing the monthly averages of the two experiments over 4 years with an “error reduction” metric performed on a grid point by grid point basis.
Climate Hazards Group InfraRed Precipitation with Stations version 2 pentad data was combined with the IMERG-Final daily data to create CHtoIM, the precipitation forcing for ExpCHtoIM. The CHIRPS2 pentad accumulated rainfall totals were redistributed according to the IMERG rainfall ratios over that same pentad. If the IMERG product had precipitation occurring during the pentad and the CHIRPS2 product had no detectable rainfall (<1 mm per pentad) during the same pentad, then no precipitation was distributed over that 5-day period in the CHtoIM precipitation dataset. If CHIRPS2 had rain for a particular pentad and IMERG-Final had no precipitation over the same period, then the CHIRPS2 rainfall total was evenly distributed over that 5-day period.
An example would be the following: a given CHIRPS2 pentad had a rainfall total of 20 mm. The IMERG-Final data had the following daily rainfall for the same pentad: 8, 0, 2, 6, 0 mm. These IMERG-Final data were converted to ratios (0.5, 0, 0.125, 0.375, 0) and the CHIRPS2 pentad total rainfall was redistributed across these ratios. The resulting CHtoIM precipitation for this pentad would be 10, 0, 2.5, 7.5, 0 mm. This ensures that the pentad rainfall amounts between CHIRPS2 and CHtoIM are identical while varying the daily rainfall distribution frequencies.
This pentad redistribution was repeated for the entire timespan of the study (2016–2019). The rainfall redistribution methodology generated CHtoIM accumulated precipitation pentad totals that equaled CHIRPS2; however, the resulting daily distribution of rainfall did not match the IMERG-Final distribution exactly. Figure 1 shows a sample of accumulated precipitation for both experiments. The pentad totals were an exact match for these chosen grid points over the ~60 pentads (Figure 1A), though the daily precipitation totals did show some variability (Figure 1B). This verification shows that the CHtoIM dataset was created correctly, where the rainfall accumulation of CHIRPS2 was conserved while varying the daily rainfall distribution.
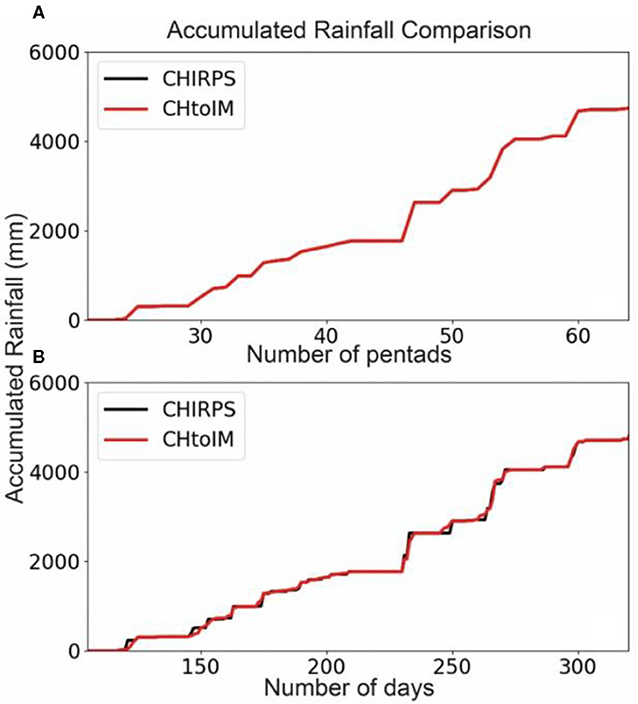
Figure 1. Accumulated rainfall (mm) for a 30 km2 subdomain within both experiments. The accumulated rainfall for over 300 consecutive days is shown using a pentad aggregate (A) and on a daily timestep (B).
The Soil Moisture Active/Passive (SMAP) satellite mission, launched in January 2015, uses data retrieved from an L-band radiometer to generate estimates of global soil moisture (Entekhabi et al., 2010). The SMAP Level-3 9 km data product (Entekhabi et al., 2016) was used in the analysis. All data that were flagged as potentially having large errors, mainly due to precipitation, snow-cover, and radio frequency interference, were excluded from the subsequent analyses. Although the SMAP dataset estimates for surface soil moisture are for a soil depth of approximately 5 cm, data provided by the SMAP mission allows a domain-wide comparison of soil moisture not be possible with in-situ soil moisture stations. The SMAP product has been calibrated and validated with surface observations (Colliander et al., 2014, 2017; Chen et al., 2016a) and has been shown to be fairly accurate across different soil types and different times of year. Soil Moisture Active/Passive data has also been utilized by other authors to assess Noah modeled surface soil moisture errors despite the mismatch in surface soil layer depth (e.g., Shellito et al., 2018), although the smaller drying rates in SMAP relative to in-situ probes suggest that the actual measurement depth of SMAP is shallower than 5 cm (Shellito et al., 2016). A direct comparison of soil moisture content is difficult due to the mismatch in surface soil layer depths between the simulations and SMAP (roughly 5 cm from SMAP vs. 10 cm for our simulations). However, the soil moisture trends between SMAP and simulations has been shown to be accurate and will be used in this study. An analysis of the Normalized Information Contribution (NIC) metric (Kumar et al., 2009) was used to compare the changes that occurred in the simulations using SMAP data for validation. The NIC used the simulated daily anomalies for every month and correlated those with the SMAP daily anomalies. These correlations were then used to calculate the amount of improvement or decline that occurred due to changes in the daily rainfall distribution (Kumar et al., 2009).
The Operational Simple Surface Energy Balance (SSEBop) is the final validation product used in this study. Operational Simple Surface Energy Balance estimates ET using remotely-sensed thermal data and weather fields assimilated into an ET model (Senay et al., 2013, 2020). This combination of remotely-sensed data and ET models allows for domain-wide validation of our simulations without having to rely on point measurements (e.g., AmeriFlux eddy covariance sites). Verification of SSEBop with in-situ measurements show that the SSEBop product performs well (e.g., Senay et al., 2014; Chen et al., 2016b) although the correlations with surface ET measurements can vary with land-surface type (Chen et al., 2016b).
Soil Moisture Active/Passive, SSEBop, and the land-surface model outputs do not have the same data grid spacing and grid point locations. To make the comparisons, the observational datasets (SMAP and SSEBop) were regridded to match the grid spacing and locations of the experiment model outputs. SSEBop was upscaled using a simple averaging algorithm while the SMAP dataset was downscaled using a bilinear downscaling methodology (e.g., Foley, 1987; Arnold et al., 2002). The bilinear downscaling method used four neighboring points to create the weights used in the interpolation of these data. In order to drive the land-surface model, the rainfall data were also downscaled with a bilinear algorithm. The precipitation downscaling methodology used 25 neighboring points to create the interpolation weights while ensuring that the amount of water was always conserved.
While there was some loss of data due to upscaling (via averaging) and downscaling (via bilinear interpolation), regridding these datasets allowed for a more straightforward calculation of errors and statistics for our simulations. The goal of the paper is to quantify changes between ExpC2D and ExpCHtoIM and not necessarily a comparison to observed datasets, so these data loss issues were not as impactful to the overall analysis.
Comparisons of daily precipitation distributions identified substantial differences between the daily CHIRPS2 and IMERG-Final products. CHIRPS2-Daily was found to have a skewed daily rainfall distribution (Figure 2) that favored 0 mm rainfall days over low rainfall intensity days (<5 mm day−1). Figure 2 also shows that the IMERG-Final precipitation product has a higher occurrence of low rainfall days (<5 mm day−1) and a lower occurrence of dry days (0 mm day−1) over CONUS. Comparison of the IMERG-Final and CHIRPS2 daily precipitation frequencies over CONUS (Figure 2) indicates that the largest differences between the products are in the 0 mm to 5 mm precipitation per day range. For the dry days (0 mm day−1), the discrepancy between the two products is large (with frequencies of 76.5% for CHIRPS2 and 17.25% for IMERG). In CHIRPS2, 11.23% of the days were within the >0 mm per day of rain but <5 mm per day range while 71.03% of the days in the IMERG dataset fell within this same range. It should be noted that the subgroupings (dry days-−0 mm day−1; low intensity—>0 to <5 mm day−1; high intensity—>5 mm day−1) were chosen based on the differences in the daily precipitation frequency and not an official designation provided by a meteorological or hydrological organization.
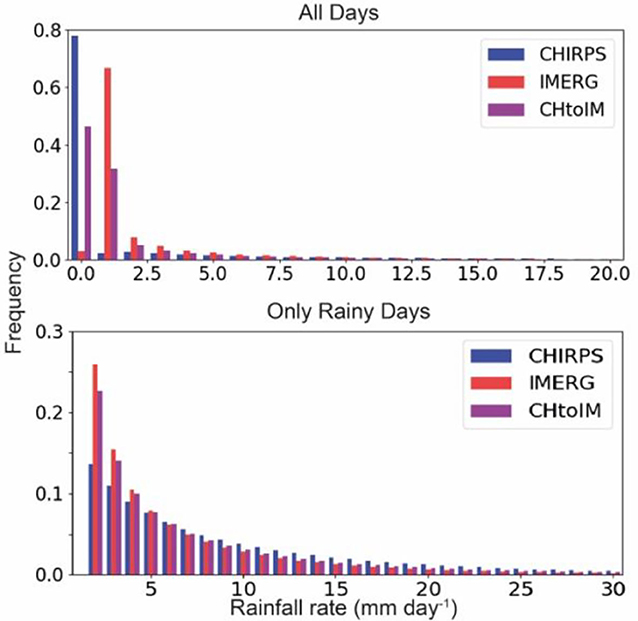
Figure 2. Frequency distribution plots of daily rainfall for the CHIRPS, IMERG, and CHtoIM precipitation products. The frequency distributions were calculated using all days from January 2016 to December 2019 (top) and using only the days that had rainfall within the same time period (bottom). Each bin in the figure represents 1 mm day−1.
We expected each of the rainfall products to have varying degrees of accuracy over CONUS due to the multitude of uncertainties that exist in satellite-derived rainfall products, some of which were discussed in the introduction section of this manuscript. However, we did not assess the relative accuracy of these products because that is outside the scope of this study.
The CHtoIM precipitation product was intended to preserve the total accumulated precipitation of CHIRPS2, but use a daily precipitation distribution that emulates the IMERG-Final daily rainfall distribution. Figure 2 shows that the CHtoIM distribution more closely resembled the IMERG-Final distribution than that of CHIRPS2-Daily. The CHtoIM frequency of dry days (0 mm day−1) was 50.6 and 39.1% for the low intensity precipitation days (>0 and <5 mm day−1). The CHtoIM distribution reduced the dry day frequency by 25% and increased the low rainfall days by 30%. As described previously, the precipitation distribution for CHtoIM does not exactly match its IMERG counterpart due to how dry days were handled in the generation of the CHtoIM product.
This study did not assess the accuracy of the CHIRPS2-Daily or IMERG-Final products for the time period of the simulated experiment. It is assumed that there are biases in both products over CONUS, some of which were discussed in the previous section. However, the goal of this experiment was to assess the impacts of daily rainfall frequencies on land-surface model processes and the accuracy of CHIRPS2-Daily and IMERG-Final did not impact the experiment methodology or results.
The general signal seen in the simulations was a reduction in surface soil moisture in ExpCHtoIM simulations (Figure 3). For the majority of the grid points in the ExpCHtoIM simulation, surface soil moisture was lower for all times of year when compared to ExpC2D. These differences did have a seasonal signal, with the largest changes occurring in the fall and winter months, while the simulated surface soil moisture tended to converge in the summer months. Analysis of the quartiles shows that the spread of differences throughout the domain also decreased in the summer months and the grid points had a larger range of differences in the wintertime. ExpCHtoIM had a wintertime reduction of soil moisture, with the soil moisture difference in 25% of the domain grid points exceeding −0.7 kg m−2.
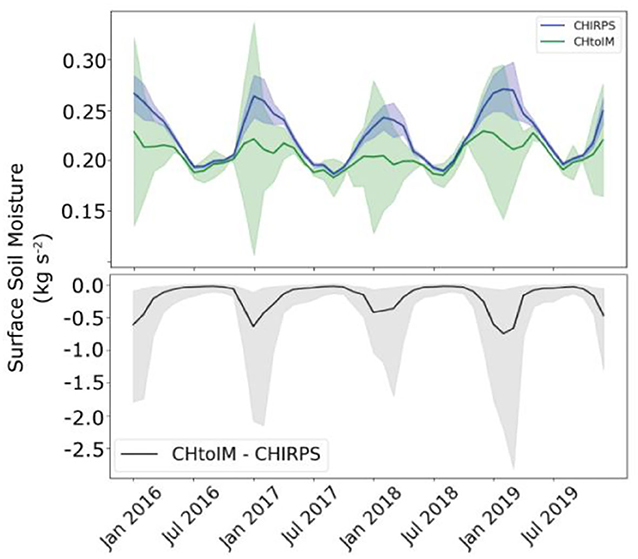
Figure 3. Domain median monthly surface soil moisture and difference between the ExpC2D and ExpCHtoIM simulations from January 2016 to December 2019. The domain grid point median is represented by the solid line and the shaded region represents the 50% of the domain grid points (from the end of the first quartile to the end of the third quartile). Units of kg s−2 are equivalent to mm assuming that the density of water in the soil is 1,000 kg m−3.
Comparison of the rootzone soil moisture results (Figure 4) shows a similar trend between the two runs. Root zone soil moisture in ExpCHtoIM grid points was lower throughout the 4 years of the study. Quartile analysis showed that the magnitude of the difference has a seasonal signal, similar to what was seen in the surface soil moisture comparison (Figure 3). The median rootzone soil moisture difference peaked at about −0.31 kg m−2 during the winter months and was <-0.04 kg m−2 at its summer minimum.
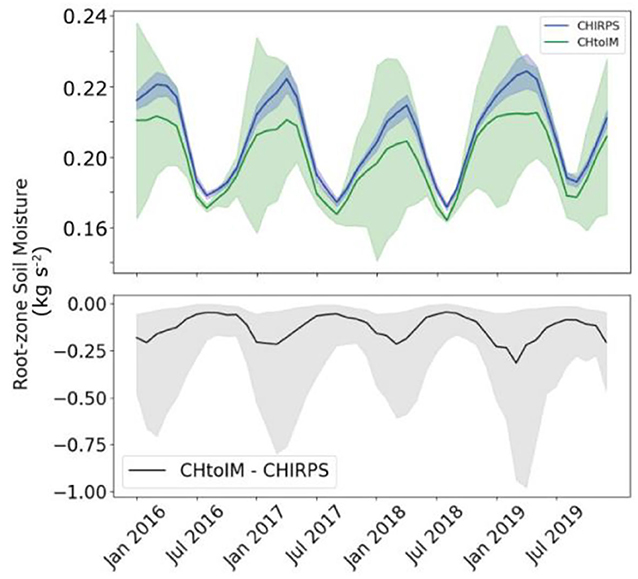
Figure 4. Domain median daily rootzone soil moisture difference between ExpC2D and ExpCHtoIM simulations from January 2016 to December 2019. Format of the figure follows that of Figure 3. Units of kg s−2 are equivalent to mm assuming that the density of water in the soil is 1,000 kg m−3.
The simulations showed that there was a noticeable spatial pattern in the soil moisture differences produced by the models (Figure 5). The largest differences in surface soil moisture were concentrated in the northeast, Midwest, and Rocky Mountain areas of the CONUS domain. A subset of monthly averages was normalized by the 4-year standard deviation of soil moisture. This allowed for a comparison of soil moisture differences that accounts for the natural variability that occurs across the domain due to spatial differences in soil type and annual rainfall. Figure 5 shows that the largest differences in soil moisture occurred in the Midwest and Rocky Mountain regions during the wintertime. This signal is driven by differences in accumulated snow that evolved in the simulations. The spatial signal was present in the summer months, but at a lower magnitude, which agreed with the domain-wide analysis (Figure 3). Though the domain-wide analysis showed a consistent decrease in the ExpCHtoIM surface soil moisture fields, soil moisture did increase in localized areas of the domain. Most of these increases in surface soil moisture were located in the southwestern and south-central (Texas). Dry day differences (discussed further in section Seasonal Differences in Precipitation Frequencies) in the pentad products were the likely cause of the increase in soil moisture in these areas.
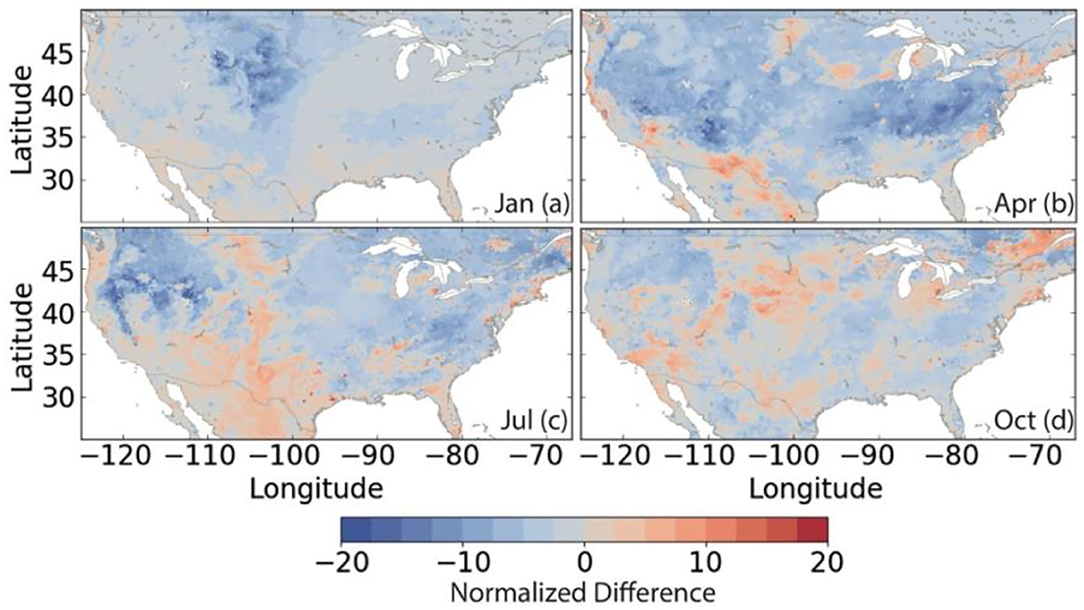
Figure 5. Normalized differences in surface soil moisture between ExpC2D and ExpCHtoIM simulations. Difference values for each grid point were normalized by the 4-year standard deviation in surface soil moisture for the respective grid point. These months represent January (a), April (b), July (c), October (d) of 2016 in the simulation. Positive values indicate increases soil moisture in the CHtoIM runs when compared to the CHIRPS runs.
Differences in the surface soil moisture and root-zone soil moisture should lead to differences in runoff amounts within the land-surface model. Thus, simulated fields of surface and subsurface runoff for the two experiments were compared. Figure 6 presents a domain-wide comparison of the surface runoff field. A seasonal signal can be seen in the runoff data where ExpCHtoIM had lower surface runoff for most of the winter months. The spring months showed an increase in surface runoff for <50% of the grid points within the domain and the summer months produced a smaller decrease to small increase in surface runoff in ExpCHtoIM.
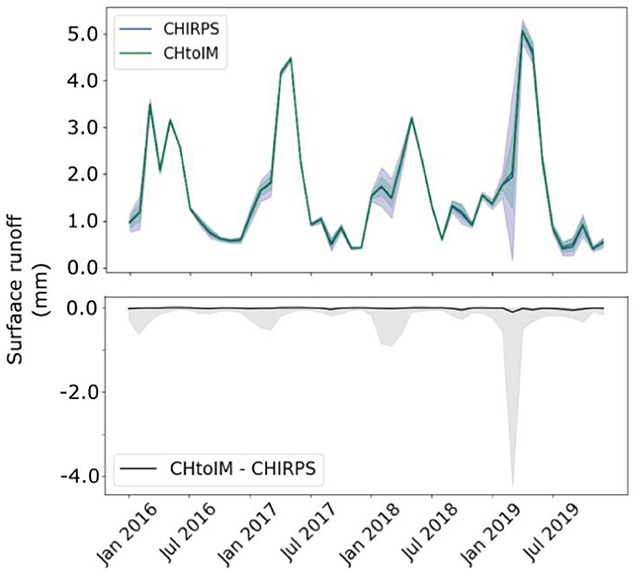
Figure 6. Domain median surface runoff (mm month−1) and difference between ExpC2D and ExpCHtoIM simulations from January 2016 to December 2019. Format of the figure follows that of Figure 3.
Comparison of subsurface runoff indicates that ExpC2D has a higher domain-wide subsurface runoff for the entire time period (Figure 7), though the magnitude of the domain median and the first to third quartiles (Figure 7) show that these differences are small compared to the surface runoff (Figure 6). The seasonal signal is present in both time series, with the subsurface runoff difference at its maximum from February to May.
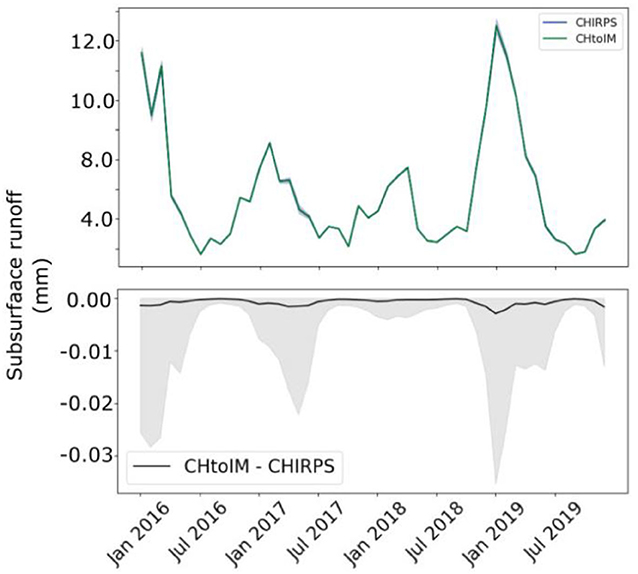
Figure 7. Domain median subsurface runoff (mm month−1) and difference ExpC2D and ExpCHtoIM simulations from January 2016 to December 2019. Format of the figure follows that of Figure 3.
The final hydrological field analyzed was ET. Figure 8 shows that ET between the two runs was fairly similar. The median ET for ExpCHtoIM was slightly lower than ExpC2D for half of the year (during the wintertime). The differences in ET were at their maximum during the winter and late summer months. Figure 9 presents monthly ET differences normalized by the 4-year standard deviation of ET. As shown on this figure, ExpCHtoIM ET was higher throughout most of the domain, in contrast to soil moisture and runoff. Areas where ExpCHtoIM ET was lower corresponded to grid points with snow on the surface.
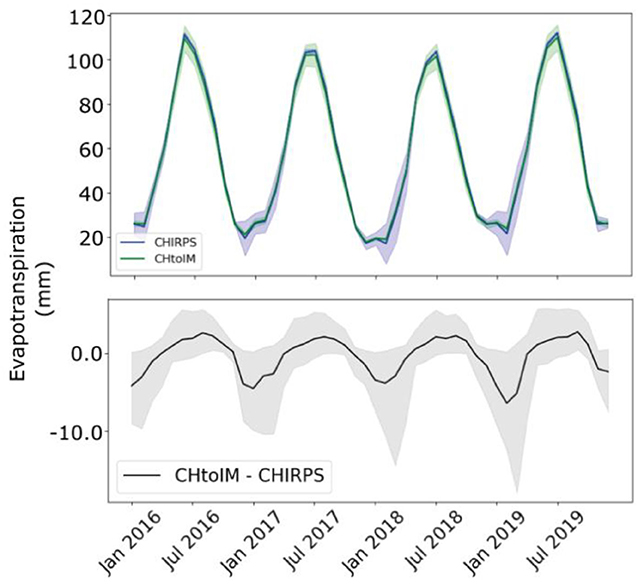
Figure 8. Domain median evapotranspiration (mm month−1) and difference between ExpC2D and ExpCHtoIM simulations from January 2016 to December 2019. Format of the figure follows that of Figure 3.
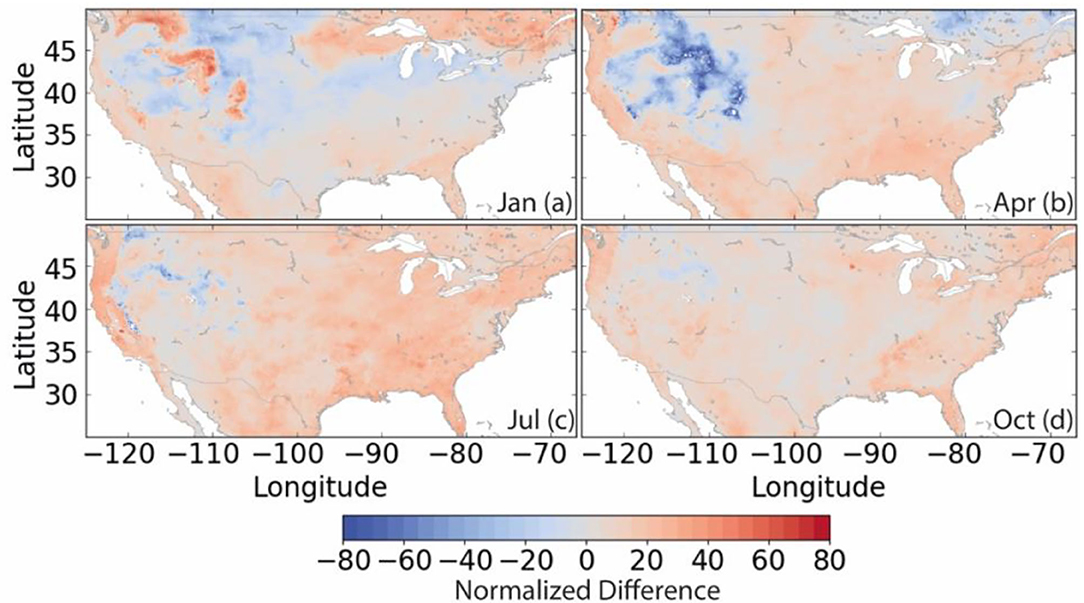
Figure 9. Normalized monthly differences in monthly evapotranspiration between ExpC2D and ExpCHtoIM simulations. Difference values for each grid point were normalized by the 4-year standard deviation in evapotranspiration for the respective grid point. Format of the figure follows that of Figure 5.
Simulated surface soil moisture comparisons to SMAP were done using monthly anomalies. A 4-year monthly surface soil moisture average was calculated by pixel for ExpC2D, ExpCHtoIM, and SMAP and subtracted from the daily surface soil moisture of the corresponding dataset to create a set of daily anomalies. The NIC (Kumar et al., 2009) was calculated to quantify how much the correlation to SMAP increased or decreased in ExpCHtoIM relative to ExpC2D. Positive NIC-values indicate that ExpCHtoIM is better correlated to SMAP than ExpC2D (i.e., RSMAP_ExpC2D < RSMAP_ExpCHtoIM) and negative NIC-values indicate worse correlation. An NIC = 1 indicates that ExpCHtoIM has a perfect correlation with SMAP and NIC = 0 indicates that the correlations did not change (i.e., RSMAP_ExpC2D = RSMAP_ExpCHtoIM). If a grid point had less than 100 daily SMAP-values during the 4-year period (roughly 90% of potential points for the 4-year monthly average), then the NIC was not calculated. Figure 10 presents the domain-wide NIC values for January, April, July, and October. Normalized Information Contribution was highest across the domain in January and April. While NIC was negative in portions of the domain NIC was positive in the majority of grid points, indicating that ExpCHtoIM is better correlated to SMAP than ExpC2D across most of the domain. The NIC-values in July and October were lower across the domain compared to January and April, but the number of pixels with negative NIC was also lower during these months.
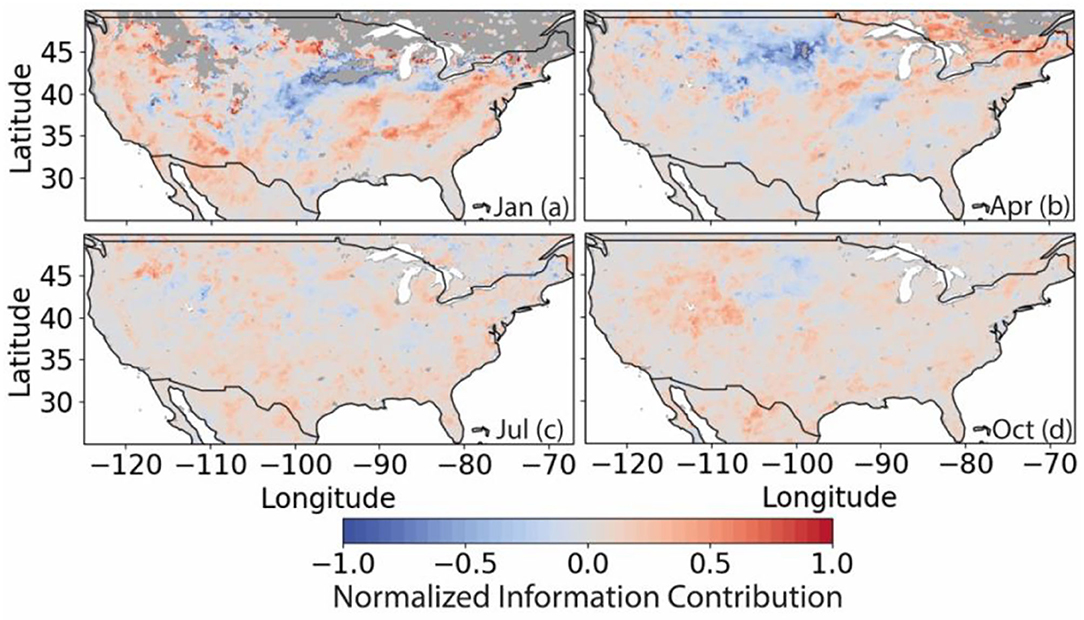
Figure 10. Normalized Information Contribution (NIC) metric for surface soil moisture between ExpC2D and ExpCHtoIM simulations. Positive values indicate increased correlation to SMAP soil moisture anomaly. These months represent January (a), April (b), July (c), October (d) NIC-values for the entire length of the simulation.
Evapotranspiration accuracy was evaluated by assessing the fractional error reduction of modeled ET relative to SSEBoP. Fractional error reduction was defined as the absolute error of ExpC2D when compared to the reference product (SSEBoP) minus the absolute error of ExpCHtoIM when compared to the same validation product. Positive fractional error reduction values signify that implementing the CHtoIM precipitation reduced the absolute error in the simulations. Since the patterns of the hydrological fields were seasonal, monthly errors were aggregated for the 4-year run and presented in Figure 11 as box-and-whisker plots. This plot shows the median (red line), average (green box), and the 20, 25, 75, and 80th percentile of the error reduction distributions.
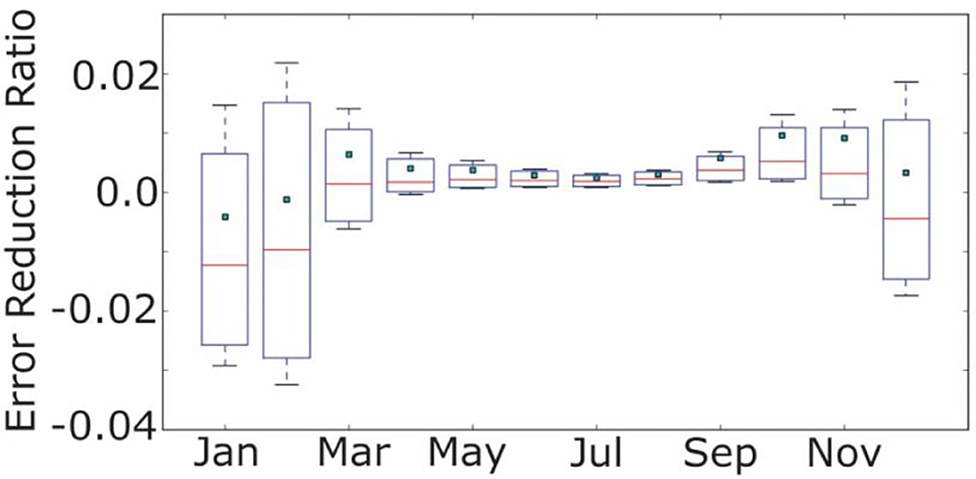
Figure 11. Box and whisker plots of the error reduction ratios of evapotranspiration for ExpCHtoIM when the SSEBop product is used as a benchmark. The distributions aggregate all grid points within the domain for all years in the simulation. Positive values indicate a reduction in absolute error in ExpCHtoIM when compared to ExpC2D. Negative values indicate increases in evapotranspiration absolute error. The mean of the distribution (square), median (red line), 25th and 75th percentiles (box boundaries), and the 80th and 20th percentiles (edge of whiskers) are all shown in the figure.
Figure 11 shows the final comparison that used the SSEBop dataset to evaluate the error reduction of modeled ET. The summer and fall months (May–October) had little change in ET error reduction while December, January, and February showed the largest increases in error reduction. The average error reduction ranged from approximately −0.5 to 0.7% and the monthly averages were generally greater than their respective medians for all months. Other than December, January, and February, all other months showed a positive error reduction in at least 50% of the grid points.
Many of the comparisons showed a strong seasonal signal in the differences between ExpC2D and ExpCHtoIM. A closer examination revealed a difference in the daily precipitation distribution frequencies that was also seasonal. The wintertime months for our simulations had only a small reduction in dry day frequencies (0 mm day−1). The CHIRPS2-Daily and CHtoIM frequencies were 74 and 64%. The summertime dry day frequencies for both precipitation datasets were 76 and 42%. This difference in dry day reduction was not likely due to a seasonal change in dry day frequencies in the IMERG-Final dataset (21% in winter, 16% in summer). The likely cause of this seasonal signal was an increase of “rain”/”no rain” pentad mismatches between the CHIRPS2-Daily and IMERG products during the wintertime months.
As the methodology previously discussed, if the CHIRPS2 pentad had no rain but the IMERG-Final pentad did, then the resulting CHtoIM pentad would not have rain. Conversely, if the CHIRPS2 pentad had rain but the IMERG-Final pentad did not, then the pentad total was redistributed evenly across the 5 days. This methodology was chosen to conserve total precipitation (Figure 1). Seasonal precipitation frequencies show evidence that this dry day mismatch between CHIRPS2 and IMERG occurs at the greatest frequency in the wintertime. The CHtoIM design methodology was simplistic and could be more rigorous, but the resulting changes in precipitation frequency distribution was still suitable to complete the objectives of this study.
The differences in precipitation distributions between the two products produced differences in the LIS modeled hydrological fields. It was expected that decreasing the number of dry days (0 mm day−1) while increasing the amount of low rainfall days (>0 and <5 mm day−1) in ExpCHtoIM would decrease the amount of surface soil moisture and surface runoff, while increasing the amount of ET. Soil moisture changes due to the distribution of daily precipitation should be the starting point for all of the changes seen in other simulated hydrological fields. By increasing the amount of low rainfall days (>0 and <5 mm day−1) and decreasing the dry days (0 mm day−1) as well as the moderate to high intensity days (>5 mm day−1), ExpCHtoIM was expected to saturate the surface soil layer less quickly, which would result in less water runoff. Throughout most of the domain, ET increased in ExpCHtoIM due to higher water availability for bare soil evaporation.
The creation of a precipitation dataset with a less skewed distribution of daily precipitation (Figure 2) did have an impact on all of the hydrological variables that were analyzed. In general, ExpCHtoIM had decreases in soil moisture and runoff while ET increased. There were spatial and seasonal signals in the hydrological outputs that were driven by the differences in the rainfall distribution. These signals varied by time of year and location within the domain. The presence of snow also impacted soil moisture, runoff, and ET. Discussion of these snow-covered areas will be included in the subsequent subsection.
Both the surface and rootzone soil moisture decreased in ExpCHtoIM (Figures 3, 4), which was expected. The more even distribution of rainfall caused, on average, a decrease in soil moisture that was primarily at the surface. The surface soil moisture had the largest decrease in soil moisture values when compared to other subsurface layers. The rootzone soil moisture values for the two simulations were more similar and had a larger overlap than the surface soil moisture values (Figure 4).
It was expected that the surface soil layer in ExpC2D would reach saturation more often and at a quicker rate since the surface soil moisture values were larger in general. Analysis of the surface runoff values in the simulations (Figure 6) showed that this was the case. The surface runoff values in ExpC2D had a tendency to be greater than the values in ExpCHtoIM. This again demonstrated that the more skewed distribution of daily rainfall did increase the frequency of surface soil saturation in the model. The subsurface runoff showed a smaller difference between the two runs although the subsurface runoff was, on average, slightly lower in ExpC2D (Figure 7). The effects of the daily precipitation distributions were mainly limited to the surface soil layer in the land-surface model and seemed to be limited by the saturation point of the surface soil type in the domain.
The ET analysis in Figure 8 showed a slightly higher domain-averaged wintertime ET in ExpC2D, however, the spatial maps (Figure 9) did show small increases of ET in ExpCHtoIM across most of the domain with an area of large ET reduction. Snow-covered regions in the simulation coincided with the areas where the reduction in ET occurred. With snow on the ground, the model dynamics between soil moisture, runoff, and ET differ from the dynamics that occur in areas without snow-cover. This trend occurs throughout the year in high-altitude regions and was most noticeable in the winter months, as expected.
The more consistent daily rainfall distribution that ExpCHtoIM allowed for more water to be available for bare soil evaporation and decreased the occurrence of saturated soils at the surface, which increased ET and decreased soil moisture and runoff when compared to ExpC2D. The only time this basic relationship between the experiments did not hold true was when either the daily rainfall distribution differences for a given tile were small or reversed (i.e., CHtoIM had a decrease in low intensity rainfall days when compared to CHIRPS2-Daily) or when the ground was snow-covered.
Snow-covered areas in ExpCHtoIM showed a decrease in soil moisture, runoff, and ET, which does not satisfy a basic water balance if precipitation was being held constant. A more in-depth analysis showed that snow accumulation between the two experiments was different and the water imbalance was due to this difference in accumulation. This was one of the reasons why the decreases in the values of the hydrological fields were largest during the winter, as seen in the domain median and first quantile values (Figures 3, 4, 6, and 8). While the snow-pack dynamics in the simulations is important, this study did not perform an in-depth analysis on these snow-covered areas other than to confirm that the water balance was correct even when the trends seen in these areas did not match what was seen in other areas of the simulation domain.
The daily anomalies of surface soil moisture over the 4-year simulation period were used to calculate the NIC metric. Both ExpC2D and ExpCHtoIM had high correlations with the surface soil moisture anomalies derived from the SMAP dataset. When the NIC was calculated (Figure 10), it was clear that the surface soil moisture reduction of ExpCHtoIM improved the anomaly correlation across most of the domain; however, there were still seasonal patterns present that mimicked the patterns seen in previous analyses. For January and April (Figures 10a,b) there were large areas of the domain that had a decrease in the ExpCHtoIM anomaly correlation when compared to ExpC2D. There were also large areas of the domain that did not have enough data points to perform a calculation. The summer months did see a more uniform improvement in the surface soil moisture anomaly correlation for ExpCHtoIM but the magnitudes of the NIC metric were less than what was calculated in the wintertime.
Error reductions in ET were calculated using the SSEBop product (Figure 11). The SSEBop data was upscaled spatially to match our domain grid spacing and domain. Comparisons showed that most areas in the domain underestimated ET when compared to the SSEBop product. These underestimates were more prevalent in the southeastern areas of the domain and highest in the late summer to fall months. Throughout the year, there were areas of overestimated ET in the two experiments, mainly located in the northern areas of the Midwest and the Rocky Mountain areas.
ExpCHtoIM produced a slight increase in ET across a majority of the domain compared to ExpC2D (Figure 9). The spread of the error reductions showed a trend of improving ET, especially in the summer months (Figure 11). Again, this improvement was not consistent across the domain because there were areas that overestimated ET in ExpC2D that resulted in an increase in error when applying the CHtoIM precipitation (ExpCHtoIM). Across all months, a majority of the grid points saw little to moderate improvement in the simulated ET errors where 80% of the grid points saw less than a 2% improvement across all months. The averages of the error reduction distributions were above the median for all months signifying that the distribution was less skewed toward the lower end of the distribution (little to no change) than the more moderate values of error reduction.
The objective of this study was to quantify the impact of precipitation distribution patterns on land-surface simulations of hydrological variables. A precipitation dataset, CHtoIM, was created by using the accumulated precipitation totals from CHIRPS2 pentads and mapped those values to the IMERG-Final daily precipitation frequencies. This allowed for a controlled comparison of land-surface simulations, where the total accumulation of precipitation was the same for every pentad but the distribution frequency changed. The creation of the CHtoIM precipitation forcing did not result in an exact match to the IMERG-Final distribution, but the CHtoIM dataset did reduce the number of dry days and increase the frequency of low rainfall days relative to CHIRPS2-Daily, more closely matching the IMERG-Final distribution. Two simulations were run for a CONUS domain from January 2016 to December 2019 that used CHIRPS2-Daily (EXPC2D) and CHtoIM (ExpCHtoIM) as the precipitation forcing.
The more skewed distribution of precipitation in CHIRPS2-Daily led to more frequent saturation of the surface soil layer. ExpC2D fairly consistently had wetter surface soil moisture values when compared to ExpCHtoIM. Even though the low rainfall intensity days (0–5 mm day−1) were reduced, the increased frequency of high rainfall intensity days (>5 mm day−1) caused the surface soil moisture in ExpC2D to be higher on average when compared to ExpCHtoIM. ExpC2D also had more moisture percolating into the soil sublayers and increased surface runoff. The increase in surface runoff reinforced the conclusion that the surface soil layer was reaching saturation more often in ExpC2D.
When the frequency of dry days and higher rainfall intensity days was reduced and the low intensity rainfall days (0–5 mm day−1) was increased, ET was increased, likely due to increases in bare soil evaporation. Evapotranspiration was the least sensitive hydrological variable to changes in rainfall frequency; however, sensitivity could potentially be increased if the land-surface model used a coupled vegetation model, since the transpiration component would be more responsive to changes in soil moisture.
Comparisons were made to SMAP surface soil moisture to see if anomaly correlation improved when the daily rainfall frequency changed. The NIC metric was used to calculate the increase or decrease in surface soil anomaly correlation when comparing ExpCHtoIM to ExpC2D. ExpCHtoIM increased anomaly correlation across most of the domain, with the largest changes in NIC occurring in the wintertime. During the summer, there was a more uniform increase in NIC across the domain; however, the magnitude of the NIC metric was smaller than what was calculated for the wintertime months. Another analysis compared the simulations to the SSEBop ET dataset using an absolute error metric. The average improvement in ET ranged from approximately 0.5–1.5% during the winter and the magnitude of the error reduction also had a seasonal signal.
The results of the study show that the change to daily rainfall frequency does have a noticeable effect of modeled hydrological fields in land-surface models. The surface soil moisture and surface runoff were the most responsive to changes in daily rainfall distribution. The monthly surface soil moisture anomaly correlation to SMAP were improved by roughly 0.25 across most of the CONUS domain. The simulated ET was the least sensitive to changes in daily rainfall distribution. Most of the domain (roughly 80%) saw less than a 2% difference in ET; however, there were certain areas that did see a more notable response. As satellite-derived precipitation products become more sophisticated and converge to similar monthly and annual rainfall accumulation values, the daily distribution of rainfall will have a notable impact on simulated land-surface model processes.
Modification of the daily precipitation frequency seems to be a viable solution to either create more initial conditions for ensemble runs or create moderate improvements in land-surface model simulations. While changes in simulated hydrological fields were confirmed by this study, these changes do not guarantee universal improvement in simulation accuracy because the total amount of precipitation over the domain will be a major factor in guaranteeing accuracy when comparing to observational products and datasets.
The raw data supporting the conclusions of this article will be made available by the authors, without undue reservation.
DS: primary author of manuscript. KS, AM, JPJ, and CP-L: contributed text and ideas for the study. CF and PP: contributed ideas for the study and help with the datasets used. All authors contributed to the article and approved the submitted version.
This study was done as part of a contract with SAIC and NASA Goddard Space Flight Center. The contractor will be reimbursed through the contract. FEWS NET's Participating Agency Program Agreement for NASA Water Availability Monitoring (AID-FFP-T-17-00001). NASA Harvest food security consortium (NASA NNH16ZDA001N-FSAC Grant No: 80NSSC17K0625). Computing resources have been provided by NASA's Center for Climate Simulation (NCCS).
DS and AM are employed by the company Science Applications International Corporation (SAIC) as government contractors. JPJ is employed by Science Systems and Applications, Inc. (SSAI) as a government contractor.
The remaining authors declare that the research was conducted in the absence of any commercial or financial relationships that could be construed as a potential conflict of interest.
All claims expressed in this article are solely those of the authors and do not necessarily represent those of their affiliated organizations, or those of the publisher, the editors and the reviewers. Any product that may be evaluated in this article, or claim that may be made by its manufacturer, is not guaranteed or endorsed by the publisher.
Arnold, D., Boffi, D., and Falk, R. (2002). Approximation by quadrilateral finite elements. Math. Comput. 71, 909–922. doi: 10.1090/S0025-5718-02-01439-4
Arsenault, K., Shukla, S., Hazra, A., Getirana, A., McNally, A., Kumar, S., et al. (2020). The NASA hydrological forecast system for food and water security applications. Bull. Amer. Meteor. Soc. 101, E1007–E1025. doi: 10.1175/BAMS-D-18-0264.1
Beck, H. E., Vergopolan, N., Pan, M., Levizzani, V., van Dijk, A. I. J. M., Weedon, G., et al. (2017). Global-scale evaluation of 23 precipitation datasets using gauge observations and hydrological modeling. Hydrol. Earth Syst. Sci. 21, 6201–6217. doi: 10.5194/hess-21-6201-2017
Bellerby, T. J., and Sun, J. (2005). Probabilistic and ensemble representations of the uncertainty in an IR/microwave satellite precipitation product. J. Hydrometeor. 6, 1032–1044. doi: 10.1175/JHM454.1
Bloom, S., da Silva, A., Dee, D., Bosilovich, M., Chern, J.-D., Pawson, S., et al. (2005). Documentation and Validation of the Goddard Earth Observing System (GEOS) Data Assimilation System - Version 4. Technical Report Series on Global Modeling and Data Assimilation. Washington, DC: National Aeronautics and Space Administration.
Bosilovich, M. G., Akella, S., Coy, L., Cullather, R., Draper, C., Gelaro, R., et al. (2015). MERRA-2: Initial Evaluation of the Climate, Technical Report Series on Global Modeling and Data Assimilation Vol 43. Greenbelt, MD: Goddard Space Flight Center.
Chen, F., Crow, W. T., Colliander, A., Cosh, M. H., Jackson, T. J., Bindlish, R., et al. (2016a). Application of triple collocation in ground-based validation of Soil Moisture Active/Passive (SMAP) level 2 data products. IEEE J. Select. Top. Appl. Earth Observ. Remote Sens. 10, 489–502. doi: 10.1109/JSTARS.2016.2569998
Chen, F., and Dudhia, J. (2001). Coupling an advanced land surface–hydrology model with the Penn State–NCAR MM5 modeling system. Part I: model implementation and sensitivity. Month. Weath. Rev. 129, 569–585. doi: 10.1175/1520-0493(2001)129<0569:CAALSH>2.0.CO;2
Chen, M., Senay, G. B., Singh, R. K., and Verdin, J. P. (2016b). Uncertainty analysis of the Operational Simplified Surface Energy Balance (SSEBop) model at multiple flux tower sites. J. Hydrol. 536, 384–399. doi: 10.1016/j.jhydrol.2016.02.026
Colliander, A., Chan, S., Das, N., Kim, S., Dunbar, S., Jackson, T., et al. (2014). SMAP L2-L4 Data Products Calibration and Validation Plan, Soil Moisture Active Passive (SMAP) Mission Science Document. JPL D-79463. Pasadena, CA: Jet Propulsion Laboratory.
Colliander, A., Jackson, T. J., Bindlish, R., Chan, S., Das, N., Kim, S. B., et al. (2017). Validation of SMAP surface soil moisture products with core validation sites. Remote Sens. Environ. 191, 215–231. doi: 10.1016/j.rse.2017.01.021
Dezfuli, A. K., Ichoku, C. M., Huffman, G. J., Mohr, K. I., Selker, J. S., van de Giesen, N., et al. (2017). Validation of IMERG precipitation in Africa. J. Hydrometeor. 18, 2817–2825. doi: 10.1175/JHM-D-17-0139.1
Dinku, T., Funk, C., Peterson, P., Maidment, R., Tadesse, T., Gadain, H., et al. (2018). Validation of the CHIRPS satellite rainfall estimates over eastern Africa. Q. J. R. Meteorol. Soc. 144, 292–312. doi: 10.1002/qj.3244
Entekhabi, D., Das, N., Njoku, E. G., Johnson, J. T., and Shi, J. (2016). SMAP L3 Radar/Radiometer Global Daily 9 km EASE-Grid Soil Moisture, Version 3. [Indicate subset used]. Boulder, CO: NASA National Snow and Ice Data Center Distributed Active Archive Center.
Entekhabi, D., Njoku, E. G., O'Neill, P. G., Kellogg, K. H., Crow, W. T., Edelstein, W. N., et al. (2010). The Soil Moisture Active Passive (SMAP) mission. Proc. IEEE 98, 704–716. doi: 10.1109/JPROC.2010.2043918
Feidas, H. (2010). Validation of satellite rainfall products over Greece. Theor. Appl. Climatol. 99, 193–216. doi: 10.1007/s00704-009-0135-8
Fekete, B. M., Vörösmarty, C. J., Roads, J. O., and Willmott, C. J. (2004). Uncertainties in precipitation and their impacts on runoff estimates. J. Climate 17, 294–304. doi: 10.1175/1520-0442(2004)017<0294:UIPATI>2.0.CO;2
Foley, T. A. (1987). Weighted bicubic spline interpolation to rapidly varying data. ACM Trans. Graph. 6, 1–18. doi: 10.1145/27625.27626
Friedl, M., Sulla-Menashe, D., Tan, B., Schneider, A., Ramankutty, N., Sibley, A., et al. (2010). MODIS collection 5 global land cover: algorithm refinements and characterization of new datasets. Remote Sens. Environ. 114, 168–182. doi: 10.1016/j.rse.2009.08.016
Funk, C., Peterson, P., Landsfeld, M., Pedreros, D., Verdin, J., Shukla, S., et al. (2015). The climate hazards infrared precipitation with stations—a new environmental record for monitoring extremes. Scient. Data 2, 1–21. doi: 10.1038/sdata.2015.66
Funk, C. C., Peterson, P., Landsfeld, M., Pedreros, D., Verdin, J., Rowland, J. D., et al. (2014). A quasi-global precipitation time series for drought monitoring. US Geol. Surv. Data Ser. 832, 1–12. doi: 10.3133/ds832
Gadelha, A. N., Coelho, V. H. R., Xavier, A. C., Barbosa, L. R., Melo, D. C., Xuan, Y., et al. (2019). Grid box-level evaluation of IMERG over Brazil at various space and time scales. Atmos. Res. 218, 231–244. doi: 10.1016/j.atmosres.2018.12.001
Gebregiorgis, A. S., Tian, Y., Peters-Lidard, C. D., and Hossain, F. (2012). Tracing hydrologic model simulation error as a function of satellite rainfall estimation bias components and land use and land cover conditions. Water Resour. Res. 48:W11509. doi: 10.1029/2011WR011643
Global Modeling and Assimilation Office (GMAO) (2015). MERRA-2. Greenbelt, MD: Goddard Earth Sciences Data and Information Services Center (GES DISC).
Huffman, G. J., Adler, R. F., Arkin, P., Chang, A., Ferraro, R., Gruber, A., et al. (1997). The Global Precipitation Climatology Project (GPCP) combined precipitation dataset. Bull. Amer. Meteor. Soc. 78, 5–20. doi: 10.1175/1520-0477(1997)078<0005:TGPCPG>2.0.CO;2
Huffman, G. J., Adler, R. F., Bolvin, D. T., and Nelkin, E. J. (2010). “The TRMM Multi-Satellite Precipitation Analysis (TMPA),” in Satellite Rainfall Applications for Surface Hydrology, eds M. Gebremichael and F. Hossain (Dordrecht: Springer), 38–55. doi: 10.1007/978-90-481-2915-7_1
Huffman, G. J., Adler, R. F., Rudolf, B., Schneider, U., and Kehn, P. R. (1995). Global precipitation estimates based on technique for combining satellite-based estimates, raingauge analyses and NWP model information. J. Climatol. 8, 1284–1295. doi: 10.1175/1520-0442(1995)008<1284:GPEBOA>2.0.CO;2
Huffman, G. J., Bolvin, D. T., Braithwaite, D., Hsu, K., Joyce, R., Xie, P., et al. (2019a). NASA Global Precipitation Measurement (GPM) Integrated Multi-Satellite Retrievals for GPM (IMERG). Algorithm Theoretical Basis Document (ATBD) Version 6, 26.
Huffman, G. J., Bolvin, D. T., Braithwaite, D., Hsu, K.-L., Joyce, R. J., Kidd, C., et al. (2020). “Integrated Multi-satellite Retrievals for the Global Precipitation Measurement (GPM) Mission (IMERG),” in Satellite Precipitation Measurement, eds V. Levizzani, C. Kidd, D. Kirschbaum, C. Kummerow, K. Nakamura, and F. Turk (Cham: Springer), 343–353. doi: 10.1007/978-3-030-24568-9_19
Huffman, G. J., Bolvin, D. T., and Nelkin, E. J. (2015). Integrated Multi-satellitE Retrievals for GPM (IMERG) Technical Documentation. NASA/GSFC Code 612, 47.
Huffman, G. J., Stocker, E. F., Bolvin, D. T., Nelkin, E. J., and Tan, J. (2019b). GPM IMERG Final Precipitation L3 Half Hourly 0.1 Degree x 0.1 Degree V06. Greenbelt, MD: Goddard Earth Sciences Data and Information Services Center (GES DISC).
Iqbal, M. F., and Athar, H. (2018). Validation of satellite based precipitation over diverse topography of Pakistan. Atmos. Res. 201, 247–260. doi: 10.1016/j.atmosres.2017.10.026
Kanamitsu, M., Ebisuzaki, W., Woolen, J., Yang, S.-K., Hnilo, J. J., Fiorino, M., et al. (2002). NCEP-DOE AMIP-II Reanalysis (R-2). Bull. Amer. Meteor. Soc. 83, 1631–1643. doi: 10.1175/BAMS-83-11-1631
Katsanos, D., Retalis, A., and Michaelides, S. (2016). Validation of a high-resolution precipitation database (CHIRPS) over Cyprus for a 30-year period. Atmos. Res. 169, 459–464. doi: 10.1016/j.atmosres.2015.05.015
Kumar, S. V., Peters-Lidard, C. D., Tian, Y., Houser, P. R., Geiger, J., Olden, S., et al. (2006). Land information system: an interoperable framework for high resolution land surface modeling. Environ. Modell. Softw. 21, 1402–1415. doi: 10.1016/j.envsoft.2005.07.004
Kumar, S. V., Reichle, R. H., Koster, R. D., Crow, W. T., and Peters-Lidard, C. D. (2009). Role of subsurface physics in the assimilation of surface soil moisture observations. J. Hydrometeorology, 10, 1534–1547.
Maggioni, V., Sapiano, M. R. P., Adler, R. F., Tian, Y., and Huffman, G. J. (2014). An error model for uncertainty quantification in high-time-resolution precipitation products. J. Hydrometeor. 15, 1274–1292. doi: 10.1175/JHM-D-13-0112.1
Maidment, R., Grimes, D., Black, E., Tarnavsky, E., Young, M., Greatrex, H., et al. (2017). A new, long-term daily satellite-based rainfall dataset for operational monitoring in Africa. Sci. Data 4:170063. doi: 10.1038/sdata.2017.82
Manz, B., Páez-Bimos, S., Horna, N., Buytaert, W., Ochoa-Tocachi, B., Lavado-Casimiro, W., et al. (2017). Comparative ground validation of IMERG and TMPA at variable spatiotemporal scales in the tropical andes. J. Hydrometeor. 18, 2469–2489. doi: 10.1175/JHM-D-16-0277.1
McNally, A., Arsenault, K., Kumar, S., Shukla, S., Peterson, P., Wang, S., et al. (2017). A land data assimilation system for sub-Saharan Africa food and water security applications. Sci. Data 4:170012. doi: 10.1038/sdata.2017.12
McNally, A., Verdin, K., Harrison, L., Getirana, A., Jacob, J., Shukla, S., et al. (2019). Acute water-scarcity monitoring for Africa. Water 11:1968. doi: 10.3390/w11101968
New, M., Hulme, M., and Jones, P. (2000). Representing twentieth century space–time climate variability: II. Development of 1901–1996 monthly grids of terrestrial surface. J. Climatol. 13, 2217–2238. doi: 10.1175/1520-0442(2000)013<2217:RTCSTC>2.0.CO;2
Paredes-Trejo, F. J., Barbosa, H. A., and Kumar, T. L. (2017). Validating CHIRPS-based satellite precipitation estimates in Northeast Brazil. J. Arid Environ. 139, 26–40. doi: 10.1016/j.jaridenv.2016.12.009
Rivera, J. A., Marianetti, G., and Hinrichs, S. (2018). Validation of CHIRPS precipitation dataset along the Central Andes of Argentina. Atmos. Res. 213, 437–449. doi: 10.1016/j.atmosres.2018.06.023
Rudolf, B., Rueth, W., and Schneider, U. (1994). “Terrestrial precipitation analysis: operational method and required density of point measurements,” in Global Precipitation and Climate Change, eds M. Desbois and F. Desahmond (Berlin; Heidelberg: Springler-Verlag), 173–186. doi: 10.1007/978-3-642-79268-7_10
Senay, G. B., Bohms, S., Singh, R. K., Gowda, P. H., Velpuri, N. M., Alemu, H., et al. (2013). Operational evapotranspiration mapping using remote sensing and weather datasets: a new parameterization for the SSEB approach. J. Am. Water Resour. Assoc. 49, 577–591. doi: 10.1111/jawr.12057
Senay, G. B., Gowda, P. H., Bohms, S., Howell, T. A., Friedrichs, M., Marek, T. H., et al. (2014). Evaluating the SSEBop approach for evapotranspiration mapping with landsat data using lysimetric observations in the semi-arid Texas high plains. Hydrol. Earth Syst. Sci. Discuss. 11, 723–756. doi: 10.5194/hessd-11-723-2014
Senay, G. B., Kagone, S., and Velpuri, N. M. (2020). Operational global actual evapotranspiration: development, evaluation and dissemination. Sensors 20:1915. doi: 10.3390/s20071915
Shellito, P. J., Small, E. E., Colliander, A., Bindlish, R., Cosh, M. H., Berg, A. A., et al. (2016). SMAP soil moisture drying more rapid than observed in situ following rainfall events. Geophys. Res. Lett. 43, 8068–8075. doi: 10.1002/2016GL069946
Shellito, P. J., Small, E. E., and Livneh, B. (2018). Controls on surface soil drying rates observed by SMAP and simulated by the Noah land surface model. Hydrol. Earth Syst. Sci. Discuss. 22, 1649–1663. doi: 10.5194/hess-22-1649-2018
Shukla, S., McNally, A., Husak, G., and Funk, C. (2014). A seasonal agricultural drought forecast system for food-insecure regions of East Africa. Hydrol. Earth Syst. Sci. Discuss. 18, 3907–3921. doi: 10.5194/hess-18-3907-2014
Tan, J. W, Petersen, A., and Tokay, A. (2016). A novel approach to identify sources of errors in IMERG for GPM ground validation. J. Hydrometeor. 17, 2477–2491. doi: 10.1175/JHM-D-16-0079.1
Tapiador, F. J., Navarro, A., García-Ortega, E., Merino, A., Sánchez, J. L., Marcos, C., et al. (2020). The contribution of rain gauges in the calibration of the IMERG product: results from the first validation over Spain. J. Hydrometeor. 21, 161–182. doi: 10.1175/JHM-D-19-0116.1
Tian, Y., Peters-Lidard, C. D., Choudhury, B. J., and Garcia, M. (2007). Multitemporal analysis of TRMM-based satellite precipitation products for land data assimilation applications. J. Hydrometeorol. 8, 1165–1183. doi: 10.1175/2007JHM859.1
Watters, D., Battaglia, A., Mroz, K., and Tridon, F. (2018). Validation of the GPM version-5 surface rainfall products over Great Britain and Ireland. J. Hydrometeor. 19, 1617–1636. doi: 10.1175/JHM-D-18-0051.1
Keywords: land-surface model, hydrology, precipitation, LIS, soil moisture
Citation: Sarmiento DP, Slinski K, McNally A, Jacob JP, Funk C, Peterson P and Peters-Lidard CD (2021) Daily Precipitation Frequency Distributions Impacts on Land-Surface Simulations of CONUS. Front. Water 3:640736. doi: 10.3389/frwa.2021.640736
Received: 12 December 2020; Accepted: 13 July 2021;
Published: 27 August 2021.
Edited by:
Juan Antonio Rivera, CONICET Argentine Institute of Nivology, Glaciology and Environmental Sciences (IANIGLA), ArgentinaReviewed by:
Quoc Bao Pham, National Cheng Kung University, TaiwanCopyright © 2021 Sarmiento, Slinski, McNally, Jacob, Funk, Peterson and Peters-Lidard. This is an open-access article distributed under the terms of the Creative Commons Attribution License (CC BY). The use, distribution or reproduction in other forums is permitted, provided the original author(s) and the copyright owner(s) are credited and that the original publication in this journal is cited, in accordance with accepted academic practice. No use, distribution or reproduction is permitted which does not comply with these terms.
*Correspondence: Daniel P. Sarmiento, ZGFuaWVsLnAuc2FybWllbnRvQG5hc2EuZ292
Disclaimer: All claims expressed in this article are solely those of the authors and do not necessarily represent those of their affiliated organizations, or those of the publisher, the editors and the reviewers. Any product that may be evaluated in this article or claim that may be made by its manufacturer is not guaranteed or endorsed by the publisher.
Research integrity at Frontiers
Learn more about the work of our research integrity team to safeguard the quality of each article we publish.