- 1School of Environmental, Civil, Agricultural, and Mechanical Engineering, University of Georgia, Athens, GA, United States
- 2Arcadis International, Roseville, CA, United States
- 3College of Computing, Engineering, and Construction, University of North Florida, Jacksonville, FL, United States
- 4Arcadis International, Wexford, PA, United States
- 5The Water Institute of the Gulf, Baton Rouge, LA, United States
- 6Department of Civil and Environmental Engineering, Louisiana State University, Baton Rouge, LA, United States
- 7Center for Coastal Resiliency, Louisiana State University, Baton Rouge, LA, United States
Traditional coastal flood hazard studies do not typically account for rainfall-runoff processes in quantifying flood hazard and related cascading risks. This study addresses the potential impacts of antecedent rainfall-runoff, tropical cyclone (TC)-driven rainfall, and TC-driven surge on total water levels and its influence in delineating a coastal flood transition zone for two distinct coastal basins in southeastern Louisiana (Barataria and Lake Maurepas watersheds). Rainfall-runoff from antecedent and TC-driven rainfall along with storm surge was simulated using a new rain-on-mesh module incorporated into the ADCIRC code. Antecedent rainfall conditions were obtained for 21 landfalling TC events spanning 1948–2008 via rain stations. A parametric, TC-driven, rainfall model was used for precipitation associated with the TC. Twelve synthetic storms of varying meteorological intensity (low, medium, and high) and total rainfall were utilized for each watershed and provided model forcing for coastal inundation simulations. First, it was found that antecedent rainfall (pre-TC landfall) is influential up to 3 days pre-landfall. Second, results show that antecedent and TC-driven rainfall increase simulated peak water levels within each basin, with antecedent rainfall dominating inundation across the basin's upper portions. Third, the delineated flood zones of coastal, transition, and hydrologic show stark differences between the two basins.
Introduction
The great Louisiana flood of 2016 resulted in immediate and lingering flooding impacts that exemplify a need to understand better the interplay between hydrologic, tide, and surge processes. More than a week after the extreme rainfall event, the overland and riverine flows resulted in unsuspected complications. Flooding at or near a confluence of two rivers produced dangerous backwater flooding that led to inundation in dense urban regions. Areas in the lower portions of the watershed are also vulnerable to hurricane storm surges, which warrants consideration of the contribution from both overland and coastal flows to flood hazards and ultimately flood risk (Leonard et al., 2014; Wahl et al., 2015; Wu et al., 2018).
Historically, similar events have occurred, resulting in complex interactions between rainfall- and coastal-induced flooding: Hurricane Rita followed Katrina <4 weeks later. The devastation of Hurricane Ike was exacerbated by having Gustav hit Louisiana 12 days sooner. Hurricane Harvey (2017) caused record rainfalls (1,539 mm) in Texas along with 3 m coastal storm surge (Blake and Zelinksy, 2018; Valle-Levinson et al., 2020). Similarly, Hurricane Florence (2018) caused 3 m surges along the North Carolina coast, with over 900 mm of rainfall (Erdman, 2018; Gori et al., 2020). Just a few weeks before the time of this writing (August 2020), Hurricanes Marco and Laura were forecast to make landfall across the Louisiana coast hours apart. Hurricane Sally (September 2020) is currently causing widespread flooding due to storm surge and prolonged rainfall along the Alabama and Florida panhandle. To better prepare for such outcomes, hurricane storm surge models must incorporate a representation of overland flooding from rainfall-runoff (including antecedent conditions) and tropical cyclone (TC) induced storm tides. Especially under uncertain future climates (Silva-Araya et al., 2018; Zscheischler et al., 2018; Paerl et al., 2019; Santiago-Collazo et al., 2019).
A shortcoming of most coastal flood studies (both return period and risk analyses) assumes that coastal and fluvial floods are mutually exclusive events (Zscheischler et al., 2018; Santiago-Collazo et al., 2019). Damage caused by recent TC and unnamed storm events (e.g., 2016 Baton Rouge flood) that resulted in compound floods has pushed the research community to develop improved representations of combined hydrologic and surge processes into the quantification of flood hazards and risk. Furthermore, science-based information on flood hazards and risk are needed for policy-makers and emergency managers (White et al., 2010; Thaler and Levin-Keitel, 2016; Stephens et al., 2017; DeLorme et al., 2020). Early efforts to solve this problem have included simplistic model integration of hydrologic and coastal ocean models using linking and one-way coupling approaches. However, there is a need to refine and develop holistic modeling frameworks to simulate the compound effects of rainfall-runoff and storm surge flooding. Tightly-coupled approaches that account for the complex and nonlinear interactions across the coastal land margin are ideal (Bilskie and Hagen, 2018; Santiago-Collazo et al., 2019; Shen et al., 2019).
There is a new recognition that flood risk at the coastal land margin is influenced by hydrologic and tidal/surge processes, especially in deltaic floodplains. This realization has led to the awareness that there exists a transitional flood hazard zone (i.e., flood transition zone) flanked by regions dominated by hydrologic- and surge-only flooding mechanisms as defined by Bilskie and Hagen (2018) and later examined by Shen et al. (2019). The location and spatial extent of the flood transition zone are event-dependent and a function of individual forcings (e.g., rainfall and tropical cyclone characteristics) and regional landscape characteristics (Bilskie and Hagen, 2018). Evaluating the coupled hydrologic and surge influence on coastal flood hazards will define coastal flood hazard transition zones that span from hydrologic to coastal surge dominance. We aim to address the fundamental issues of compound flooding and the delineation of coastal flood zones by defining regions where both rainfall that produces antecedent (i.e., with respect to the storm surge) runoff and rainfall within the TC-driven storm surge overlap via the development of a coupled hydrologic and hydrodynamic model to enable more comprehensive enhanced flood zone assessments.
Here, we present a novel approach for defining the coastal flood transition zone using a series of synthetic TC events. The computational model simulates water levels and currents driven by antecedent rainfall, TC-driven rainfall, and hurricane storm surge, all within the ADCIRC model framework. Water levels resulting from rainfall-runoff was simulated using a new rain-on-mesh module within ADCIRC. Rainfall accumulation for antecedent conditions was obtained from observed rainfall from historic hurricane events, and a parametric rainfall model was used for TC-driven precipitation. We focus our modeling efforts and flood zone delineation for two distinct coastal basins in southeastern Louisiana—the Barataria and Lake Maurepas watersheds.
Materials and Methods
Study Area
We focus on two distinct hydrologic basins located in southeastern Louisiana, the Lake Maurepas and Barataria watersheds (Figure 1). These basins are hydrologically separated by the Mississippi River and its extensive levee system and have the following distinguishing characteristics.
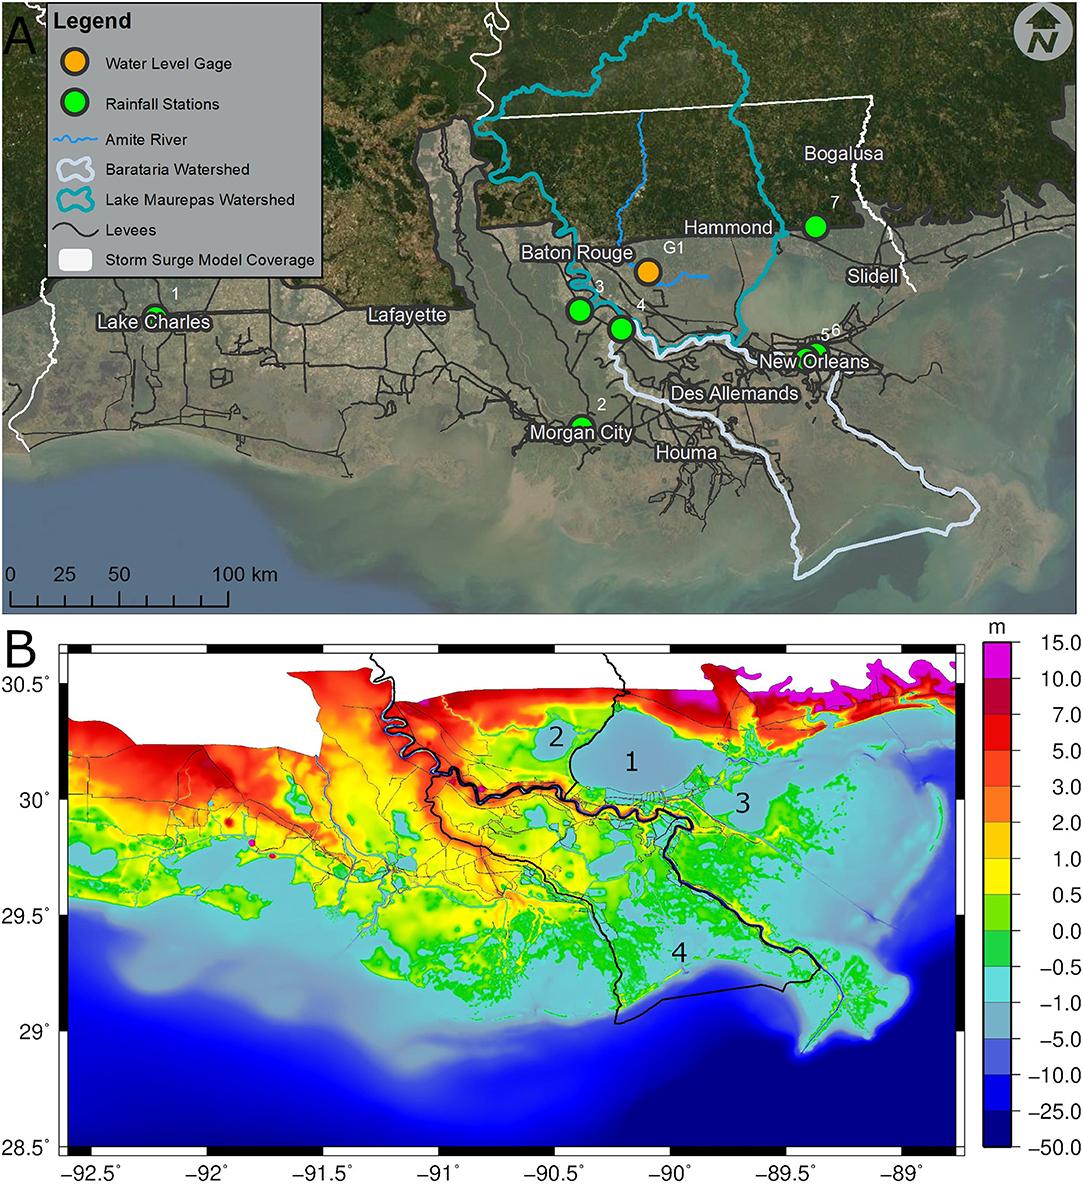
Figure 1. (A) Overall region of study in southeastern Louisiana. The ADCIRC storm surge model boundary is shown as a transparent background that extends across the coastal floodplain in naturally dry regions. Barataria and Lake Maurepas Watersheds are enveloped by bold off-white and aqua lines. USGS gage 07380120 is shown in orange (G1). Rainfall stations are labeled as follows: (1) Lake Charles, (2) Morgan City, (3) Baton Rouge, (4) Donaldsonville, (5) New Orleans Audubon Park, (6) New Orleans International Airport, and (6) Abita Springs. Thin white lines delineate the state boundaries. Service Layer Credits: Source: Esri, Maxar, GeoEye, Earthstart Geographics, CNES/Airbus DS, USDA, USGS, AeroGRID, IGN, and the GIS User Community. (B) Topographic and bathymetric elevations (m, NAVD88) of the ADCIRC unstructured mesh of coastal Louisiana. The Lake Maurepas and Barataria watersheds are outlined in black. Label (1) is Lake Pontchartrain, (2) is Lake Maurepas, (3) is Lake Borgne, and (4) is Barataria Bay.
Barataria Watershed
The Barataria watershed (Hydrologic Unit Code - HUC6 080903) experiences flood hazards dominated by coastal surges (including tropical and winter storms) and intense rainfall. The 7,000 km2 watershed is roughly funnel-shaped and extends from Donaldsonville to the Gulf of Mexico, about 110 km long and 50 km wide (Figure 1A). The watershed has been closed off from river flows since the 1930–40's with the Mississippi River's leveeing and the closure of Bayou Lafourche-Mississippi River connection in 1902. Minimal sedimentation is present in the watershed. With a combination of subsidence and shoreline erosion, the series of bays, lakes, and bayous have enlarged, forming a network of hydraulically connected water bodies within the basin (Morgan, 1967; Conner and Day, 1987). Bathymetric depths within the basin are between 2 and 3 m NAVD88 and topographic elevations for most of the watershed are <2 m NAVD88, and most of the area is <1 m NAVD88 (Figure 1B). The landscape consists of emergent estuarine wetland to the south, a palustrine emergent wetland in the central, and palustrine forested wetland in the upper portions of the basin outlines by developed and cultivated land with the outer levee system.
Lake Maurepas Watershed
The Lake Maurepas watershed (HUC6 080702) presents alternative characteristics to Barataria (Figure 1A). Hydrologic processes dominate the majority of the Lake Maurepas watershed flood hazard zone. It likely has never been exposed to surge flooding except for the area surrounding Lake Maurepas. The basin is the principal drainage system of Baton Rouge through the Comite and Amite Rivers into Lake Maurepas and then Lake Pontchartrain. The watershed area is 12,445 km2 with elevations ranging from over 100 m NAVD88 in southwestern Mississippi to under 1 m in the wetlands around Lake Maurepas (Figure 1B). The landscape is made up of Estuarine and Palustrine Emergent Wetlands near the outlet and Palustrine Forested Wetlands adjacent to Lake Maurepas and the Amite River. The majority of the watershed's middle and upper portions are collections of grasslands, forests, and developed regions. Herein, when referencing the Lake Maurepas watershed, we focus on the portion south of Interstate 10, the shaded region south of Baton Rouge and Hammond, shown in Figure 1A. This southern portion of the watershed area is 3,364 km2 (27% of the total watershed area).
Hydrodynamic Model Setup
ADCIRC
Computations are performed using ADCIRC (ADvanced CIRCulation), which is a set of computer codes that solves the nonlinear form of the depth-integrated shallow water equations (specifically the generalized wave community equation) for water surface elevation and currents across an unstructured finite element mesh (Kinnmark, 1985; Kolar et al., 1994; Luettich and Westerink, 2004; Westerink et al., 2008). In this work, the implicit solver was employed with a 1-s time-step (Courant-limited). Wetting and drying are activated (threshold of 5 cm), baroclinic and advection terms are neglected, and a spatially-constant horizontal eddy viscosity for the momentum equations was set to 50 m2/s. Surface roughness parameters are based on the Coastal Change Analysis Program (C-CAP), including Manning's n coefficient for bottom roughness and vegetation canopy (Dietrich et al., 2011; Cobell et al., 2013). Vegetation canopy reduces marine-based wind speed over land based on upwind conditions (Atkinson et al., 2011). Wind drag across the water surface employed the storm sector-based Powell formulation with a wind drag of 0.002 (Powell, 2006; Black et al., 2007; Dietrich et al., 2011).
Coastal Louisiana Unstructured Mesh
The unstructured mesh used in this study originates from the 2017 Louisiana Coastal Master Plan ADCIRC model mesh (Roberts and Cobell, 2017), but with updates bringing the model to represent present-day (Figure 1B). The mesh contains 1,454,454 vertices and 2,831,106 elements. The mesh spans the western north Atlantic Ocean (westward from 60° longitude), the Caribbean Sea, and the Gulf of Mexico with high resolution across coastal Louisiana. Mesh resolution in the Gulf of Mexico ranges from 14 km in the central portion of the basin to 2 km along the continental shelf and variable resolution of 15–500 m across the Louisiana coastal floodplain. The Amite River from Lake Maurepas to Interstate-10 (which is the northern mesh boundary) was inserted into the mesh with a local resolution of ~40 m and depths of 4 m NAVD88. This mesh has undergone extensive validation for astronomic tides, wind-waves, and hurricane storm surge [see Roberts and Cobell (2017) for validation results]. This model is currently deployed for real-time surge forecasts to support the state of Louisiana.
Bathymetric and topographic elevations of the mesh were obtained via the USGS topographic elevation model of the northern Gulf of Mexico (US Geological Survey, 2020), United States Army Corps of Engineers (USACE) channel surveys, levee surveys, and recent bathymetric surveys provided by the state of Louisiana. This mesh (and its precursors) has been validated for astronomic tides, and numerous hurricanes, including Katrina and Rita (2005), Ike and Gustav (2008), and Isaac (2012) (Bunya et al., 2010; Dietrich et al., 2011, 2012; Cobell et al., 2013; Roberts and Cobell, 2017) and has been used for projects such as the Louisiana Coastal Master Plan, FEMA flood insurance studies, levee recertification, and real-time storm surge forecasting (Dietrich et al., 2013).
Antecedent Rainfall
A general investigation into the probability of antecedent rainfall amounts before hurricane landfalls examined available precipitation data sources along the Louisiana coast. Since a reliable record of hurricane landfalls exists well into the 1800's, the limiting factor was any limitation in the available precipitation data. In developing a plan to optimize the information content in rain-field probabilities in advance of hurricane landfall, two factors were considered: spatial resolution and length of record. An initial effort examined the application of HRAP (Hydrological Rainfall Analysis Projection) data, with grid cells that cover an area on a polar stereographic grid. The Limited Fine-Mesh grid version for data available from 2002 to 2019 at the time of this project was conducted utilized a mapping routine to convert to grid cells that were ~4-km by 4-km. Unfortunately, the 2002 data could not be retrieved in a usable form, and only post-2003 data was available for this study. Thus, this data contained an insufficient range of hurricane parameters needed to establish a reliable representation of long-term rainfall probabilities occurring before landfall despite the high spatial resolution.
Since additional samples were required, the only choice available was to use rainfall from meteorological station data available from the National Climatic Data Center (NCDC). Due to size limits in downloads, this data was downloaded over a period of about a month. Much of the data in volunteer stations were missing during some hurricane events but were available for others. Therefore, all of the obtained data was filtered to selected rainfall records within the 10-days before landfall. The stations used in the final analysis are shown in Figure 1A. All stations used reported hourly rainfall except for the Abita Springs location, which reports daily rainfall totals. Abita Springs was included due to its proximity to the study area and its relatively complete record. Days 1–3 before the day of landfall were included for this daily data. Storms with central pressures higher than 990 mb were excluded since these would be primarily rain events inland, leaving a total of 21 storms during the period from 1948 to 2019 as the storms considered in this analysis. In chronological order, these are as follows: 1948, Barbara (1953), Bertha (1957), Ethel (1960), Camille (1969), Danny (1985), Elena (1985), Juan (1985), Bonnie (1986), Florence (1988), Chantal (1989), Andrew (1992), Danny (1997), Isadore (2002), Lili (2002), Bill (2003), Matthew (2004), Cindy (2005), Edouard (2008), Gustav (2008), and Ike (2008). The final antecedent rainfall pattern contains the mean total rainfall (at available rainfall gage stations—see Figure 1A) from each of the 21 hurricane events. The result is a 0.5 × 1.0 deg grid that spans the coastal region. Additionally, the rainfall grid is adjusted laterally to account for a given storm's landfall location.
Parametric Tropical Cyclone Rainfall Model
Rainfall intensities associated with tropical cyclones (TC) were taken from Lonfat et al. (2004) and the US Army Corps of Engineers (2006) Interagency Performance Evaluation Task Force (IPET) study for southeast Louisiana. Rainfall intensity associated with tropical cyclones (TC) varies as a function of distance from the TC center (r) and azimuth relative to the TC forward motion (β). The mean rainfall intensity field (mI), as a function of r and β, spatially varies with the central pressure deficit (ΔP), radius to maximum winds (Rmax), and vertical wind shear (S). Spatially-varying rainfall intensity for a TC is given by:
Where rainfall intensity is in mm/hr and the central pressure deficit is in mb. Since rainfall intensity varies with azimuth about the TC center, an asymmetric factor of 1.5 is applied to the rainfall intensity on the TC track's right-hand side. Figure 4D shows an example of the total rainfall accumulation for synthetic storm 145.
Rain-On-Mesh
A rain-on-mesh module was developed and applied to the ADCIRC source code. During run time, rain is applied to individual mesh nodes and elements and is based on the current wet/dry status. Wet nodes receive rainfall by totaling the incremental rainfall for the current time-step to the water surface elevation:
Where η is the water surface elevation at node i and R is the rainfall at time t. The rainfall applied for the current time-step, R, is rainfall intensity multiplied by the model time-step. This rainfall is marked as accounted rainfall as it directly translates into a change in surface water elevation.
Rainfall is also applied at dry nodes under specific constraints to avoid wetting elements with small inundation depths. If the total rainfall accumulation is less than a specified threshold for a mesh node, then the node remains dry. This rainfall is considered unaccounted rainfall as it does not directly translate to surface water elevations during the current time step. Once the total rainfall is equal to or exceeds the specified threshold, the node is ready to change to a wet state. When the total rainfall for all three nodes for a given element exceeds the minimum rainfall accumulation threshold, then the element and its nodes are marked as wet. The nodes and elements are then activated and participate in the computations, and rainfall is received discussed with Equation (2), and the rainfall is marked as accounted rainfall. Herein, the rainfall accumulation threshold to wet (activate) dry (currently inactive) nodes was set to 50 mm. A rainfall accumulation threshold of 100 mm was tested. However, 100 mm was too large of a threshold to determine when rainfall-runoff was allowed to begin. Once the node is activated, mesh nodes are set to an initial water depth of 0.10 m above the land surface. A value of 0.10 m is a depth of similar magnitude to typical values used for a minimum wetting depth threshold in coastal surge models that employ wetting and drying (Dietrich et al., 2006; Medeiros and Hagen, 2012). This value was selected to allow for sufficient wetting to occur while limiting numerical artifacts due to wetting/drying. Rainfall was not applied to areas enclosed by a levee system below mean sea level as there is no natural outlet for water to flow. In coastal Louisiana, rainfall is routed to outfall canals via complex pump systems.
Rainfall intensity can be applied to a simulation in three ways. The first is via a gridded rainfall intensity field (refer to Section antecedent rainfall). The second is rainfall intensity associated with a TC that is internally computed within ADCIRC (refer to Section parametric tropical cyclone rainfall model). The third method involves joining the gridded rain with TC-driven rain. Application of rainfall into the model was accomplished by considering the maximum rainfall intensity value at each point in the model domain at each time-step between the gridded and TC-driven rain:
Where ri, t is the rainfall intensity at node i and time t, rG is the rainfall intensity from the gridded data, and rTC is the rainfall associated with the TC. In this work, the antecedent condition is applied using a gridded rainfall intensity field.
Synthetic Storm Selection and Simulations Set
The magnitude of the surge generated by a TC is an essential factor in determining coastal flooding's contribution to total combined flood levels. For scenarios where storm surge is large relative to antecedent and rainfall magnitudes, the area of combined flooding dominated by coastal dynamics will increase, and the transition zone will extend further. For scenarios where storm surge is small relative to the contribution of antecedent conditions and rainfall, combined flood levels are less influenced by coastal processes, and the transition zone will extend further toward the coast. For this study, surge magnitude is represented by the return period (i.e., annual exceedance probability) of flooding generated by a TC in the areas of interest.
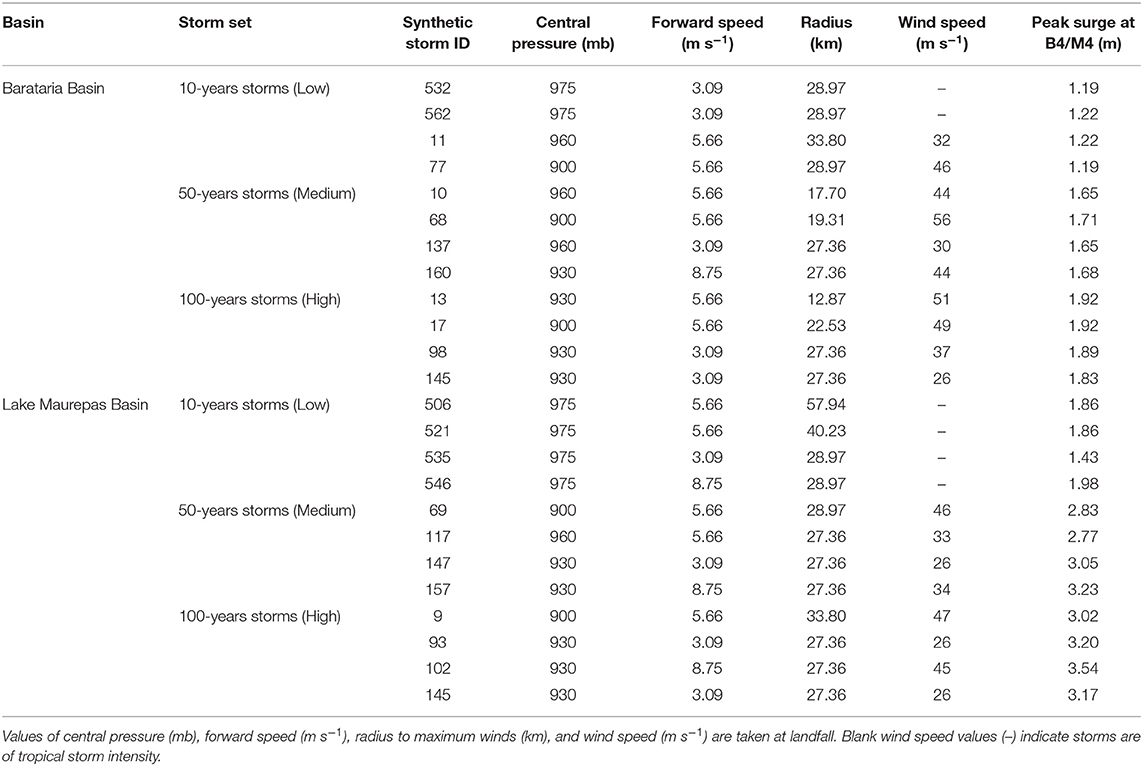
To investigate how flooding dynamics are influenced by the combination of coastal storm surge and rainfall-runoff, a small set of synthetic TC (also called synthetic storms) were selected from the total FEMA storm suite (FEMA USACE, 2008). Two separate storms sets were established: one for the Barataria basin and one for the Lake Maurepas watershed. Synthetic storms were selected based upon the peak water level generated at locations within the study watershed areas. Published FEMA flood elevations for the 10-, 50-, and 100-years return periods were defined as target flood elevations within each basin (see Table 1). For each return period, storms were selected from the FEMA synthetic storm suite that most closely generated the target flood elevation at the sampling points. Storm characteristics were also considered to reduce the number of storms to a set of four storms for each return period. From the subset of storms that matched the target surge elevations, storms were prioritized that made landfall with proximity to the area of interest to attain impactful rainfall intensity. Storms that track and make landfall far from the area of interest generate rainfall with little to no flooding impacts. Efforts were also made to include a range of track headings, forward speeds, and radius of maximum wind within the final storm suite.
The target flood elevations are based on the return still water levels at sampling locations within each basin (Figure 2). For the Lake Maurepas basin, six points were laid out to characterize the flood elevations, where the points to the west experience higher flood elevations. For the upper portion of the Barataria basin, four points were laid out to characterize the flood elevations. It is noted that point B1 lies in an area sheltered by levees, thus not influencing the selection of representative TCs. The target stillwater elevations are summarized in Table 1.
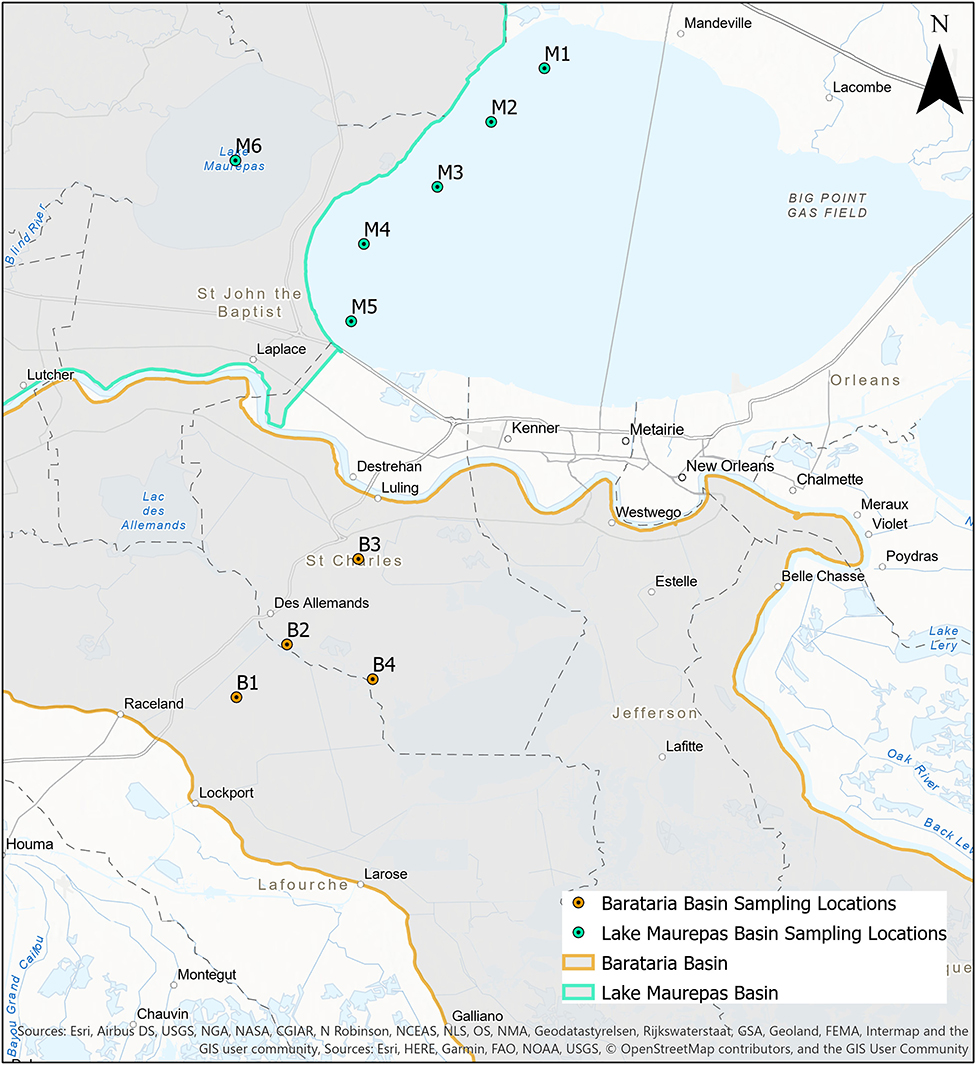
Figure 2. Sampling locations for the synthetic storm selection in the Barataria watershed (B, orange circles) and Lake Maurepas (M, green circle) watersheds.
A preliminary set of 7–10 storms was selected that generate peak water levels similar to a set of target return period flood elevations. Of the initial set of 7–10 tropical cyclones, four were selected according to the following procedure:
1. Sort the candidate storms in ascending order of the differences between the peak storm surge of an individual storm and the target flood elevation.
2. Eliminate the storms that are far away from the area of interest, e.g., twice the radius of maximum wind away.
3. Prioritize the storm with different parameters, such as forward speed, headings, and radius of maximum wind.
After screening, four storms were selected for each basin's return period, as shown in Figure 3 described in Table 2. These storms are used in the model simulations to represent the TC-driven coastal flooding scenarios.
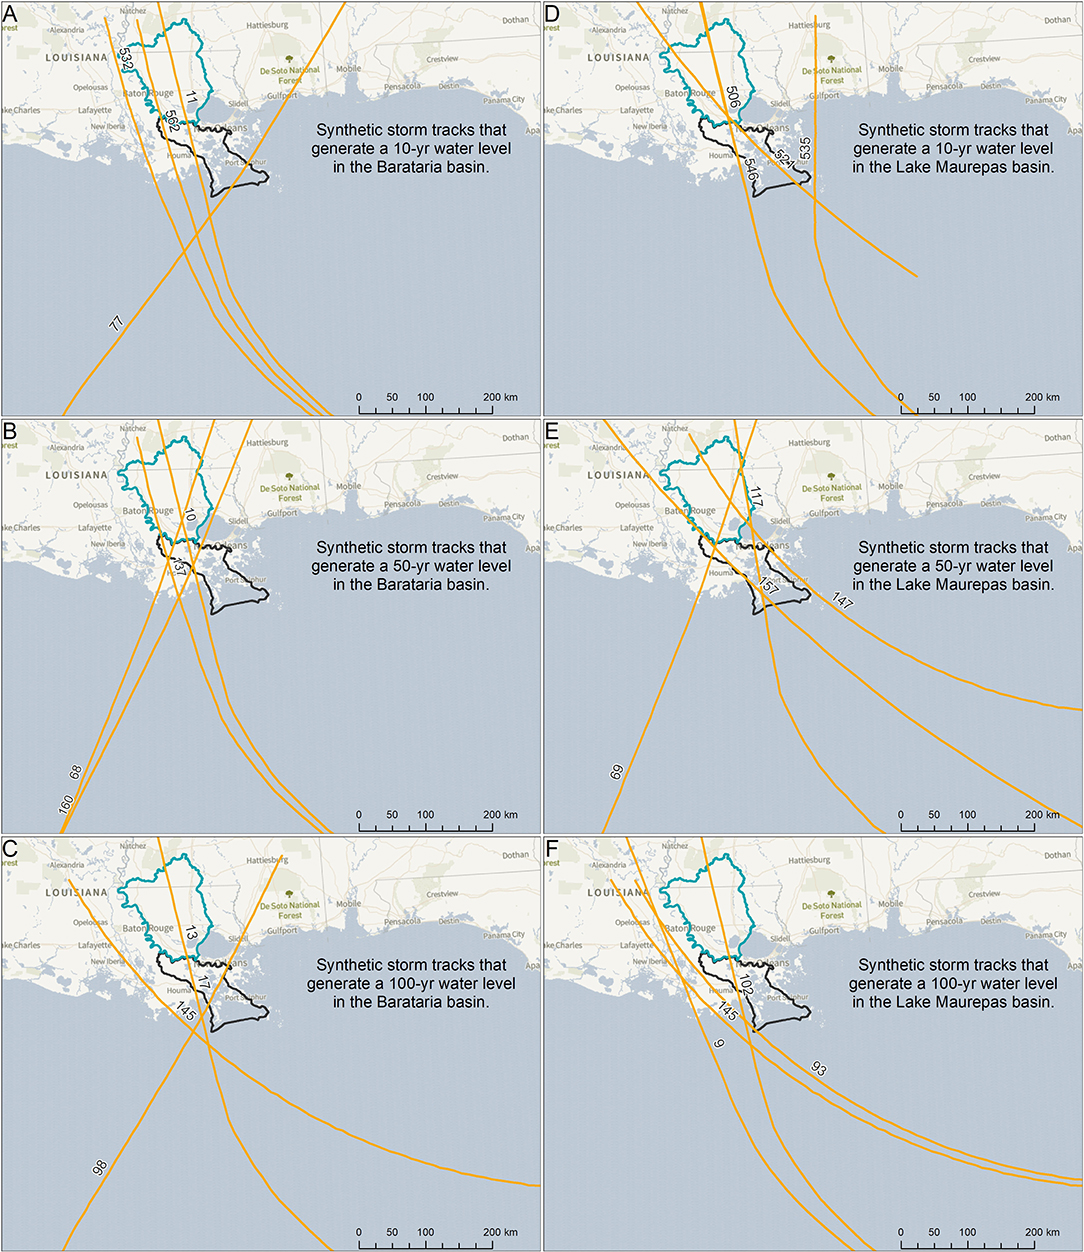
Figure 3. Synthetic storm tracks for the Barataria (A–C) and Lake Maurepas (D–F) watersheds. (A,D) are the storms that cause the 10-year stillwater surge (low), (B,E) the 50-year (medium), and (C,F) the 100-year (high). Storms 506 and 546 in (B) are the same track, but have different storm parameters. Storm parameters are shown in Table 2. Basemap courtesy of Mapbox.
Rather than refer to the synthetic storms as the storm that represent a given return period stillwater elevation, we will simplify and use the following terminology: low) selected synthetic storms that generated a 10-year return period water level; medium) synthetic storms that caused a 50-year return period water level; and high) synthetic storms that generated a 100-year return period water level (Table 2).
Simulation Set
A total of 12 simulation sets were performed for using the synthetic TCs identified in section synthetic storm selection and simulations set for each watershed. Astronomic tide forcing was not included in any of the simulations. Each simulation set formed four individual runs: (1) storm surge only, (2) storm surge and rainfall-runoff from TC-driven rain, (3) rainfall-runoff from antecedent rainfall only (no storm surge), and (4) rainfall-runoff from antecedent and TC-driven rain and storm surge in the same simulation. These scenarios result in 48 simulations for each watershed and 96 overall simulations.
The simulations that included storm surge were forced by wind speed and pressure for the synthetic storms outlined in Section synthetic storm selection and simulations set. The storm surge and TC-driven rainfall-runoff include the same forcing as in (1) and rainfall-runoff associated with the TC using the rain-on-mesh module introduced in section rain-on-mesh and rainfall accumulation defined by the parametric rainfall model described in section parametric tropical cyclone rainfall model. The simulation of antecedent rainfall employed the rain-on-mesh module with rainfall accumulation from antecedent conditions prescribed in Section antecedent rainfall and no meteorological forcing. Finally, the forcings from the synthetic TC, antecedent rain, and TC-driven rainfall were included in a single model simulation.
Flood Zone Delineation
The delineation of the hydrologic, coastal, and coastal flood transition zones is similar to that proposed in Bilskie and Hagen (2018). The following notation is used: ζR is the peak water level from the antecedent rainfall only simulation, ζS is the peak water level from storm surge only (no rainfall) simulation, and ζRS is the peak water level resulting from the combined rainfall-runoff, TC-driven rain, and surge simulation. Therefore, the we define the hydrologic zone as the region where ζR ≅ ζRS (area covered wetted only by rainfall), the coastal flood transition zone is defined as the region where ζR > ζS and ζRS > ζR, and the coastal zone is defined as the region where ζS > ζR. It is likely that peak water levels in the coastal zone will be greater for ζRS than ζS, but this region is dominated by storm surge, hence ζS > ζR.
The classification of the three possible flood zones was performed for each mesh node within the two respective basins for each set of simulations. Based on the flood zone classification, each mesh node was assigned either a value of 100 for the coastal zone, 200 for the coastal flood transition zone, or 300 representing the hydrologic zone. The unstructured mesh with these values was then transformed into a structured grid (IMG format) with a horizontal resolution of 20 m and imported into ESRI ArcMap. Within ArcMap, the raster was converted to a series of polygons where each polygon represented one of the three flood zone types.
In addition, the flood zones were generalized based on the low-, medium-, and high-intensity storm sets. All four flood zone maps were combined for each return period. The coastal flood transition zone was defined as any region within the watershed that was classified as a flood transition zone for any of the four event-driven flood zone classifications. The hydrologic zone was the region where all four individual simulations resulted in a hydrologic zone, and the coastal zone was classified similarly.
Results
Validation
Herein, we perform a model validation based on an extreme rainfall event across the Lake Maurepas watershed in August 2016 (Wang et al., 2016; van der Wiel et al., 2017). The validation period was from Aug. 1 to Aug. 31, 2016. No astronomic tides or wind/pressure forcing was employed as we wanted to examine model results within the Amite River away from tidal influence. Two model simulations were setup using details provided in Section hydrodynamic model setup and included a 5-days ramping function to initialize the stage in the Amite River (Aug. 1–5). The first model run included time-varying inflow for the simulation's duration into the Amite River prescribed by USGS gage 07380120 located in Denham Springs (near Interstate 10) (Figure 1A). The second model run included the time-varying inflow and was forced with rainfall from Aug. 11–15. The spatiotemporal rainfall pattern was obtained from the National Oceanic and Atmospheric Administration (NOAA) National Centers for Environmental Information (NCEP) Rapid Refresh (RAP) numerical weather model. The RAP model includes surface precipitation rate in mm/sec on a 13-km grid. Rainfall rates were converted to mm/hr and included in the ADCIRC simulation using the rain-on-mesh module (Section rain-on-mesh).
The results of the two model simulations are shown in Supplementary Figure 1 for the USGS gage 07380120. Both models well-represent the rising limb, peak, and falling limb of the river stage hydrograph and the peak stage timing. The model run without rainfall; however, it under-predicts the peak water level by 0.3 m. The simulation with rainfall included a better prediction of the peak stage with an under-prediction of 0.04 m. This gage is the only available gage with reasonable water levels for this event. There is a USGS gage (ID 07380200) downstream of Port Vincent, near French Settlement; however, the gage location is located slightly downstream of the Amite Diversion Canal. The diversion of flow between the Amite River and diversion canal and the diversion canal's bathymetric representation is not well-known.
Rainfall Accumulation
Rainfall accumulation was included for TC-driven rainfall, antecedent conditions, and their joint combination. An example of the total rainfall accumulation is shown for storm 145 (high TC – see Figures 3C,F for the track and Table 2 for storm parameters) in Figure 4. The total antecedent rainfall (mm) is shown in Figure 4A, TC-driven total rainfall in Figure 4B, and their joint combination in Figure 4C [refer to Equation (3)—the joint combination is not the sum of the two rainfall products, but the maximum at each time-step]. The largest rainfall amount for the antecedent conditions was 310 mm and focused on the storm track's northeast region. Total rainfall along the storm track was found on the storm's eastern edge with a maximum value of 183 mm; however, the largest values are generally offshore. The joint antecedent and TC-driven rainfall amounts were the largest east of the track near the landfall location, with a maximum value of 460 mm.
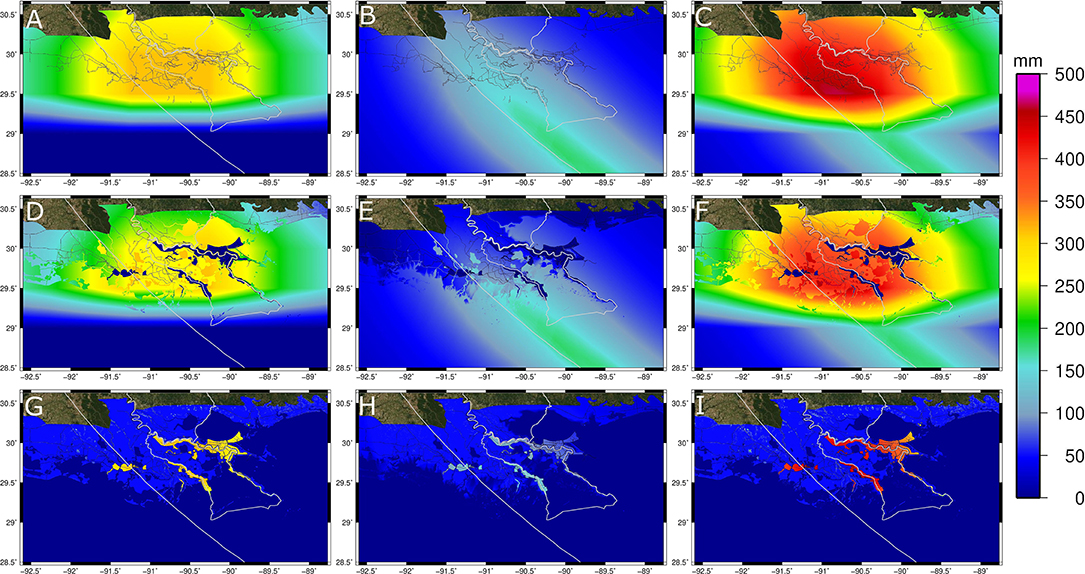
Figure 4. Rainfall totals (mm) based on storm 145 for antecedent conditions (A), tropical cyclone-driven rain (B), and combined rainfall (antecedent and TC-driven rain) (C). The top row (A–C) represents the total rainfall amount, the middle row (D–F) is the portion of rainfall amount applied to the model simulation, and the bottom row (G–I) is the unaccounted portion of the total rainfall. The Barataria and Lake Maurepas watersheds are outlined in gray. The storm track is also shown in gray.
A cumulative hyetograph from rainfall associated with storm 145 within the (A) Barataria (B3 in Figure 2) and (B) Lake Maurepas (M6 in Figure 2) watersheds are shown in Figure 4. Rainfall associated with antecedent conditions produces the highest rainfall at both locations until 24-h before landfall (vertical dashed line in the plots). Rainfall from the TC is zero until just over 24-h pre-landfall when the storm's outer portion comes onshore in Barataria and 10 h pre-landfall for Lake Maurepas. The total rainfall included in the joint rainfall ADCIRC simulation is shown in Figure 5 as the dashed gray curve. Barataria's location is on dry ground, and therefore a portion of the total rainfall is not included as this location starts as dry. Rainfall is not accounted for until the total rainfall exceeds 50 mm (refer to Section rain-on-mesh). On the other hand, the Lake Maurepas location, shown in Figure 4B, is in the middle of the Lake as it is always wet. Therefore, the cumulative accounted rainfall is equal to the joint rainfall.
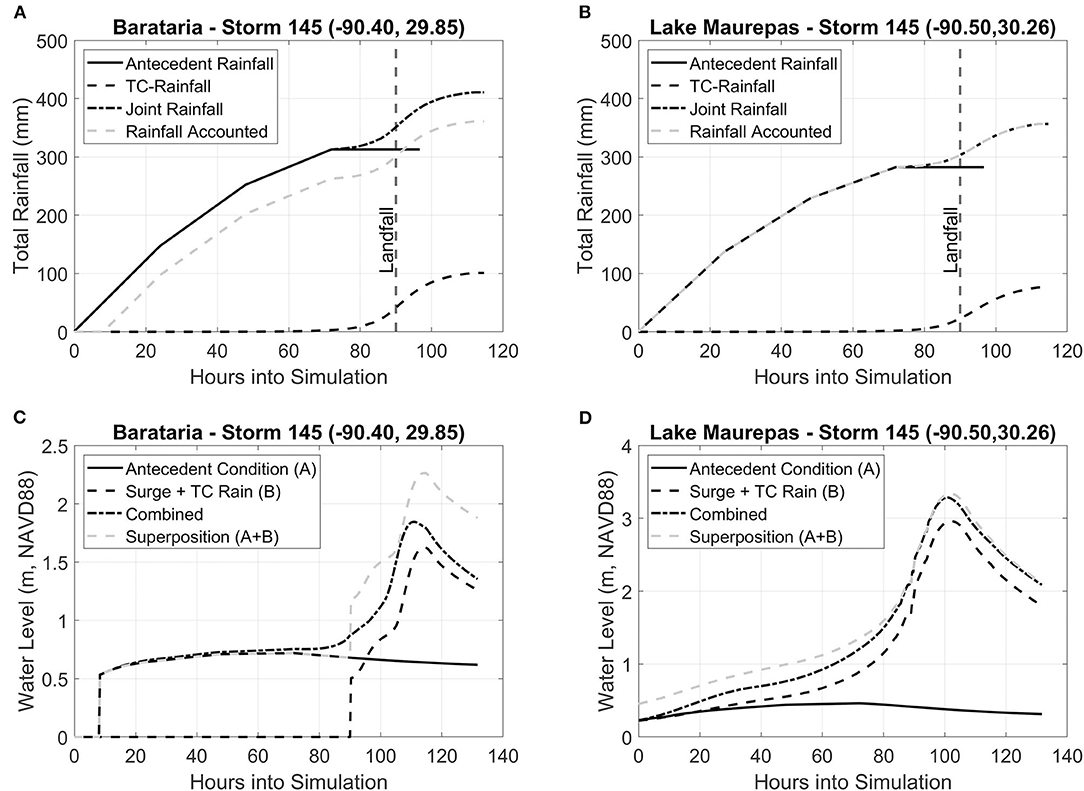
Figure 5. Total rainfall accumulation hyetograph for synthetic storm 145 within the (A) Barataria watershed and (B) Lake Maurepas. Locations are shown in Figure 2 (B3 and M6). Storm 145 makes landfall at 90 h (vertical dashed line). Water surface elevation (m, NAVD88) for synthetic storm 145 within the (C) Barataria watershed and (D) Lake Maurepas. Water levels from antecedent rainfall only (no surge) is shown as the solid black line. Water levels for storm surge and TC-driven rain (no antecedent rain) is shown as the dashed black line. Water levels for a combined storm surge, TC-driven rain, and antecedent rain is shown as the dash-dot black line. A superposition of the individual curves from the antecedent and surge with TC-rain is shown as the gray dashed line.
Simulated Inundation
Time-series water levels for a location in Barataria (B3 in Figure 2) and Lake Maurepas (M3 in Figure 2) are shown in Figures 5B,C for synthetic storm 145. Barataria's location is on the landscape (naturally dry ground), and the location of Lake Maurepas is in the lake (always wet). With antecedent rainfall-runoff only (black line), the Barataria location wets a few hours into the simulation to a water level just over 0.50 m NAVD88. It gradually increases to 0.72 m NAVD88 before slowly reducing. Water levels are zero before the storm's landfall and drives water levels up to a peak near 1.62 m NAVD88 for the surge and TC-driven rain simulation (black dashed line). The combined simulation (black dash-dotted line) that accounts for antecedent rainfall-runoff, TC-rain, and storm surge follows the antecedent rainfall only simulation. It then gradually increases until the surge begins at hour 90 up to a peak of 1.84 m NAVD88. The superposition of the individual simulations (gray dashed line) over-estimate Barataria's surge level by 0.41 m. Similar trends were observed for Lake Maurepas. However, the water level overprediction was not as substantial as the Maurepas location (superposition over-estimates by 0.05 m). This is caused by the Lake Maurepas location being in open water. Therefore, a linear addition (or superposition) of individual surface water runoff and coastal surge will tend to over-predict the coastal flood hazard, especially in normally dry areas.
Peak water levels from each intensity level of storms (low, medium, and high) were combined to generate a set of maximum of maximums (MOM) water level across the study watersheds. For example, the maximum simulated water level among the four low intensity storms for Barataria (storms 11, 77, 532, and 562 in Table 2) were combined by taking the maximum value at each computational point in the mesh. This was done for the surge only (Figure 6A), surge plus TC-driven rainfall (Figure 6B), antecedent conditions only (no storm surge) (Figure 6C), and the combined storm surge, TC-driven rain, and antecedent rainfall simulation (Figure 6D).
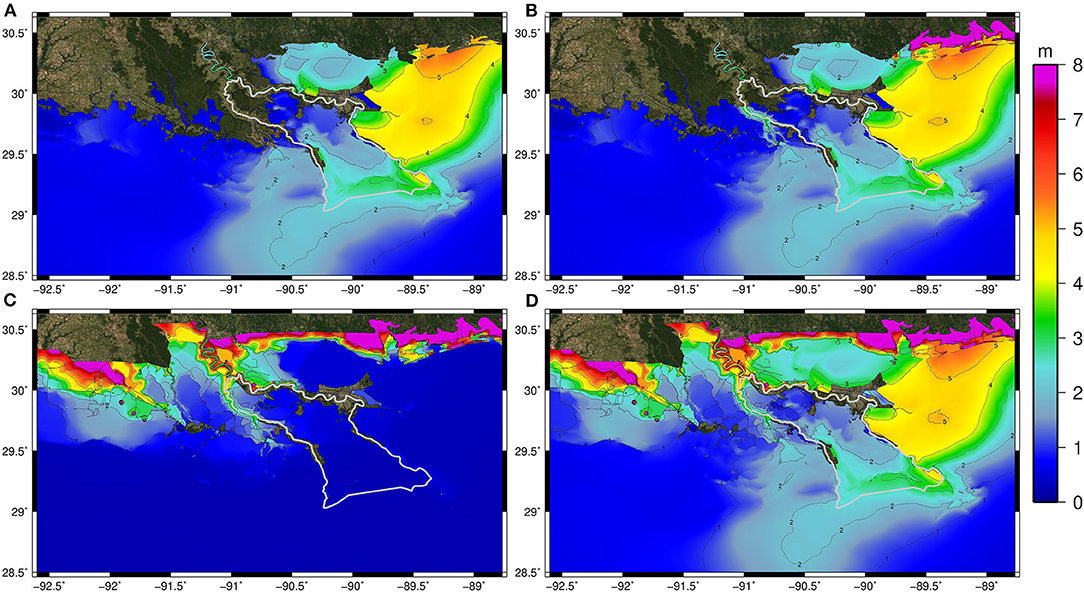
Figure 6. Maximum of maximums (MOM) simulated peak water levels (m, NAVD88) for the Barataria watershed low event synthetic storms for (A) storm surge only (no rainfall), (B) storm surge and TC-driven rain, (C) antecedent rainfall only (no storm surge), and (D) antecedent rainfall, TC-driven rainfall, and storm surge in a single simulation.
For the low set of synthetic storms in Barataria, the MOM water levels are relatively low (<2 m) for simulations with storm surge only (no rainfall); however, the majority of the basin is inundated (Figure 6A). Including TC-driven rainfall causes a small increase in the basin's inundated area (Figure 6B). On the other hand, the antecedent rainfall MOM water levels span the basin's entirety outside the flood protection system, albeit naturally dry regions experience a small inundated depth above ground (Figure 6C). The MOM water levels from the simulations containing antecedent and TC-driven rainfall and storm surge show increased water levels in the lower Barataria basin compared to the storm surge only MOM water levels (Figure 6D). Similar trends in water levels were found as storm intensities increased (medium and high) (Figures 7, 8). However, with increasing intensity, the coastal water levels are higher and raise water levels further into the Barataria watershed. For example, water levels as high as 3 m NAVD88 are found in the middle portion of Barataria Bay under the simulated compound flood event (Figures 7D, 8D).
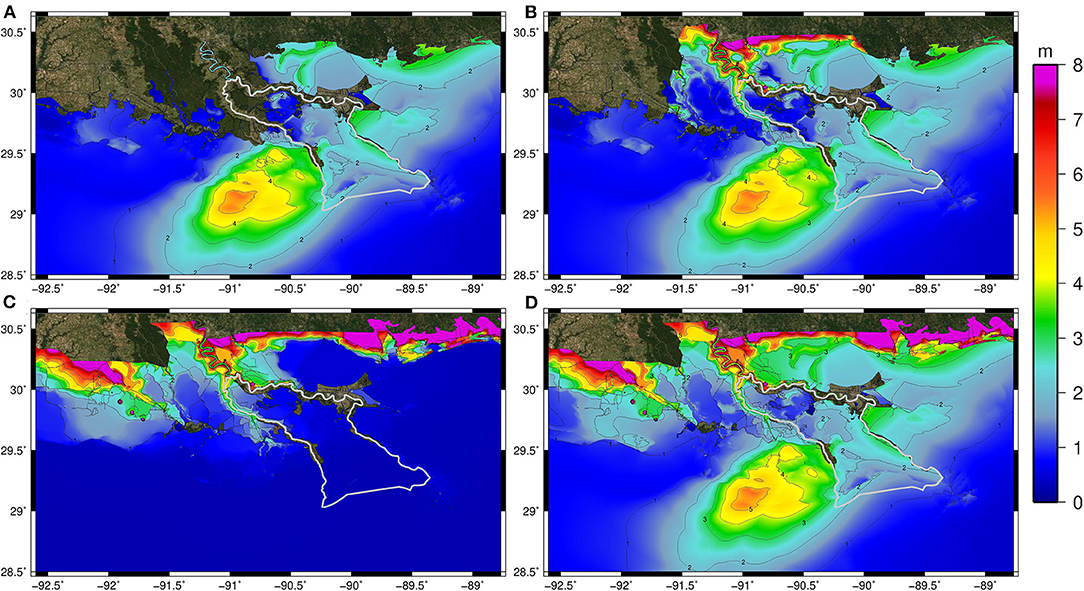
Figure 7. Maximum of maximums (MOM) simulated peak water levels (m, NAVD88) for the Barataria watershed medium event synthetic storms for (A) storm surge only (no rainfall), (B) storm surge and TC-driven rain, (C) antecedent rainfall only (no storm surge), and (D) antecedent rainfall, TC-driven rainfall, and storm surge in a single simulation.
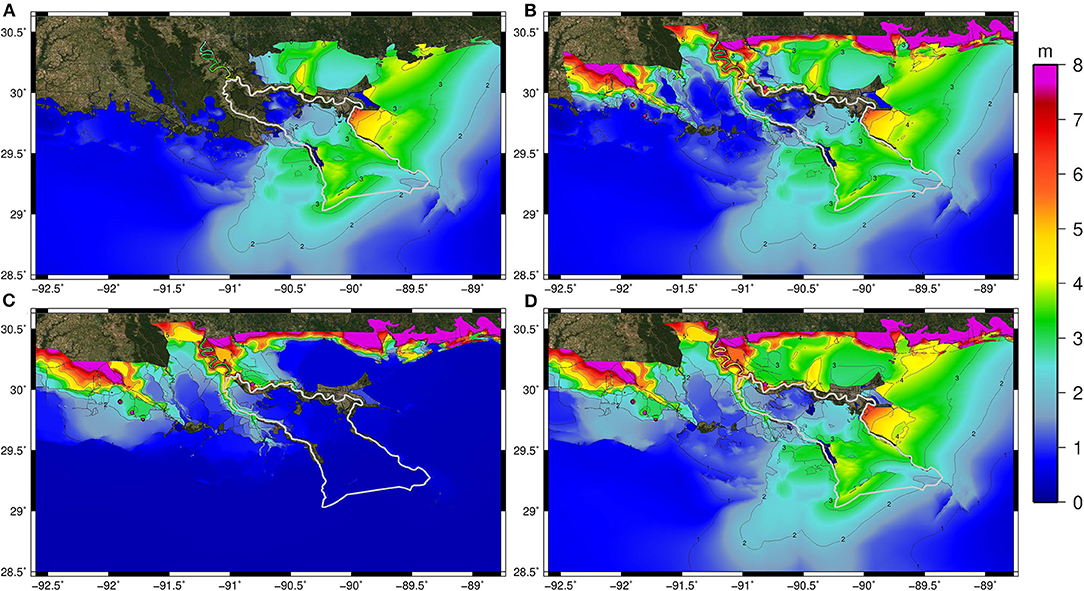
Figure 8. Maximum of maximums (MOM) simulated peak water levels (m, NAVD88) for the Barataria watershed high event synthetic storms for (A) storm surge only (no rainfall), (B) storm surge and TC-driven rain, (C) antecedent rainfall only (no storm surge), and (D) antecedent rainfall, TC-driven rainfall, and storm surge in a single simulation.
Simulated water levels in Lakes Pontchartrain and Maurepas show substantial increases when rainfall is included in the storm surge simulation, particularly the antecedent conditions (Figures 9–11). For the low and medium intensity TCs, water levels increase by nearly 0.3 m (or 15–20%) (Figures 9B, 10B) when antecedent rainfall is incorporated (Figures 9D, 10D). For the high-intensity TC, peak water levels increased by 40 cm within the Lakes Pontchartrain and Maurepas (10–15%) when antecedent conditions were included in the storm surge model simulation and TC-driven rainfall (Figure 11). The higher TC events caused larger surges in Lake Maurepas than Lake Pontchartrain, even when rain was not accounted for (the peak water levels are larger in Lake Pontchartrain than Maurepas for medium and low TCs). Although peak water levels moderately increased in the tidal lakes, results demonstrated an increase near 1 m (33% of the total water level) across portions of the [normally dry] floodplain adjacent to Lake Maurepas. These results begin to indicate how the surge penetration is altered when incorporating runoff from antecedent rainfall. This will be further evaluated with the definition of the flood zones, particularly the coastal flood transition zone.
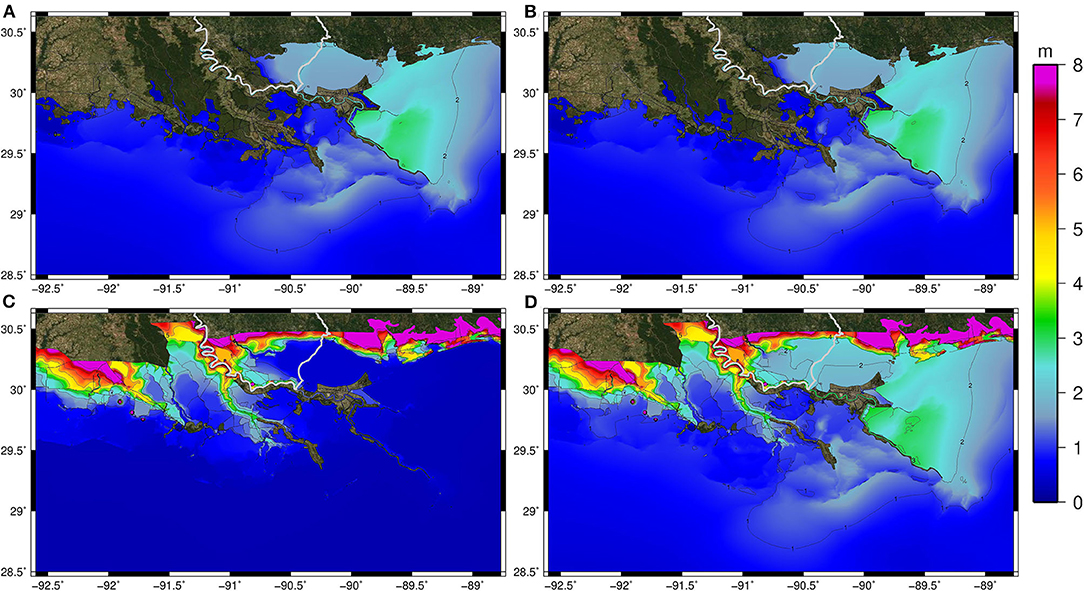
Figure 9. Maximum of maximums (MOM) simulated peak water levels (m, NAVD88) for the Lake Maurepas 10-year TC events from (A) storm surge only (no rainfall), (B) storm surge and TC-driven rain, (C) antecedent rainfall only (no storm surge), and (D) antecedent rainfall, TC-driven rainfall, and storm surge in a single simulation.
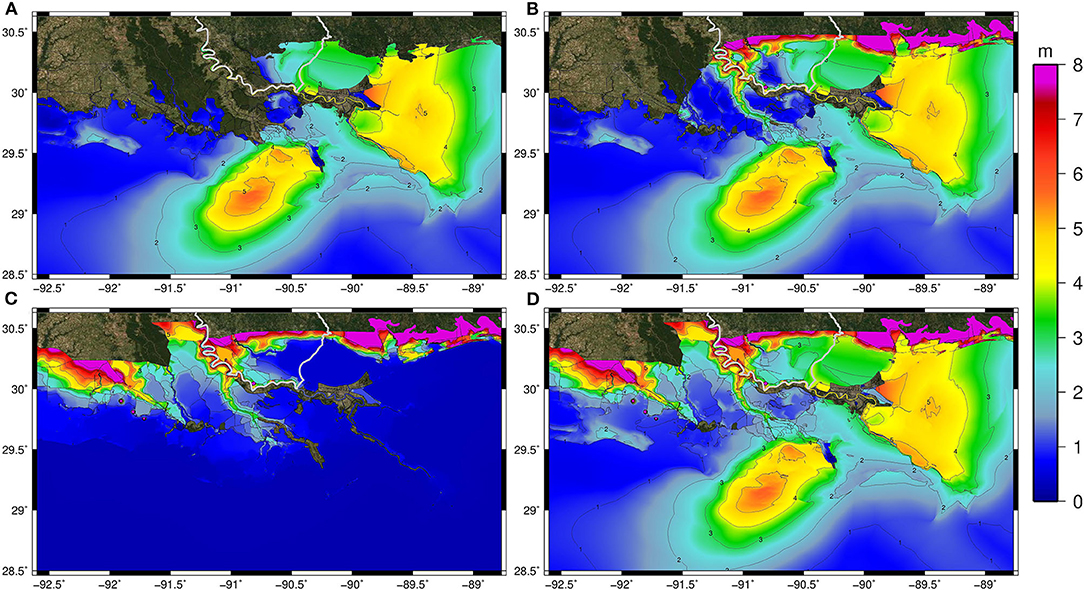
Figure 10. Maximum of maximums (MOM) simulated peak water levels (m, NAVD88) for the Lake Maurepas 50-year TC events from (A) storm surge only (no rainfall), (B) storm surge and TC-driven rain, (C) antecedent rainfall only (no storm surge), and (D) antecedent rainfall, TC-driven rainfall, and storm surge in a single simulation.
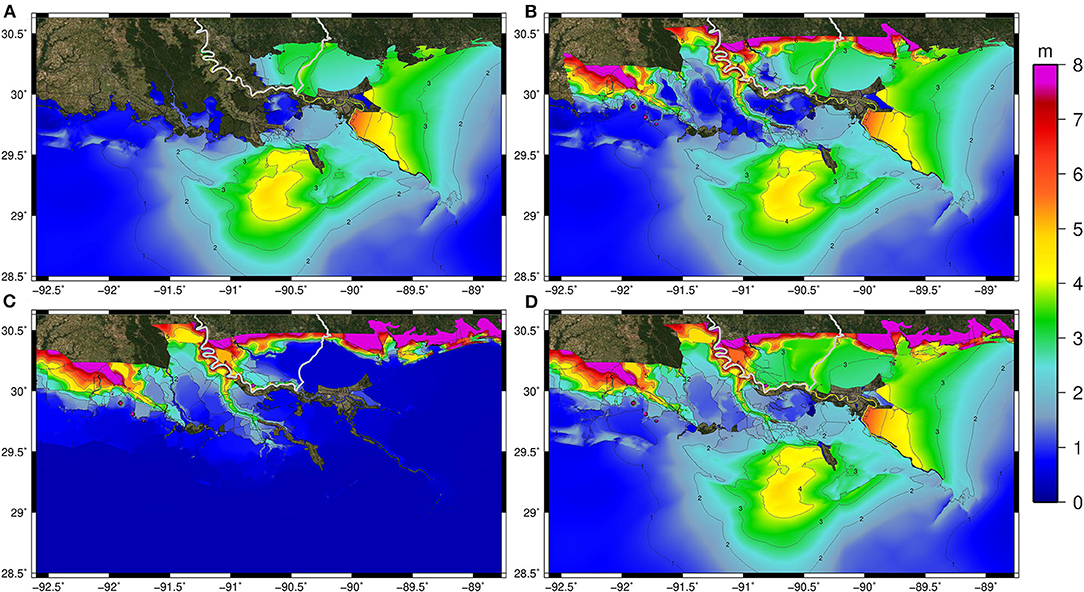
Figure 11. Maximum of maximums (MOM) simulated peak water levels (m, NAVD88) for the Lake Maurepas 100-year TC events from (A) storm surge only (no rainfall), (B) storm surge and TC-driven rain, (C) antecedent rainfall only (no storm surge), and (D) antecedent rainfall, TC-driven rainfall, and storm surge in a single simulation.
Flood Zones
The spatial extent of each coastal, hydrologic, and flood transition zone is dependent on the rainfall, TC, and landscape characteristics (Figure 12). In Barataria, the coastal flood zone makes up 66% of the basin's total area (Table 3) and horizontally extends ~100 km from the Gulf of Mexico to Des Allemands (Figures 12A–C). The transition zone spans ~20 km for the lesser TC events to near 60 km toward the basin's northern boundary, bounded by levees, for the more extreme TC events. For all TC events simulated for the Barataria watershed, the coastal zone is nearly identical, with small variations near Des Allemands Lake, south of LaPlace. The little variation results from the low-lying topography, the funnel-shape of the basin, and its outer boundaries of naturally raised features and levee structures. Surge can penetrate 100 km inland. It is only in the upper portions of the watershed that rainfall has a substantial impact.
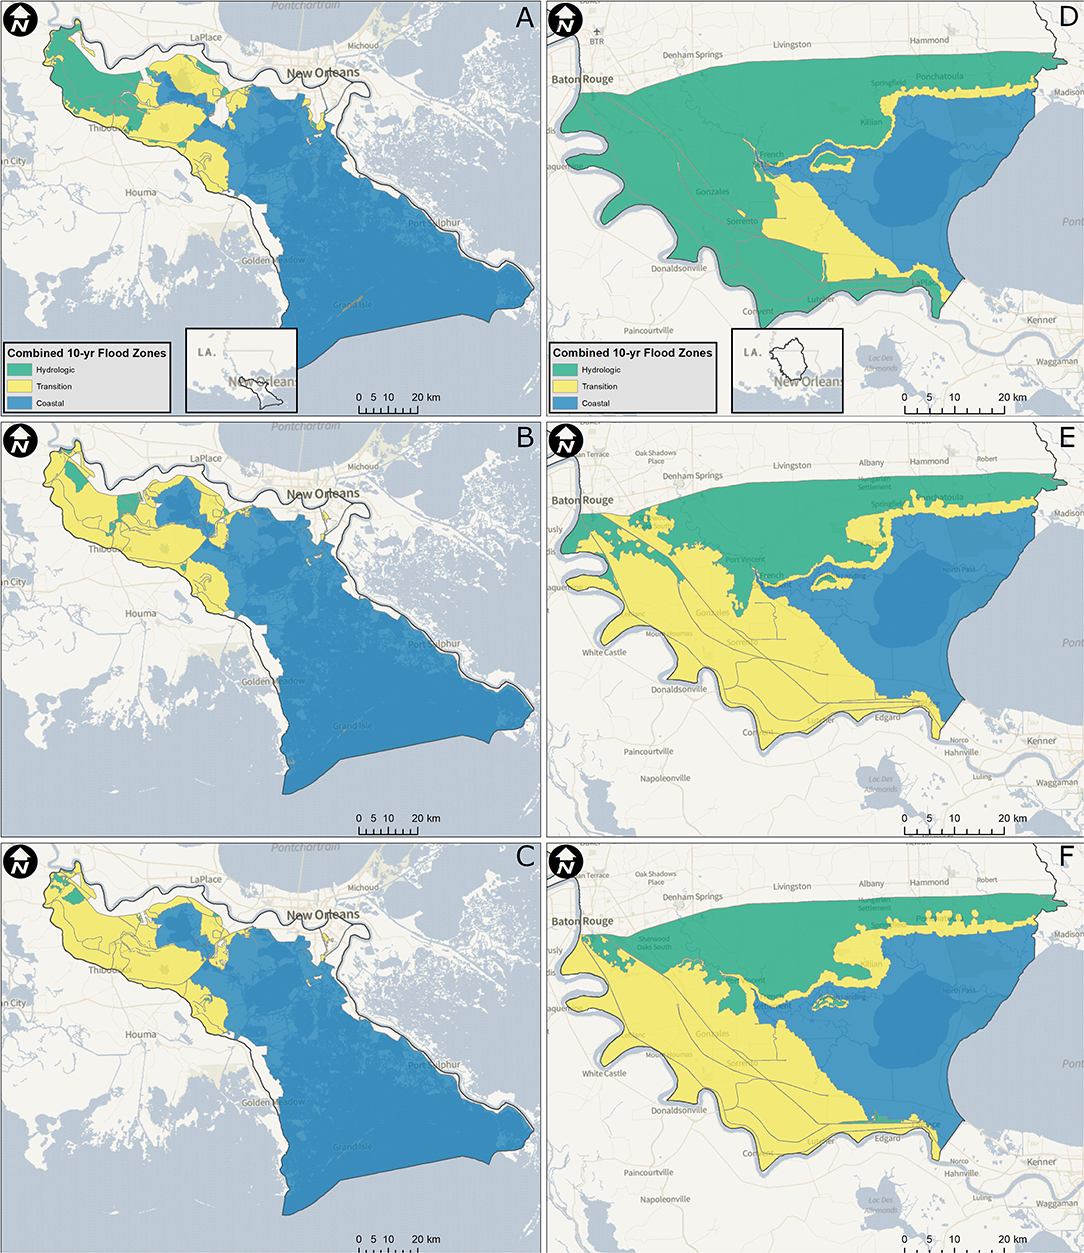
Figure 12. Flood zone delineation for (A–C) Barataria watershed and (D–F) Lake Maurepas watershed for the (A,D) 10-year, (B,E) 50-year, and (C,F) 100-year return period storm surge stillwater elevation. Basemap courtesy of Mapbox.
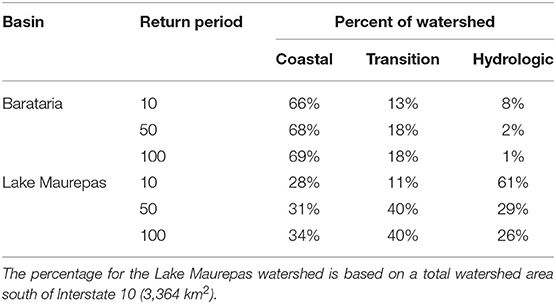
Table 3. Percent of watershed made up of each flood zone type (coastal, transition, and hydrologic).
The coastal zone across the Lake Maurepas watershed extends along the eastern edge of the basin and encompasses Lake Maurepas in its entirety. The coastal zone ranges from 7 to 9% of total basins area (27–34% of the basin south of Interstate 10) for the 10-year and 100-year TC events, respectively. The coastal flood transition zone and the hydrologic zone vary substantially between the varying events. For the 10-year TC event, the transition zone is 377 km2 (11% of the watershed area) and increases to 1,254 km2 (37% of the watershed area) for the 100-year TC event. The increase in the coastal flood transition zone within the Lake Maurepas basin reduces the hydrologic zone from 2,057 km2 (61%W of the area) to 959 km2 (29% of the area). The transition and hydrologic zones are 1,329 km2 and 1,000 km2 for the 50-year TC event, respectively.
In the Lake Maurepas watershed, the transition zone for all return period events spans the 2 m elevation contour (NAVD88) from the Louisiana/Mississippi border to the Amite River. The flood transition zone is also generally locked along the western edge of Lake Maurepas for return period TC events; however, this edge does not follow a general contour line. The difference in the expanse of the transition and hydrologic flood zones is dominated along the western edge of the basin, including flood protection infrastructure and levees along the eastern bank of the Mississippi River. Furthermore, the flood transition zone extends into portions of East Baton Rouge Parish with higher return period TC events.
Discussion and Conclusion
This research address the simulation of compound coastal flood events and the delineation of a coastal flood transition zone (Bilskie and Hagen, 2018) for two distinct coastal basins in southeastern Louisiana. Rainfall-runoff from antecedent and TC-driven rainfall along with storm surge was simulated using a new rain-on-mesh module incorporated into the ADCIRC code. Antecedent rainfall conditions were obtained for seven rainfall stations with reliable data records for 21 landfalling TC events spanning 1948-2008. A parametric, TC-driven rainfall model was used for precipitation associated with the TC (Lonfat et al., 2004; US Army Corps of Engineers, 2006). Twelve synthetic storms of varying meteorological intensity (low, medium, and high) and total rainfall were utilized for each watershed (Barataria and Lake Maurepas) and provided model forcing for simulations of coastal inundation.
First, it was found that antecedent rainfall (pre-TC landfall) is influential up to 3 days pre-landfall. Rain gages along southeastern LA that measured total rainfall for 21 storm events showed little rainfall accumulation beyond 3 days before TC landfall. Second, results show that antecedent and TC-driven rainfall increase simulated peak water levels within each basin, with antecedent rainfall dominating inundation across the basin's upper portions. This increase is nonlinear. The superposition of water levels resulting from antecedent rainfall alone and water levels from storm surge (and TC-driven rain) does not equal the peak water levels generated from the simulation, including antecedent and TC-driven rain along with storm surge. The non-linear interaction is caused by the variation in the rainfall runoff's timing with the storm surge flooding along with interactions with the topography, friction, and the forcing. This nonlinearity underscores the need for further development of numerical models that tightly couple hydrologic and coastal surge processes into a single model framework (Santiago-Collazo et al., 2019) as well as the need to define the transition of flood zone hazards and risk (Bilskie and Hagen, 2018; Wu et al., 2018). Additionally, work should focus on examining the reasons for the nonlinear interaction.
Third, the delineated flood zones of coastal, transition, and hydrologic show stark differences between the two basins (Figure 12 and Table 3). The coastal zone makes up most of the Barataria basin under all scenarios (over 65% of the basin area), followed by the transition (over 13%) and hydrologic. Under the medium and high-intensity TCs, the hydrologic zone is 2% or less of the entire basin, indicating that rainfall, from both antecedent conditions and TCs, influences the basin and should be considered flood hazard and risk assessments. However, in Lake Maurepas, the coastal zone makes up 28–34% of the basins area (basin area south of Interstate-10). The transition zone is held constant for the medium and high-intensity events at 40% of the area, but only 11% for the low-intensity events. The hydrologic zone is large (61% of the area) for the low events but increase to 26–29% for the medium and high, respectively. The transition zone extends along the southwestern portion of the Lake Maurepas basin along the Mississippi River's east bank and into southern areas of greater Baton Rouge. The transition zone's extent indicates the vulnerability of compound flood events for a large area in the lower half of the watershed. As with Barataria, rainfall (for both hydrologic and surge processes) should be included in coastal flood hazard and risk studies.
This research has a variety of implications. Most important is the further refinement of capturing the spatial variation of the three flood zones (coastal, transition, and hydrologic), and in particular, the coastal flood transition zone (Figure 12). The coastal flood transition zone extends into the middle and upper portions of coastal watersheds, even coastal watersheds adjacent to tidal lakes removed from open ocean conditions (e.g., Lake Maurepas watershed). Antecedent rainfall conditions, as well as rainfall associated with TC, should be integrated into coastal flood hazard studies. The framework developed in this research to incorporate rain in a coastal inundation model and define the coastal flood transition zone is not specific to the two watersheds studied herein. The methods outlined can be extended to other coastal watersheds that are prone to compound flood events. For example, Shen et al. (2019) found similar flood transition zone results in Norfolk, VA, as did Bilskie and Hagen (2018) using different numerical models and techniques to include rainfall-runoff for different intensities and scenarios. There is a need to understand compound flooding fundamentals as it is a complex, nonlinear process. Finally, combining total water levels from individual model simulations of rainfall-runoff driven models and coastal inundation models are not sufficient for rigorous flood hazard studies. This basic approach is likely to overestimate the actual hazard. We must gain a fuller appreciation of the actual risks and recognize the integrated natural and human system that exists at the coastal land-margin.
Although this effort builds upon contemporary research of compound flood modeling, it has limitations that should be considered and based on future endeavors. First, our rain-on-mesh module does not include soil moisture, infiltration, or evapotranspiration. These mechanisms will reduce the amount of available rainfall excess, leading to changes in the available volume of water for surface runoff (Brocca et al., 2008; Bedient et al., 2018). Second, currently employed wetting/drying schemes are not well-suited for rainfall-driven runoff (Medeiros and Hagen, 2012). Further developments in wetting/drying algorithms for surface water routing should be emphasized in future efforts. Finally, our study employed a minimal number of synthetic storms, and a more comprehensive range of storm intensities and tracks is desirable. Such future efforts, among others, can enable a probabilistic understanding of the coastal flood transition zone and with the comprehension of consequence a more complete appreciation of flood risk at the coastal land-margin.
Data Availability Statement
The datasets presented in this study can be found in online repositories. The names of the repository/repositories and accession number(s) can be found at: http://doi.org/10.17605/OSF.IO/G7DFJ.
Author Contributions
MB contributed to the research ideas, developed the rain-on-mesh module, performed ADCIRC simulations, analyzed results including the flood zone delineation, led this article's writing, and was previously at the Louisiana State University Center for Coastal Resiliency, where he carried out most of his research contributions to this article, but has since been at the University of Georgia as of August 1, 2020. HZ provided guidance on developing the rain-on-mesh module, conducted simulations, post-processing of results for the Barataria watershed, and contributed to the writing of this article. DR led the antecedent rainfall analysis and contributed text to this article. JA provided guidance on the rain-on-mesh module, led the synthetic storm selection, and contributed text to this article. ZC wrote/tested computer code for TC-driven and gridded rainfall. SH is the PI and conceived the original research ideas, provided guidance during the development of the rain-on-mesh module, assisted in analyzing results, and aided in writing/reviewing this article. All authors contributed to the article and approved the submitted version.
Funding
This project was paid for with federal funding from the Department of the Treasury through the Louisiana Coastal Protection and Restoration Authority's Center of Excellence Research Grants Program under the Resources and Ecosystems Sustainability, Tourist Opportunities, and Revived Economies of the Gulf Coast States Act of 2012 (RESTORE Act) (Award No. CPRA-2015-COE-MB). This project was also paid in part by the Gulf Research Program (GRP) of the National Academies of Sciences, Engineering, and Medicine (Award No. 200000829), Robert Wood Johnson Foundation (RWJF) (Award No. 200000829), and the Louisiana Sea Grant Laborde Chair.
Conflict of Interest
The authors declare that the research was conducted in the absence of any commercial or financial relationships that could be construed as a potential conflict of interest.
Acknowledgments
The statements, findings, conclusions, and recommendations are those of the authors and do not necessarily reflect the views of the Department of the Treasury, GRP, RWJF, or the Louisiana Sea Grant College Program.
Supplementary Material
The Supplementary Material for this article can be found online at: https://www.frontiersin.org/articles/10.3389/frwa.2021.609231/full#supplementary-material
References
Atkinson, J. H., Roberts, H. J., Hagen, S. C., Zou, S., Bacopoulos, P., Medeiros, S. C., et al. (2011). Deriving frictional parameters and performing historical validation for an ADCIRC storm surge model of the Florida Gulf Coast, Florida. Watershed J. 4, 22–27. Available online at: https://bluetoad.com/publication/?m=12306&i=69376&p=20
Bedient, P. B., Huber, W. C., and Vieux, B. E. (2018). Hydrology and Floodplain Analysis. 6th ed. (Pearson), 832.
Bilskie, M. V., and Hagen, S. C. (2018), Defining flood zone transitions in low-gradient coastal regions. Geophys. Res. Lett. 45, 2761–2770. doi: 10.1002/2018GL077524
Black, P. G., D'Asaro, E. A., Sanford, T. B., Drennan, W. M., Zhang, J. A., French, J. R., et al. (2007). Air–sea exchange in hurricanes: synthesis of observations from the coupled boundary layer air–sea transfer experiment. Bullet. Am. Meteorol. Soc. 88, 357–374. doi: 10.1175/BAMS-88-3-357
Blake, E. S., and Zelinksy, D. A. (2018). National Hurricane Center Tropical Cyclone Report: Hurricane HarveyRep.
Brocca, L., Melone, F., and Moramarco, T. (2008). On the estimation of antecedent wetness conditions in rainfall–runoff modelling. Hydrol. Process. 22, 629–642. doi: 10.1002/hyp.6629
Bunya, S., Dietrich, J. C., Westerink, J. J., Ebersole, B. A., Smith, J. M., Atkinson, J. H., et al. (2010). A high-resolution coupled riverine flow, tide, wind, wind wave, and storm surge model for southeastern Louisiana and Mississippi. Part I: Model development and validation. Monthly Weather Rev. 128, 345–377. doi: 10.1175/2009MWR2906.1
Cobell, Z., Zhao, H., Roberts, H. J., Clark, F. R., and Zou, S. (2013). Surge and wave modeling for the Louisiana 2012 coastal master plan. J. Coastal Res. 7, 88–108. doi: 10.2112/SI_67_7
Conner, W. H., and Day, J. W. (1987). The Ecology of Barataria Basin, Louisiana: An Estuarine ProfileRep. (US Fish and Wildlife Service), 165.
DeLorme, D. E., Stephens, S. H., Bilskie, M. V., and Hagen, S. C. (2020). Coastal decision-makers' perspectives on updating storm surge guidance tools. J. Contingencies Crisis Manag. 28, 158–168. doi: 10.1111/1468-5973.12291
Dietrich, J. C., Dawson, C. N., Proft, J. M., Howard, M. T., Wells, G., Fleming, J. G., et al. (2013). “Real-time forecasting and visualization of hurricane waves and storm surge using SWAN+ADCIRC and FigureGen,” in Computational Challenges in the Geosciences, eds C. Dawson and M. Gerritsen (New York, NY: Springer), 49–70. doi: 10.1007/978-1-4614-7434-0_3
Dietrich, J. C., Kolar, R. L., and Westerink, J. J. (2006). Refinements in continous galerkin wetting and drying algorithms. in Ninth International Conference on Estuarine and Coastal Modeling, (Charleston, SC) 637–656. doi: 10.1061/40876(209)37
Dietrich, J. C., Tanaka, S., Westerink, J. J., Dawson, C. N., Luettich, R. A., Zijlema, M., et al. (2012). Performance of the unstructured-mesh, SWAN+ADCIRC model in computing hurricane waves and surge. J. Sci. Comput. 52, 468–497. doi: 10.1007/s10915-011-9555-6
Dietrich, J. C., Westerink, J. J., Kennedy, A. B., Smith, J. M., Jensen, R. E., Zijlema, M., et al. (2011). Hurricane Gustav (2008) waves and storm surge: hindcast, synoptic analysis, and validation in Southern Louisiana. Monthly Weather Rev. 139, 2488–2522. doi: 10.1175/2011MWR3611.1
Erdman, J. (2018). Florence Sets Preliminary North Carolina and South Carolina Tropical Cyclone Rain Records; Third, Fourth States to Do So in 12 Months. Weather Channel.
FEMA and USACE (2008). Flood Insurance Study: Southeastern Parishes, Louisiana, Intermediate Submission 2: Offshore Water Levels and WavesRep. FEMA Region 6 and USACE New Orleans District.
Gori, A., Lin, N., and Smith, J. (2020). Assessing compound flooding from landfalling tropical cyclones on the North Carolina Coast. Water Resourc. Res. 56:e2019WR026788. doi: 10.1029/2019WR026788
Kinnmark, I. (1985). “The shallow water wave equations: formulation, analysis, and application,” in Lecture Notes in Engineering. New York, NY: Springer-Verlag. doi: 10.1007/978-3-642-82646-7
Kolar, R. L., Gray, W. G., Westerink, J. J., Cantekin, M. E., and Blain, C. A. (1994). Aspects of nonlinear simulations using shallow-water models based on the wave continuity equation. Comput. Fluids 23, 523–538. doi: 10.1016/0045-7930(94)90017-5
Leonard, M., Westra, S., Phatak, A., Lambert, M., van den Hurk, B., McInnes, K., et al. (2014). A compound event framework for understanding extreme impacts. Wiley Interdiscipl. Rev. Climate Change 5, 113–128. doi: 10.1002/wcc.252
Lonfat, M., Marks, F. D. Jr, and Chen, S. S. (2004). Precipitation distribution in tropical cyclones using the tropical rainfall measuring mission (TRMM) microwave imager: a global perspective. Monthly Weather Rev. 132, 1645–1660. doi: 10.1175/1520-0493(2004)132<1645:PDITCU>2.0.CO;2
Luettich, R. A., and Westerink, J. J. (2004). Formulation and numerical implementations of the 2D/3D ADCIRC finite element model version 44.XXRep., 12/08/2004. Available online at: http://citeseerx.ist.psu.edu/viewdoc/download?doi=10.1.1.675.3043&rep=rep1&type=pdf
Medeiros, S., and Hagen, S. C. (2012). Review of wetting and drying algorithms for numerical tidal flow models. Int. J. Numerical Methods Fluids 71, 473–487. doi: 10.1002/fld.3668
Morgan, J. P. (1967). “Ephemeral estuaries of the deltaic environment,” in Estuaries: AAAS Monograph, ed G. H. Lauff, 115–120.
Paerl, H. W., Hall, N. S., Hounshell, A. G., Luettich, R. A., Rossignol, K. L., Osburn, C. L., et al. (2019). Recent increase in catastrophic tropical cyclone flooding in coastal North Carolina, USA: long-term observations suggest a regime shift. Sci. Rep. 9:10620. doi: 10.1038/s41598-019-46928-9
Powell, M. D. (2006). National Oceanic and Atmospheric Administration (NOAA) Joint Hurricane Testbed (JHT) Program. Final Report. Silver Spring, MD: National Oceanic and Atmospheric Administration.
Roberts, H., and Cobell, Z. (2017). 2017 Coastal Master Plan: Attachment C3-25.1: Storm SurgeRep. (Louisiana: Coastal Protection and Restoration Authority, Baton Rouge, LA), 1–110.
Santiago-Collazo, F. L., Bilskie, M. V., and Hagen, S. C. (2019). A comprehensive review of compound inundation models in low-gradient coastal watersheds. Environ. Model. Softw. 119, 166–181. doi: 10.1016/j.envsoft.2019.06.002
Shen, Y., Morsy, M. M., Huxley, C., Tahvildari, N., and Goodall, J. L. (2019). Flood risk assessment and increased resilience for coastal urban watersheds under the combined impact of storm tide and heavy rainfall. J. Hydrol. 579:124159. doi: 10.1016/j.jhydrol.2019.124159
Silva-Araya, W., Santiago-Collazo, F., Gonzalez-Lopez, J., and Maldonado-Maldonado, J. (2018). Dynamic modeling of surface runoff and storm surge during hurricane and tropical storm events. Hydrology 5:13. doi: 10.3390/hydrology5010013
Stephens, S., DeLorme, D., and Hagen, S. (2017). Evaluation of the design features of interactive sea-level rise viewers for risk communication. Environ. Commun. 11, 248–262. doi: 10.1080/17524032.2016.1167758
Thaler, T., and Levin-Keitel, M. (2016). Multi-level stakeholder engagement in flood risk management—a question of roles and power: lessons from England. Environ. Sci. Policy 55, 292–301. doi: 10.1016/j.envsci.2015.04.007
US Army Corps of Engineers (2006). Performance Evaluation of the New Orleans and Southeast Louisiana Hurricane Protection SystemRep. Final Report of the Interagency Performance Evaluation Task Force.
US Geological Survey (2020). Coastal National Elevation Database (CoNED) Project - Topobathymetric Digital Elevation Model (TBDEM).
Valle-Levinson, A., Olabarrieta, M., and Heilman, L. (2020). Compound flooding in Houston-Galveston Bay during Hurricane Harvey. Sci. Total Environ. 747:141272. doi: 10.1016/j.scitotenv.2020.141272
van der Wiel, K., Kapnick, S. B., van Oldenborgh, G. J., Whan, K., Sjoukje, P., Vecchi, G. A., et al. (2017). Rapid attribution of the August 2016 flood-inducing extreme precipitation in south Louisiana to climate change. Hydrol. Earth System Sci. 21, 897–921. doi: 10.5194/hess-21-897-2017
Wahl, T., Jain, S., Bender, J., Meyers, S. D., and Luther, M. E. (2015). Increasing risk of compound flooding from storm surge and rainfall for major US cities. Nat. Climate Change 5:1093. doi: 10.1038/nclimate2736
Wang, S. Y. S., Zhao, L., and Gillies, R. R. (2016). Synoptic and quantitative attributions of the extreme precipitation leading to the August 2016 Louisiana flood. Geophys. Res. Lett. 43, 11805–811814. doi: 10.1002/2016GL071460
Westerink, J. J., Luettich, R. A., Feyen, J. C., Atkinson, J. H., Dawson, C., Roberts, H. J., et al. (2008). A basin- to channel-scale unstructured grid hurricane storm surge model applied to Southern Lousiana. Monthly Weather Rev. 136, 833–864. doi: 10.1175/2007MWR1946.1
White, I., Kingston, R., and Barker, A. (2010). Participatory geographic information systems and public engagement within flood risk management. J. Flood Risk Manag. 3, 337–346. doi: 10.1111/j.1753-318X.2010.01083.x
Wu, W., McInnes, K., O'Grady, J., Hoeke, R., Leonard, M., and Westra, S. (2018). Mapping dependence between extreme rainfall and storm surge. J. Geophys. Res. Oceans 123, 2461–2474. doi: 10.1002/2017JC013472
Keywords: compound flooding, coastal inundation, rainfall runoff, Louisiana, coastal flood transition zone
Citation: Bilskie MV, Zhao H, Resio D, Atkinson J, Cobell Z and Hagen SC (2021) Enhancing Flood Hazard Assessments in Coastal Louisiana Through Coupled Hydrologic and Surge Processes. Front. Water 3:609231. doi: 10.3389/frwa.2021.609231
Received: 22 September 2020; Accepted: 12 January 2021;
Published: 05 February 2021.
Edited by:
Navid Tahvildari, Old Dominion University, United StatesReviewed by:
Dongmei Feng, University of Massachusetts Amherst, United StatesRamin Familkhalili, Old Dominion University, United States
Copyright © 2021 Bilskie, Zhao, Resio, Atkinson, Cobell and Hagen. This is an open-access article distributed under the terms of the Creative Commons Attribution License (CC BY). The use, distribution or reproduction in other forums is permitted, provided the original author(s) and the copyright owner(s) are credited and that the original publication in this journal is cited, in accordance with accepted academic practice. No use, distribution or reproduction is permitted which does not comply with these terms.
*Correspondence: Matthew V. Bilskie, bWJpbHNraWVAdWdhLmVkdQ==
 Matthew V. Bilskie
 Haihong Zhao
 Don Resio3
 Zachary Cobell
 Scott C. Hagen
