 Alfred O. Achieng1*
 Frank O. Masese1
 Tracey J. Coffey2
 Phillip O. Raburu1
 Simon W. Agembe1Catherine M. Febria3
 Boaz Kaunda-Arara1
- 1Department of Fisheries and Aquatic Science, University of Eldoret, Eldoret, Kenya
- 2School of Veterinary Medicine and Science, University of Nottingham, Nottingham, United Kingdom
- 3Department of Integrative Biology, Great Lakes Institute for Environmental Research, University of Windsor, Windsor, ON, Canada
Streams and rivers are globally threatened ecosystems because of increasing levels of exploitation, habitat degradation and other anthropogenic pressures. In the Lake Victoria Basin (LVB) in East Africa, these threats are mostly caused by unsustainable land use; however, the monitoring of ecological integrity of river systems has been hampered by a lack of locally developed indices. This study assessed the health of four rivers (Nzoia, Nyando, Sondu–Miriu and Mara) on the Kenyan side of the LVB using physicochemical water quality parameters and a fish-based index of biotic integrity (IBI). Fish tolerance ranking was derived from principal component analysis of water quality parameters, and the concept of niche breadth (NB). The relationship between fish species and water quality parameters was examined with canonical correspondence analysis, whereas community metrics and stressors were evaluated through Pearson network correlation analysis. Fish species richness, trophic structures, taxonomic composition and species tolerance were used to generate the metrics for fish-based IBI. NB showed that most of the fish species were moderately tolerant to poor water. Moderately tolerant and intolerant fish species were negatively correlated with a high level of organic loading in the Mara River. Fish-based IBI scores for the rivers ranged from 26 to 34, with Sondu–Miriu scoring the lowest. Our results show that the cumulative effect of stressors can adequately rank fish species tolerance according to the disturbance gradients and further develop regional metrics to assess river health. Despite the fact that fish communities are declining, continual management and enforcement of environmental regulations are important, with conservation and management of headwaters and low-order streams being essential while they are still species rich.
Introduction
River catchments are some of the most vulnerable ecosystems through being increasingly exposed to multiple anthropogenic stressors, including habitat degradation, flow alteration, increased water demand, urbanization and agricultural intensification (Dudgeon et al., 2006; Mamun and An, 2020). This has resulted in a loss of hydrological connectivity, increases in nutrient and sediment load, exposure to invasive species and biodiversity loss, most of which occur as multiple interacting factors affecting structure and function of riverine ecosystems (Stevenson and Sabater, 2015; Shao et al., 2019). Predicting river responses to human activities is challenged by the diversity of stressors and habitat alterations associated with them and therefore a quantitative or objective assessment of global river ecosystem health remains a major challenge (Zhao et al., 2019). Nonetheless, predicting the effects of human activities can be improved by recognizing similarities in sets of stressors within classes of human activities and in how different stressors affect rivers, as well as distinguishing the effect stressors have on direct vs. indirect regulation of ecosystem services (Stevenson and Sabater, 2015). Traditional methods assessed the effects of these stressors using physicochemical water quality parameters and their variation compared to a reference condition (Karr and Chu, 1999; Cairns, 2003); however, advanced methods have integrated hydrological variables and response of biological communities when developing multimeric indices to assess the health of aquatic ecosystems (Arman et al., 2019; Ruaro et al., 2020).
The use of biological communities in the assessment of riverine ecosystem health within the Afrotropical region has generally lagged behind equivalent studies in other regions (Ruaro et al., 2020). Although there are many aquatic organisms that can be included in the evaluation of river health (Herman and Nejadhashemi, 2015), regional indices have widely focused on macroinvertebrates (Dickens and Graham, 2002; Thirion, 2007; Masese et al., 2013, 2020c) that are rarely identified to species level and have some inaccuracy due to ecological and physiographical diversity between regions (Hering et al., 2010). Despite this constraint, these approaches are applied to studies within the Afrotropical region; however, the identification keys and indices are typically developed elsewhere. For instance, the Zambia Invertebrate Scoring System (Lowe et al., 2013), Tanzania River Scoring System (Kaaya et al., 2015) and macroinvertebrate based biotic score system (Aschalew and Moog, 2015) have all been modeled around the South African Scoring System (Chutter, 1998; Dickens and Graham, 2002). A few studies on river health have used other organisms, such as macrophytes (Achieng et al., 2014; Kennedy et al., 2016) and phytoplankton (Oberholster, 2011; Ngodhe et al., 2013). Surprisingly, the Fish Response Assessment Index that was developed more than a decade ago (Kleynhans, 2007) has not been widely adopted in the Afrotropical region, yet fish communities have significantly declined.
The Lake Victoria Basin (LVB) of East Africa has an estimated population of 40 million, with a density of more than 500 persons per km2, and is largely rural and highly dependent on land, forests and river catchments (World Bank, 2016; Sayer et al., 2018a; Olaka et al., 2019). It is dominated by agricultural activities, with 85% of the population dependent on agriculture as their major economic and livelihood activity (Lake Victoria Basin Commission, 2007). These range from small- and medium-scale cultivations to mechanized large-scale cultivation systems, characterized by the high use of fertilizers, pesticides and herbicides, as well as supplementary irrigation (Lake Victoria Basin Commission and GRID-Arendal, 2017). The LVB has experienced a rapid decline in biodiversity, with up to 76% of endemic species threatened with extinction, yet there is a dearth of basic information on the distribution and status of many freshwater species (Sayer et al., 2018a,b). Unsustainable changes in land use that significantly influence ecosystem structure and functioning (Lambin et al., 2003; Turner et al., 2003; De Groot et al., 2010) have impacted river catchments (Ochola, 2006; Odada et al., 2009; Masese et al., 2013; van Soesbergen et al., 2019; Nyilitya et al., 2020), affecting the distribution of fish species in river networks within the LVB (Achieng et al., 2020). Previous studies on the impact of human activities on riverine fish species distribution and biological characteristics within the LVB focused on lower reaches of the basin or were limited to specific rivers (Whitehead, 1959; Corbet, 1961; Masese et al., 2020a). They pre-date some of the rapidly changing uses of land and environmental conditions, and do not capture the state of current fish communities and overall ecosystem health status (Masese and McClain, 2012; Masese et al., 2020a). To develop fish indices that will reliably assess the health of riverine ecosystems in the LVB, it is necessary to consider fish communities that reflect the period of disturbance, as disturbance gradients are associated with losses of sensitive or intolerant species and increases in tolerant species (Vázquez and Simberloff, 2002; Davies and Jackson, 2006). As a result, species that are considered generally sensitive or tolerant to human disturbances are commonly used as indicators of healthy ecosystems or ecosystem deterioration respectively (Segurado et al., 2011; Zeni et al., 2017; Brejão et al., 2018).
Ranking of species tolerance to human perturbations in riverine ecosystems has been based on qualitative professional judgments and/or literature from outside the LVB, usually with little support from empirical, ecological or physiological data (Wang et al., 2018). The tolerance rankings of other species have been based on simple mathematical explorations, which are easy to implement, but do not account for natural or multiple environmental variables (Lenat, 1993; Segurado et al., 2011). With increased computing power and multivariate methods, quantitative evaluation of environmental variability and taxa response along multiple stressor gradients have been possible through evaluation of similarity–dissimilarity or correlation–covariance matrices (Jongman et al., 1995; Hermoso et al., 2009; Achieng et al., 2017). For instance, ranking species tolerance has been possible using principal component analysis (PCA), whereby eigenvalues are used to determine species tolerance along a gradient of a perturbation (Jongman et al., 1995; Segurado et al., 2011). Understanding fish species tolerance to environmental perturbation is essential when formulating community metrics to develop ecological indices for assessing riverine ecosystem health. Only two published studies have developed a fish-based index of biotic integrity (IBI) for rivers (Raburu and Masese, 2012) and wetlands (Naigaga et al., 2011) in the LVB; however, neither quantitatively computed tolerance ranking for species in response to environmental gradients.
In this study, we assessed the health of four river catchments in the LVB in Kenya using fish assemblages and water quality parameters. This was achieved by mapping land use at the river catchments, using cropland as a proxy for agricultural activities, which are known to be a dominant stressor at the basin. We ranked fish tolerance to perturbation through the concept of niche breadth (NB) using multivariate PCA and eigenvalues as the first tolerance ranking in the region. This allowed us to develop fish IBI to assess the health of these rivers in the LVB. Given the recent intensification of land activities in the basin, we predicted that fish communities have largely declined in response to stressors facing these ecosystems and that the responses are basin specific due to variations in stressors and their intensity at different catchments. In addition, we proposed that the cumulative effect of stressors can be used to rank fish tolerance to perturbation and depict river health. This approach is unique in that it is developing specific indices for Afrotropical ecosystems, rather than borrowing and modifying methods from other regions or using species responses to stressors relevant to temperate and subtropical regions.
Materials and Methods
Study Area
This study focused on water quality and fish species in four river catchments, Mara, Nyando, Nzoia and Sondu–Miriu, on the Kenyan side of the LVB (Figure 1). Of the four rivers, the Mara River is the transboundary between Kenya and Tanzania and the lifeline of the Maasai Mara National Reserve (MMNR) in Kenya and Serengeti National Park (SNP) in Tanzania. All the four rivers originate in the forested western slopes of the Mau Escarpment. In their upper and middle reaches, these rivers drain high potential areas for agricultural production with mean annual rainfall ranging from 1,350 to 2,400 mm (Olaka et al., 2019). Rainfall displays a bimodal distribution with two distinct peaks from March to May (long rains) and October to December (short rains) (Kizza et al., 2009). The rivers are important for domestic, industrial and irrigation water supplies and also support navigation and energy production. They also have exceptional biodiversity resources rich with native and endemic species (Masese et al., 2020a; Pringle et al., 2020).
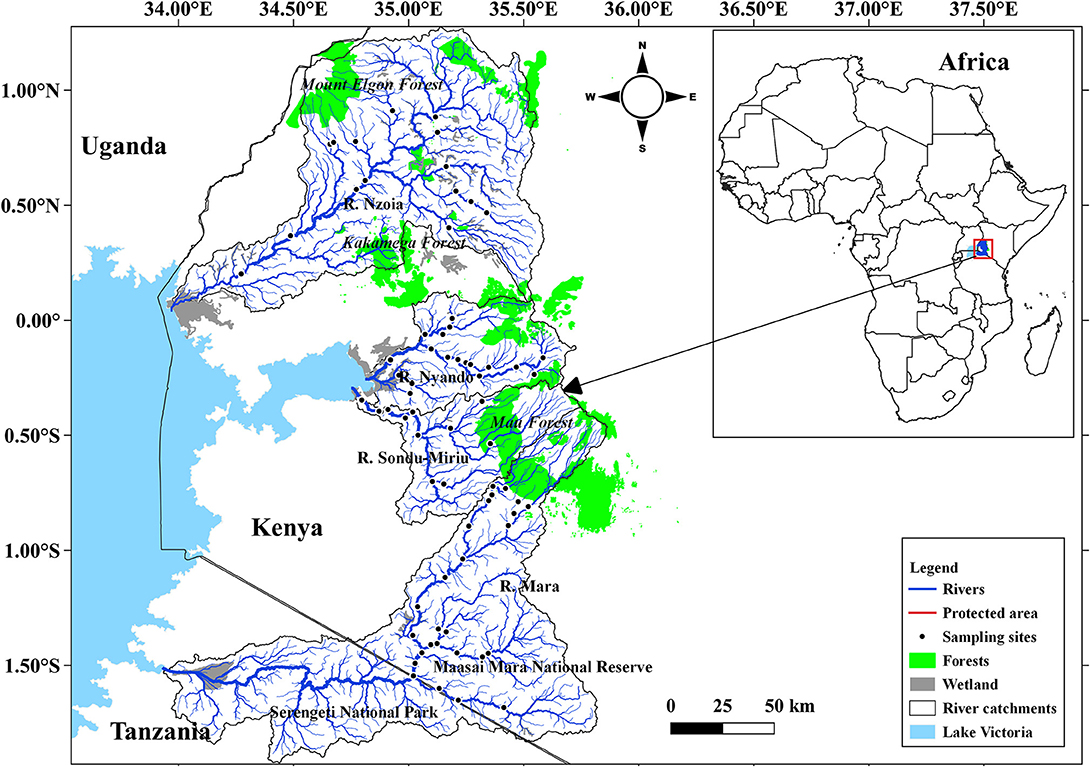
Figure 1. Sampled river catchments and location of sampled stations along Rivers Mara, Nyando, Nzoia, and Sondu–Miriu on the Kenyan side of the Lake Victoria Basin.
The four river catchments differ considerably in their disturbance gradients. Although the Mara River catchment has the least land area utilized for crop farming in the headwater and few urban areas in the middle reaches compared to the other catchments, it has undergone significant changes in land use over the last five decades with increased sediment load as a result of pollution (Dutton et al., 2018a). A considerable proportion of the middle and lower reaches are under protection as part of the MMNR and SNP with the nomadic Maasai community grazing large herds of livestock in the area. The livestock and large wildlife (mainly hippopotamus) are major sources of organic matter and nutrients in the Mara River and its tributaries (Subalusky et al., 2015; Dutton et al., 2018b; Iteba et al., under review). In its headwater, the Sondu–Miriu River has large-scale tea plantations by multinationals practicing conservation farming, maintaining riparian zones along streams. However, the river has lost substantial forest cover in the past, and this has been linked with increased levels of sediments and nutrients in the river (Jacobs et al., 2017; Kroese et al., 2020). The river also experiences a number of influences in its middle reaches and lower reaches, such as tea processing factories and growing urbanization, subsistence agriculture and hydropower production. The Nyando catchment has the most varied disturbance gradients with large-scale tea farming upstream, processing factories and agrochemical industries at middle reaches and mixed farming with urbanization downstream. A number of agroprocessing industries, such as the Muhoroni and Chemelil sugarcane processing factories, have been a source of water pollution in the river (Raburu and Masese, 2012). The Nzoia River drains the grain basket of Kenya, and its catchment is dominated by large-scale commercial agriculture in the upper and middle reaches. There is also extensive mixed farming in the middle and lower reaches. Potential sources of pollution in the river include agricultural and urban run-off and wastewater discharges from big cities (such as Eldoret and Kitale), sugarcane processing factories and the Webuye Panpaper Mills, which is currently dormant but has a history of water pollution (Orori et al., 2006; Achieng et al., 2017; K'oreje et al., 2018).
Field Sampling
A total of 68 sites were sampled between September 2018 and February 2020, with 26 sites in Mara, 17 in Nyando, 14 in Nzoia and 11 in Sondu–Miriu (Figure 1). Site selection was based on their location on the fluvial continuum to capture point and nonpoint sources of pollution and obvious sources of habitat degradation, such as livestock watering points and hippopotami pools. Site selection also considered catchment size, land use at the catchment and accessibility, with all major tributaries for each river sampled. Dissolved oxygen concentration, temperature, total dissolved solids (TDS), salinity and electrical conductivity (EC) were measured in situ using a hydrolab (YSN professional series model; ProtoComm II L/N 12G100510). Water samples were also collected using HDPE bottles for analysis of nutrients [nitrates (NO3), nitrite (NO2), ammonium (NH4) and soluble reactive phosphorus (SRP)] using standard methods (APHA, 2005).
Fish samples were collected by a generator-powered electrofisher (Honda GX240 8 HP; 400 V 10 A) and a backpack shocker (Achieng et al., 2020; Masese et al., 2020a). Sampling was done during daylight hours and stunned fish collected with a scoop net. Captured fish were identified, counted, weighed (0.1 g) and length (cm) measured. Specimens of each species were preserved in 75% ethanol for subsequent confirmation of species identification, with the remaining live fish returned to the river. Identification was done to species level using a number of taxonomic keys (Eccles, 1992; Skelton, 1993). Feeding habits/trophic levels were identified using the FishBase database (Froese and Pauly, 2019).
Data Analyses
Land Use Classification and Statistical Analysis
Land use classification and catchment maps were generated with QGIS 3.14, using Semi-Automatic Classification plug-in to download sentinel-2 images during the study period (Congedo, 2020a,b). The satellite images were preprocessed and processed for all the band sets, mosaic, clipped and supervised classifications were done for land use/land cover (Akgün et al., 2004; Huth et al., 2012; Congedo, 2016; Herbei et al., 2016) in each of the four catchments, with four categories of land use (forest, grassland, cropland and shrubland). Water quality measurements were explored before further analysis using box-and-whiskers plot to visualize summaries and compare their variation (Williamson et al., 1989; Dekking et al., 2005; Hubert and Vandervieren, 2008) at the catchments. The measurements were then natural log (ln) transformed to satisfy the assumptions for parametric general linear model analysis of variance (GLM-ANOVA), which was used to infer significant difference (Hothorn et al., 2008; Madsen and Thyregod, 2010) in the measured water quality parameters between catchments. Moreover, PCA was used to determine the components that explained most of the variation and identified water quality parameter measurements that contributed to these variations at the catchments (Achieng et al., 2017). Fish assemblage were analyzed with one-way analysis of similarity (ANOSIM) to inferred significant dissimilarity in fish communities at the catchments, while similarity percentages (SIMPER) was used to separate the fish into relative abundance of specific species that contributed to the dissimilarity at catchments (Álvarez et al., 2017; Achieng et al., 2020; Masese et al., 2020a). Canonical correspondence analysis (CCA) was then used to infer significant relationships between fish species and environmental variables (O'Connell et al., 2004; Hoeinghaus et al., 2007; Junqueira et al., 2016) at the four catchments. In addition, Pearson network correlation analysis (PNCA) was used to infer the relationship between environmental variables (water quality parameters and proportional land use as forest and agriculture) and fish community metrics (species richness, trophic structures, taxonomic composition and species tolerance) (Mamun and An, 2020). Finally, fish community metrics were used to develop the Fish-based IBI. PCA and PNCA were plotted with R software (R Core Team, 2020; RStudio Team, 2020) using packages ggplot2 and qplot (Wickham, 2016) in the R Environment, whereas CCA, ANOSIM and SIMPER were analyzed using PAST software version 4.03 (Hammer et al., 2001).
Tolerance Values Based on the Concepts of Niche Breadth
We estimated the NB of species along the main environmental gradient (Segurado et al., 2011). This measure was assumed to be a surrogate of species tolerance to human-induced pressures, based on an hypothesis that generalist species (wide NB) are more tolerant to pressures than specialist species (narrow NB), according to the specialization–disturbance hypothesis (Vázquez and Simberloff, 2002; Segurado et al., 2011; Slatyer et al., 2013). This indicates that as instream habitats are simplified and homogenized, populations of specialist species often decline or are extirpated, whereas generalist species tend to increase in abundance (Zeni et al., 2017; Brejão et al., 2018). The main environmental gradient was based on the scores of the first and second axes of a PCA calculated from all environmental variables considered in the study. NB was computed as the mean standard deviation of the scores of the two first PCA axes at sites (site scores/loading or vector matrix) where a particular species was present, weighted by their eigenvalues (2.59 and 2.18, respectively) from the PCA as follows;
where NB = niche breadth, PCi = principal component loading for each site where species i is present at all the catchments, PCmean = mean of the principal component loadings for all sites where species i is present, and PCeigenvalue = eigenvalue for the PCA.
IBI Model and Community Similarity
The IBI was computed from 12 metrics, some of which were previously used in the region (Raburu and Masese, 2012). Metrics 1 and 2 represented the total number and percentage of native species respectively. Metrics 3, 4 and 5 represented the number of benthic riffle, benthic pool, and pelagic pool species, respectively. Metrics 6 and 7 considered the number of sensitive species and proportion of tolerant species, whereas metrics 8, 9 and 10 evaluated the proportion of omnivorous, insectivorous, and carnivorous, respectively. Finally, metrics 11 and 12 were computed from Simpson Dominance Index and Margalef Index. Each metric was assigned a value of 5, 3 or 1 (Harris and Silveira, 1999; Raburu and Masese, 2012; Mamun and An, 2020) and river health was determined by adding the value for each metric and categorizing the results as excellent (36–40), good (28–34), fair (20–26), poor (14–18), or very poor (8–13) (Atique and An, 2018; Mamun and An, 2020).
Results
Land Use Change and Water Quality Analysis
The four catchments were 13,493, 12,786, 3,613 and 3,451 km2 for Mara, Nzoia, Nyando and Sondu–Miriu respectively. There was extensive cover of shrubland (60.1%) and grassland (32.9%) in the Mara catchment (Figure 2A), grassland (41.6%) and cropland (32.7%) in the Nzoia catchment (Figure 2B), shrubland (42.6%) and cropland (41.8%) in the Nyando catchment (Figure 2C) and shrubland (36.0%) and grassland (30.6%) in the Sondu–Miriu catchment (Figure 2D). Of the four catchments, forest was proportionately largest in the Sondu–Miriu catchment (20.4%) and smallest in the Mara and Nyando catchments (4.6%), whereas the proportion of cropland was largest in the Nyando catchment (41.8%) and smallest in the Mara catchment (2.4%).
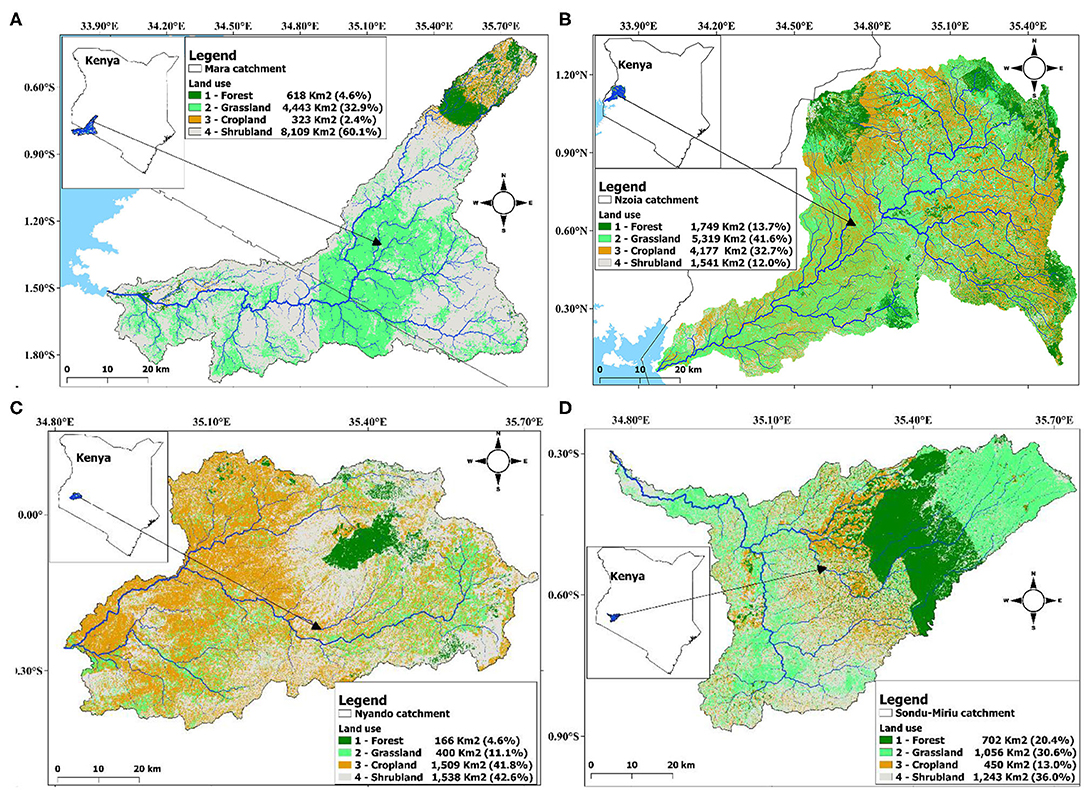
Figure 2. Area in km2 and percent forest, grassland, cropland and shrubland within the river catchments, (A) River Mara, (B) River Nzoia, (C) River Nyando and (D) River Sondu–Miriu of the Lake Victoria Basin.
GLM-ANOVA inferred significant differences in all water quality parameters (p <0.001) at catchment scale, except for temperature (Supplementary Table 1). This was also confirmed with box-and-whiskers plot (Figure 3A). EC, TDS, salinity and dissolved oxygen concentration were significantly lower in the Sondu–Miriu River (Supplementary Table 1), but with very high variation at sites in the Mara River, ranged from 44.0 to 4,202 μS/cm, 0.03 to 2.73, 0.02 to 2.24 and 0.84 to 13.37 mg/L, respectively (Supplementary Table 1). Three sites in the Talek River tributary of the Mara River, which is seasonal and hosts the largest population of livestock and hippopotami, recorded the highest levels of EC, salinity and TDS (Figures 3B–D). Dissolved oxygen varied the most (Figure 3E) while SRP, HN4, NO2 and NO3 were significantly lower in Mara River (Figures 3F–I; Supplementary Table 1), but did not differ between the Nzoia and Sondu–Miriu Rivers. NO2 concentrations were highest in the Sondu–Miriu River (Figure 3I), whereas SRP and NH4 concentrations were highest in the Nzoia and Nyando Rivers (Figures 3F,G).
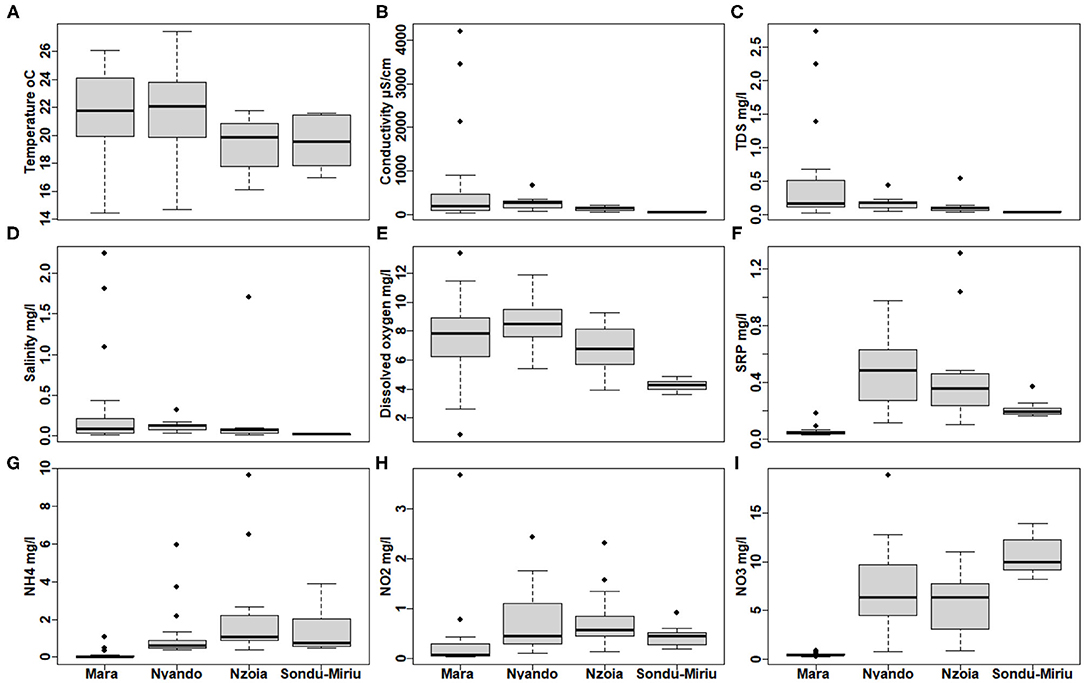
Figure 3. Variation in water quality parameters at the four catchments within the Lake Victoria Basin. (A) Temperature, (B) conductivity, (C) total dissolved solids (TDS), (D) salinity, (E) dissolved oxygen concentration, (F) soluble reactive phosphorus (SRP), (G) ammonia (NH4), (H) nitrite (NO2) and (I) nitrates (NO3).
PCA identified the water quality parameter measurements that contributed to the observed variation in the four catchments, with components 1 and 2 accounting for up to 53% of the variance (Figure 4A). Component 1 explained 29% of the variation in the four catchments and showed that Nzoia and Nyando had similar stressors (NO3, NH4, SRP) as the major impacts (Figures 4A,B), with a high contribution from cropland as a proxy for agricultural activities. Component 2 explained 24% of the variation and highlighted conductivity, salinity, and temperature as key variables influencing variation in the Mara catchment (Figures 4A,C).
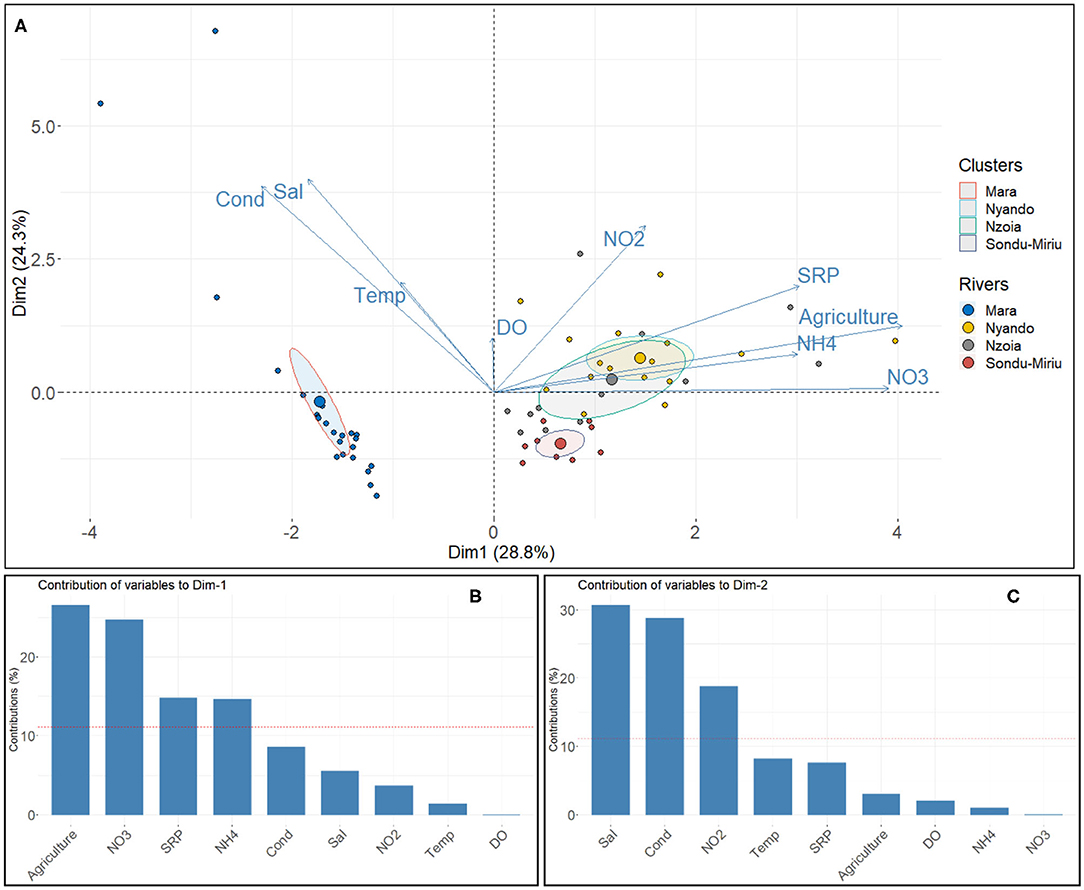
Figure 4. (A) Principal component analysis (PCA) of the influence of water quality parameters on the variability in the river basins, and the contribution of the water quality variables to (B) component 1 and (C) component 2 of the PCA.
Fish Composition, Sensitivity, and Abundance
A total of 2,269 fishes, representing 28 species, were sampled in the four catchments. Of these species, 11 were insectivorous, 10 omnivorous, five herbivorous and two carnivorous (Table 1). Labeobarbus altianalis, an omnivorous feeder, was the most abundant species (combined abundance = 621 individuals), with a relative abundance of 27.4% and the predominant species in the samples from both the Nyando and Mara catchments, with 297 (38.4%) and 216 (33.6%), respectively. The samples from Nzoia and Sondu–Miriu catchments were dominated by Enteromius neumayeri, an omnivorous feeder, with 263 (42.0%) and 168 (74.3%) respectively. E. neumayeri was also the second most abundant species in the total sample (503), with a relative abundance of 22.2%. The remaining fish species each had a relative abundance of <10%. Species sensitivity, calculated from the concept of NB using the PCA loadings of environmental variables at sites where species were present and weighted by their eigenvalues, identified Labeo victorianus and Clarias gariepinus as tolerant species, Chiloglanis somereni, Clarias theodorae, Gambusia affinis and Haplochromine species as intolerant species, whereas 13 species were moderately tolerant (Table 1). Species that were sampled in only one river and one site (n = 9) could not be used to determine sensitivity.
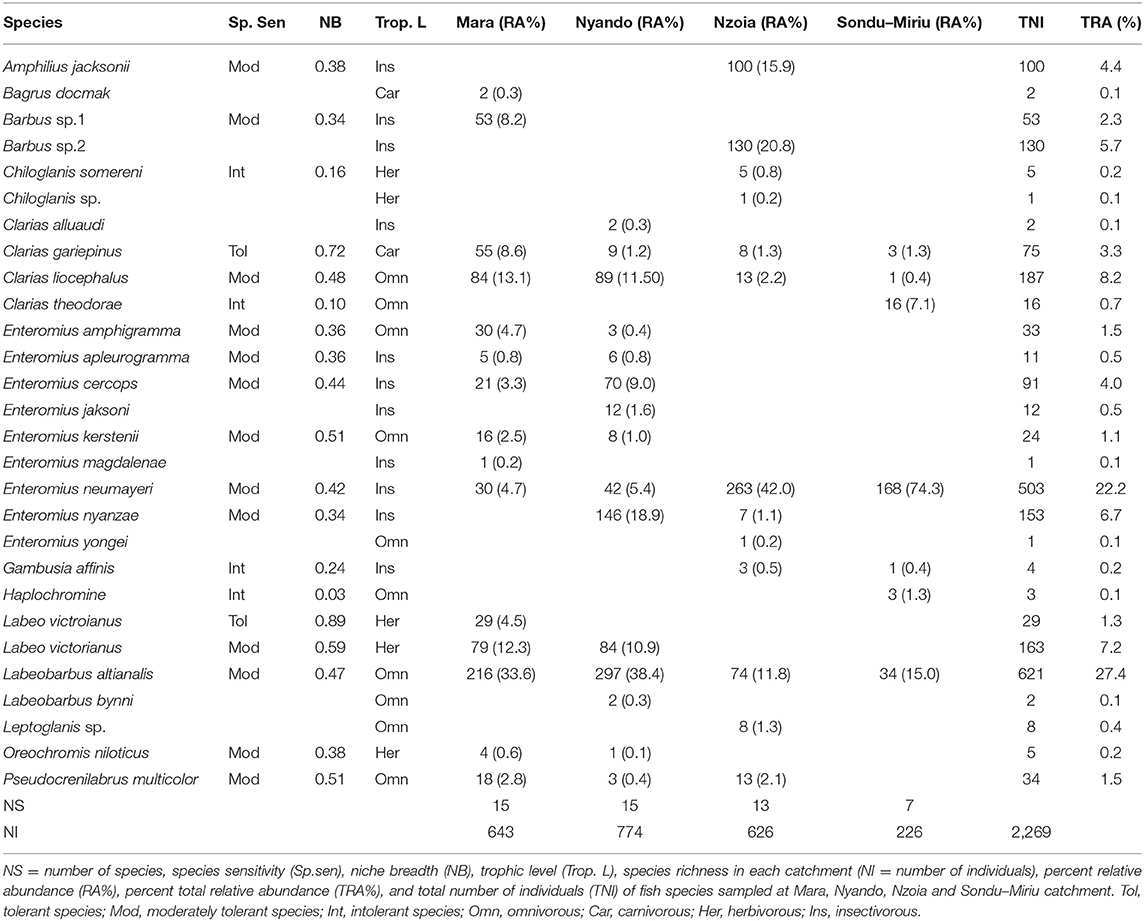
Table 1. Distribution, relative abundance, trophic level, and sensitivity or tolerance of fishes in the Mara, Nyando, Nzoia and Sondu–Miriu rivers, Lake Victoria Basin, Kenya.
One-way ANOSIM for fish composition and abundance at the catchment, with the rivers as factors, indicated significant dissimilarity (R = 0.155, p = 0.001). SIMPER separated the difference in composition of fish species to relative abundance of a few species (Table 2). The difference in species composition was as a result of a few species in most of the catchments. For instance, between the Mara and Nzoia catchments, Mara and Nyando catchments, Nyando and Nzoia catchments, Mara and Sondu–Miriu catchments and Nyando and Sondu–Miriu catchments, L. altianalis contributed 14.30, 16.23, 20.16, 24.83 and 31.31% of the dissimilarities respectively. The second species that contributed to dissimilarities at the catchments was E. neumayeri at 15, 18.46, 19.98, 21.69, and 23.46% between Nyando and Sondu–Miriu, Mara and Sondu–Miriu, Nyando and Nzoia, Nzoia and Sondu–Miriu and Mara and Nzoia catchments respectively. Other species, like Enteromius nyanzae, contributed the most dissimilarity in fish composition between the Mara and Nyando catchments (29.26%), whereas Chiloglanis somerini and Amphilius jacksonii contributed the most dissimilarity (29.68 and 22.83% respectively) in species composition between Nzoia and Sondu–Miriu catchments. The overall dissimilarity at the catchments ranged between 35.22 and 84.35%, with Mara and Nyando catchments having the least dissimilarity.
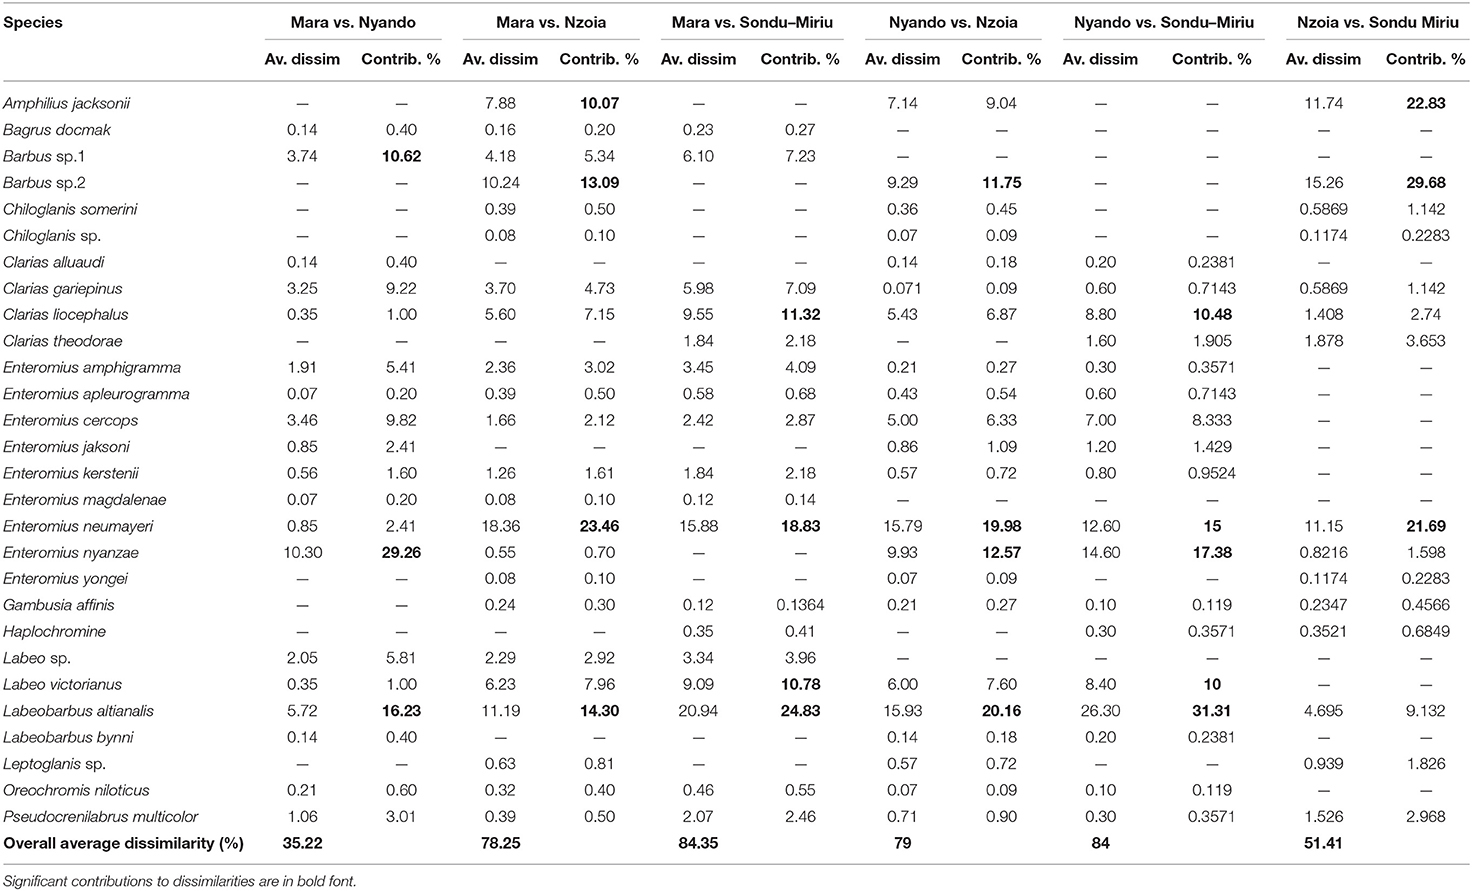
Table 2. ANOSIM percentage of fish abundance at four rivers catchments in Lake Victoria Basin, Kenya.
CCA identified the influence of water quality variables and agricultural activities on fish assemblage as significant (p = 0.006) with components 1 (32%) and 2 (20%) providing 52% of the assemblage variability in the four catchments (Figure 5). It revealed significant relationships between water quality parameters and fish species at the catchments and sites. Fish species (C. gariepinus, L. victorianus, Enteromius amphigramma, Enteromius cercops and Pseudocrenilabrus multicolor) at the Mara and Nyando catchments were constrained with high levels of conductivity, salinity, temperature, NO2 and dissolved oxygen (Figure 5), whereas fish species, including Enteromius yongei, Leptoglanis species, Haplochromine species and C. somereni, at the Nzoia and Sondu–Miriu catchments were constrained with NH4, NO3, SRP and land use of cropland (as a proxy to agriculture) (Figure 5).
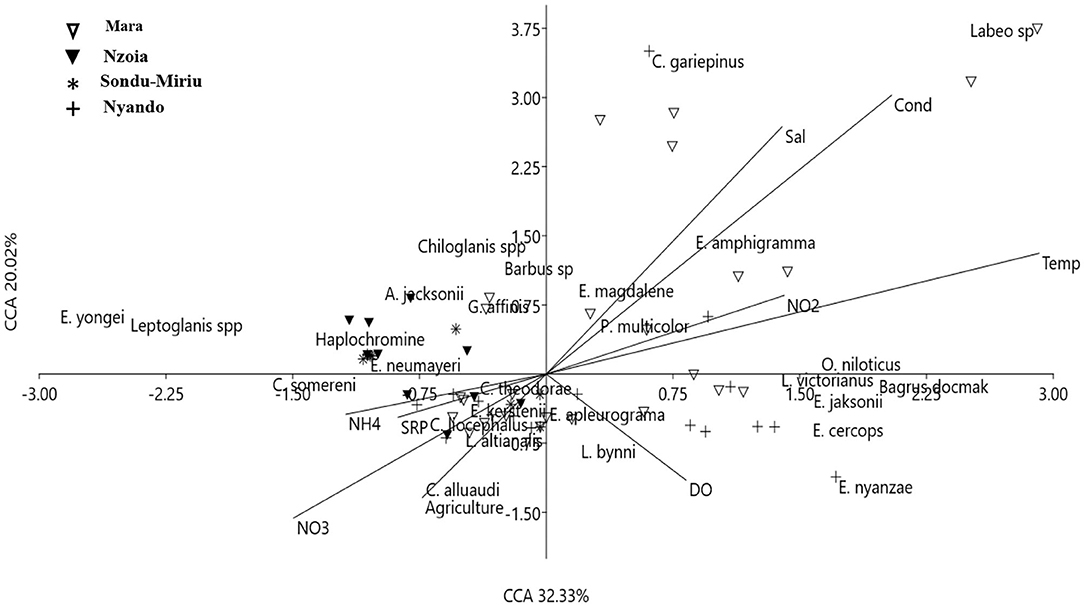
Figure 5. Canonical correspondence analysis of the effects of water quality on fish assemblages at the four catchments in the Lake Victoria Basin.
Correlation Between Environmental Variables, Trophic Levels, Land Use, and Development of Index of Biotic Integrity
The relationships between land use, water quality measurements, trophic level and species sensitivity were evaluated using PNCA (Figure 6). The analysis correlated the forested sites with agricultural activities, NH4, NO3, SRP and intolerant fish species, giving a correlation coefficient ranging from 0.22 to 0.69. All the tolerant fish species were carnivorous feeders, and were found in sites with high conductivity, TDS, salinity and NO2, with correlation coefficients ranging from 0.30 to 0.97 (Figure 6). Omnivorous, insectivorous and herbivorous fish were categorized as moderately tolerant to the measured water quality parameters, with correlation coefficients from 0.34 to 0.72. The moderately tolerant fish species either had a weak correlation with the two major categories of disturbance gradients (agriculture and organic loading) or had variable correlations (Figure 6).
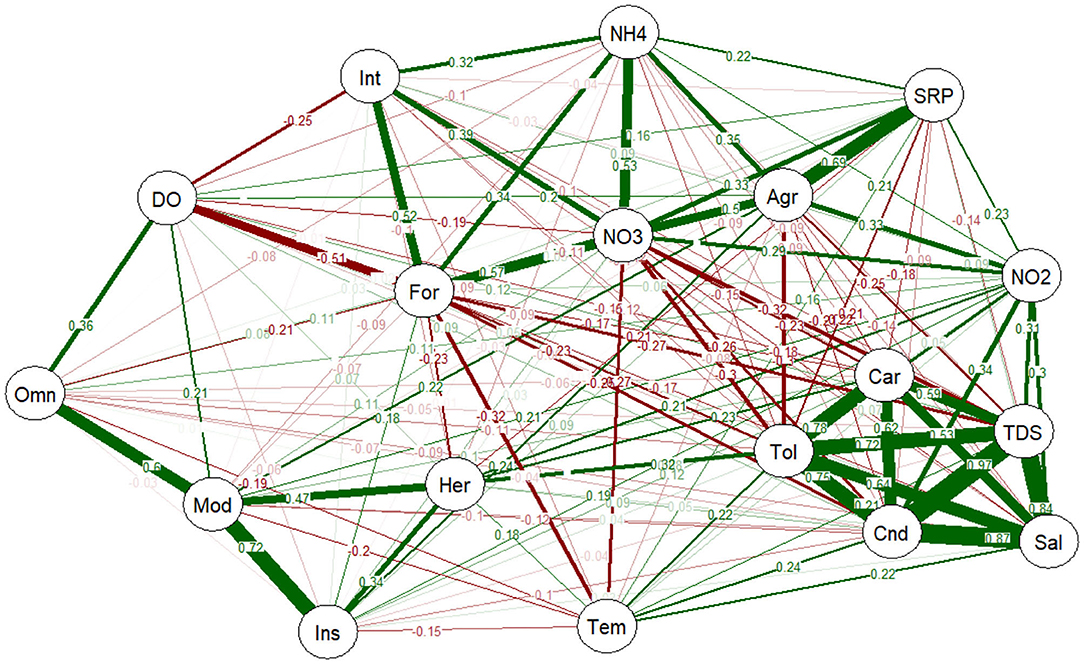
Figure 6. PNCA of environmental gradients with species sensitivity, trophic levels, and land use (forest and agriculture). Thick lines indicate greater value of correlation, whereas narrow lines indicate smaller value of correlation. Green lines are positive correlations, whereas red lines are negative correlation. Omn, omnivorous; Car, carnivorous; Her, herbivorous; Ins, insectivorous; Tol, tolerant species; Int, intolerant species; Mod, moderately tolerant species; For, forested area; Agr, agriculture; DO, dissolved oxygen; Tem, temperature; Cnd, conductivity; TDS, total dissolved solid; Sal, salinity; NO2, nitrite; NO3, nitrate; SRP, soluble reactive phosphorus; NH4, ammonium.
The IBI was computed from 12 metrics categorized into three groups, namely, fish composition and abundance, trophic level and diversity metrics (Table 3). There were no ranked sensitive species sampled in the Mara and Nyando catchments, whereas the Nzoia and Sondu–Miriu catchments had two and three intolerant/sensitive species respectively. Benthic riffle, pool and pelagic pool species were in all the catchments but at varying numbers. The Mara catchment had the most benthic riffle species (n = 5) and the least benthic pool species (n = 1), while the Sondu–Miriu catchment had only one benthic riffle species and two benthic pool species (Table 3). Pelagic pool species were relatively abundant, with nine species at the Mara and Nyando catchments and four species at the Sondu–Miriu catchment (Table 3). The Mara and Sondu–Miriu catchment also had the highest proportion of tolerant species (13.33 and 14.29% respectively), despite being in the same scoring category (3) as the Nzoia and Nyando catchment. The proportion of carnivorous fish species scored low (1) in all four catchments, whereas the proportion of omnivorous and insectivorous scored lowest in Mara (1) and highest in Nzoia (5). The Simpson dominance index scored highest in the Mara, Nyando, and Nzoai (5) catchments and intermediate (3) at the Sondu–Miriu catchment, whereas the Margalef index scored low in all the catchments (Table 3). The IBI, with scores ranging from 12 to 60 and intervals of 12 units, was categorized into very poor (12), poor (12–24), fair (24–36), good (36–48) and very good (48–60). The health of the four catchments were all fair, with Sondu–Miriu being the lowest (26) followed by Mara and Nyando (28) and finally Nzoia (34) (Figure 7).
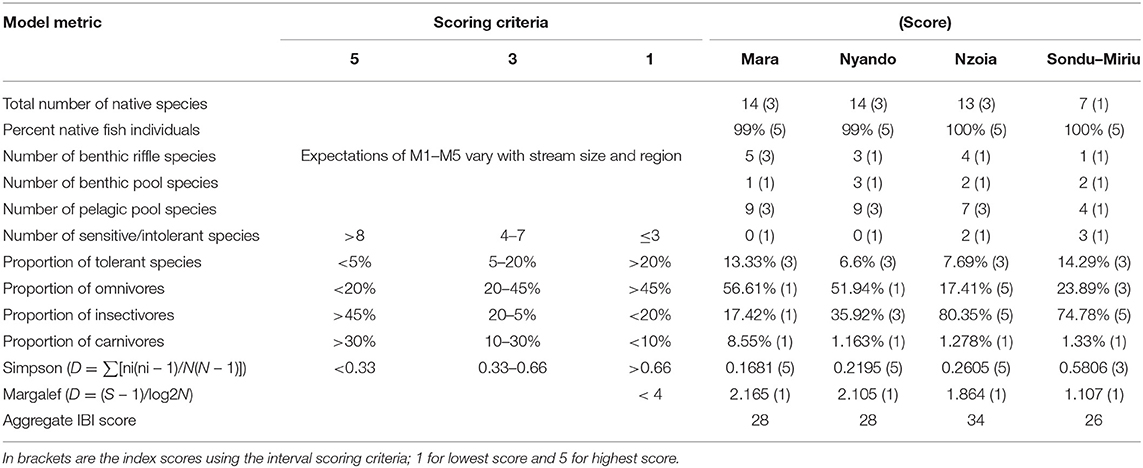
Table 3. Candidate metrics used in developing the index of biotic integrity for biological assessment of the ecological health of rivers in Lake Victoria Basin, Kenya.
Discussion
In this study, we set out to develop a fish-based IBI to assess the health of rivers in the LVB of Kenya. The concept of NB adequately ranked fish species tolerant to the environmental gradients and fish community metrics of species richness, trophic structures, taxonomic composition and species tolerance aggregated their response to stressors with a final score as an indication of river health. We showed that the proportion of agricultural land use in the LVB varies across the catchments. Cropland occupied between 13 and 42% of unprotected catchments (Nzoia, Nyando, and Sondu–Miriu) but only ~2.4% of the Mara catchment, which is extensively a protected area with the MMNR on the Kenyan side and the SNP on the Tanzanian side. Although Mngube et al. (2020) have shown an increase in the proportion of agricultural land use at the Mara catchment within the unprotected area, which could be double our proportional agricultural land use, cropland at the catchment is still less than the other three catchments. This confirms our results that unprotected areas within river catchments of the LVB support large populations that are rural and depend on agriculture as their major economic activity.
Cropland was used as a proxy for agricultural activities within the four catchments, with the understanding that ~85% of the LVB population depends on agriculture, essential to local and national economies (Ochola, 2006), particularly in terms of food security, income generation and employment. Catchment degradation and land use activities, from the rapid population increase, were shown to vary from deforestation and overexploitation of the natural resources to heavily intensified agriculture throughout drainage of the LVB (Verschuren et al., 2002), whether small-scale subsistence or large-scale commercial agriculture with heavy mechanization and use of fertilizers (Lake Victoria Basin Commission and GRID-Arendal, 2017). The highest population densities and agricultural activities occur in the drainages of Kenyan, Rwandan and Burundi rivers that together contribute ~90% of total river discharge into Lake Victoria (Balirwa and Bugenyi, 1988). Our results confirmed that, except for the protected areas with their restricted access and increased level of monitoring, conservation and management, these catchments are increasingly threatened by human activities. Protected areas are not entirely exempt from other stressors, with rangelands (savannah, grasslands and shrublands) within the Mara catchment shown to have declined from 79% in 1973 to 52% by 2000, and forest areas reducing by 32% within the same period (Oruma, 2017). Other disturbances, such as discharges of municipal and industrial wastewaters from urban centers, deforestation and deterioration of riparian vegetation and introduction of exotic species and livestock, have also impacted on the catchment (Masese and McClain, 2012; Masese et al., 2018).
Variation in water quality parameters is evidence of stressors that have contributed to deterioration in river water quality in many of the LVB rivers (Simonit and Perrings, 2011; Twesigye et al., 2011). Based on the selected water quality parameters, we inferred significant variation in nutrient load (NO3, SRP, NH4, and NO2) in the catchments and sites, especially within the Nyando and Nzoia rivers, which had the highest proportion of cropland. The Lake Victoria Basin Commission and GRID-Arendal (2017) report showed that of the 40 million people in the LVB, more than 12.5 million reside on the Kenyan side of the basin, with 92% of this a rural population and an average population density of more than 500 people/km2, with some places exceeding 1,200 persons/km2 (Olaka et al., 2019). This population density, combined with a predominance toward rural living, equates to a need for greater and enhanced agricultural activities. The growing practice of large-scale cultivation systems characterized by the heightened use of fertilizers, pesticides and herbicides, as well as supplementary irrigation, threatens the environmental well-being of the region (Lake Victoria Basin Commission, 2007, 2012). The situation is particularly critical where demands to meet the needs of the rapidly increasing human and livestock populations, in the form of space, shelter, food, water, health services and waste disposal, have placed increasing pressure on the resources of the basin (Lake Victoria Basin Commission, 2011).
The Mara River catchment differs from the other three catchments in terms of land use and water quality stressors. The river is also the most hydrologically varied, with tributaries being predominantly seasonal and with high EC. The basin has the smallest proportion of cropland, but the largest population of livestock and wildlife in the protected areas of the MMNR in Kenya and the SNP in Tanzania. Studies have shown that the middle reach rangelands of the catchment contain large herds of livestock, with more than 220,000 cattle estimated to live in the Talek subcatchment (Ogutu et al., 2011), and wildlife, including more than 4,000 Hippopotamus amphibius (Kanga et al., 2011). Such high livestock and wildlife numbers collectively contribute to a high deposit of organic matter and nutrients into the river (Subalusky et al., 2015; Dutton et al., 2018b; Masese et al., 2020b), leading to the high conductivity, salinity and TDS data shown in our results. Analysis of the water quality parameters identified two key stressors as nutrient loading from diffused agricultural sources and organic loading, mainly from large herds of domestic and wild grazers in the Mara River (Kanga et al., 2011; Masese et al., 2020b). These stressors were shown to have significant and distinct impacts on fish communities in the rivers. However, in addition to our findings, the basin is impacted by multiple stressors arising from land use and land cover changes, agricultural expansion and intensification (leading to habitat loss/fragmentation) to human intrusions and the more than 40 million inhabitants at the basin (World Bank, 2016). Despite these disturbances and natural system modifications (Makalle et al., 2008; Odada et al., 2009; Twesigye et al., 2011), the rivers are of great socioeconomic value to people and rich with biodiversity, including fish communities.
The previously high biodiversity of species richness and endemism in the LVB (Darwall et al., 2011; Sayer et al., 2019) has drastically reduced, with fish species composition and abundance in river catchments and satellite water bodies, including wetlands, being threatened by catchment activities (Wakwabi et al., 2006; Achieng et al., 2020; Masese et al., 2020a). We found greater species diversity and abundance within the protected areas in the Mara catchment and low-order streams in the Nyando catchment than in other sites within the same catchments. These two catchments also had the highest species composition and richness, but with none of the ranked intolerant/sensitive species. This does not exclude sensitive or intolerant species in these rivers as the methodology used to rank species sensitivity required the species to be sampled in more than one site; hence, some nine fish species were not ranked, and five of these were either in the Mara or Nyando catchment. This included Bagrus docmak, which had previously been ranked as sensitive (Raburu and Masese, 2012), and Enteromius magdalenae and Labeobarbus bynni. The advantage of ranking species sensitivity calculated from the NB concept is that it does not require expert judgment on species response to stressors. It determines species response to the specific environmental gradients measured rather than a generalized response to stressors and therefore can be applied to the different stressor gradients within a catchment to compare how a species responds to different pollution gradients. However, it is not applicable to a species that has a narrow geographical range or is endangered and therefore difficult to sample, with the exception of samples that can be found at varying environmental gradients in the same location. Species composition and abundance was generally lower than previous studies, an indication that catchment management is a critical concern and an immediate consideration, whereas conservation of headwaters and low-order streams that are still species rich will be critical to prevent further loss.
Of the 19 fish species ranked in this study, the tolerance of nine species, A. jacksonii, C. gariepinus, Enteromius apleurogramma, E. cercops, Enteromius kerstenii, E. nyanzae, L. victorianus and P. multicolor, were similar to the previous study by Raburu and Masese (2012) in the same region. Four species, C. somerini, Clarias liocephalus, E. amphigramma and G. affinis, found in this study have not previously been reported, and three morphospecies (Barbus sp., Labeo sp. and Haplochromis sp.) were not identified to species level. In this study, the ranking of four species (C. theodorae, E. neumayeri, Oreochromis niloticus and L. altianalis), using NB computation, was not in agreement with list generated using the expert judgment method; however, their ranking did not vary considerably (Raburu and Masese, 2012). When comparing the two methodologies, some intolerant species were ranked as moderately tolerant or moderately tolerant species ranked as tolerant by the expert judgment method. This could be as a result of a species-specific response to a particular stressor; however, expert judgment generalized this response to that of multiple stressors.
Differences in fish composition in the catchments could be attributed to variations in the relative abundance of six species, predominantly L. altianalis, E. neumayeri and to a lesser extent A. jacksonii, E. nyanzae, C. liocephalus and L. victorianus. Moreover, CCA related the tolerant species (C. gariepinus and Labeo species) with high conductivity from organic load, whereas intolerant species (G. affinis, C. somerini and C. theodorae) had negative relationships with organic load. Moderately tolerant species did not show any strong relationship with either organic load or agriculture. A clear depiction of the relationship between stressors, species sensitivity (tolerant, moderately tolerant and intolerant), and land use (forest and agriculture) was shown with PCNA, confirming that the significant difference in species distribution, abundance and composition at the catchments was a response to stressors, as shown by the CCA. Apart from the stressors measured in this study, it is most likely that the fish assemblages also respond to other stressors, including those that are basin-specific. This suggests that management of riverine fish assemblages will be more effective at basin or subcatchment scales rather than at the larger LVB level (Achieng et al., 2020).
Fish species richness, tropic structures, taxonomic composition, species sensitivity and diversity indices were used as metrics to compute IBI, based on the concept that the values of these metrics change as a response to stressors. Studies have shown them to decline with increasing nutrients, organic matter and ionic material pollution (Kim and An, 2015, Mamun and An, 2020) and therefore an indication of disturbance. Although species richness and composition were high in the Nyando and Mara rivers, the proportions in the categories of trophic structure and number of benthic and pelagic species were quite low. This could be due to the high dominance of two species (L. altianalis and E. neumayeri), suggesting the apparent species richness and composition are still under threat. With all IBI scores in the four catchments ranging between 26 and 34, they were all evaluated to be in fair health.
Conclusion
Riverine fish species richness and composition in the LVB have declined in the past decades in response to increasing complexity and multiple stressors in the catchments of many rivers. This has resulted in the loss of sensitive species, species migration to headwaters, low-order streams and less polluted subcatchments or to protected areas with restricted access and increased levels of monitoring, conservation and management, as observed in the Mara catchment. It is difficult to quantify the number of species lost in the past decades due to a scarcity of data and the lack of regular monitoring. Our results demonstrate that the cumulative effect of stressors can adequately rank fish species tolerance to disturbance gradients and help to further develop regional metrics to assess and monitor river health. Multivariate methods have proven to be reliable in ranking species tolerance and can be used without prior knowledge of species biology and ecology. They can combine the effects of multiple variables and factors into species-specific responses along gradients of degradation, including some intrinsic characteristics, which are not easily observable. Although the measured variables were limited to nutrient and organic loading, which are significant contributors to catchment degradation, it is most likely that the fish assemblages also respond to hydrological variable, such as flow rates and discharge, and other stressors that are basin-specific, indicating that the management of riverine fish populations will be more effective at individual river basin or subcatchment levels rather than at an LVB scale. The fish-based IBI showed that all the catchments were in a fair health, although the evaluation of additional stressors may record different levels of species response and is therefore most likely to provide a more detailed assessment of ecological conditions in the rivers. Ecological conditions could also be evaluated at the site level, so as to eliminate confounding effects caused by upstream–downstream effects of pollutants and other disturbances. We also recommend conservation and management of the catchments with the protection of headwaters and lowland streams, which are still species rich, to prevent further loss of the exceptional biodiversity, which are native and endemic to the LVB.
Data Availability Statement
The original contributions presented in the study are included in the article/Supplementary Material, further enquiries can be directed to the corresponding author/s.
Ethics Statement
The animal study was reviewed and approved by the National Commission for Science, Technology and Innovation.
Author Contributions
AA, FM, SA, PR, and BK-A participated in data collection and drafting the manuscript. TC and CF participated in conceptualizing and drafting the manuscript. All authors contributed to the article and approved the submitted version.
Funding
This work was an output of the KISS Project funded by the Kenya National Research Fund-2016/2017 FY NRF Grants.
Conflict of Interest
The authors declare that the research was conducted in the absence of any commercial or financial relationships that could be construed as a potential conflict of interest.
Acknowledgments
We would like to thank technicians at Kenya Marine and Fisheries Research Institute, Kisumu, for help with field sampling. We were grateful to Augustine Sitati, Henry Lubanga and George Alal for assistance offered during field sampling and laboratory processing of samples.
Supplementary Material
The Supplementary Material for this article can be found online at: https://www.frontiersin.org/articles/10.3389/frwa.2020.620704/full#supplementary-material
References
Achieng, A. O., Masese, F.O., and Kaunda-Arara, B. (2020). Fish assemblages and size-spectra variation among rivers of Lake Victoria Basin, Kenya. Ecol. Indic. 118:106745. doi: 10.1016/j.ecolind.2020.106745
Achieng, A. O., Raburu, P. O., Kipkorir, E. C., Ngodhe, S. O., Obiero, K. O., and Ani-Sabwa, J. (2017). Assessment of water quality using multivariate techniques in River Sosiani, Kenya. Environ. Monit. Assess. 189:280. doi: 10.1007/s10661-017-5992-5
Achieng, A. O., Raburu, P. O., Okinyi, L., and Wanjala, S. (2014). Use of macrophytes in the bioassessment of the health of King'wal Wetland, Lake Victoria Basin, Kenya. Aquat. Ecosyst. Health Manage. 17, 129–136. doi: 10.1080/14634988.2014.908020
Akgün, A., Eronat, A. H., and Türk, N. (2004). “Comparing different satellite image classification methods: an application in Ayvalik District, Western Turkey,” in The 4th International Congress for Photogrammetry and Remote Sensing (Istanbul).
Álvarez, F. S., Matamoros, W. A., and Chicas, F. A. (2017). The contribution of environmental factors to fish assemblages in the Río Acahuapa, a small drainage in Central America. Neotrop. Ichthyol. 15, 1–11. doi: 10.1590/1982-0224-20170023
APHA (2005). Standard Methods for the Examination of Water and Wastewater, 21st Edn. Washington, DC: American Public Health Association.
Arman, N. Z., Salmiati, S., Said, M. I. M., and Aris, A. (2019). Development of macroinvertebrate-based multimetric index and establishment of biocriteria for river health assessment in Malaysia. Ecol. Indic. 104, 449–458. doi: 10.1016/j.ecolind.2019.04.060
Aschalew, L., and Moog, O. (2015). Benthic macroinvertebrates based new biotic score “ETHbios” for assessing ecological conditions of highland streams and rivers in Ethiopia. Limnol. Ecol. Manage. Inland Waters 52, 11–19. doi: 10.1016/j.limno.2015.02.002
Atique, U., and An, K. G. (2018). Stream health evaluation using a combined approach of multi-metric chemical pollution and biological integrity models. Water 10:661. doi: 10.3390/w10050661
Balirwa, J. S., and Bugenyi, F. W. B. (1988). An attempt to relate environmental factors to fish ecology in the lotic habitats of Lake Victoria: with 1 figure and 4 tables in the text. Int. Vereinig. Theor. Angew. Limnol. 23, 1756–1761. doi: 10.1080/03680770.1987.11898098
Brejão, G. L., Hoeinghaus, D. J., Pérez-Mayorga, M. A., Ferraz, S. F., and Casatti, L. (2018). Threshold responses of Amazonian stream fishes to timing and extent of deforestation. Conserv. Biol. 32, 860–871. doi: 10.1111/cobi.13061
Cairns, J. Jr. (2003). “Biotic community response to stress,” in Biological Response Signatures: Indicator Patterns Using Aquatic Communities, ed T. P. Simon (Boca Raton, FL: CRC Press), 13–20.
Chutter, F. M. (1998). Research on the Rapid Biological Assessment of Water Quality Impacts in Streams and Rivers. WRC Report No. 422/1/98. Pretoria: Water Research Commission.
Congedo, L. (2016). Semi-automatic classification plugin documentation. Release 4:29. doi: 10.13140/RG.2.2.29474.02242/1
Congedo, L. (2020b). Semi-Automatic Classification Plug-in Document. Availabe online at: https://www.researchgate.net/publication/344876862_Semi-Automatic_Classification_Plugin_Documentation_Release_7001_Luca_Congedo
Corbet, P. S. (1961). The food of non-cichlid fishes in the Lake Victoria basin, with remarks on their evolution and adaptation to lacustrine conditions. Proc. Zool. Soc. Lond. 136, 1–101. doi: 10.1111/j.1469-7998.1961.tb06080.x
Darwall, W., Smith, K., Allen, D., Holland, R., Harrison, I., and Brooks, E. (2011). The Diversity of Life in African Freshwaters: Underwater, Under Threat: An Analysis of the Status and Distribution of Freshwater Species Throughout Mainland Africa. Available online at: https://www.cabdirect.org/cabdirect/abstract/20113229330 (accessed October 23, 2020).
Davies, S. P., and Jackson, S. K. (2006). The biological condition gradient: a descriptive model for interpreting change in aquatic ecosystems. Ecol. Appl. 16, 1251–1266. doi: 10.1890/1051-0761(2006)016[1251:TBCGAD]2.0.CO;2
De Groot, R. S., Alkemade, R., Braat, L., Hein, L., and Willemen, L. (2010). Challenges in integrating the concept of ecosystem services and values in landscape planning, management and decision making. Ecol. Complex. 7, 260–272. doi: 10.1016/j.ecocom.2009.10.006
Dekking, F. M., Kraaikamp, C., Lopuhaä, H. P., and Meester, L. E. (2005). “Exploratory data analysis: numerical summaries,” in A Modern Introduction to Probability and Statistics (London: Springer), 231–243. doi: 10.1007/1-84628-168-7_16
Dickens, C. W. S., and Graham, P. M. (2002). The South African Scoring System (SASS) version 5 rapid bioassessment method for rivers. Afr. J. Aquat. Sci. 27, 1–10. doi: 10.2989/16085914.2002.9626569
Dudgeon, D., Arthington, A. H., Gessner, M. O., Kawabata, Z., Knowler, D., Leveque, C., et al. (2006). Fresh-water biodiversity: importance, threats, status and conservation challenges. Biol. Rev. 81, 163–182. doi: 10.1017/S146479310500695
Dutton, C. L., Subalusky, A. L., Anisfeld, S. C., Njoroge, L., Rosi, E. J., and Post, D. M. (2018a). The influence of a semi-arid sub-catchment on suspended sediments in the Mara River, Kenya. PLoS ONE 13:e0192828. doi: 10.1371/journal.pone.0192828
Dutton, C. L., Subalusky, A. L., Hamilton, S. K., Rosi, E. J., and Post, D. M. (2018b). Organic matter loading by hippopotami causes subsidy overload resulting in downstream hypoxia and fish kills. Nat. Commun. 9:1951. doi: 10.1038/s41467-018-04391-6
Eccles, D. H. (1992). Field Guide to the Freshwater Fishes of Tanzania. Rome:FAO Species Identification Sheets for Fishery Purposes.
Froese, R., and Pauly, D. (Eds.). (2019). FishBase. World Wide Web Electronic Publication. Available online at: www.fishbase.org
Hammer, Ø., Harper, D. A. T., and Ryan, P. D. (2001). PAST: Paleontological statistics software package for education and data analysis. Palaeontol. Electron. 4:9.
Harris, J. H., and Silveira, R. (1999). Large-scale assessments of river health using an Index of biotic integrity with low-diversity fish communities. Freshw. Biol. 41, 235–252. doi: 10.1046/j.1365-2427.1999.00428.x
Herbei, M. V., Popescu, C. A., Bertici, R., Smuleac, A., and Popescu, G. (2016). Processing and use of satellite images in order to extract useful information in precision agriculture. Bulletin of University of Agricultural Sciences and Veterinary Medicine Cluj-Napoca. Agriculture 73, 238–246. doi: 10.15835/buasvmcn-agr:12442
Hering, D., Borja, A., Carstensen, J., Carvalho, L., Elliott, M., Feld, C. K., et al. (2010). The European Water Framework Directive at the age of 10: a critical review of the achievements with recommendations for the future. Sci. Total Environ. 408, 4007–4019. doi: 10.1016/j.scitotenv.2010.05.031
Herman, M. R., and Nejadhashemi, A. P. (2015). A review of macroinvertebrate-and fish-based stream health indices. Ecohydrol. Hydrobiol. 15, 53–67. doi: 10.1016/j.ecohyd.2015.04.001
Hermoso, V., Clavero, M., Blanco-Garrido, F., and Prenda, J. (2009). Assessing freshwater fish sensitivity to different sources of perturbation in a Mediterranean basin. Ecol. Freshw. Fish 18, 269–281. doi: 10.1111/j.1600-0633.2008.00344.x
Hoeinghaus, D. J., Winemiller, K. O., and Birnbaum, J. S. (2007). Local and regional determinants of stream fish assemblage structure: inferences based on taxonomic vs. functional groups. J. Biogeogr. 34, 324–338. doi: 10.1111/j.1365-2699.2006.01587.x
Hothorn, T., Bretz, F., and Westfall, P. (2008). Simultaneous inference in general parametric models. Biometr. J. 50, 346–363. doi: 10.1002/bimj.200810425
Hubert, M., and Vandervieren, E. (2008). An adjusted boxplot for skewed distributions. Comput. Stat. Data Anal. 52, 5186–5201. doi: 10.1016/j.csda.2007.11.008
Huth, J., Kuenzer, C., Wehrmann, T., Gebhardt, S., Tuan, V. Q., and Dech, S. (2012). Land cover and land use classification with TWOPAC: towards automated processing for pixel-and object-based image classification. Rem. Sens. 4, 2530–2553. doi: 10.3390/rs4092530
Jacobs, S. R., Breuer, L., Butterbach-Bahl, K., Pelster, D. E., and Rufino, M. C. (2017). Land use affects total dissolved nitrogen and nitrate concentrations in tropical montane streams in Kenya. Sci. Total Environ. 603, 519–532. doi: 10.1016/j.scitotenv.2017.06.100
Jongman, R. H. G., ter Braak, C. J. F., and Van Tongeren, O. F. R. (1995). Data Analysis in Community and Landscape Ecology. Cambridge: Cambridge University Press.
Junqueira, N. T., Macedo, D. R., Souza, R. C. R. D., Hughes, R. M., Callisto, M., and Pompeu, P. S. (2016). Influence of environmental variables on stream fish fauna at multiple spatial scales. Neotrop. Ichthyol. 14:e150116. doi: 10.1590/1982-0224-20150116
Kaaya, L. T., Day, J. A., and Dallas, H. F. (2015). Tanzania River Scoring System (TARISS): a macroinvertebrate-based biotic index for rapid bioassessment of rivers. Afr. J. Aquat. Sci. 40, 109–117. doi: 10.2989/16085914.2015.1051941
Kanga, E. M., Ogutu, J. O., Olff, H., and Santema, P. (2011). Population trend and distribution of the vulnerable common hippopotamus Hippopotamus amphibius in the Mara Region of Kenya. Oryx 45, 20–27. doi: 10.1017/S0030605310000931
Karr, J. R., and Chu, E. W. (1999). Restoring Life in Running Waters; Better Biological Monitoring. Washington, DC: Island Press.
Kennedy, M. P., Lang, P., Grimaldo, J. T., Martins, S. V., Bruce, A., Lowe, S., et al. (2016). The Zambian Macrophyte Trophic Ranking scheme, ZMTR: a new biomonitoring protocol to assess the trophic status of tropical southern African rivers. Aquat. Bot. 131, 15–27. doi: 10.1016/j.aquabot.2016.01.006
Kim, J. Y., and An, K. G. (2015). Integrated ecological river health assessments, based on water chemistry, physical habitat quality and biological integrity. Water 7, 6378–6403. doi: 10.3390/w7116378
Kizza, M., Rodhe, A., Xu, C. Y., Ntale, H. K., and Halldin, S. (2009). Temporal rainfall variability in the Lake Victoria Basin in East Africa during the twentieth century. Theor. Appl. Climatol. 98, 119–135. doi: 10.1007/s00704-008-0093-6
Kleynhans, C. J. (2007). Module D: Fish Response Assessment Index in River Ecoclassification: Manual for Ecostatus Determination (Version 2). Joint Water Research Commission and Department of Water Affairs and Forestry Report. WRC Report No. Tt 330/08. Pretoria: Water Research Commission.
K'oreje, K. O., Kandie, F. J., Vergeynst, L., Abira, M. A., Van Langenhove, H., Okoth, M., et al. (2018). Occurrence, fate and removal of pharmaceuticals, personal care products and pesticides in wastewater stabilization ponds and receiving rivers in the Nzoia Basin, Kenya. Sci. Total Environ. 637, 336–348. doi: 10.1016/j.scitotenv.2018.04.331
Kroese, J. S., Jacobs, S. R., Tych, W., Breuer, L., Quinton, J. N., and Rufino, M. C. (2020). Tropical montane forest conversion is a critical driver for sediment supply in East African catchments. Water Resour. Res. 56:e2020WR027495. doi: 10.1029/2020WR027495
Lake Victoria Basin Commission (2007). Regional Transboundary Diagnostic Analysis of the Lake Victoria Basin. Kisumu: Lake Victoria Basin Commission.
Lake Victoria Basin Commission (2011). Vulnerability Assessment to Climate Change in Lake Victoria Basin. Nairobi; Kisumu: Lake Victoria Basin Commission; African Centre for Technology Studies. Available online at: https://trove.nla.gov.au/work/157368218
Lake Victoria Basin Commission (2012). A Basin-Wide Strategy for Sustainable Land Management in the Lake Victoria Basin. Kisumu: Lake Victoria Basin Commission. Available online at: http://repository.eac.int/123456789/689
Lake Victoria Basin Commission GRID-Arendal (2017). Lake Victoria Basin: Atlas of Our Changing Environment. Kisumu; Arendal: Lake Victoria Basin Commission and GRID-Arendal. Available online at: https://www.grida.no/publications/328 (accessed October 23, 2020).
Lambin, E. F., Geist, H. J., and Lepers, E. (2003). Dynamics of land-use and land-cover change in tropical regions. Annu. Rev. Environ. Resour. 28, 205–241. doi: 10.1146/annurev.energy.28.050302.105459
Lenat, D. R. (1993). A biotic index for the southeastern United States: derivation and list of tolerance values, with criteria for assigning water-quality ratings. J. North Am. Benthol. Soc. 12, 279–290. doi: 10.2307/1467463
Lowe, S., Dallas, H., Kennedy, M., Taylor, J. C., Gibbins, C., Lang, P., et al. (2013). The SAFRASS Biomonitoring Scheme: General Aspects, Macrophytes (ZMTR) and Benthic Macroinvertebrates (ZISS) Protocols. Produced for the ACP Science and Technology Programme. University of Glasgow, Glasgow, Scotland.
Madsen, H., and Thyregod, P. (2010). Introduction to General and Generalized Linear Models. Florida, FL: CRC Press.
Makalle, A. M., Obando, J., and Bamutaze, Y. (2008). Effects of land use practices on livelihoods in the transboundary sub-catchments of the Lake Victoria Basin. Afr. J. Environ. Sci. Technol. 2, 309–317. doi: 10.5897/AJEST.9000040
Mamun, M., and An, K. G. (2020). Stream health assessment using chemical and biological multi-metric models and their relationships with fish trophic and tolerance indicators. Ecol. Indic. 111:106055. doi: 10.1016/j.ecolind.2019.106055
Masese, F. O., Abrantes, K. G., Gettel, G. M., Irvine, K., Bouillon, S., and McClain, M. E. (2018). Trophic structure of an African savanna river and organic matter inputs by large terrestrial herbivores: a stable isotope approach. Freshw. Biol. 63, 1365–1380. doi: 10.1111/fwb.13163
Masese, F. O., Achieng, A. O., O'Brien, G. C., and McClain, M. E. (2020c). Macroinvertebrate taxa display increased fidelity to preferred biotopes among disturbed sites in a hydrologically variable tropical river. Hydrobiologia 848, 321–343. doi: 10.1007/s10750-020-04437-1
Masese, F. O., Achieng, A. O., Raburu, P. O., Lawrence, T., Ives, J. T., Nyamweya, C., et al. (2020a). Distribution patterns and diversity of riverine fishes of the Lake Victoria Basin, Kenya. Int. Rev. Hydrobiol. 105, 171–184. doi: 10.1002/iroh.202002039
Masese, F. O., Kiplagat, M. J., González-Quijano, C. R., Subalusky, A. L., Dutton, C. L., Post, D. M., et al. (2020b). Hippopotamus are distinct from domestic livestock in their resource subsidies to and effects on aquatic ecosystems. Proc. R. Soc. B 287:20193000. doi: 10.1098/rspb.2019.3000
Masese, F. O., and McClain, M. E. (2012). Trophic resources and emergent food web attributes in rivers of the Lake Victoria Basin: a review with reference to anthropogenic influences. Ecohydrology 5, 685–707. doi: 10.1002/eco.1285
Masese, F. O., Omukoto, J. O., and Nyakeya, K. (2013). Biomonitoring as a prerequisite for sustainable water resources: a review of current status, opportunities and challenges to scaling up in East Africa. Ecohydrol. Hydrobiol. 13, 173–191. doi: 10.1016/j.ecohyd.2013.06.004
Mngube, F. N., Kapiyo, R., Aboum, P., Anyona, D., and Dida, G. O. (2020). Subtle impacts of temperature and rainfall patterns on land cover change overtime and future projections in the Mara River Basin, Kenya. Open J. Soil Sci. 10:327. doi: 10.4236/ojss.2020.109018
Naigaga, I., Kaiser, H., Muller, W. J., Ojok, L., Mbabazi, D., Magezi, G., et al. (2011). Fish as bioindicators in aquatic environmental pollution assessment: a case study in Lake Victoria wetlands, Uganda. Phys. Chem. Earth 36, 918–928. doi: 10.1016/j.pce.2011.07.066
Ngodhe, S. O., Raburu, P. O., Arara, B. K., Orwa, P. O., and Otieno, A. A. (2013). Spatio-temporal variations in phytoplankton community structure in small water bodies within Lake Victoria basin, Kenya. Afr. J. Environ. Sci. Technol. 7, 862–873. doi: 10.5897/AJEST2013.1552
Nyilitya, B., Mureithi, S., and Boeckx, P. (2020). Land use controls Kenyan riverine nitrate discharge into Lake Victoria–evidence from Nyando, Nzoia and Sondu Miriu river catchments. Isotopes Environ. Health Stud. 56, 170–192. doi: 10.1080/10256016.2020.1724999
Oberholster, P. J. (2011). Using epilithic filamentous green algae communities as indicators of water quality in the headwaters of three South African river systems during high and medium flow periods. Zooplankton Phytoplankton 107–122.
Ochola, W. O. (2006). “Land cover, land use change and related issues in the Lake Victoria basin: States, drivers, future trends and impacts on environment and human livelihoods,” in Environment for Development: An Ecosystems Assessment of Lake Victoria Basin (Nairobi: United Nations Environment Programme; Pan African START Secretariat), 43–60.
O'Connell, M. T., Cashner, R. C., and Schieble, C. S. (2004). Fish assemblage stability over fifty years in the Lake Pontchartrain estuary; comparisons among habitats using canonical correspondence analysis. Estuaries 27, 807–817. doi: 10.1007/BF02912042
Odada, E. O., Ochola, W. O., and Olago, D. O. (2009). Drivers of ecosystem change and their impacts on human well-being in Lake Victoria basin. Afr. J. Ecol. 47, 46–54. doi: 10.1111/j.1365-2028.2008.01049.x
Ogutu, J. O., Owen-Smith, N., Piepho, H. P., and Said, M. Y. (2011). Continuing wildlife population declines and range contraction in the Mara region of Kenya during 1977–2009. J. Zool. 285, 99–109. doi: 10.1111/j.1469-7998.2011.00818.x
Olaka, L. A., Ogutu, J. O., Said, M. Y., and Oludhe, C. (2019). Projected climatic and hydrologic changes to Lake Victoria Basin Rivers under three RCP emission scenarios for 2015–2100 and impacts on the water sector. Water 11:1449. doi: 10.3390/w11071449
Orori, B. O., Etiégni, L., and Senelwa, K. (2006). “Towards the management of pollution loads into Lake Victoria: treatment of industrial effluent discharged into river Nzoia, Western Kenya,” in Proceedings of the 11 th World Lakes Conference–Proceedings, Vol. 2, 301–306.
Oruma, S. K. (2017). The Study of the Effects of Mau Catchment Degradation on the Flow of the Mara River, Kenya. Available online at: http://repository.seku.ac.ke/handle/123456789/3252 (accessed October 23, 2020).
Pringle, H., Hughes, K., Ojwang, W., Joseph, C., Onyango, K., Kessy, N., et al (2020). Freshwater Biodiversity of the Mara River Basin of Kenya and Tanzania. Woking: WWF-UK. Available online at: https://wwfke.awsassets.panda.org/downloads/wwf_2020_summary_marafreshwaterbiodiversityreview.pdf (accessed October 23, 2020).
R Core Team (2020). R: A Language and Environment for Statistical Computing. Vienna: R Foundation for Statistical Computing. Available online at: https://www.R-project.org/ (accessed October 23, 2020).
Raburu, P. O., and Masese, F. O. (2012). Development of a fish-based index of biotic integrity (FIBI) for monitoring riverine ecosystems in the Lake Victoria drainage Basin, Kenya. River Res. Appl. 28, 23–38. doi: 10.1002/rra.1428
RStudio Team (2020). RStudio: Integrated Development for R. Boston, MA: RStudio, PBC. Available online at: http://www.rstudio.com/ (accessed October 23, 2020).
Ruaro, R., Gubiani, É. A., Hughes, R. M., and Mormul, R. P. (2020). Global trends and challenges in multimetric indices of biological condition. Ecol. Indic. 110:105862. doi: 10.1016/j.ecolind.2019.105862
Sayer, C. A., Carr, J. A., and Darwall, W. R. (2019). A critical sites network for freshwater biodiversity in the Lake Victoria Basin. Fish. Manage. Ecol. 26, 435–443. doi: 10.1111/fme.12285
Sayer, C. A., Máiz-Tomé, L., Akwany, L. O., Kishe-Machumu, M. A., Natugonza, V., Whitney, C. W., et al. (2018a). “The importance of freshwater species to livelihoods in the Lake Victoria basin,” in Freshwater Biodiversity in the Lake Victoria Basin: Guidance for Species Conservation, Site Protection, Climate Resilience and Sustainable Livelihoods (Gland: International Union for Conservation of Nature), 136-151.
Sayer, C. A., Máiz-Tomé, L., and Darwall, W. R. T. (Eds.). (2018b). Freshwater Biodiversity in the Lake Victoria Basin: Guidance for Species Conservation, Site Protection, Climate Resilience and Sustainable Livelihoods. Cambridge, Gland: International Union for Conservation of Nature.
Segurado, P., Santos, J. M., Pont, D., Melcher, A. H., Jalon, D. G., Hughes, R. M., et al. (2011). Estimating species tolerance to human perturbation: expert judgment versus empirical approaches. Ecol. Indic. 11, 1623–1635. doi: 10.1016/j.ecolind.2011.04.006
Shao, X., Fang, Y., Jawitz, J. W., Yan, J., and Cui, B. (2019). River network connectivity and fish diversity. Sci. Total Environ. 689, 21–30. doi: 10.1016/j.scitotenv.2019.06.340
Simonit, S., and Perrings, C. (2011). Sustainability and the value of the ‘regulating' services: wetlands and water quality in Lake Victoria. Ecol. Econ. 70, 1189–1199. doi: 10.1016/j.ecolecon.2011.01.017
Skelton, P. (1993). A Complete Guide to the Freshwater Fishes of Southern Africa. Halfway House: Southern Books Publishers.
Slatyer, R. A., Hirst, M., and Sexton, J. P. (2013). Niche breadth predicts geographical range size: a general ecological pattern. Ecol. Lett. 16, 1104–1114. doi: 10.1111/ele.12140
Stevenson, R. J., and Sabater, S. (Eds.). (2015). Global Change and River Ecosystems-Implications for Structure, Function and Ecosystem Services, Vol. 215. Berlin:Springer.
Subalusky, A. L., Dutton, C. L., Rosi-Marshall, E. J., and Post, D. M. (2015). The hippopotamus conveyor belt: vectors of carbon and nutrients from terrestrial grasslands to aquatic systems in sub-Saharan Africa. Freshw. Biol. 60, 512–525. doi: 10.1111/fwb.12474
Thirion, C. (2007). Module E: Macro-Invertebrate Response Assessment Index (MIRAI). River Ecoclassification Manual for Ecostatus Determination (Version 2). Joint Water Research Commission and Department of Water Affairs and Forestry report.
Turner, B. L., Kasperson, R. E., Matson, P. A., McCarthy, J. J., Corell, R. W., Christensen, L., et al. (2003). A framework for vulnerability analysis in sustainability science. Proc. Natl. Acad. Sci. U.S.A. 100, 8074–8079. doi: 10.1073/pnas.1231335100
Twesigye, C. K., Onywere, S. M., Getenga, Z. M., Mwakalila, S. S., and Nakiranda, J. K. (2011). The impact of land use activities on vegetation cover and water quality in the Lake Victoria watershed. Open Environ. Eng. J. 4, 66–77. doi: 10.2174/1874829501104010066
van Soesbergen, A., Sassen, M., Kimsey, S., and Hill, S. (2019). Potential impacts of agricultural development on freshwater biodiversity in the Lake Victoria basin. Aquat. Conserv. Mar. Freshw. Ecosyst. 29, 1052–1062. doi: 10.1002/aqc.3079
Vázquez, D. P., and Simberloff, D. (2002). Ecological specialization and susceptibility to disturbance: conjectures and refutations. Am. Nat. 159, 606–623. doi: 10.1086/339991
Verschuren, D., Johnson, T. C., Kling, H. J., Edgington, D. N., Leavitt, P. R., Brown, E. T., et al. (2002). History and timing of human impact on Lake Victoria, East Africa. Pro. R. Soc. Lond. B Biol. Sci. 269, 289–294. doi: 10.1098/rspb.2001.1850
Wang, X. N., Ding, H. Y., He, X. G., Dai, Y., Zhang, Y., and Ding, S. (2018). Assessing fish species tolerance in the Huntai River Basin, China: biological traits versus weighted averaging approaches. Water 10:1843. doi: 10.3390/w10121843
Whitehead, P. J. P. (1959). The river fisheries of Kenya 1. Nyanza Province. East Afr. Agric. For. J. 24, 274–278. doi: 10.1080/03670074.1959.11665219
Wickham, H. (2016). ggplot2: Elegant Graphics for Data Analysis. New York, NY: Springer-Verlag New York. Available online at: https://ggplot2.tidyverse.org
Williamson, D. F., Parker, R. A., and Kendrick, J. S. (1989). The box plot: a simple visual method to interpret data. Ann. Intern. Med. 110, 916–921. doi: 10.7326/0003-4819-110-11-916
World Bank (2016). Reviving Lake Victoria by Restoring Livelihoods. Washington, DC: World Bank. Available online at: https://www.worldbank.org/en/news/feature/2016/02/29/reviving-lake-victoria-by-restoring-livelihoods (accessed October 23, 2020).
Zeni, J. O., Hoeinghaus, D. J., and Casatti, L. (2017). Effects of pasture conversion to sugarcane for biofuel production on stream fish assemblages in tropical agroecosystems. Freshw. Biol. 62, 2026–2038. doi: 10.1111/fwb.13047
Keywords: afrotropical rivers, niche breadth, fish index of biotic integrity, trophic level, species sensitivity, multivariate analysis
Citation: Achieng AO, Masese FO, Coffey TJ, Raburu PO, Agembe SW, Febria CM and Kaunda-Arara B (2021) Assessment of the Ecological Health of Afrotropical Rivers Using Fish Assemblages: A Case Study of Selected Rivers in the Lake Victoria Basin, Kenya. Front. Water 2:620704. doi: 10.3389/frwa.2020.620704
Received: 23 October 2020; Accepted: 21 December 2020;
Published: 09 February 2021.
Edited by:
Julie A. Winkler, Michigan State University, United StatesReviewed by:
Gabriel O. Dida, Technical University of Kenya, KenyaChristopher Mulanda Aura, Kenya Marine and Fisheries Research Institute, Kisumu, Kenya
Copyright © 2021 Achieng, Masese, Coffey, Raburu, Agembe, Febria and Kaunda-Arara. This is an open-access article distributed under the terms of the Creative Commons Attribution License (CC BY). The use, distribution or reproduction in other forums is permitted, provided the original author(s) and the copyright owner(s) are credited and that the original publication in this journal is cited, in accordance with accepted academic practice. No use, distribution or reproduction is permitted which does not comply with these terms.
*Correspondence: Alfred O. Achieng, YWNoaWVuZ2FsZnJlZEBnbWFpbC5jb20=