 Olalekan A. Agboola
 Colleen T. Downs
 Gordon O'Brien
95% of researchers rate our articles as excellent or good
Learn more about the work of our research integrity team to safeguard the quality of each article we publish.
Find out more
ORIGINAL RESEARCH article
Front. Water , 01 December 2020
Sec. Water and Human Systems
Volume 2 - 2020 | https://doi.org/10.3389/frwa.2020.584936
This article is part of the Research Topic Advances in Biomonitoring for the Sustainability of Vulnerable African Riverine Ecosystems View all 10 articles
The rivers of KwaZulu-Natal, South Africa, are being impacted by various anthropogenic activities that threaten their sustainability. Our study demonstrated how Bayesian networks could be used to conduct an environmental risk assessment of macroinvertebrate biodiversity and their associated ecosystem to assess the overall effects of these anthropogenic stressors in the rivers. We examined the exposure pathways through various habitats in the study area using a conceptual model that linked the sources of stressors through cause-effect pathways. A Bayesian network was constructed to represent the observed complex interactions and overall risk from water quality, flow and habitat stressors. The model outputs and sensitivity analysis showed ecosystem threat and river health (represented by macroinvertebrate assessment index – MIRAI) could have high ecological risks on macroinvertebrate biodiversity and the ecosystem, respectively. The results of our study demonstrated that Bayesian networks can be used to calculate risk for multiple stressors and that they are a powerful tool for informing future strategies for achieving best management practices and policymaking. Apart from the current scenario, which was developed from field data, we also simulated three other scenarios to predict potential risks to our selected endpoints. We further simulated the low and high risks to the endpoints to demonstrate that the Bayesian network can be an effective adaptive management tool for decision making.
Water as a natural resource is essential to life, the environment, industrial growth, development, food production, hygiene, sanitation and power generation (Rast, 2009; DWA, 2010). River systems also provide many goods and services upon which society depends, such as maintaining the habitat and integrity of aquatic organisms, transportation of sediment, recreational and eco-tourism centres (DWA, 2010). The river systems also serve as disposal sites for industrial effluent and solid wastes (DWA, 2010). Global use of freshwater increased by 10% from 2000 to 2010 because of an increase in population growth and economic development (Vörösmarty et al., 2010). The anthropogenic demands on freshwater ecosystems cause enormous threats to biodiversity around the world (Dudgeon et al., 2006), through various contaminants which may be chemical, physical, radioactive or pathogenic, and maybe from multiple sources, including industrial effluents, agricultural run-off, domestic sewage, construction and mining activities (Alves et al., 2014; Nitasha and Sanjiv, 2015).
Risk assessment is a method used to calculate the probability of the impacts of an unwanted effect on a set of predefined assessment endpoints over a period (Suter, 1993; Walker et al., 2001; Landis and Wiegers, 2007; Hines and Landis, 2014). Ecological Risk Assessment (EcoRA) is a systematic method of describing and explaining scientific facts, laws and relationships to provide a sound basis for developing adequate protection measures for the environment (USEPA, 2000). A relative risk model (RRM) is a cause and effect model used in the calculation of risks to assessment endpoints because of multiple stressors having impacts on the endpoints of a system or habitat (Landis and Wiegers, 2005). The RRM methodology is an improved and expanded version of the traditional three-phase risk assessment method which involves problem formulation, risk analysis and risk characterization. Landis and Wiegers (1997) developed a framework called the regional-scale ecological risk model for ranking and comparing the risks associated with multiple stressors, and this is a useful tool for describing and comparing risks to valued resources (endpoints) within a catchment or region (O'Brien et al., 2018). Risk assessment at a regional scale involves the assessment of multiple habitats with multiple sources of multiple stressors affecting multiple endpoints at a relatively large spatial coverage (Hunsaker et al., 1989; Landis and Wiegers, 1997). While the traditional risk assessment often has only one endpoint, the regional risk methodology usually has multiple endpoints (Walker et al., 2001). Various stressors impinge on the quality of the environment within any region, and the assessment of these stressors may be incomplete if there is no objective framework for the evaluation of the risks associated with the stressors (Linkov et al., 2006). At the regional scale, considerations of multiple sources of stressors affecting various endpoints are allowed (Landis and Wiegers, 2005), because there may be many sources for a single stressor (Liu et al., 2010). Also, a regional scale risk assessment allows for landscape characteristics which may affect the risk estimates of a region (Landis and Wiegers, 2005). However, it is difficult to measure, test, model or assess all the components of the environment at a regional scale and the difficulty arises from the high degree of spatial and temporal variability of regional components (Suter, 1993). The typical impacts considered in risk assessment are mortality, chronic physiological impacts and reproductive defects of the target species or humans (Walker et al., 2001; Mommaerts et al., 2010; Nordberg et al., 2018).
Although the RRM method was initially applied to assess the risk of chemical stressors, it has been successively used in the assessment of non-chemical stressors; such as biological (invasive species) stressors, physical (habitat loss, stream alteration and blockage, land-use change) stressors and natural events (climate change) (Moraes et al., 2002; Colnar and Landis, 2007; Landis and Wiegers, 2007; O'Brien and Wepener, 2012). Also, the RRM has been adapted to suit a variety of habitats (e.g., freshwater, marine and terrestrial) (Chen and Landis, 2005) and different regions of the world such as South America (Moraes et al., 2002), North America (Colnar and Landis, 2007), South Africa (O'Brien and Wepener, 2012), China (Li et al., 2015), and Australia (Heenkenda and Bartolo, 2016). A Bayesian network (Bayes Net or BN) is a graphical model that encodes the probabilistic relationships among sources of stressors, habitats and endpoints to estimate the likely risk outcomes through a web of nodes (McCann et al., 2006). Bayesian network relative risk model (BN-RRM) is a relative risk model where the linkages between the conceptual models are described by using a Bayesian network (Ayre and Landis, 2012).
Our study aimed to conduct a regional ecological risk assessment of stressors in the rivers of KwaZulu-Natal (KZN) Province, South Africa, to macroinvertebrate biodiversity and ecosystem protection (endpoints) using the BN-RRM approach. We established three objectives in this study. Our first objective was to develop a RRM to estimate the relative contribution of risk from stressors to the selected ecological endpoints. Our second objective was to determine which regions and endpoints were at high risk from anthropogenic activities. Our third objective was to simulate one hundred percent (100%) low risk to the endpoints (representing pristine condition or before urbanization and industrial development) into the model to evaluate the relative risk impacts of the sources and habitats to the selected endpoints. We expected this study to give an insight into the threats from the land use types of KZN, reveal their probable risk and lay the foundation for regional ecological risk assessments of the freshwater resources of KZN.
Our study was conducted on a large scale, making use of all the national indices of river health (fish, vegetation, diatoms, and macroinvertebrate) in South Africa. The risks associated with each of these indices have been addressed through different publications and reports. The specific focus of this study was the risk to macroinvertebrate index, which is made possible by the fact that each of the indices can be used independently of the others. Also, the risk scenarios used in this article were simulations of the risks that could occur at the risk regions (i.e., each sampling point), except for the “Current Scenario” which was obtained from our field results. The 100% low-risk simulation represented the resource management goal for South African rivers.
KZN Province of South Africa was selected for this study and is located within the eastern escarpment catchment of South Africa, containing four of the 22 primary drainage regions of South Africa, either wholly or partially (Midgley et al., 1994). The mean annual rainfall (MAR) range across the province is ~616–936 mm (South African Weather Service, 2020) and is drained by the major river systems in the province. Each of the major rivers flows through distinct longitudinal patterns, although they typically exhibit a distinct escarpment zone, with flatter mid-slopes and steep eastern coastal regions (Rivers-Moore et al., 2007). At a scale of 1:500,000, drainage densities for each primary catchment within KZN ranged from 0.03 to 0.51 km of river per km2, with a mean density of 0.240 km2 and an average coefficient of variation of 38.6% (Rivers-Moore et al., 2007).
In this study, we chose a total of 39 KZN river sites, and each site represented a risk region (RR) (Figure 1), based on their sub-quaternary catchments, proximity to risk sources, habitat characteristics and ecological endpoints. The highest (5th) river order in KZN is the Thukela; other long river systems (4th order streams) are the Phongolo, Buffels and Mzimkhulu Rivers (Rivers-Moore et al., 2007). The uMvoti and Mhlatuze catchments have the highest drainage densities, the southern KZN regions (Mzimkhulu, Mkomazi and uMgeni catchments) also have relatively high drainage densities, while the northern coastal Zululand regions (Mkuze River and Phongola catchment) have the lowest drainage densities (Rivers-Moore et al., 2007). The uMgeni River catchment, spanning 4,418 km2 is reputed to be one of the most reliable (providing sufficient water supply for human use) large rivers of South Africa (Van Der Zel, 1975) and it has five large dams located on its course for domestic water supplies. Our study was conducted using the relative risk model (RRM), which is made up of three main phases: problem formulation, risk analysis and risk characterization (Landis and Wiegers, 1997, 2005).
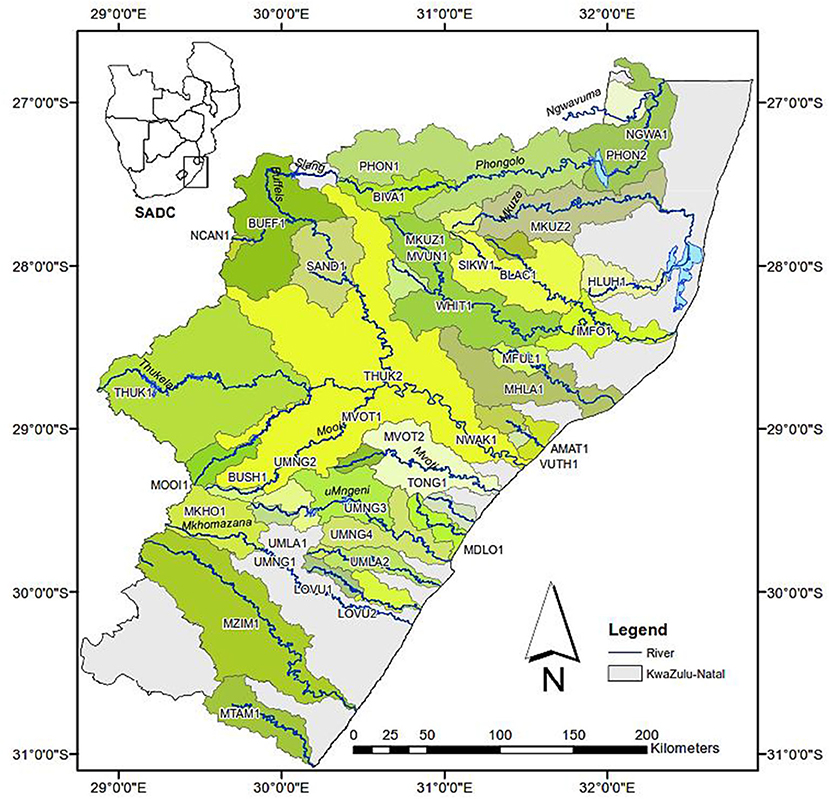
Figure 1. Risk assessment regions of KwaZulu-Natal, South Africa, from 2015 to 2016 [Inset: map of Southern Africa Development Countries (SADC)].
For the biodiversity endpoint, macroinvertebrate data were collected from three distinct biotopes grouped into stone, vegetation and GSM (gravel, sand and mud) using a kick net according to the South African Scoring System 5 (SASS5) protocol (Dickens and Graham, 2002). The sampling protocol involves collecting only one sample per biotope group, but care was taken to ensure that all the available biotopes were qualitatively sampled. We sampled each biotope separately (i.e., one sample per biotope), and the macroinvertebrates were preserved in 80% ethanol for taxonomic resolution and taxa abundance counts in the laboratory. The biotopes are stones-in-current (SIC) represented by pebbles and cobbles (2–25 cm), and boulders (25 cm); Stones-out-of-current (SOOC) including pebbles and cobbles, and boulders in pools of water; Marginal vegetation including vegetation growing on fringes and edges of the rivers, while aquatic vegetation was that mostly growing (may or may not be submerged) inside river channel. Gravel was small stones usually < 2 cm in diameter, while sand and mud were smaller than 2 and 0.06 mm, respectively.
The SASS5 data interpretation is based on the calculation of the SASS5 score (the sum of the sensitivity weightings for taxa present at a site) and average score per taxon (ASPT). The ASPT is the ratio of the SASS score and the number of taxa (Dickens and Graham, 2002; Dallas, 2004). SASS5 data were used in generating MIRAI (Macroinvertebrate Response Assessment Index) scores (Thirion, 2016).
For the ecosystem endpoint, habitat quality and water quality data were used. We measured basic in situ water quality parameters (temperature, dissolved oxygen, pH and electrical conductivity) at each site on every sampling occasion using the YSI model 556 MPS handheld multi-probe water quality meter. Habitat data were assessed according to their abundance and quality in supporting the macroinvertebrate abundance and richness.
This is the information gathering phase of a risk assessment to determine what is at risk (e.g., plants, animals, humans, etc.) and what resources need to be protected (e.g., species of interest, habitat, etc.) (Norton et al., 1992). This is also the phase that the chemical, physical and biological characteristics of the study area are outlined, the stressors are identified, the endpoints derived from the region's ecological values, the risk areas are defined, and the conceptual model is formulated (O'Brien and Wepener, 2012).
Our conceptual model describes the hypothesized relationships between the chosen risk sources, stressors, habitats, receptors and impacts to endpoints selected for the study (O'Brien et al., 2018) (Figure 2A). A source is an entity that releases single or multiple stressors to the environment (e.g., industrial waste of effluent) or the action that produces stressors (USEPA, 2000), while stressors are the physical, chemical or biological substances that can cause an adverse effect (USEPA, 2000). We chose 10 sources of risks impacting on the rivers of KZN for this study (Figure 2A). These ecological risk sources relating to the rivers of KZN were grouped into five major categories to describe the effects of their water resource utilization on the selected risk regions. The categories were industrialization (manufacturing, mining and forestry), agriculture (sugarcane, commercial and subsistence farming), natural vegetation, settlements (rural and urban), and construction (roads, rails and dams).
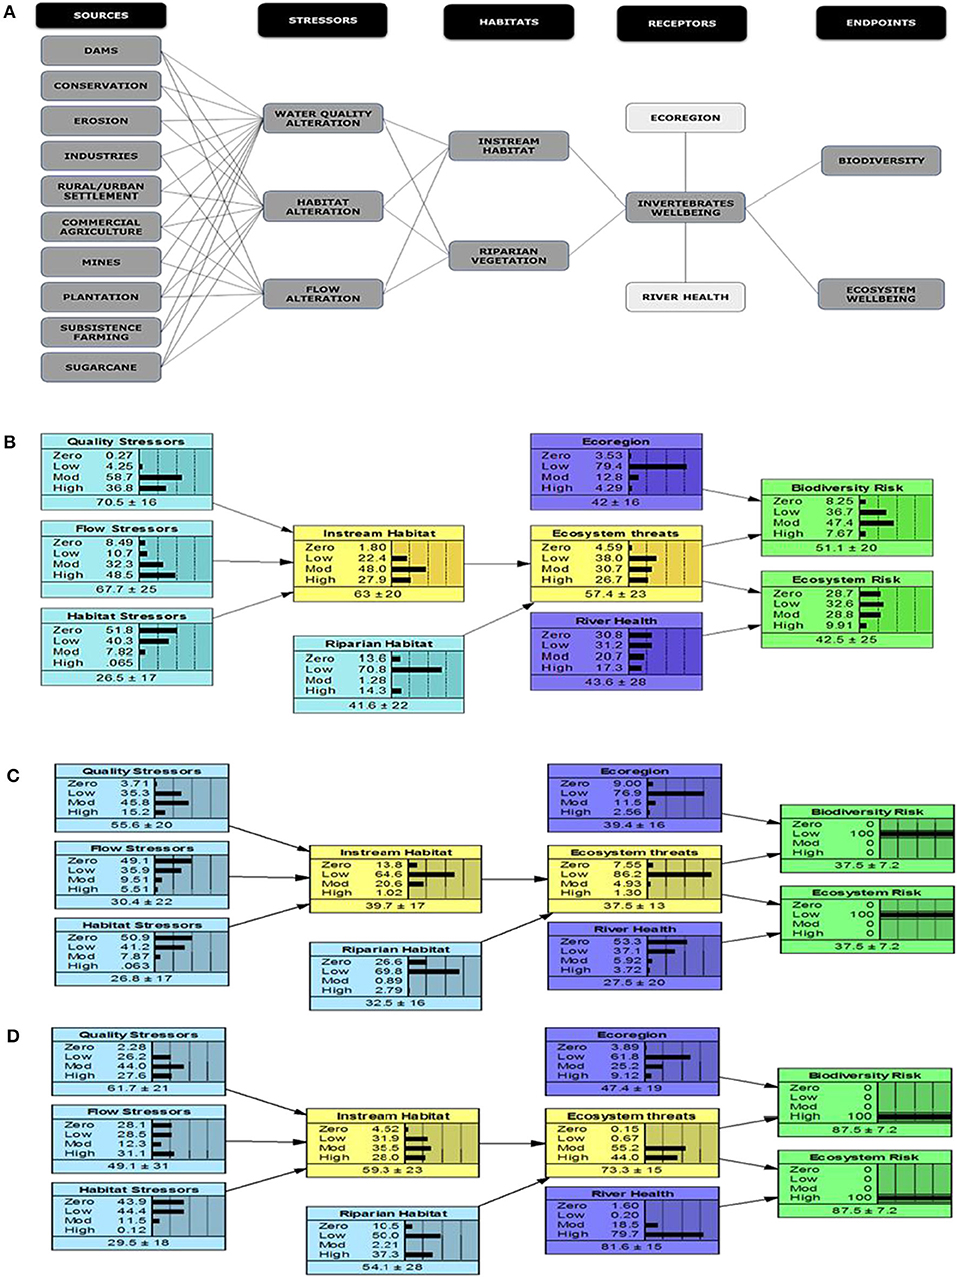
Figure 2. (A) conceptual model showing linkages between sources, stressors, habitats, receptors and assessment endpoints, while (B) Bayesian Network Relative Risk Model, using AMAT1 risk region as an example, (C) 100% low risk to endpoints simulation, and (D) 100% high risk to endpoints simulation.
The stressors evaluated in this study were water quality alteration/abstraction, habitat alteration and flow alteration. These stressors were the resultant synergistic effects or interactions of the risk sources as are being influenced by the anthropogenic activities and natural events within the study area (Hua et al., 2017). The various synergistic interactions of the risk sources linked to each stressor are shown in Figure 2A. Each source of risk or threat to our endpoints has varying degrees of stress being exerted on the risk regions (Liu et al., 2010; Bednarek et al., 2014; Lu et al., 2015; Mekonnen et al., 2016).
The instream habitat was selected to represent water quality, flow and habitat stressor states of the risk regions, while riparian vegetation was selected to represent the physical habitat structure and the vegetation response assessment index (VEGRAI) of the risk regions (Figure 2A). Habitat was included in the conceptual model of this study because each of the stressors have either direct or indirect effects on the habitat quality of the risk regions and the habitat quality also determines the well-being of the target organisms or receptors (Obery and Landis, 2002; Villeneuve et al., 2018).
A receptor is a biological or ecological component that is exposed to the stressor, while the attribute is the important characteristic of the ecological component to be protected (Hua et al., 2017). Macroinvertebrates are the receptors in this study, while the attributes were ecoregions and river health (Figure 2A). Macroinvertebrates well-being could be influenced by a combination of the sources of risk, stressors and habitat quality within the risk region. Ecoregions represent the potential for habitat quality, which determines the increase or decrease in the diversity of macroinvertebrates; while river health (i.e., MIRAI) provides the indications of existing responses of macroinvertebrates to the drivers of the ecosystem or stressors. The ecoregion and river health were used as attributes of ecosystem threat because they both have impacts on macroinvertebrate species composition or well-being (Thirion, 2016). Ecoregion attribute was combined with ecosystem threat to assess the biodiversity endpoint because ecoregions determine the diversity of macroinvertebrates in South African rivers; while the river health (MIRAI) attribute was combined with ecosystem threat to assess the risk to the ecosystem endpoint because river health is a good indicator of ecosystem impairment or quality/sustainability; especially because macroinvertebrate species abundance and diversity are factors calculating the MIRAI data.
Assessment endpoints can be made up of a receptor and an attribute (e.g., macroinvertebrate biodiversity as in this study) (USEPA, 2000). The assessment endpoints should not only be the characteristics of the receptors and aims of the assessment, but they should also be quantitative measurements of the possible degrees of the impacts to the receptors (Hua et al., 2017). For this study, we chose biodiversity and ecosystem well-being as the risk endpoints. This is because a viable biodiversity and quality ecosystem will ensure the sustainable ecological integrity of the risk regions. Ecosystem threat was used to represent the receptor (macroinvertebrate) in the BN-RRM because it better helps in visualizing the effects of the attributes (ecoregion and river health) on the ecological integrity of the risk endpoints (Figures 2B–D).
The evidence used in our assessment was obtained from field assessments between September 2014 and March 2016. The RRM was used to develop a conceptual model, which was used to represent the hypothetic relationships between the sources of stressors, stressors, the ecological components (habitats and receptors) and their associated endpoints (USEPA, 2000; Landis and Wiegers, 2005) (Figure 2A). The conceptual model was used as the template for developing the BN-RRM using Netica software (Norsys Software Corporation, 2014) (Figure 2B). Our RRM was based on a ranking of the stressors and the habitats to generate possible outcomes of their impacts on the ecological receptors and the assessment endpoints (Landis and Wiegers, 2005). Our ranking was based on the relative risk magnitude or impact of each stressor and habitat using the quantitative and qualitative data obtained during the study period. The risk ranks were expressed as percentages of the impacts of each stressor, from 1% being the least risk or least impact of a stressor; while 100% rank is the highest risk of a stressor to the endpoint. The ranks were zero (1–25%), low (26–50%), moderate (51–75%) and high (76–100), respectively. The rank for each stressor and their justifications are detailed in the Supplementary Information (Supplementary Table 1).
The ranks are defined as:
• Zero risk: This describes a pristine or reference state, with no impact or risk.
• Low risk: This represents a mostly natural state with low impact or risk. It is believed to still be within an ideal state for sustainable ecosystem use.
• Moderate risk: This state describes a moderately modified state or moderate impact or risk. It represents the threshold of potential concern or alert.
• High risk: This state represents significant alteration or impairment, with high impacts or risks.
After calculating the risks for the current scenario in the thirty-nine risk regions, three alternative scenarios were proposed, and the risks were calculated for each scenario, endpoint and risk region. The alternate risk scenarios used were:
• Scenario 1: represented a low flow situation. The low flow was simulated because of the climatic situation of South African rivers which are often affected by periodic drought conditions and low annual precipitation.
• Scenario 2: represented impacts of limited or degraded habitat. Habitat degradation or impairment is a big problem in South African rivers as a result of anthropogenic activities (e.g., sand mining activities) and natural disasters (e.g., drought).
• Scenario 3: represented a situation of high-water quality degradation. Water quality degradation is mostly from effects of industrialization (e.g., effluent discharge from industries) and urbanization (e.g., household wastes)
• 100% low risk: This represented the desired risk level with minimal impact to our endpoints. This simulation helped to characterize the impact of each stressor input on the risk endpoints for each region.
From a management perspective, uncertainty is defined as the lack of exact knowledge or assessment confidence, regardless of the cause of the deficiency (Refsgaard et al., 2007). Uncertainty is an inevitable factor in ecological risk analysis, and this can be analyzed using various tools, such as conceptual models, interval and sensitivity analysis, Monte Carlo simulation, Bayesian networks and decision trees (O'Brien and Wepener, 2012; Chen and Liu, 2014). Monte Carlo Simulation tests and Bayesian Networks are the most used of the tools in analyzing uncertainty and variability in risk parameters selection and data for stressor–response and exposure models (Hua et al., 2017). We linked our causal (sources) probabilistic nodes or networks using conditional probability tables (CPTs), through continuous probability density functions (PDFs) to simulate uncertainties using Monte Carlo tests (Janssen, 2013; Farrance and Frenkel, 2014). To reduce uncertainties in our input data, we used Crystal ball® software in Microsoft Excel® 2013, to run Monte Carlo tests on the risk sources (water quality, flow and habitat stressors) data. Then the entropy was calculated in BN to further reduce the uncertainties by using the “Sensitivity to Findings” tool in Netica (Norsys Software Corp.) (Ayre and Landis, 2012). Entropy is the level of influence an input variable has on a response variable, which means that the greater the entropy value, the greater the degree of influence (Marcot et al., 2006). We used the sensitivity analysis information for the endpoint variables to determine the input parameters that had the greatest influence on risk estimates and the associated uncertainty (Ayre and Landis, 2012; Landis et al., 2017).
Our BN approach allowed us to combine empirical data with our expert opinion and scientific literature to construct the CPTs; thus the structure of our BN model revealed our hypothesized understanding of underlying causal relationships, which are not always evident in traditional risk assessments or complex ecological models (Ayre and Landis, 2012).
Our preliminary analysis of the risk sources data showed three regions had high risks of water quality stressors (AMAT1, BUSH1 and SIKW1), with BUSH1 having the lowest score (26%) and SIKW1 had the highest score (50%). For the flow stressor, ten regions had high risks (BIVA1, BLAC1, BUFF1, HLUH1, IMFO1, LOVU1, MDLO1, MKHO1, MVOT12, and TONG1), with BUFF1 having the lowest score (42%) and TONG1 had the highest score (66%). For the habitat stressor, 29 regions (LOVU2, MFUL1, MHLA1, MKUZ1, MKUZ2, MOOI1, MTAM1, MVOT1, MVUN1, MZIM1, NCAN1, NGWA1, NWAK1, PHON1, PHON2, SAND1, THUK1, THUK2, UMLA1, UMLA2, UMNG1, UMNG2, UMNG3, UMNG4, VUTH1, WHIT1) had high risks; PHON2 had the lowest risk (35%), while PHON1 and WHIT1 had the highest score (56%) (Figure 3).
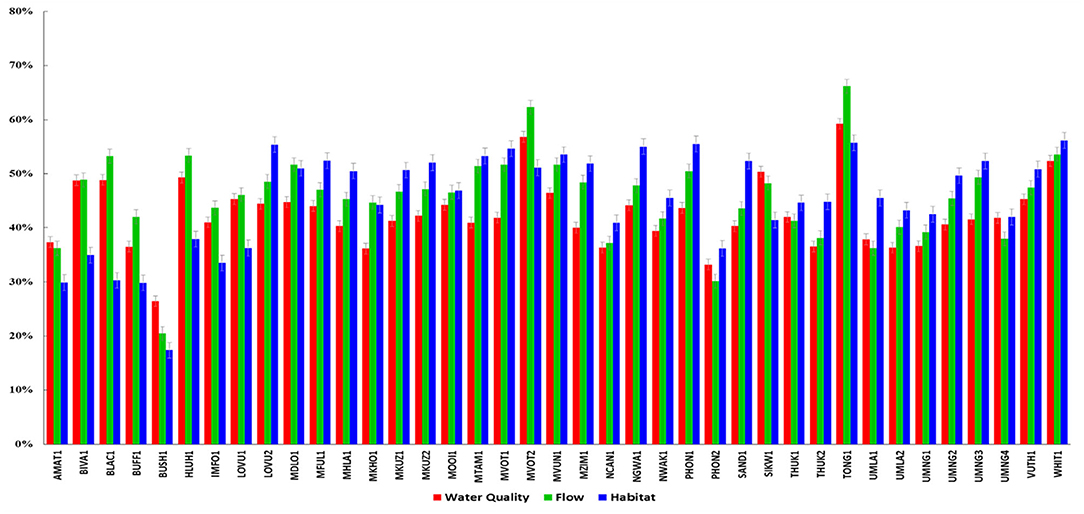
Figure 3. Preliminary analysis of the risk sources for rivers of KwaZulu-Natal, South Africa, from 2015 to 2016.
The risk distributions for each endpoint in the 39 risk regions were generated from the BN output using Netica software (Figures 4, 5). Often, various distributions may have similar mean values; therefore, it is more important to compare the distributions rather than focus on the mean scores because distributions reflect the actual frequencies from the model calculations (Landis et al., 2017). Risk scores suggest general trends, while risk distributions give specific information about the patterns of relative risk and help to compare differences in risk by region (Landis et al., 2017). The biodiversity endpoint generally displayed low-moderate risk distribution in our current scenario, except AMAT1, BUSH1, and PHON2, which displayed a zero-low risk distribution and a few other sites showing a high risk. Alternative scenario 1 skewed toward moderate risk at all the study sites for the biodiversity endpoint, the scenario 2 showed a generally high risk at most sites, with a few lowland sites being in a moderate risk. The alternative scenario 3, which represented a high deterioration of water quality because of poor mitigation or management, displayed high-risk patterns (Figure 4). The ecosystem risk distribution patterns displayed a zero-low risk distribution in the majority of the regions, while some regions (e.g., HLUH1, MVOT2, and TONG1) displayed a medium-high risk pattern. Scenario 1 generally displayed low-moderate-high risk patterns, while scenario 2 and scenario 3 had a fairly even distribution of medium to high risk (Figure 5).
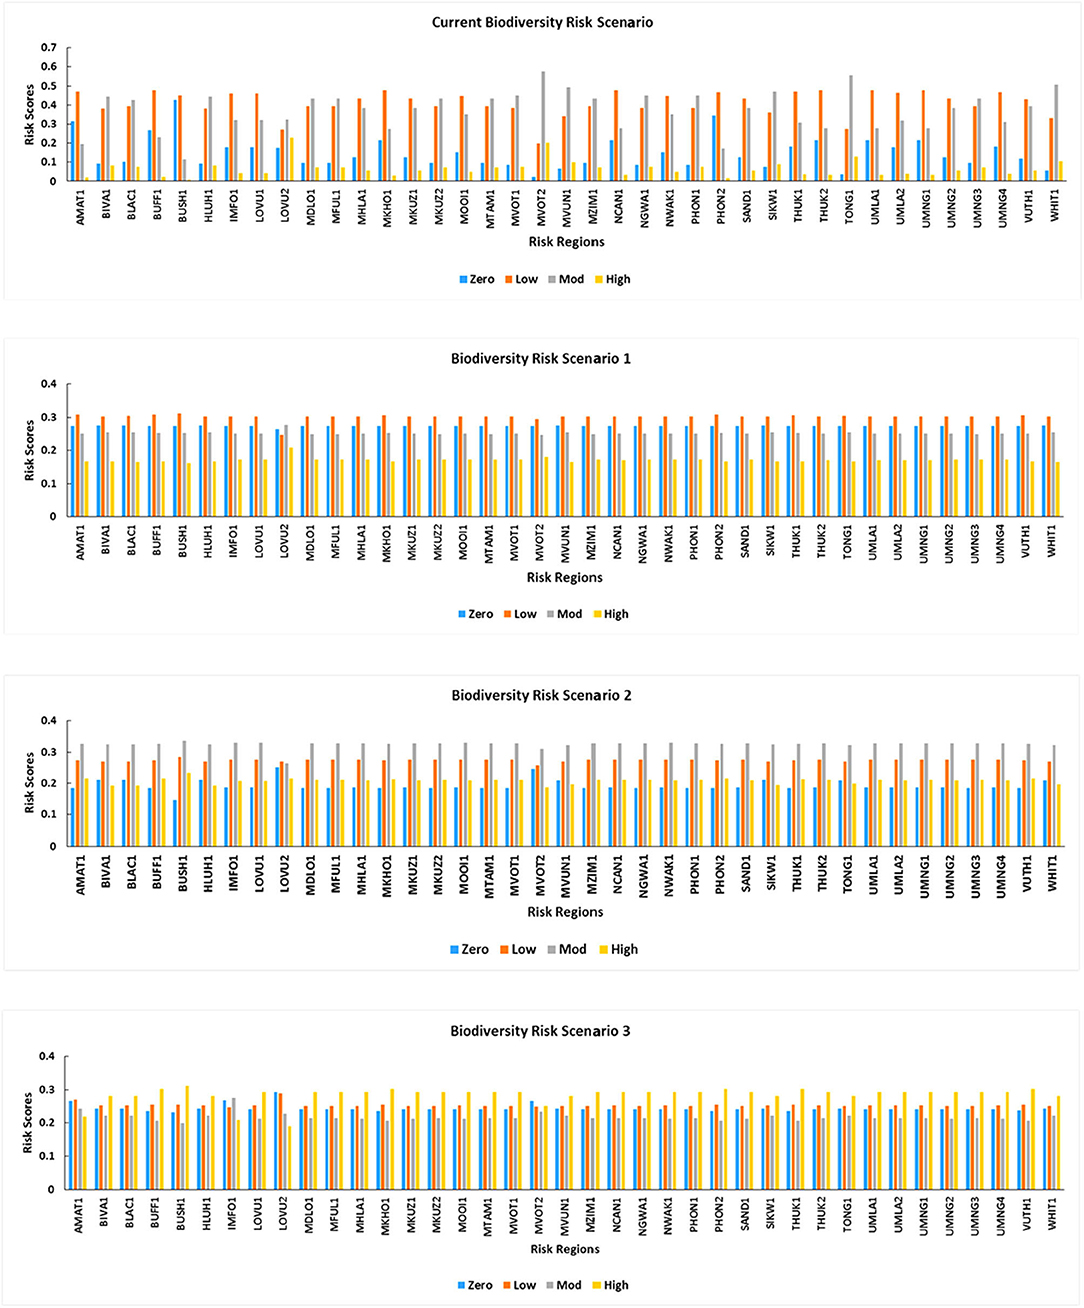
Figure 4. Bayesian network risk distributions across the risk regions and in all scenarios of the biodiversity endpoint.
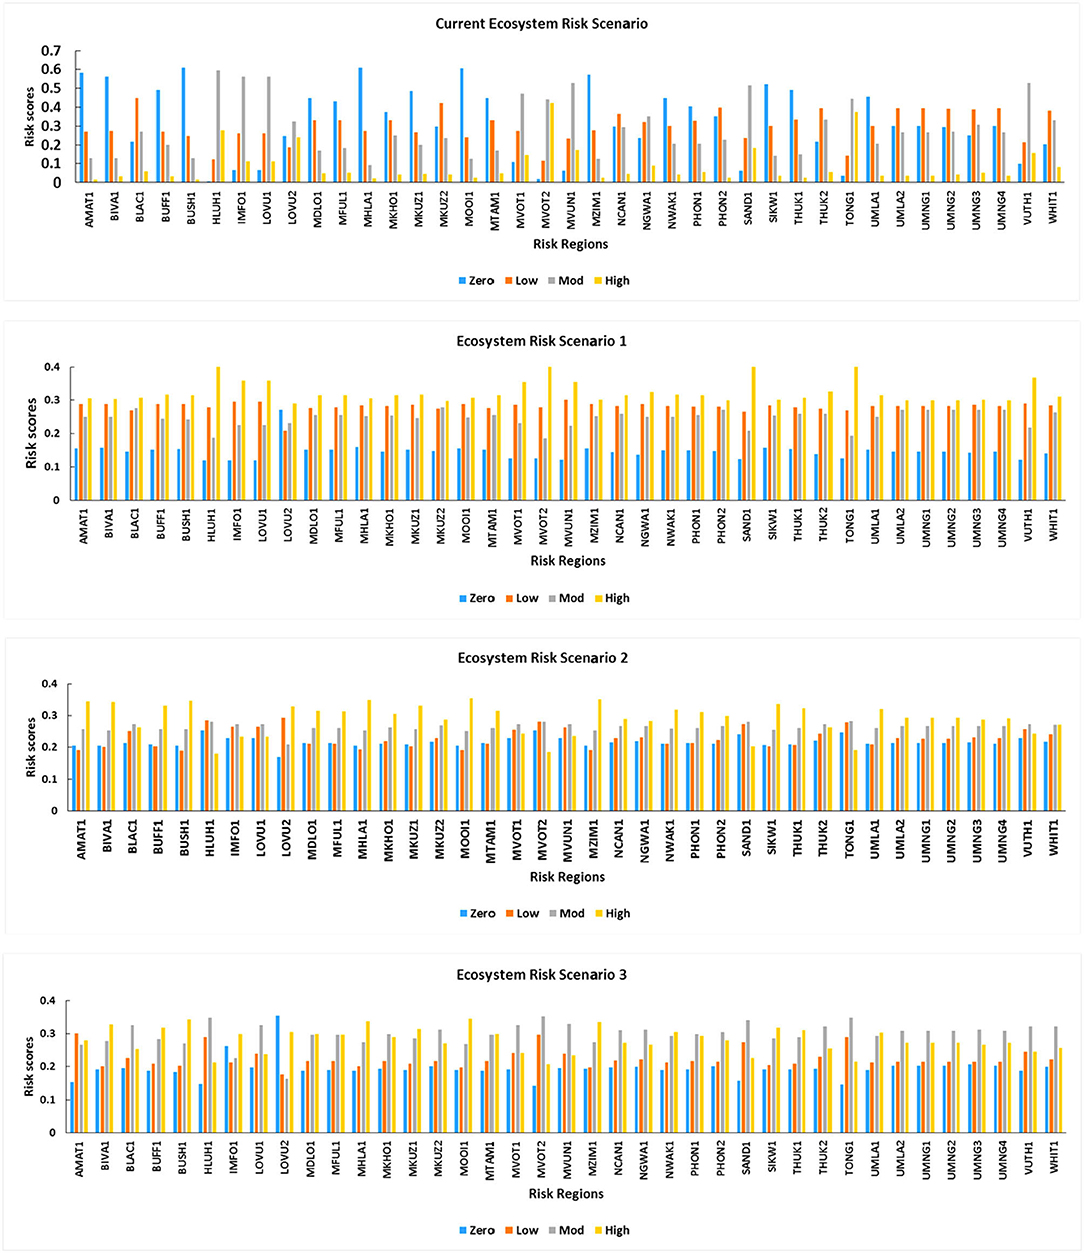
Figure 5. Bayesian network risk distributions across the risk regions and in all scenarios of the ecosystem endpoint.
For the biodiversity endpoint, the lowest and highest risk scores were obtained in the BUSH1 and MVOT2, respectively, in the current risk scenario. In scenario 1, the lowest (45.1%) and highest (48.3%) risk scores were obtained from BUSH1 and LOVU2, respectively. In scenario 2 had the lowest risk score (48.5%) and the highest risk score (53.9%) from MVOT2 and BUSH1, respectively. For ecosystem endpoint, the BN estimates showed lowest risks at MHLA1 (25.7%), LOVU2 (51%), HLUH1 (47.2%), and LOVU2 (48%) for the current scenario, scenario 1, scenario 2 and scenario 3, respectively. The highest risk scores obtained from the BN estimates were from MVOT2 (69.2%), HLUH1 (60%), MOOI1 (56.3%), and BUSH1 (56.8%) for the current scenario, scenario 1, scenario 2 and scenario 3, respectively. The final risk to biodiversity was shown in Figure 6, while the final risk to the ecosystem was shown in Figure 7. Sites within the industrial and urban areas were mostly at moderate risk in the current scenario for the two endpoints, while the sites within conserved areas had zero to low risks (Figures 6A, 7A). At the alternative scenario 1 (low flow risk), the biodiversity endpoint had moderate risk at all the sites (Figure 6B), while the ecosystem scenario indicated a generally high risk at all sites (Figure 7B). At the alternative scenario 2 (high flow risk), both endpoints had predominantly high risks, with very few lowland river sites being at moderate risk (Figures 6C, 7C). For the alternative scenario 3 (water quality risk), biodiversity endpoint was predominantly high with only a few sites being at moderate risk (Figure 6D), while all the sites were at high risk for the ecosystem endpoint (Figure 7D).
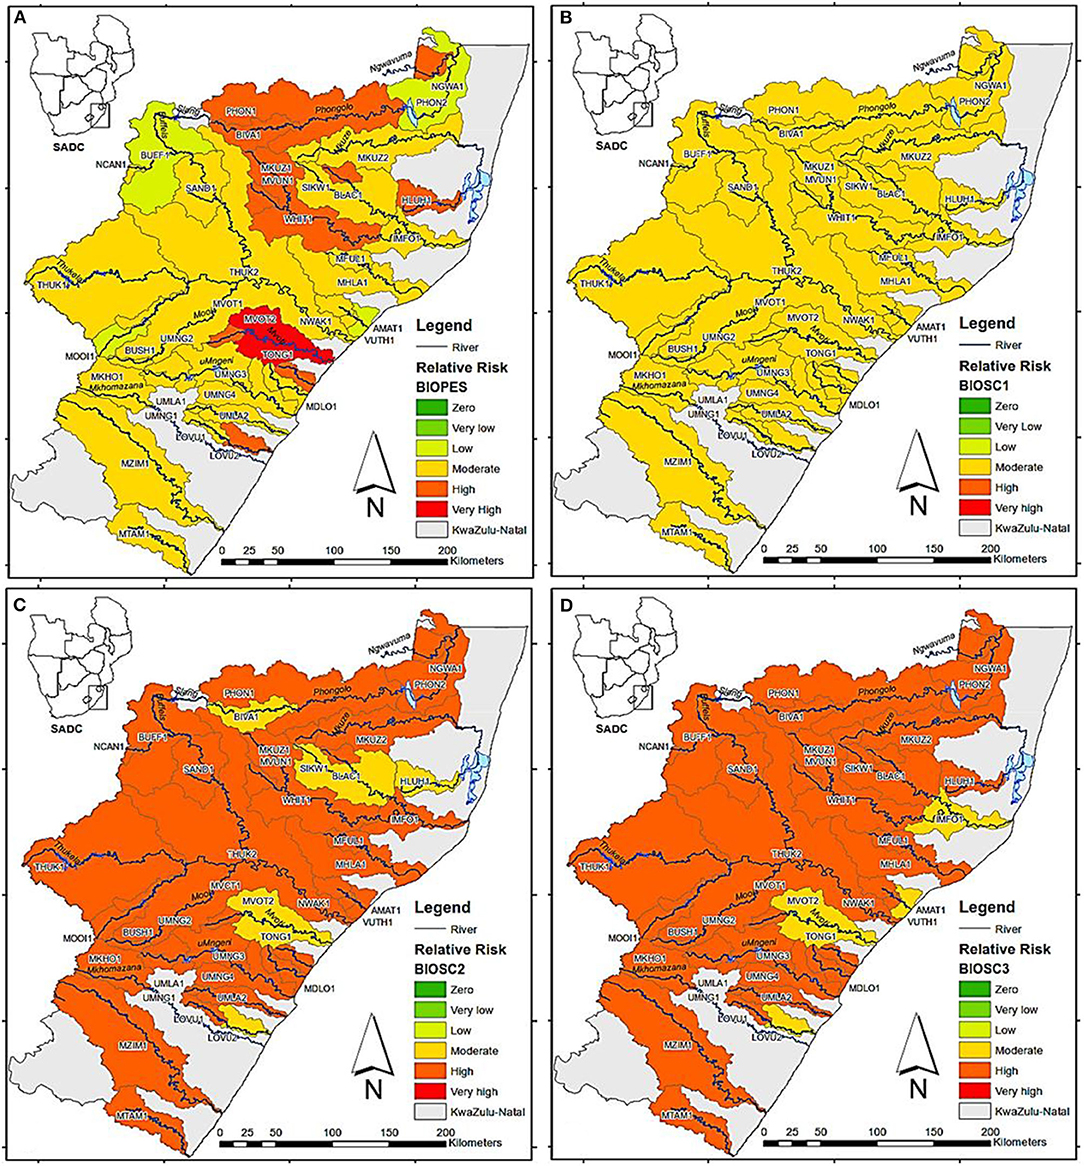
Figure 6. Final biodiversity risk classifications of KwaZulu-Natal rivers studied from 2015 to 2016 based on the present ecological state (A); risk associated with low flow (B); risk associated with limited or degraded habitat (C); and risk associated with poor water quality (D).
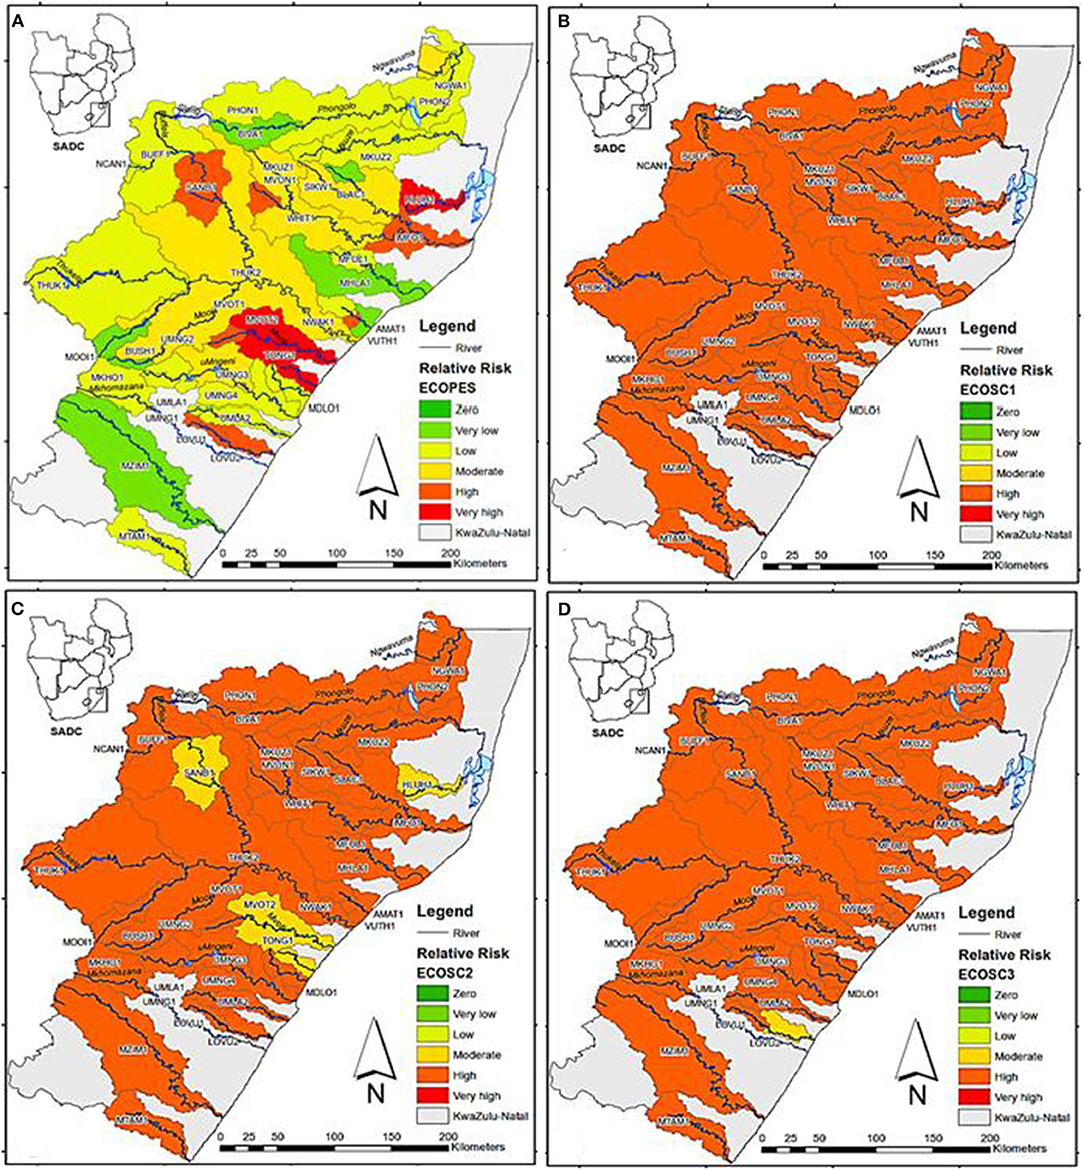
Figure 7. Final ecosystem risk classifications of KwaZulu-Natal rivers studied from 2015 to 2016 based on the present ecological state (A); risk associated with low flow (B); risk associated with limited or degraded habitat (C); and risk associated with poor water quality (D).
An advantage of the BN model is that it can be directly used as an adaptive management tool by setting the state of an endpoint to the desired level and essentially solving the model “backwards” (Ayre and Landis, 2012). For this study, we set our endpoints to 100% low risk. The 100% low-risk simulation represented the resource management goals for South African rivers (DWA, 2012). Using AMAT1 region, our 100% low-risk simulation altered the risk distributions in the BN model and also gave insights into the input parameters posing the highest risk to the endpoints (Figure 8A). Water quality stressors posed the highest risk (55.6%) to the biodiversity endpoint, while river health [measured as the macroinvertebrate response assessment index (MIRAI)] posed the highest risk (81.6%) to the ecosystem endpoint. Habitat stressors posed the lowest risk to both biodiversity (27.8%) and ecosystem (29.5%) endpoints (Figure 8B).
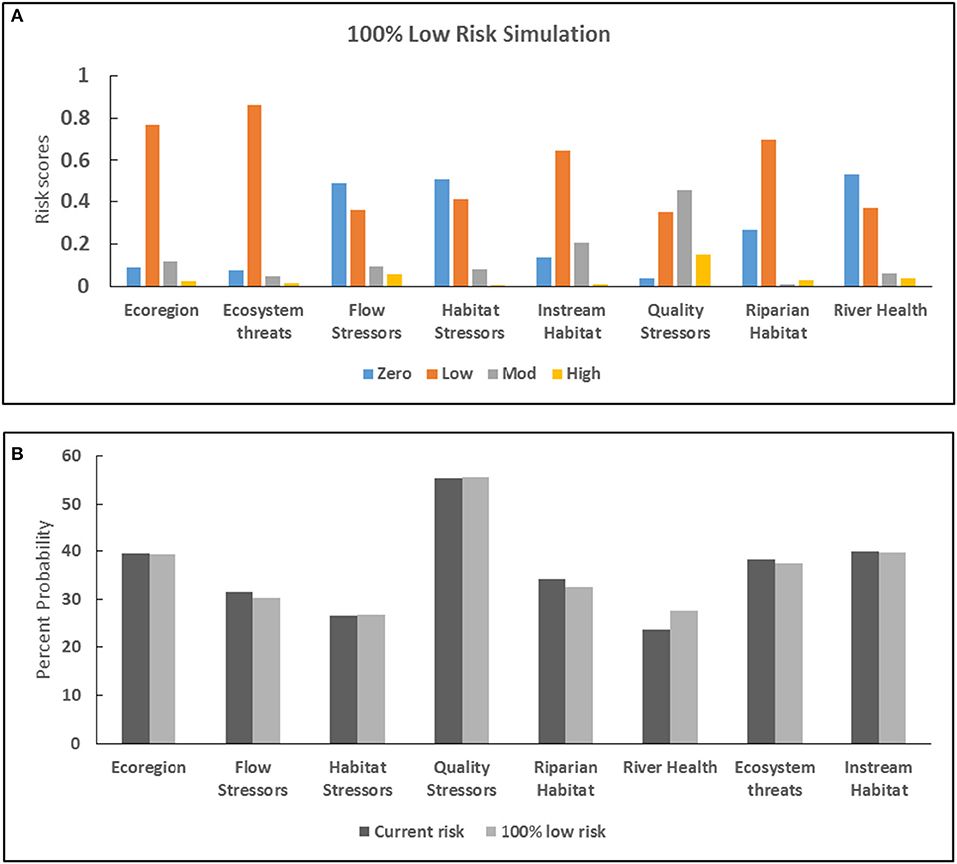
Figure 8. Low risk simulation of KwaZulu-Natal rivers; (A) risk distribution for the low risk simulation, and (B) comparison between low risk and current risk scenarios.
All the input parameters skewed toward zero or low risk in the low-risk simulation, except water quality stressors that skewed toward moderate risk (Figure 8A). The habitat stressors skewed toward zero risks in the low-risk simulation (Figure 8A). The flow stressors, riparian habitat, ecosystem threats and instream habitat had higher scores at the current risk scenarios than at the low-risk simulation (Figure 8B). The ecoregion, habitat stressors and water quality stressors were fairly the same for both the current scenario and low-risk simulation, but river health input had lower scores for the current scenario than at the low-risk simulation (Figure 8B). The habitat stressors were fairly stable in both the low and current risk scenarios (Figure 8B). As the 100% low-risk simulation represented the expected ideal situations for our endpoints, the stressors that are at comparable risk levels in the current and low-risk scenarios gave an indication of acceptable levels of risks in achieving the national management goals for the rivers in this study.
Our sensitivity analysis indicated that ecosystem threats were the highest contributor to the overall risk to biodiversity, while river health was the highest contributor to the overall risk to the ecosystem and the lowest contributor to both endpoints was habitat stressor (Table 1). As expected, there was generally a high probability of endpoints to be at high risk during scenario 3 and the high-risk simulation, but those risk probabilities were reduced in the low-risk simulation.
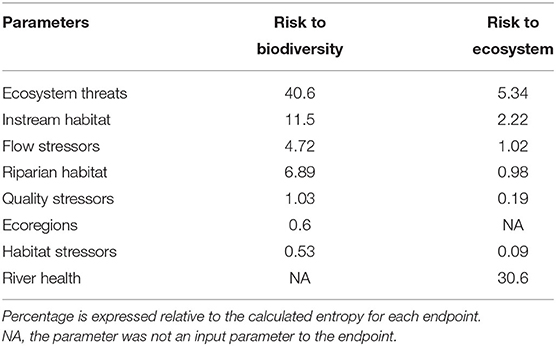
Table 1. Sensitivity analysis for endpoints, showing the percent of calculated entropy for each endpoint attributed to input nodes.
The purpose of our study was to apply the BN-RRM in assessing the impacts of multiple stressors on the well-being of KZN rivers using macroinvertebrates as our indicator species and incorporating different management alternatives into the models. As demonstrated in this study, BN can be used as an adaptive management tool for ecological risk assessments of multiple stressors, whether they are from chemical or non-chemical sources (Landis et al., 2017). Bayesian Network models can be used interactively to visually communicate responses of endpoints to variables, compare risk regions and can be used as a risk communication tool to compare risk under theoretical scenarios (Landis et al., 2017). Our BN succeeded in calculating the overall risk to the two endpoints selected for this study and identified ecosystem threats and river health as the most influential contributors to the risk to biodiversity and ecosystem, respectively, in the study area; while habitat stressors had the lowest risk contribution to both endpoints. The development of risk models and calculation of current risk within the study area was the initial step in assessing the risk to the macroinvertebrate biodiversity and ecosystem well-being. We obtained region-specific data during our extensive sampling program for the model parameters, and these data were used in the calculation of risk to the endpoint in our current scenario.
With the BN model, we were able to account for potential synergistic effects of variables and the effects of ecosystem threats through the conditional probability tables (CPTs), which allowed for complex ecological interactions to be incorporated into the model's complexity (Maxwell et al., 2015; Landis et al., 2017). For example, the CPT for Instream Habitat was selected in this study to represent the integrated variable for water quality (quality stressors), flow stressors, habitat stressors and determinants of physical habitat (Davies and Day, 1998). The CPTs were established using Netica ratio equations whereby when water quality is observed in a high-risk rank state, the relative importance of flow and habitat was hypothesized to be at lower risk states. Thereafter when the flow is in a high-rank state, the other variables are weighted lower and such was done to habitat when it is in a high-rank state. When variables were in a zero to moderate risk state, they were all weighted equally. It is these synergistic effects that may explain why ecosystem threat was the disturbance that most strongly influenced the level of the potential risk to biodiversity endpoint (Landis et al., 2017). Also, input parameters and CPTs can easily be refined or updated to reflect current knowledge of the river sites, thereby reducing uncertainty in the data which may be caused by incomplete data and sampling errors (Marcot et al., 2006; Landis et al., 2017). Also, it is possible for new data to be added to BN risk models to reflect new knowledge of the system (Fuster-Parra et al., 2016). Thus, access to new data will greatly reduce uncertainty and reflect a more accurate risk evaluation (Landis et al., 2017).
Evaluating uncertainties is necessary for policy or management decision making, but care has to be taken as such information may easily be misused (Aven and Krohn, 2014). It is difficult to predict future risk characteristics, therefore, not properly addressing risks and its associated uncertainties may lead to short term solutions, which could be insufficient in the long term (Refsgaard et al., 2013, 2014). Decision support models help a decision-maker to evaluate the consequences of various management alternatives (Holzkämper et al., 2012). However, awareness of the various sources of uncertainty may help to ascertain justified decisions (Uusitalo et al., 2015). Thus, a useful model should include information about the uncertainties related to each of the decision options, because the certainty of the desired outcome may be a central criterion for the selection of the management policy (Uusitalo et al., 2015). Uncertainty in BN risk model results reflects in the risk distributions for each node; where uncertainty increases as the risk distribution increases (Holt et al., 2014).
Not only are BNs networks effective at synthesizing the interactions of multiple stressors and calculating risk, but they may be used to identify parameters for remediation and model the impacts of different management scenarios. By evaluating the BN models in reverse, the overall risk output may be manually altered to identify specific conditions of stressors to achieve management decisions. Another advantage of using BNs in risk assessments is their ability to model risk reduction scenarios for best management practices (Johns et al., 2017; Landis et al., 2017). The input parameters in the BN may be altered to model the predicted conditions under different management strategies or upon implementation of best management practice (Duggan et al., 2015; Herring et al., 2015; Johns et al., 2017). Using BN, we identified the stressors contributing the highest risks, which were water quality stressors for biodiversity and river health for ecosystem endpoints in this study. The current BN for our endpoints showed the frequency distributions for all input parameters. As the model was changed to simulate a low-risk scenario, the distribution for all the input parameters changed to give indications of the critical inputs in the model that need to be closely monitored to attain a 100% low risk. The distribution changes not only reflected a change in the risk state for those nodes, but it was also a reflection of the reduction in the model's uncertainty. Many ecological risk assessments (EcoRA) and even some probabilistic models are not capable of such analysis without being entirely changed to a new framework.
Flowing water is the defining characteristic of rivers (Nadeau and Rains, 2007), with important influence on aquatic biota (Bunn and Arthington, 2002). Flow alteration in rivers is often the most severe and continuing threat to their ecological sustainability and associated floodplain wetlands (Pringle, 2001). However, water resource managers often have difficulty in assessing the flow velocity a river needs to maintain its ecosystem, while still enabling water abstraction for other uses (Vörösmarty et al., 2010). Natural flows periodically include low flow periods as a result of precipitation deficits. Low flows are seasonal but may also be induced by anthropogenic activities which cause a deviation from the natural flow regime (Al-Faraj and Scholz, 2014). Artificial flow reductions are those created by human activities, such as dam closure, groundwater abstraction and water diversion (Adams et al., 2016). Demand for water gets to the peak during dry periods of the year when streams have naturally low flows, which are worsened by water abstraction (Mishra and Singh, 2010). Flow alteration exerts a direct physical influence on aquatic biota and indirectly influences substrate composition, water chemistry, nutrient availability, organic substances, as well as in-stream habitat availability and suitability (Dewson et al., 2007).
Habitat structure affects biota community composition in freshwater ecosystems, with species diversity and abundance often influenced by structural complexity and heterogeneity (Tews et al., 2004). Previous studies have shown that macroinvertebrates can be influenced by both complexity and heterogeneity (Barnes et al., 2013). Hence, structural features of their habitats have consequently become a central focus in river management (Feld et al., 2011). During low flows, there may be adverse effects of habitat heterogeneity as a result of fragmentation, which disrupts essential biological processes such as dispersal and resource acquisition (Saunders et al., 1991). However, not all species in an ecosystem are equally affected by spatial structures in either heterogeneous or fragmented state (Steffan-Dewenter and Tscharntke, 2000). The severity of reduced flow has an important influence on invertebrate responses because it determines the magnitudes of changes in the environment, habitat diversity, sedimentation and availability of food resources (e.g., periphyton) (Lake, 2000). During our study, there were limited habitat diversity and connectivity in the lowland streams as a result of drought (low flow), while a diverse range of suitable microhabitats remained available in the upland rivers. As observed in this study, reduced flows in perennial rivers may cause decreases in taxonomic richness (Poff and Zimmerman, 2010). A loss of taxonomic richness in the upland sites may be attributed to the loss of habitat types (e.g., fast flows or rapids) during the low flows, hence resulting in the generally low-moderate risk to the endpoints of this study in the current scenario, and a resultant high risk in the alternative scenarios. Also during the low flow scenario, changes in macroinvertebrate biodiversity (community composition and taxa richness) could probably result in increased habitat suitability for some species and decreased suitability for others (Gore et al., 2001); hence this will result in high risks to biodiversity and ecosystem well-being as demonstrated in our alternative scenarios. Furthermore, the drift behavior of macroinvertebrates enables them to leave a stream reach or seek refuge in more favorable patches of the river in events of unsuitable low flow conditions (Verdonschot et al., 2014). This drift behavior enables organisms to escape unfavorable conditions, either actively or passively (James et al., 2008). Studies have shown that passive drift decreases during low flow conditions, while other studies have shown that active drift increases during periods of low flow (Naman et al., 2016). Active drifts during low flow are often caused by insufficient water velocities to meet nutritional, physiological and habitat requirements (Brooks and Haeusler, 2016). Active drift may also be a predator avoidance behavior, and this may increase if predator density increases during the low flow (Naman et al., 2016). Active drifts may, therefore, cause a reduction in biodiversity as demonstrated by our alternative risk scenarios.
In our study, the current scenario indicated that the lowland river sites had the highest risk to the endpoints. As demonstrated, the impact of low flow was greatest in the lowland rivers where habitat diversity was limited, and habitat conditions were severely altered. Also, in the current scenario, our study showed that the endpoints were at high risk within the proximity of agricultural lands and industries (e.g., MVOT2, TONG1, and LOVU2), while the regions within minimally impacted upstream areas were at low risk (e.g., MKHO1 and AMAT1). The high risk of the BUSH1 region to the biodiversity in scenarios 2 and 3; and ecosystem in scenario 3 maybe because of the impacts of the densely populated villages in its upper catchment, through domestic wastes. Also, the MVOT2 is highly impacted by the industrial activities (paper and sugar mills) along its course and their effluent discharge points form confluences with the lower part of the river, which makes it the highest risk region in the current scenarios of our endpoints. In scenario 3, LOVU2 had the lowest risk, while BUSH1 had the highest risk.
The BN-RRM model's intrinsic flexibility makes it a powerful tool for resource management because alternative management scenarios can easily be evaluated for desired objectives (Landis et al., 2017). Moreover, the graphic interface of the model results makes it a valuable tool for collaborative resource management (Carriger et al., 2016). This study provides the foundation for assessing the effects of multiple stressors in rivers of KZN using macroinvertebrate biodiversity and ecosystem as assessment endpoints over a regional spatial scale and incorporating site-specific information. Our study lays the foundation for future risk assessment for the rivers of KZN. The model created in this research also provides a foundation for assessing the impacts of adaptive management strategies, and these models may be adapted to the evaluation of risk changes for best management practices in the rivers of KZN.
Specific chemicals or ecological stressors should be integrated into this risk framework for future studies in KZN; for example, the effects of invasive alien biota or chemicals on biological endpoints can be investigated using this model. Rivers of KZN are being impacted by pollution from different anthropogenic land uses across longitudinal gradients. These anthropogenic sources include effluents from domestic wastes, industrial effluents from the paper and sugar mills, agricultural practices and water abstraction. All these anthropogenic impacts pose risks to the endpoints of the rivers if not properly regulated or managed. Hence the river systems will continue to deteriorate. Deteriorated river systems will consequently not be able to meet their ecological functions.
Our study has demonstrated that subtle changes in environmental management may result in large changes in the risk distribution of sensitive endpoints and that the BN-RRM risk assessment plays a critical role in adaptive management schemes (Carriger et al., 2016). Strict adherence to environmental laws on the treatment and discharge of wastewater by industries should be enforced, as this will help to improve the water quality of the high-risk regions (e.g., MVOT2 and TONG1).
The raw data supporting the conclusions of this article will be made available by the authors, without undue reservation.
OA conceived paper with CD and GO'B. OA collected, analyzed data, and wrote the paper. GO'B also assisted OA to develop the risk models. CD and GO'B supervised the study and contributed valuable comments to the manuscript. All authors contributed to the article and approved the submitted version.
We are grateful to the University of KwaZulu-Natal (ZA), the National Research Foundation (ZA), and Umgeni Water (ZA) for financial assistance during this study.
The authors declare that the research was conducted in the absence of any commercial or financial relationships that could be construed as a potential conflict of interest.
We are grateful to colleagues and staff of the Aquatic Ecosystem Research Group, University of KwaZulu-Natal, Pietermaritzburg (ZA) for their help in field data collection. The content of this manuscript has been published [IN PART] as part of the thesis of Agboola (2017).
The Supplementary Material for this article can be found online at: https://www.frontiersin.org/articles/10.3389/frwa.2020.584936/full#supplementary-material
Adams, J. B., Cowie, M., and Van Niekerk, L. (2016). Assessment of Completed Ecological Water Requirement Studies for South African Estuaries and Responses to Changes in Freshwater Inflow. (Pretoria: Water Research Commission).
Agboola, O. A. (2017). Monitoring and Assessment of Macroinvertebrate Communities in Support of River Health Management in KwaZulu-Natal, South Africa. (Ph.D. thesis). Pietermaritzburg: University of KwaZulu-Natal.
Al-Faraj, F. A., and Scholz, M. (2014). Assessment of temporal hydrologic anomalies coupled with drought impact for a transboundary river flow regime: the Diyala watershed case study. J. Hydrol. 517, 64–73. doi: 10.1016/j.jhydrol.2014.05.021
Alves, R. I., Sampaio, C. F., Nadal, M., Schuhmacher, M., Domingo, J. L., and Segura-Muñoz, S. I. (2014). Metal concentrations in surface water and sediments from Pardo River, Brazil: human health risks. Environ. Res. 133, 149–155. doi: 10.1016/j.envres.2014.05.012
Aven, T., and Krohn, B. S. (2014). A new perspective on how to understand, assess and manage risk and the unforeseen. Rel. Eng. Syst. Safety 121, 1–10. doi: 10.1016/j.ress.2013.07.005
Ayre, K. K., and Landis, W. G. (2012). A Bayesian approach to landscape ecological risk assessment applied to the Upper Grande Ronde watershed, Oregon. Hum. Ecol. Risk Assess. 18, 946–970. doi: 10.1080/10807039.2012.707925
Barnes, J. B., Vaughan, I. P., and Ormerod, S. J. (2013). Reappraising the effects of habitat structure on river macroinvertebrates. Freshwater Biol. 58, 2154–2167. doi: 10.1111/fwb.12198
Bednarek, A., Szklarek, S., and Zalewski, M. (2014). Nitrogen pollution removal from areas of intensive farming—comparison of various denitrification biotechnologies. Ecohydrol. Hydro. 14, 132–141. doi: 10.1016/j.ecohyd.2014.01.005
Brooks, A. J., and Haeusler, T. (2016). Invertebrate responses to flow: trait-velocity relationships during low and moderate flows. Hydrobiologia 773, 23–34. doi: 10.1007/s10750-016-2676-z
Bunn, S. E., and Arthington, A. H. (2002). Basic principles and ecological consequences of altered flow regimes for aquatic biodiversity. Environ. Manage. 30, 492–507. doi: 10.1007/s00267-002-2737-0
Carriger, J. F., Barron, M. G., and Newman, M. C. (2016). Bayesian networks improve causal environmental assessments for evidence-based policy. Environ. Sci. Tech. 50, 13195–13205. doi: 10.1021/acs.est.6b03220
Chen, J. C., and Landis, W. G. (2005). “Chapter 10: using the relative risk model for a regional-scale ecological risk assessment of the squalicum creek watershed,” in Regional Scale Ecological Risk Assessment: Using the Relative Risk Model (Boca Raton, FL: CRC Press), 195–230.
Chen, Q., and Liu, J. (2014). Development process and perspective on ecological risk assessment. Acta Ecol. Sin. 34, 239–245. doi: 10.1016/j.chnaes.2014.05.005
Colnar, A. M., and Landis, W. G. (2007). Conceptual model development for invasive species and a regional risk assessment case study: the European green crab, Carcinus maenas, at Cherry Point, Washington, USA. Hum. Ecol. Risk Assess. 13, 120–155. doi: 10.1080/10807030601105076
Dallas, H. F. (2004). Spatial variability in macroinvertebrate assemblages: comparing regional and multivariate approaches for classifying reference sites in South Africa. Afr. J. Aquat. Sci. 29, 161–171. doi: 10.2989/16085910409503807
Dewson, Z. S., James, A. B., and Death, R. G. (2007). A review of the consequences of decreased flow for instream habitat and macroinvertebrates. J. N. Am. Benthol. Soc. 26, 401–415. doi: 10.1899/06-110.1
Dickens, C. W., and Graham, P. (2002). The South African Scoring System (SASS) version 5 rapid bioassessment method for rivers. Afr. J. Aqu. Sci. 27, 1–10. doi: 10.2989/16085914.2002.9626569
Dudgeon, D., Arthington, A. H., Gessner, M. O., Kawabata, Z. I., Knowler, D. J., Lévêque, C., et al. (2006). Freshwater biodiversity: importance, threats, status and conservation challenges. Biol. Rev. 81, 163–182. doi: 10.1017/S1464793105006950
Duggan, J. M., Eichelberger, B. A., Ma, S., Lawler, J. J., and Ziv, G. (2015). Informing management of rare species with an approach combining scenario modelling and spatially explicit risk assessment. Eco. Health Sust. 1, 1–18. doi: 10.1890/EHS14-0009.1
DWA (Department of Water Affairs). (2010). Resource Directed Management of Water Quality: Planning Level Review of Water Quality in South Africa. Sub-series No. WQP 2.0. (Pretoria).
DWA (Department of Water Affairs South Africa). (2012). Green Drop Progress Report 2012. Available online at: http://www.dwaf.gov.za/dir_ws/GDS/Docs/DocsDefault.aspx (accessed May, 2016).
Farrance, I., and Frenkel, R. (2014). Uncertainty in measurement: a review of Monte Carlo simulation using Microsoft Excel for the calculation of uncertainties through functional relationships, including uncertainties in empirically derived constants. Clin. Biochem. Rev. 35, 37.
Feld, C. K., Birk, S., Bradley, D. C., Hering, D., Kail, J., Marzin, A., et al. (2011). From natural to degraded rivers and back again: a test of restoration ecology theory and practice. Adv. Ecol. Res. 44, 119–209. doi: 10.1016/B978-0-12-374794-5.00003-1
Fuster-Parra, P., Tauler, P., Bennasar-Veny, M., Ligeza, A., López-González, A. A., and Aguil,ó, A. (2016). Bayesian network modeling: a case study of an epidemiologic system analysis of cardiovascular risk. Comp. Meth. Prog. Biomed. 126, 128–142. doi: 10.1016/j.cmpb.2015.12.010
Gore, J. A., Layzer, J. B., and Mead, J. I. M. (2001). Macroinvertebrate instream flow studies after 20 years: a role in stream management and restoration. Riv. Res. Appl. 17, 527–542. doi: 10.1002/rrr.650
Heenkenda, M. K., and Bartolo, R. (2016). Regional ecological risk assessment using a relative risk model: a case study of the Darwin Harbour, Darwin, Australia. Hum. Ecol. Risk Assess. 22, 401–423. doi: 10.1080/10807039.2015.1078225
Herring, C. E., Stinson, J., and Landis, W. G. (2015). Evaluating nonindigenous species management in a Bayesian networks derived relative risk framework for Padilla Bay, WA, USA. Integr. Environ. Assess. Manage 11, 640–652. doi: 10.1002/ieam.1643
Hines, E. E., and Landis, W. G. (2014). Regional risk assessment of the Puyallup River Watershed and the evaluation of low impact development in meeting management goals. Integr. Environ. Assess. Manage. 10, 269–278. doi: 10.1002/ieam.1509
Holt, J., Leach, A. W., Schrader, G., Petter, F., MacLeod, A., Gaag, D. J., et al. (2014). Eliciting and combining decision criteria using a limited palette of utility functions and uncertainty distributions: illustrated by application to pest risk analysis. Risk Anal. 34, 4–16. doi: 10.1111/risa.12089
Holzkämper, A., Kumar, V., Surridge, B. W., Paetzold, A., and Lerner, D. N. (2012). Bringing diverse knowledge sources together-A meta-model for supporting integrated catchment management. J. Environ. Manage. 96, 116–127. doi: 10.1016/j.jenvman.2011.10.016
Hua, L., Shao, G., and Zhao, J. (2017). A concise review of ecological risk assessment for urban ecosystem application associated with rapid urbanization processes. Int. J. Sust. Dev. World Ecol. 24, 248–261. doi: 10.1080/13504509.2016.1225269
Hunsaker, C. T., Graham, R. L., Suter, G. W., O'Neill, B. L., Jackson, B. L., and Barnthouse, L. W. (1989). Regional Ecological Risk Assessment: Theory and Demonstration (No. ORNL/TM-11128). (Tennesse: Oak Ridge National Lab).
James, A. B. W., Dewson, Z. S., and Death, R. G. (2008). The effect of experimental flow reductions on macroinvertebrate drift in natural and streamside channels. River Res. Appl. 24, 22–35. doi: 10.1002/rra.1052
Janssen, H. (2013). Monte-Carlo based uncertainty analysis: Sampling efficiency and sampling convergence. Rel. Eng. Sys. Safe. 109, 123–132. doi: 10.1016/j.ress.2012.08.003
Johns, A. F., Graham, S. E., Harris, M. J., Markiewicz, A. J., Stinson, J. M., and Landis, W. G. (2017). Using the Bayesian network relative risk model risk assessment process to evaluate management alternatives for the South River and upper Shenandoah River, Virginia. Integr. Env. Assess. Manage. 13, 100–114. doi: 10.1002/ieam.1765
Lake, P. S. (2000). Disturbance, patchiness, and diversity in streams. J. N. Am. Benthol. Soc. 19, 573–592. doi: 10.2307/1468118
Landis, W. G., Ayre, K. K., Johns, A. F., Summers, H. M., Stinson, J., Harris, M. J., et al. (2017). The multiple stressor ecological risk assessment for the mercury-contaminated South River and upper Shenandoah River using the Bayesian network-relative risk model. Integr. Environ. Assess. Manag. 13, 85–99. doi: 10.1002/ieam.1758
Landis, W. G., and Wiegers, J. A. (1997). Design considerations and a suggested approach for regional and comparative ecological risk assessment. Hum. Ecol. Risk Assess. 3, 287–297. doi: 10.1080/10807039709383685
Landis, W. G., and Wiegers, J. K. (2005). “Introduction to the regional risk assessment using the relative risk model,” in Regional Scale Ecological Risk Assessment Using the Relative Risk Model. eds W. G. Landis (Boca Raton, FL: CRC), 1–36. doi: 10.1201/9780203498354.ch1
Landis, W. G., and Wiegers, J. K. (2007). Ten years of the relative risk model and regional scale ecological risk assessment. Hum. Ecol. Risk Assess. 13, 25–38. doi: 10.1080/10807030601107536
Li, X., Zuo, R., Teng, Y., Wang, J., and Wang, B. (2015). Development of relative risk model for regional groundwater risk assessment: a case study in the lower Liaohe river plain, China. PLoS ONE 10:e0128249. doi: 10.1371/journal.pone.0128249
Linkov, I., Satterstrom, F. K., Kiker, G., Batchelor, C., Bridges, T., and Ferguson, E. (2006). From comparative risk assessment to multi-criteria decision analysis and adaptive management: recent developments and applications. Environ. Int. 32, 1072–1093. doi: 10.1016/j.envint.2006.06.013
Liu, J., Chen, Q., and Li, Y. (2010). Ecological risk assessment of water environment for Luanhe River Basin based on relative risk model. Ecotox 19, 1400–1415. doi: 10.1007/s10646-010-0525-9
Lu, Y., Song, S., Wang, R., Liu, Z., Meng, J., Sweetman, A. J., et al. (2015). Impacts of soil and water pollution on food safety and health risks in China. Environ. Int. 77, 5–15. doi: 10.1016/j.envint.2014.12.010
Marcot, B. G., Steventon, J. D., Sutherland, G. D., and McCann, R. K. (2006). Guidelines for developing and updating Bayesian belief networks applied to ecological modeling and conservation. Can. J. Forest Res. 36, 3063–3074. doi: 10.1139/x06-135
Maxwell, P. S., Pitt, K. A., Olds, A. D., Rissik, D., and Connolly, R. M. (2015). Identifying habitats at risk: simple models can reveal complex ecosystem dynamics. Ecol. Appl. 25, 573–587. doi: 10.1890/14-0395.1
McCann, R. K., Marcot, B. G., and Ellis, R. (2006). Bayesian belief networks: applications in ecology and natural resource management. Can. J. For. Res. 36, 3053–3062. doi: 10.1139/x06-238
Mekonnen, M. M., Lutter, S., and Martinez, A. (2016). Anthropogenic nitrogen and phosphorus emissions and related grey water footprints caused by EU-27′s crop production and consumption. Water 8:30. doi: 10.3390/w8010030
Midgley, D. C., Pitman, W. V., and Middleton, B. J. (1994). Surface Water Resources of South Africa 1990; Vol. 6. Book of Maps, Drainage Regions U, V, W, X, Eastern Escarpment. Water Research Commission.
Mishra, A. K., and Singh, V. P. (2010). A review of drought concepts. J. Hydrol. 391, 202–216. doi: 10.1016/j.jhydrol.2010.07.012
Mommaerts, V., Reynders, S., Boulet, J., Besard, L., Sterk, G., and Smagghe, G. (2010). Risk assessment for side-effects of neonicotinoids against bumblebees with and without impairing foraging behavior. Ecotox 19:207. doi: 10.1007/s10646-009-0406-2
Moraes, R., Landis, W. G., and Molander, S. (2002). Regional risk assessment of a Brazilian rain forest reserve. Hum. Ecol. Risk Assess. 8, 1779–1803. doi: 10.1080/20028091057600
Nadeau, T. L., and Rains, M. C. (2007). Hydrological connectivity between headwater streams and downstream waters: how science can inform policy. J. Am. Wat. Res. Assoc. 43, 118–133. doi: 10.1111/j.1752-1688.2007.00010.x
Naman, S. M., Rosenfeld, J. S., and Richardson, J. S. (2016). Causes and consequences of invertebrate drift in running waters: from individuals to populations and trophic fluxes. Can. J. Fish. Aqua. Sci. 73, 1292–1305. doi: 10.1139/cjfas-2015-0363
Nitasha, K., and Sanjiv, T. (2015). Influences of natural and anthropogenic factors on surface and groundwater quality in rural and urban areas. Front. Lif. Sci. 8, 23–39. doi: 10.1080/21553769.2014.933716
Nordberg, G. F., Bernard, A., Diamond, G. L., Duffus, J. H., Illing, P., Nordberg, M., et al. (2018). Risk assessment of effects of cadmium on human health (IUPAC Technical Report). Pure Appl. Chem. 90, 755–808. doi: 10.1515/pac-2016-0910
Norsys Software Corporation. (2014). Netica Bayesian Network Application. Vancouver, BC. Available online at: http://www.norsys.com/netica.html
Norton, S. B., Rodier, D. J., van der Schalie, W. H., Wood, W. P., Slimak, M. W., and Gentile, J. H. (1992). A framework for ecological risk assessment at the EPA. Environ. Tox. Chem. 11, 1663–1672. doi: 10.1002/etc.5620111202
Obery, A. M., and Landis, W. G. (2002). A regional multiple stressor risk assessment of the Codorus Creek watershed applying the relative risk model. Hum. Ecol. Ris. Assess. Int. J. 8, 405–428. doi: 10.1080/20028091056980
O'Brien, G. C., Dickens, C., Hines, E., Wepener, V., Stassen, R., and Landis, W. G. (2018). A regional scale ecological risk framework for environmental flow evaluations. Hydro. Earth Sys. Sci. 22, 957–975 doi: 10.5194/hess-22-957-2018
O'Brien, G. C., and Wepener, V. (2012). Regional-scale risk assessment methodology using the Relative Risk Model (RRM) for surface freshwater aquatic ecosystems in South Africa. Water SA 38, 153–166. doi: 10.4314/wsa.v38i2.1
Poff, N. L., and Zimmerman, J. K. (2010). Ecological responses to altered flow regimes: a literature review to inform the science and management of environmental flows. Fresh. Biol. 55, 194–205. doi: 10.1111/j.1365-2427.2009.02272.x
Pringle, C. M. (2001). Hydrologic connectivity and the management of biological reserves: a global perspective. Ecol. Appl. 11, 981–998. doi: 10.1890/1051-0761(2001)011[0981:HCATMO]2.0.CO;2
Rast, W. (2009). Lakes: Freshwater Storehouses and Mirrors of Human Activities, Briefing Note, Assessment Programme Office for Global Water Assessment, Division of Water Sciences. (Perugia: UNESCO).
Refsgaard, J. C., Arnbjerg-Nielsen, K., Drews, M., Halsnæs, K., Jeppesen, E., Madsen, H., et al. (2013). The role of uncertainty in climate change adaptation strategies - a Danish water management example. Mitig. Adapt. Strateg. Glob. Chang. 18, 337–359. doi: 10.1007/s11027-012-9366-6
Refsgaard, J. C., Auken, E., Bamberg, C. A., Christensen, B. S., Clausen, T., Dalgaard, E., et al. (2014). Nitrate reduction in geologically heterogeneous catchments — a framework for assessing the scale of predictive capability of hydrological models. Sci. Tot. Environ. 468, 1278–1288. doi: 10.1016/j.scitotenv.2013.07.042
Refsgaard, J. C., van der Sluijs, J. P., Højberg, A. L., and Vanrolleghem, P. A. (2007). Uncertainty in the environmental modelling process–a framework and guidance. Environ. Mod. Soft. 22, 1543–1556. doi: 10.1016/j.envsoft.2007.02.004
Rivers-Moore, N., Goodman, P., and Nkosi, M. (2007). An assessment of the freshwater natural capital in KwaZulu-Natal for conservation planning. Water SA 33, 665–674. doi: 10.4314/wsa.v33i5.184088
Saunders, D. A., Hobbs, R. J., and Margules, C. R. (1991). Biological consequences of ecosystem fragmentation: a review. Conserv. Biol. 5, 18–32. doi: 10.1111/j.1523-1739.1991.tb00384.x
South African Weather Service. (2020). Annual State of the Climate of South Africa 2019. (Pretoria).
Steffan-Dewenter, I., and Tscharntke, T. (2000). Butterfly community structure in fragmented habitats. Ecol.Lett. 3, 449–456. doi: 10.1111/j.1461-0248.2000.00175.x
Tews, J., Brose, U., Grimm, V., Tielbörger, K., Wichmann, M. C., Schwager, M., et al. (2004). Animal species diversity driven by habitat heterogeneity/diversity: the importance of keystone structures. J. Biogeo. 31, 79–92. doi: 10.1046/j.0305-0270.2003.00994.x
Thirion, C. (2016). The Determination of Flow and Habitat Requirements for Selected Riverine Macroinvertebrates. (Ph.D. Thesis). (Potchefstroom: North-West University), 150.
United States Environmental Protection Agency (USEPA) (2000). Stressor Identification Guidance Document. EPA 822-B-00-025. Washington, DC: Office of Water and Office of Research and Development.
Uusitalo, L., Lehikoinen, A., Helle, I., and Myrberg, K. (2015). An overview of methods to evaluate uncertainty of deterministic models in decision support. Environ. Mod. Soft. 63, 24–31. doi: 10.1016/j.envsoft.2014.09.017
Verdonschot, P. F. M., Besse-Lototskaya, A. A., Dekkers, T. B. M., and Verdonschot, R. C. M. (2014). Directional movement in response to altered flow in six lowland stream Trichoptera. Hydrobiologia 740, 219–230. doi: 10.1007/s10750-014-1955-9
Villeneuve, B., Piffady, J., Valette, L., Souchon, Y., and Usseglio-Polatera, P. (2018). Direct and indirect effects of multiple stressors on stream invertebrates across watershed, reach and site scales: A structural equation modelling better informing on hydromorphological impacts. Sci. Tot. Environ. 612, 660–671. doi: 10.1016/j.scitotenv.2017.08.197
Vörösmarty, C. J., McIntyre, P. B., Gessner, M. O., Dudgeon, D., Prusevich, A., Green, P., et al. (2010). Global threats to human water security and river biodiversity. Nature 467, 555–561. doi: 10.1038/nature09440
Keywords: bayesian networks, ecological risk, macroinvertebrates, multiple stressors, habitat, relative risk model, risk assessment
Citation: Agboola OA, Downs CT and O'Brien G (2020) Ecological Risk of Water Resource Use to the Wellbeing of Macroinvertebrate Communities in the Rivers of KwaZulu-Natal, South Africa. Front. Water 2:584936. doi: 10.3389/frwa.2020.584936
Received: 18 July 2020; Accepted: 09 November 2020;
Published: 01 December 2020.
Edited by:
Roman Seidl, Leibniz University Hannover, GermanyReviewed by:
Angela Helen Arthington, Griffith University, AustraliaCopyright © 2020 Agboola, Downs and O'Brien. This is an open-access article distributed under the terms of the Creative Commons Attribution License (CC BY). The use, distribution or reproduction in other forums is permitted, provided the original author(s) and the copyright owner(s) are credited and that the original publication in this journal is cited, in accordance with accepted academic practice. No use, distribution or reproduction is permitted which does not comply with these terms.
*Correspondence: Colleen T. Downs, ZG93bnNAdWt6bi5hYy56YQ==
†ORCID: Colleen T. Downs orcid.org/0000-0001-8334-1510
Gordon O'Brien orcid.org/0000-0001-6273-1288
Disclaimer: All claims expressed in this article are solely those of the authors and do not necessarily represent those of their affiliated organizations, or those of the publisher, the editors and the reviewers. Any product that may be evaluated in this article or claim that may be made by its manufacturer is not guaranteed or endorsed by the publisher.
Research integrity at Frontiers
Learn more about the work of our research integrity team to safeguard the quality of each article we publish.