 Dawn R. URycki
 Stephen P. Good
 Byron C. Crump
 Jessica Chadwick
 Gerrad D. Jones
- 1Department of Biological and Ecological Engineering, Oregon State University, Corvallis, OR, United States
- 2College of Earth, Ocean, and Atmospheric Sciences, Oregon State University, Corvallis, OR, United States
Maintaining the quality and quantity of water resources in light of complex changes in climate, human land use, and ecosystem composition requires detailed understanding of ecohydrologic function within catchments, yet monitoring relevant upstream characteristics can be challenging. In this study, we investigate how variability in riverine microbial communities can be used to monitor the climate, geomorphology, land-cover, and human development of watersheds. We collected streamwater DNA fragments and used 16S rRNA sequencing to profile microbiomes from headwaters to outlets of the Willamette and Deschutes basins, two large watersheds prototypical of the U.S. Pacific Northwest region. In the temperate, north-south oriented Willamette basin, microbial community composition correlated most strongly with geomorphic characteristics (mean Mantel test statistic r = 0.19). Percentage of forest and shrublands (r = 0.34) and latitude (r = 0.41) were among the strongest correlates with microbial community composition. In the arid Deschutes basin, however, climatic characteristics were the most strongly correlated to microbial community composition (e.g., r = 0.11). In headwater sub-catchments of both watersheds, microbial community assemblages correlated with catchment-scale climate, geomorphology, and land-cover (r = 0.46, 0.38, and 0.28, respectively), but these relationships were weaker downstream. Development-related characteristics were not correlated with microbial community composition in either watershed or in small or large sub-catchments. Our results build on previous work relating streamwater microbiomes to hydrologic regime and demonstrate that microbial DNA in headwater streams additionally reflects the structural configuration of landscapes as well as other natural and anthropogenic processes upstream. Our results offer an encouraging indication that streamwater microbiomes not only carry information about microbial ecology, but also can be useful tools for monitoring multiple upstream watershed characteristics.
Introduction
Water quality and availability depends on the integrity of water resource systems, which are sensitive to changes in climate (Jiménez Cisneros et al., 2014), human land use (Foley et al., 2005), and ecosystem composition. Climate change is projected to increase drought frequency and reduce surface and groundwater availability in arid regions, and to negatively impact freshwater ecosystems and reduce surface water quality (Delpla et al., 2009; Jiménez Cisneros et al., 2014). It is well-understood that human development and land-use change results in increased surface runoff, eventually leading to larger flooding events and reduced groundwater recharge (e.g., Carter, 1961; Moscrip and Montgomery, 1997; Gregory et al., 2006; Wheater and Evans, 2009). Interactions among these factors exacerbate impacts to water resources (e.g., Feddema et al., 2005; IPCC, 2019), and better tools are needed to diagnose these effects on catchment ecohydrology at local scales.
In watershed catchments lacking sufficient hydrologic data, Seibert and McDonnell (2015) found that key pieces of data collected on short field campaigns (i.e., “soft data”) can prove useful for understanding catchment function. Leveraging a source of information-rich soft data could thus prove especially powerful in characterizing ungauged basins. DNA is gaining traction as a valuable source of data across research disciplines. One of the appeals of genetic data is the vast quantity of information (thousands of features or more) that can be extracted with relative ease from a single sample. In addition to falling costs, improved methods of DNA extraction and sequencing, resulting in higher-quality data (Li et al., 2015), have increased the appeal of genetic data for a wider range of applications, including hydrological studies. For instance, Mächler et al. (2019) used environmental DNA (eDNA) released from macro organisms to characterize hydrologic flow paths in an Alpine catchment in Switzerland. Analysis of aquatic DNA in boreal forests has been indicative of key gradients in catchment condition similar to morphologically derived stream macroinvertebrate metrics (Emilson et al., 2017), while similar DNA information has also been used to map landscape-level terrestrial biodiversity (Sales et al., 2020). Sugiyama et al. (2018) found that microbial DNA analysis, coupled with general information about optimal growth conditions of certain microbial groups, revealed information about groundwater flow paths that was not captured with chemical analyses. Microbial communities, or “microbiomes,” with their high biodiversity, are hypothesized to hold new clues that traditional hydrologic tracers have not been able to elucidate.
Streamwater microbiomes respond to conditions that are also likely related to biogeochemical cycling and streamflow including nutrient concentrations, pH, and temperature (Fortunato et al., 2013; Read et al., 2015; Savio et al., 2015; Doherty et al., 2017). Given that streamwater microbiomes are composed primarily of microbes that originate in upslope soil and groundwater environments (Crump et al., 2007, 2012; Sorensen et al., 2013; but see Hermans et al., 2019), it follows that these microbiomes could be rich sources of data about hydrologic function and upslope catchment conditions. Beyond potential source variation, the characteristics of how genetic material is transported, retained, and resuspended has been examined for environmental DNA fragments (Jerde et al., 2016; Shogren et al., 2017) as well as for microorganisms themselves (Droppo et al., 2009; Newby et al., 2009), wherein stream water microbial composition is influenced by both abiotic factors (e.g., flow rate, mixing with sediment waters) and biotic factors such as predation, intrinsic cell mobility, and reproduction. Read et al. (2015) found that stream microbiomes were related to upstream hydrology, and Good et al. (2018) employed microbial community composition to characterize flow regimes in a set of large Arctic rivers. Savio et al. (2015) found that stream microbiomes were more strongly correlated with macroscale properties related to catchment hydrology, such as stream length and catchment size, than with water temperature or pH along the length of the Danube River. It is unclear, however, whether and to what extent other macroscale catchment factors may shape the microbial community. Our overarching objective is to employ stream microbiomes to gain insight about watershed conditions and catchment function and how they shape downstream water quality and availability. The first step toward this goal is to understand how watersheds may influence streamwater microbial community composition. In this study, we explored how streamwater microbial community composition, characterized with aquatic DNA fragments, correlates with upstream catchment properties. 16S rRNA gene fragments have been used in microbiology since the 1980s to classify bacterial taxonomy (Kolbert and Persing, 1999), and the 16S rRNA gene is the most widely used phylogenetic marker gene for assessing prokaryotic microbiomes (Goodrich et al., 2014). We isolated and sequenced 16S rRNA collected from streamwater and examined how differences between microbial (bacteria and archaea) communities among catchments were related to differences in catchment characteristics across major watersheds and across spatial scales.
Materials and Methods
Watershed and Sub-catchment Characteristics
The Willamette and Deschutes basins, two similarly sized large (Willamette = 29,000 km2; Deschutes = 27,700 km2), adjacent watersheds separated by the Cascade Mountains in Oregon, USA were surveyed for variability in streamwater microbial communities. Mean elevation is 560 m in the Willamette Basin and 1,230 m in the Deschutes Basin. The Willamette Basin, on the windward side of the Cascades, receives a mean annual precipitation of 1,640 mm, but the Deschutes Basin on the leeward side receives a mean of just 530 mm annually. Mean annual discharge of the Willamette River (933 m3/s) is thus much greater than the Deschutes River (165 m3/s; U.S. Geological Survey, 2016a) at their respective outlets draining into the Columbia River at Oregon's northern border. Temperatures are comparable between the basins (mean annual minimum and maximum temperatures are 4 and 15°C in the Willamette Basin and 0 and 14°C in the Deschutes Basin, respectively). Both basins exhibit a range of land use, including minimally disturbed upper elevation headwater streams, crop and livestock agriculture, and highly developed urban areas; however the Willamette Basin is more developed overall, with greater percentages of impervious area and low-, medium-, and high-intensity development (Supplementary Table 1).
Sub-catchment characteristics for areas upstream of DNA sample collection points throughout the Willamette and Deschutes watersheds were obtained using the StreamStats tool developed by the United States Geological Survey (Ries et al., 2008; U.S. Geological Survey, 2016b). StreamStats is a national map-based web application that allows users to obtain basin boundaries, basin characteristics, and streamflow statistic estimates for gauged or ungauged user-specified sites. StreamStats employs a wide array of digital geospatial raster data layers which are processed through an online geographic information system to define drainage basin characteristics for any location (although available information varies by state). A script was developed using the Python programming language (www.python.org) to obtain all available StreamStats basin characteristics for each of our 61 sampling sites distributed throughout the two watersheds (URycki and Good, 2020a). The program queries the StreamStats Service API for a list of available basin characteristics for a specified state (OR) and the values for those characteristics given the latitude and longitude for each sample location retrieved from an input spreadsheet. The StreamStats Service API outputs a JSON file with the requested data, which our Python script decodes and writes to a csv file containing the list of sites and associated drainage basin characteristics. For this analysis, StreamStats quantities reported in English units were converted to metric.
Our analysis considered 42 macroscale sub-catchment characteristics for a relationship with streamwater microbial communities (Table 1). In addition to the StreamStats characteristics, we calculated topographic index and added latitudinal and longitudinal coordinates. From an initial suite of 46 available characteristics for each sample point, we then eliminated all but one of any redundant variables and summed three StreamStats characteristics “MINOR ROADS,” “STATE HIGHWAY ROADS,” and “MAJOR ROADS” into a new variable “ALL ROADS” (Supplementary Table 1). We then grouped remaining variables into four categories: climatic, geomorphic, land-cover, and development characteristics.
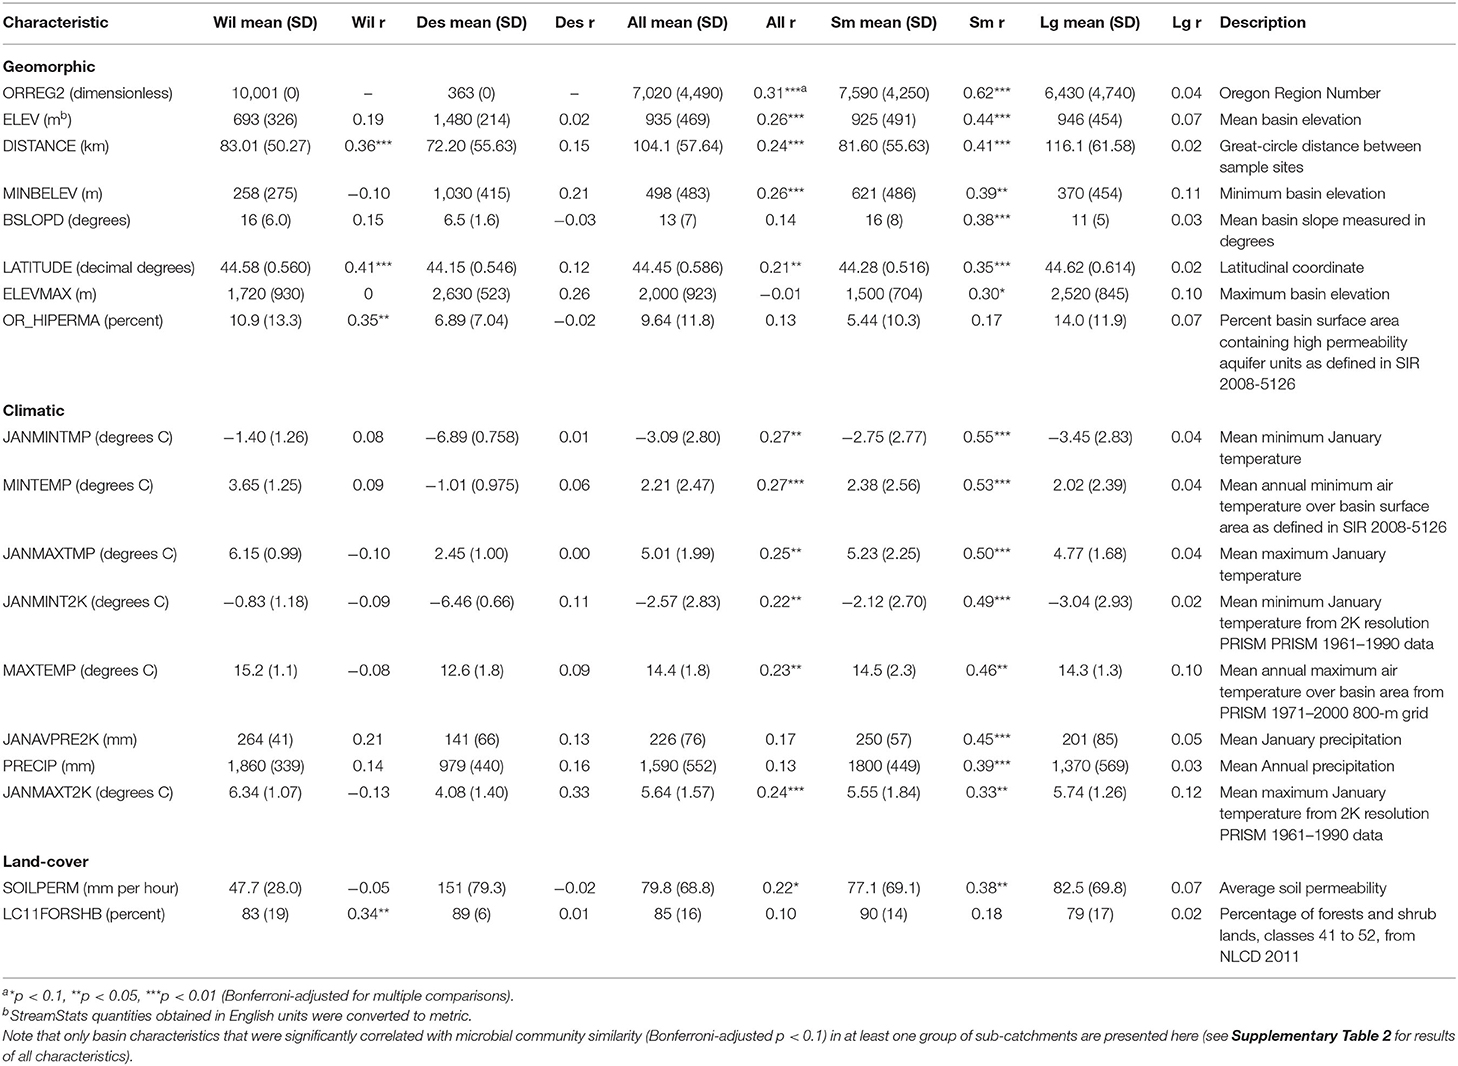
Table 1. Mean, standard deviation (SD), and correlation with microbial community similarity (Mantel statistic [r]) for statistically significant StreamStats macroscale basin characteristics by watershed and in small (Sm) and large (Lg) sub-catchments across the Willamette (Wil) and Deschutes (Des) watersheds, Oregon, USA.
DNA Collection and Sequencing
We collected streamwater DNA from a set of 61 sites in the summer of 2017. We sampled 40 sites in the Willamette watershed (25 July−8 August) and 21 sites in the Deschutes watershed (2–4 August; Figure 1). Sample sites spanned headwaters and tributaries to the main stem outlet at the bottom of the watershed. Sites were selected to capture the range of land cover, land use, and level of disturbance in each sub-catchment.
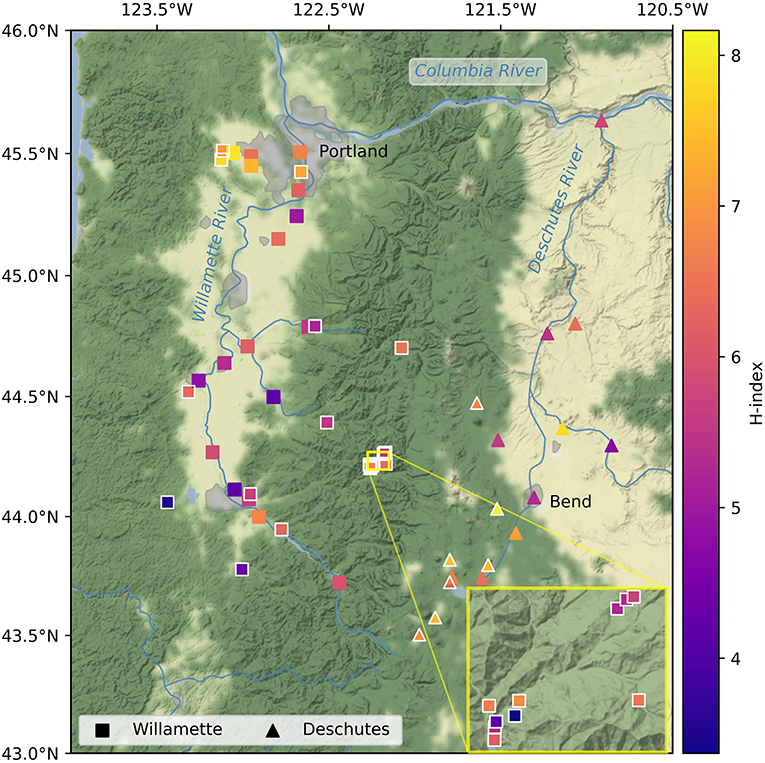
Figure 1. Alpha diversity (Shannon's index [H]) of streamwater microbiomes in the Willamette (squares) and Deschutes (triangles) watersheds in Oregon, USA. Outlined symbols indicate small sub-catchments (i.e., those with less than median drainage area). Inset shows vicinity of H.J. Andrews Experimental Forest.
Prior to sample collection each day, the plastic collection bucket was washed with antimicrobial soap, soaked for several minutes in a 10% hydrochloric acid bath, and triple rinsed with ultrapure water. Other reusable field equipment, such as collection tubing, was sterilized in an autoclave. Equipment was sample-rinsed prior to each collection and then triple-rinsed with deionized water following each collection.
Streamwater was collected from the approximate center of the waterway. Most samples were collected using a clean 2-gallon bucket lowered with a rope from a bridge. Although it was difficult to standardize collection depth, samples were collected near the surface and care was taken not to disturb the streambed. At very small streams, such as those in HJ Andrews Experimental Forest, samples were collected into a bucket as water exited flumes. At the few sites where either a flume or bridge were not available, a rope and bucket were tossed from the riverbank to the approximate center of the stream and pulled back to shore, again taking care not to disturb the streambed.
DNA samples were filtered and extracted from collected streamwater as described in Crump et al. (2003). Briefly, streamwater was pumped through a 0.2 μm Sterivex-GP filter (Millipore, Billerica, MA, USA) with a peristaltic pump (Geotech Environmental Equipment, Denver, CO, USA) until the filter clogged. DNA preservation/extraction buffer (100 mM Tris, 100 mM NaEDTA, 100 mM phosphate buffer, 1.5 M NaCl, 1% CTAB) was added to the filter with a syringe, and then filters were sealed and stored on dry ice until transferred to a −80°C freezer the same day, where samples were stored until further processing. DNA was isolated using phenol-chloroform extraction and isopropanol precipitation (Zhou et al., 1996; Crump et al., 2003; Amaral-Zettler et al., 2009) and stored at −20°C until amplification.
16S rRNA genes were PCR-amplified with dual-barcoded primers targeting the V4 region (515f GTGCCAGCMGCCGCGGTAA, 806r GGACTACHVGGGTWTCTAAT; Caporaso et al., 2011) that were linked to barcodes and Illumina adapters following Kozich et al. (2013). PCRs of DNA samples and no-template negative controls were run with HotStarTaq DNA Polymerase Master Mix (Qiagen) and thermocycler conditions: 3 min at 94°C followed by 30 cycles of 94°C 45 s, 50°C for 60 s, and 72°C for 90 s, followed by 10 min at 72°C (Caporaso et al., 2012). PCR products were purified and normalized with SequalPrep Normalization Plates (Thermo-Fisher), and sequenced with Illumina Miseq V.2 paired end 250 bp sequencing. Sequences were denoised using DADA2 (Callahan et al., 2016) implemented in QIIME2 (Bolyen et al., 2019) using default settings to prepare an abundance table of unique amplified sequences variants (ASVs). Sequences were taxonomically classified with the SILVA 16S rRNA gene database v.132 (Quast et al., 2013), and ASVs were removed if they were classified as chloroplasts or mitochondria, or if they were not classified to the domains Bacteria and Archaea. The dataset was then rarefied to 1,164 sequences per sample prior to calculation of biodiversity metrics. Rarefaction to 1,164 samples resulted in undersampling of some communities, which is not unusual in microbial studies, but allowed for retention of the most samples for the analysis (Supplementary Figure 1). Sequences from no-template PCR controls that passed DADA2 quality control represented 6 ASVs that did not appear in the rarefied ASV dataset. In total, DNA was sequenced from 38 samples within the Willamette watershed and 17 from the Deschutes watershed. DNA sequence data is archived under BioProject PRJNA642636 at the National Center for Biotechnology Information (NCBI).
Microbial Metrics of Biodiversity
Biodiversity is a fundamental metric used to characterize a microbial community. Alpha diversity describes diversity within a site, whereas beta diversity describes diversity across sites (Whittaker, 1972). Alpha diversity is often described with Shannon's index (H), which is the Shannon entropy (Shannon and Weaver, 1949) of measured ASVs within a site. Shannon's index accounts for both the number of ASVs (richness) and the relative abundance of each ASV (evenness). Shannon's index was calculated using the sci-kit bio package (v 0.5.1, http://scikit-bio.org/) developed for the Python programming language. In this implementation, Shannon's index is calculated as
where s is the number of ASVs detected and pi is the proportion of s represented by ASV i. Note that changing the base of the logarithm changes the units of H; when base 2 is used, as here, the resulting quantity is described in units of bits. Larger values of H indicate greater diversity within a site. Diversity data were visually approximately normally distributed, and variance was similar between groups, so two-sample t-tests were used to check for differences in means between groups. Statistical tests were conducted using SciPy in Python 3.7.4 (Virtanen et al., 2020).
Microbial dissimilarity between sites was determined by the Bray-Curtis metric (Bray and Curtis, 1957). Bray-Curtis dissimilarity, dBC(u, v) [unitless], calculates dissimilarity in the number (n) of ASVs between sites u and v as
for all ASV i (Bray and Curtis, 1957). Bray-Curtis dissimilarity is more robust than other distance measures like Euclidean distance, for example, where differences in abundance can overwhelm differences in ASVs between sites, leading to counterintuitive results, particularly with large, sparse matrices (Ricotta and Podani, 2017). The denominator of the Bray-Curtis dissimilarity index effectively weights the difference in abundance between sites by the overall abundance of each ASVs, such that rare ASVs contribute less to differences between sites. Bray-Curtis dissimilarity ranges [0, 1], with a value of one indicating two sites have no ASVs in common and a value of zero indicating identical ASVs composition. The package sci-kit bio was again used to assemble a distance matrix of Bray-Curtis dissimilarity between all possible pairs of sites. Site-pairs were ranked by Bray-Curtis dissimilarity and the top 1% and top 5% most and least dissimilar site-pairs were analyzed to explore whether patterns emerged.
Additionally, we were interested in how relationships between microbial communities and macroscale characteristics might differ between the Willamette and Deschutes watersheds and between small and large sub-catchments. Therefore, distance matrices of Bray-Curtis dissimilarity between all pair of sites in: the Willamette Basin (n = 38 sites; 703 unique pairs), the Deschutes Basin (n = 17 sites; 136 unique pairs), small sub-catchments (n = 28 sites; 378 unique pairs), and large sub-catchments (n = 27 sites; 351 unique pairs) were assembled. Note for all 55 sites there were 1,485 unique pairs. Small sub-catchments were simply the smaller half of sample sites (drainage area ≤520 km2) and large sub-catchments were the larger half. Dissimilarity values were skewed low, so to check for differences between groups, a Mann-Whitney U-test, which requires no distribution assumptions, was used. Mann-Whitney U-test assumes independent samples and tests the null hypothesis that the two distributions are equal.
Macroscale Characteristics and Microbial Community Composition
To investigate the relationship between microbial community and macroscale characteristics, differences in microbial community composition were examined in relation to differences in catchment characteristics between sites. Using the basin characteristics from StreamStats, a distance matrix of pairwise differences between sites for each characteristic was assembled. Distances between points (u, v) for StreamStats characteristic c were calculated as absolute value arithmetic differences,
with the exception of the physical distance between points. The physical distance was the great-circle distance (km), which is the distance between the two points on the surface of a sphere containing the diameter of Earth. As with beta diversity, distances matrices were assembled for all characteristics for all pairs of sites in: the Willamette Basin, the Deschutes Basin, small sub-catchments, large sub-catchments, and all sub-catchments. We used Mantel tests to evaluate the correlation between dissimilarly matrices of community composition and each of the macroscale properties (Mantel, 1967). Mantel correlations assume linear correlations between dissimilarity matrices and have been previously used to evaluate correspondence between microbial communities and other environmental factors (Fagervold et al., 2014; Repert et al., 2014; Read et al., 2015). When applied to raw data tables this approach may introduce bias due to spatial autocorrelation, though extensive testing has found this method is appropriate for evaluation of dissimilarly matrices constructed from autocorrelated data (Legendre et al., 2015). The Mantel statistic is the standardized Pearson correlation between the distance matrices and ranges [−1, 1], with values close to 1 (−1) indicating strong positive (negative) correlation and a value of zero indicating no correlation between the distance matrices. To assess the relationship between microbial community composition and macroscale environment, we examined Mantel statistics between microbial distances dBC(u, v) and individual characteristic distances dSS,c(u, v), as well as mean Mantel statistics for the four groups of related properties: geomorphic, climate, land-cover, and development characteristics. We again used the package sci-kit bio for Python and calculated Mantel statistic (r) and Bonferroni-corrected p-value for multiple comparisons over 10,000 permutations.
We might expect to detect stronger correlations between the microbial community and watershed characteristics when the microbial community samples represent a greater range of conditions. For example, consider the case where catchment characteristics are identical so their standard deviation is zero. Because dissimilarity among catchment characteristics would be zero in this case, correlation between microbial community dissimilarity and catchment dissimilarity (Mantel r) would also necessarily be zero. Thus, as variability in sub-catchment characteristics decreases near to geospatial measurement noise associated with the StreamStats outputs we potentially may see lower Mantel statistics. To explore whether the strength of correlations identified by Mantel tests could be related to variability in those catchment characteristics, we analyzed the relationship between Mantel statistics and the standard deviation of each characteristic. We calculated the relative sensitivity (εSS,c) [unitless] of the Mantel statistic (r) to the standard deviation (σ) of each StreamStats characteristic (c) as:
The relative sensitivity value quantifies the extent to which a change in variability in a StreamStats characteristics translates to a respective change in the correlation between microbial community composition and that watershed characteristic, where higher absolute values of ε indicate greater sensitivity and a stronger relationship between microbial community similarity and watershed characteristic variability. Values of ε that significantly differ from zero may suggest variability as a potential driver of the strength of correlations and offer insight into the conditions in which microbiomes may be useful monitoring tools. Sensitivity was calculated for each StreamStats variable for both Willamette vs. Deschutes watersheds and small vs. large sub-catchments, and then median sensitivity for each group of characteristics for both sets of sub-catchments was estimated. Sensitivity data contained several outliers and could not be assumed normal. Therefore, the non-parametric one-sample Wilcoxon signed-rank test was used to test the null hypothesis that the median sensitivity value for each group was equal to zero.
Finally, to assess whether and how different ways of grouping sequence data or applying different diversity metrics to characterize the microbial communities impacts the results of the analysis, the data were reanalyzed several ways. First, rather than using ASVs (100% similar), stream microbial communities were instead characterized by grouping raw sequences into 95%, 97%, or 99% similar operational taxonomic units (OTUs). Sequence data were then rarefied to standardize sampling effort while retaining the greatest number of samples (95% similarity: 1,025 sequences per sample; 97% similarity: 1,023 sequences; 99% similarity: 1,014 sequences). Communities were also alternatively characterized using one of five major groups of ASVs: Actinobacteria (rarefied to 100 sequences per sample), Bacteroidetes (500 sequences), Cyanobacteria (50 sequences), Gammaproteobacteria (500 sequences), or Verrucomicrobia (100 sequences). Two alternative measures of alpha diversity, Chao-1 index of taxonomic diversity and abundance-based coverage estimators (ACE) index, were calculated (also using sci-kit bio). Finally, Weighted UniFrac distances (Lozupone and Knight, 2005) were calculated with QIIME2 as an alternate measure of beta diversity. Unlike the taxon-based Bray-Curtis dissimilarity, divergence-based UniFrac distances (Lozupone and Knight, 2008) consider the similarity of different taxa by incorporating information from a phylogenetic tree relating the genetic sequences from each sample.
All code developed for this analysis is available at www.zenodo.org (URycki and Good, 2020b).
Results
Spatial Patterns in Microbial Community Similarity
We evaluated how 16S rRNA sequence data for 55 DNA samples varied across the Willamette and Deschutes watersheds. Among those samples, 3,530 unique ASVs were detected, including typical freshwater members of the classes Bacteroidetes, Actinobacteria, Verrucomicrobia, and Gammaproteobacteria (which includes Betaproteobacteria; Figure 2). Some samples also featured high abundances of Cyanobacteria (up to 28% of community).
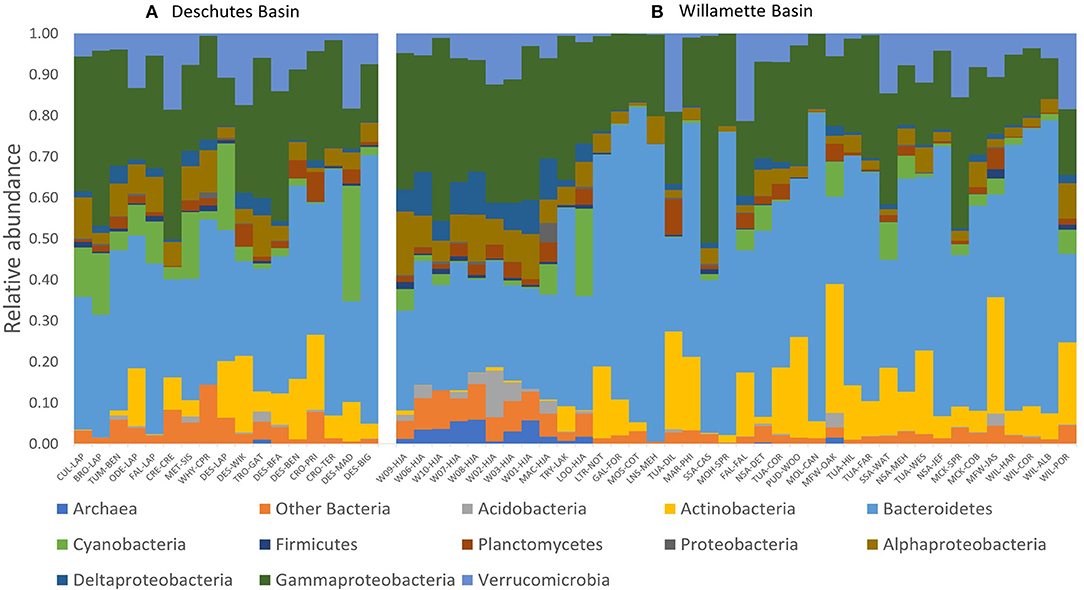
Figure 2. Phylogenetic biodiversity (relative abundance of unique amplified sequences variants [ASVs]) of tributary and main-stem streamwater microbial DNA samples throughout the (A) Deschutes and (B) Willamette watersheds in Oregon, USA. Samples for each watershed are presented in order of increasing sub-catchment drainage area (Supplementary Table 1).
Alpha diversity was similar in the Willamette and Deschutes watersheds (Wil: mean H = 5.81, SD = 1.08; Des: mean H = 6.58, SD = 0.93; two-sample t = 2.50, p = 0.016; Figure 1) and was not related to the sample volume filtered (R2 = 0.04, p = 0.76, Supplementary Figure 2). Tributaries exhibited both the highest and lowest biodiversity values in both watersheds. Alpha diversity generally increased from south to north in the Willamette Basin (latitude R2 = 0.55, p < 0.001), but this pattern was not observed in the Deschutes Basin (latitude R2 = −0.41, p > 0.1; Figure 3). Across both watersheds, small and large sub-catchments exhibited similar levels of biodiversity (small sub-catchments: mean H = 6.09, SD = 1.22, large sub-catchments: mean H = 6.00, SD = 0.95; two-sample t = 0.30, p = 0.762), and alpha diversity was not related to sub-catchment drainage area (Willamette: R2 = 0.04, p = 0.80; Deschutes: R2 = −0.38, p = 0.13; Supplementary Figure 3).
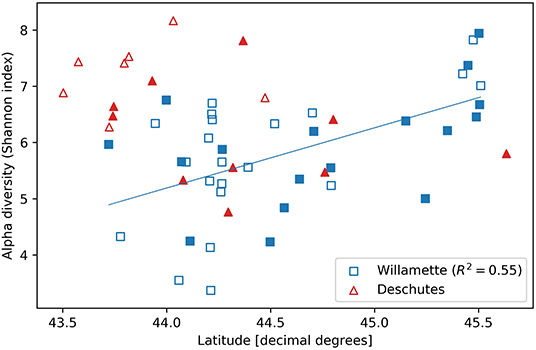
Figure 3. Alpha diversity (Shannon index) vs. latitudinal coordinate of streamwater microbial DNA samples collected from small (unfilled symbols) and large (filled symbols) sub-catchments throughout the Willamette (squares) and Deschutes (triangles) watersheds in Oregon, USA.
The greatest beta diversity in microbial stream communities was observed between watersheds. Bray-Curtis dissimilarity (BC) was higher on average for site-pairs spanning watersheds (mean BC = 0.912) than for pairs within watersheds (mean BC = 0.832, Mann-Whitney U = 164584.5, p < 0.001), and the vast majority of the top 5% BC scores were for inter-watershed sample pairs (Figure 4). In fact, the most dissimilar pairs (top 1% BC scores) were between points extending from the headwaters of the Deschutes River to the mouth of the Willamette River. A few of the top 5% most dissimilar pairs were points in the same watershed that were geographically distant. Visual inspection reveals no clear patterns between small and large watersheds among the top 5% least similar pairs of samples, and beta diversity was similar within small and large sub-catchments (small: mean BC = 0.856, large: 0.875; Mann-Whitney U = 65169.5, p = 0.340).
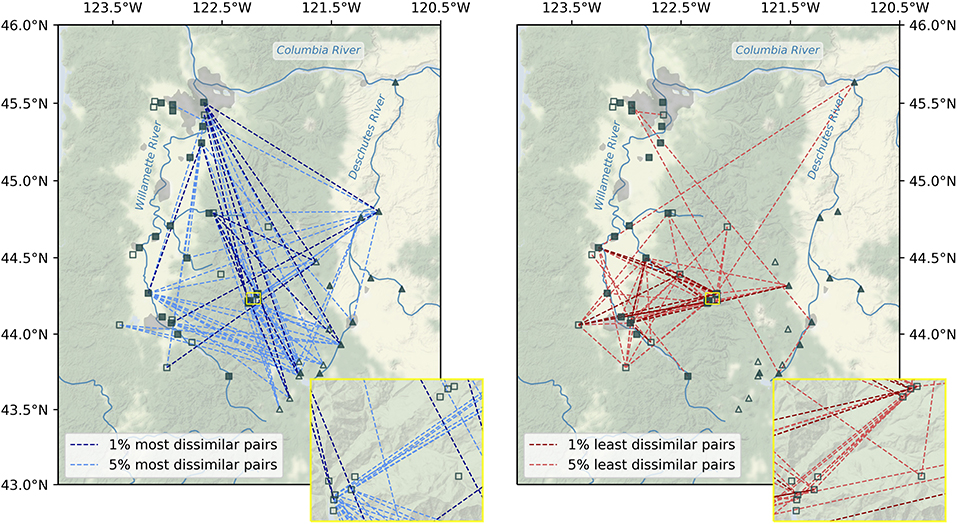
Figure 4. Map of the 1% (dark lines) and 5% (light lines) most (left) and least (right) dissimilar microbial communities throughout the Willamette and Deschutes watersheds in Oregon, USA. Large (filled symbols) and small (unfilled symbols) sub-catchments are those with more than or less than median drainage area, respectively. Inset shows vicinity of HJ Andrews Experimental Forest.
Beta diversity was higher within the Willamette Basin (mean BC = 0.897) than within the Deschutes Basin (mean BC = 0.820; Mann-Whitney U = 31305.5, p < 0.001). The lowest beta diversity in microbial stream communities (5% lowest BC scores) was observed between samples within in the upper Willamette Basin (Figure 4). Points in the HJ Andrews Forest exhibited some of the lowest dissimilarity to other points within the HJ Andrews Forest and to several other points within the Willamette Basin. Also, a few of the lowest dissimilarity scores were between inter-watershed sample pairs, including pairs spanning headwaters of one watershed to the mouth of the other watershed. Almost all of the most similar inter-watershed pairs are samples from large sub-catchments (i.e., points along the mainstem of the rivers).
Relation of Macroscale Catchment Properties to Microbial Community Similarity
Among StreamStats characteristics determined to be statistically significant in at least one group of sub-catchments (Table 1), geomorphic-related characteristics were on average the most strongly correlated with microbial community composition in the Willamette Basin (mean r = 0.19; Figure 5). Land-cover (mean r = 0.15) characteristics were more strongly correlated with microbial community composition than climatic (mean r = 0.01) characteristics. Among the top five strongest correlates in the Willamette Basin were latitude (r = 0.41), percentage of area containing high permeability aquifer units (r = 0.35), and percentage of forest and shrublands (r = 0.34; Table 1). In the Deschutes Basin, climatic (mean r = 0.11) characteristics were more strongly correlated with microbial community composition than were geomorphic (mean r = 0.10) characteristics. Land-cover characteristics were very weakly anticorrelated (mean r = −0.01; Figure 5). Among the top five strongest correlates with the microbial community in the Deschutes Basin were mean maximum January temperature (r = 0.33), percentage of low-intensity development (r = 0.30), topographic index (r = 0.33), and topographic relief (r = 0.29), although none of these were statistically significant (all p > 0.1; Table 1, Supplementary Table 2). No development-related characteristics were found to be correlated with microbial community similarity in the Willamette or Deschutes watersheds.
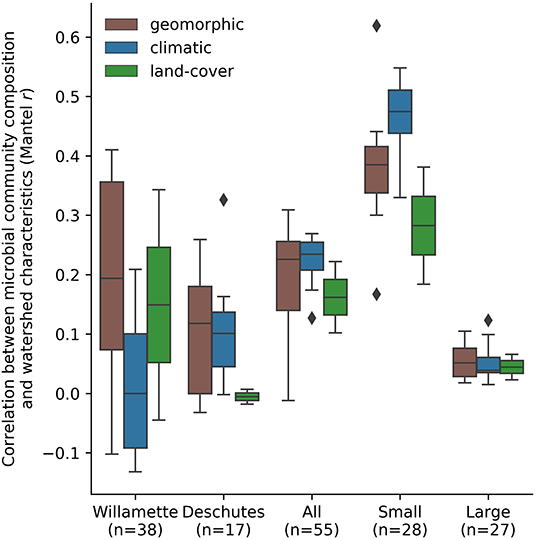
Figure 5. Mean correlation between microbial community composition (Mantel test statistic [r]) and land-cover, geomorphic, and climatic related StreamStats basin characteristics by watershed and in small and large sub-catchments across the Willamette and Deschutes watersheds, Oregon, USA.
Small sub-catchments exhibited the strongest correlations between macroscale catchment characteristics and microbial community composition. Among StreamStats characteristics determined to be statistically significant in at least one group of sub-catchments (Table 1), microbial community composition in small sub-catchments correlated most strongly with climatic characteristics (mean r = 0.46), followed by geomorphic (mean r = 0.38), and land-cover (mean r = 0.28; Figure 5) characteristics. The most strongly correlated characteristics were watershed identifier (Willamette or Deschutes; r = 0.62), January minimum temperature (r = 0.55), and annual minimum temperature (r = 0.53; Table 1). Microbial community composition in large sub-catchments exhibited much weaker correlations. Mean maximum January temperature (r = 0.12), minimum basin elevation (r = 0.10), and mean annual maximum temperature (r = 0.10) were among the top five strongest correlates with microbial community similarity, although none of these were statistically significant (all p > 0.1). No development-related characteristics were found to be statistically correlated with microbial community similarity in small or large watersheds.
For the macroscale characteristics we analyzed, the strength of the correlation with the microbial community was not sensitive to the variability of those characteristics across catchments. Across all sub-catchment characteristics, an increase in the standard deviation of a characteristic did not translate to a statistically significant increase in Mantel statistic for either the Willamette versus Deschutes watersheds (median ε= 0.14; Wilcoxon signed-rank W = 76.0, p = 0.981) or for small versus large sub-catchments (median ε = −3.40; Wilcoxon signed-rank W = 58.0, p = 0.381). Similarly, median sensitivity was not statistically different from zero for any of the characteristic groups for either the Willamette vs. Deschutes watersheds or for small vs. large sub-catchments (all Wilcoxon signed-rank p > 0.1).
Patterns were consistent when sequence data were grouped into OTUs or when different diversity metrics were applied. The strongest relationships between microbial communities and watershed characteristics were observed in small watersheds at all OTU sequence similarity levels (95%, 97%, 99%, or 100%) and for three major taxonomic groups: Bacteroidetes, Gammaproteobacteria, and Verrucomicrobia (Supplementary Figure 4). The microbial groups Actinobacteria and Cyanobacteria exhibited no significant correlations with watershed characteristics. The strongest relationships were observed between microbial communities and geomorphic and climatic related characteristics, although some microbial groups were also related to land cover characteristics (Supplementary Figure 4). The Chao-1 and ACE alpha diversity metrics were strongly correlated with Shannon index (Chao-1: Spearman r = 0.91, p << 0.001; ACE: Spearman r = 0.90, p << 0.001). Characterizing community similarity using Weighted UniFrac instead of Bray-Curtis dissimilarity also resulted in strong correlations with watershed characteristics in small watersheds. Also, some microbial groups exhibited comparably strong relationships to watershed characteristics in the Willamette and Deschutes watersheds (Supplementary Figure 5).
Discussion
We explored the potential influence of the upstream macroscale environment in shaping streamwater microbiomes. Previous studies found that streamwater microbial community composition is more strongly correlated with catchment-scale hydrologic parameters such as stream distance and catchment area than with water sample physio-chemical water properties (Read et al., 2015; Savio et al., 2015). Our study builds on this previous work by expanding the suite of macroscale variables analyzed for relationships with the microbial community assemblage to more than 40 basin characteristics reflecting the geomorphology, climate, land cover, and level of human development in stream catchments.
Our results suggest that, in headwater catchments, microbial community assemblages are shaped by catchment-scale geomorphology and climate, but these influences weaken downstream. The streamwater microbial metacommunity is “seeded” from a diverse amalgamation of microbes dispersed into headwater streams from surrounding soil and groundwater (Crump et al., 2007, 2012), which develops and continually combines with local inputs as the community moves downstream with the flow of water (Ruiz-González et al., 2015). In headwater streams in particular, where the contributing area is large relative to the stream volume (Read et al., 2015; Savio et al., 2015), it follows that this immigrant microbial community would reflect the dispersal area and upslope environment and thus exhibit a stronger correlation with macroscale catchment characteristics. Downstream, however, biotic and abiotic factors increasingly drive ecological succession (i.e., species-sorting; Leibold et al., 2004), and the microbial assemblage shifts to a core riverine community, dampening signals from the upstream catchment (Savio et al., 2015).
The shift from diverse communities of upslope emigrants that are tightly coupled to the catchment to a core riverine community shaped by the local environment may explain the decreasing strength of the relationship between microbial community composition and macroscale watershed characteristics. This is supported by the low overall sensitivity of the correlations to variability in sub-catchment characteristics moving from upstream to downstream, in that moving to more (or less) variable sub-catchment characteristics did not result in higher (or lower) correlations uniformly. Since sensitivity values were distributed between both positive and negative values and not statistically different than zero, we conclude that changes in the homogeneity of the landscape across which samples are collected, as measured by the standard deviation of landscape characteristics, is not uniformly the driving processes determining differences in microbial composition.
Watershed location in either the Willamette or Deschutes basins was the strongest correlate with the microbial community across all basins and within small basins, indicating that there are additional factors shaping distinctive microbial communities in each basin. In the temperate, more developed Willamette Basin, latitude and the percentage of forest and shrub land and were most important characteristics. Due to the north-south orientation of these basins, latitude is likely a proxy for multiple other interacting factors (e.g., elevation and up-stream drainage area), and the Willamette Basin in particular has a strong human-driven gradient due to Portland at the outlet. On the other hand, in the Deschutes Basin, geomorphic characteristics such as topographic index and relief were more important. It is possible that the differences in important influences on streamwater microbial communities between basins is related to basin hydrology and the nature of the inputs to the stream. In the wetter, more crop-dominated landscape of the Willamette Basin, more constant, stable inputs of water—and thus microbes—may contribute to the development of a certain, less diverse community than in the arid, less populated Deschutes Basin, where flashier water inputs result in more variable contributing areas and a different, more diverse streamwater microbial community (Nippgen et al., 2015).
We note that, as with many scientific analyses, our results are a product of the decisions made throughout the analysis. Decisions about DNA extraction methods and sequencing depth may have impacted our results. Some catchment characteristics obtained from StreamStats that were considered redundant were eliminated from analysis (see Supplementary Table 1), but correlation among variables was not explored. Eliminating correlated variables may have yielded different results, as could have applying different significance criteria. On the other hand, results were robust to the similarity of ASV groups. When ASVs were grouped into operational taxonomic units (OTUs) based on 95%, 97%, or 99% DNA sequence similarity, the relative strength and importance of characteristic categories and of spatial scale were generally stable (Supplementary Figure 4). Although some major microbial groups (e.g., classes Bacteroidetes, Gammaproteobacteria, Verrucomicrobia) exhibited stronger relationships with watershed characteristics than other groups, we are not aware of any method that would allow for reliable targeted sampling or analysis effort in such a way as to appreciably conserve resources. Our results build upon those of Good et al. (2018), in which streamwater microbiomes were used in a machine learning algorithm to predict hydrologic regime of a set of large rivers in adjacent and detached watersheds in the Arctic. Here, we found that the summer microbial community within small headwater streams reflects both the structural configuration of the landscape as well as upstream processes. Coupled with the results of Good et al. (2018), our results offer an encouraging indication that streamwater microbial DNA may thus carry information about upstream macroscale conditions as well as hydrology and may therefore hold potential as a useful tool in watershed monitoring. More research is needed to determine whether these relationships hold in other seasons and how to optimally extract this information from microbiomes.
Data Availability Statement
The datasets generated for this study can be found in the Sequence Read Archive at the National Center for Biotechnology Information (NCBI; https://www.ncbi.nlm.nih.gov/sra/PRJNA642636).
Author Contributions
SG conceived the study, produced the original code, and reviewed the manuscript. DU collected the data, contributed to the data analysis, and prepared the manuscript and figures. JC contributed to sample and data analysis. BC contributed sample analysis and reviewed the manuscript. GJ contributed to data collection and reviewed the manuscript. SG and BC secured funding for this research. All authors contributed to the article and approved the submitted version.
Funding
This work was supported by the National Science Foundation grant EAR 1836768. DU would like to acknowledge STEM Scholarship support from NSF grant #1153490.
Conflict of Interest
The authors declare that the research was conducted in the absence of any commercial or financial relationships that could be construed as a potential conflict of interest.
Acknowledgments
We conducted part of this research at HJ Andrews Experimental Forest, which was funded by the US Forest Service, Pacific Northwest Research Station. We gratefully acknowledge the efforts of the many graduate and undergraduate students who generously contributed many long hours of lab and field work. We additionally thank Associate Editor TS and two reviewers for their helpful, constructive reviews, which improved this manuscript.
Supplementary Material
The Supplementary Material for this article can be found online at: https://www.frontiersin.org/articles/10.3389/frwa.2020.574728/full#supplementary-material
References
Amaral-Zettler, L. A., McCliment, E. A., Ducklow, H. W., and Huse, S. M. (2009). A method for studying protistan diversity using massively parallel sequencing of V9 hypervariable regions of small-subunit ribosomal RNA genes. PLoS ONE 4:e6372. doi: 10.1371/annotation/50c43133-0df5-4b8b-8975-8cc37d4f2f26
Bolyen, E., Rideout, J. R., Dillon, M. R., Bokulich, N. A., Abnet, C. C., Al-Ghalith, G. A., et al. (2019). Reproducible, interactive, scalable and extensible microbiome data science using QIIME 2. Nat. Biotechnol. 37, 852–857. doi: 10.1038/s41587-019-0209-9
Bray, J. R., and Curtis, J. T. (1957). An ordination of the upland forest communities of southern wisconsin. Ecol. Monogr. 27, 325–349. doi: 10.2307/1942268
Callahan, B. J., McMurdie, P. J., Rosen, M. J., Han, A. W., Johnson, A. J. A., and Holmes, S. P. (2016). DADA2: high-resolution sample inference from illumina amplicon data. Nat. Methods 13, 581–583. doi: 10.1038/nmeth.3869
Caporaso, J. G., Lauber, C. L., Walters, W. A., Berg-Lyons, D., Huntley, J., Fierer, N., et al. (2012). Ultra-high-throughput microbial community analysis on the illumina HiSeq and MiSeq platforms. ISME J. 6, 1621–1624. doi: 10.1038/ismej.2012.8
Caporaso, J. G., Lauber, C. L., Walters, W. A., Berg-Lyons, D., Lozupone, C. A., Turnbaugh, P. J., et al. (2011). Global patterns of 16S rRNA diversity at a depth of millions of sequences per sample. Proc. Natl. Acad. Sci. U.S.A. 108, 4516–4522. doi: 10.1073/pnas.1000080107
Carter, R. W. (1961). Magnitude and frequency of floods in suburban areas. US Geol. Survey Profess. Pap 424, 9–11.
Crump, B. C., Adams, H. E., Hobbie, J. E., and Kling, G. W. (2007). Biogeography of bacterioplankton in lakes and streams of an arctic tundra catchment. Ecology 88, 1365–1378. doi: 10.1890/06-0387
Crump, B. C., Amaral-Zettler, L. A., and Kling, G. W. (2012). Microbial diversity in arctic freshwaters is structured by inoculation of microbes from soils. ISME J. 6, 1629–1639. doi: 10.1038/ismej.2012.9
Crump, B. C., Kling, G. W., Bahr, M., and Hobbie, J. E. (2003). Bacterioplankton community shifts in an arctic lake correlate with seasonal changes in organic matter source. Appl. Environ. Microbiol. 69, 2253–2268. doi: 10.1128/AEM.69.4.2253-2268.2003
Delpla, I., Jung, A. V., Baures, E., Clement, M., and Thomas, O. (2009). Impacts of climate change on surface water quality in relation to drinking water production. Environ. Int. 35, 1225–1233. doi: 10.1016/j.envint.2009.07.001
Doherty, M., Yager, P. L., Moran, M. A., Coles, V. J., Fortunato, C. S., Krusche, A. V., et al. (2017). Bacterial biogeography across the amazon river-ocean continuum. Front. Microbiol. 8:882. doi: 10.3389/fmicb.2017.00882
Droppo, I. G., Liss, S. N., Williams, D., Nelson, T., Jaskot, C., and Trapp, B. (2009). Dynamic existence of waterborne pathogens within river sediment compartments. Implications for water quality regulatory affairs. Environ. Sci. Technol. 43, 1737–1743. doi: 10.1021/es802321w
Emilson, C. E., Thompson, D. G., Venier, L. A., Porter, T. M., Swystun, T., Chartrand, D., et al. (2017). DNA metabarcoding and morphological macroinvertebrate metrics reveal the same changes in boreal watersheds across an environmental gradient. Sci. Rep. 7:12777. doi: 10.1038/s41598-017-13157-x
Fagervold, S. K., Bourgeois, S., Pruski, A. M., Charles, F., Kerhervé, P., Vétion, G., et al. (2014). River organic matter shapes microbial communities in the sediment of the rhône prodelta. ISME J. 8, 2327–2338. doi: 10.1038/ismej.2014.86
Feddema, J. J., Oleson, K. W., Bonan, G. B., Mearns, L. O., Buja, L. E., Meehl, G. A., et al. (2005). The importance of land-cover change in simulating future climates. Science 310, 1674–8. doi: 10.1126/science.1118160
Foley, J. A., DeFries, R., Asner, G. P., Barford, C., Bonan, G., Carpenter, S. R., et al. (2005). Global consequences of land use. Science 309, 570–574. doi: 10.1126/science.1111772
Fortunato, C. S., Eiler, A., Herfort, L., Needoba, J. A., Peterson, T. D., and Crump, B. C. (2013). Determining indicator taxa across spatial and seasonal gradients in the Columbia river coastal margin. ISME J. 7, 1899–1911. doi: 10.1038/ismej.2013.79
Good, S. P., URycki, D. R., and Crump, B. C. (2018). Predicting hydrologic function with aquatic gene fragments. Water Resour. Res. 54, 2424–2435. doi: 10.1002/2017WR021974
Goodrich, J. K., Di Rienzi, S. C., Poole, A. C., Koren, O., Walters, W. A., Caporaso, J. G., et al. (2014). Conducting a microbiome study. Cell 158, 250–262. doi: 10.1016/j.cell.2014.06.037
Gregory, J. H., Dukes, M. D., Jones, P. H., and Miller, G. L. (2006). Effect of urban soil compaction on infiltration rate. J. Soil Water Conserv. 61, 117–124.
Hermans, S. M., Buckley, H. L., Case, B. S., and Lear, G. (2019). Connecting through space and time: catchment-scale distributions of bacteria in soil, stream water and sediment. Environ. Microbiol. 22, 1000–1010. doi: 10.1111/1462-2920.14792
IPCC (2019). Climate Change and Land: An IPCC Special Report on Climate Change, Desertification, Land Degradation, Sustainable Land Management, Food Security, and Greenhouse Gas Fluxes in Terrestrial Ecosystems, eds P. R. Shukla, J. Skea, E. Calvo Buendia, V. Masson-Delmotte, H.-O. Pörtner, D. C. Roberts.
Jerde, C. L., Olds, B. P., Shogren, A. J., Andruszkiewicz, E. A., Mahon, A. R., Bolster, D., et al. (2016). Influence of stream bottom substrate on retention and transport of vertebrate environmental DNA. Environ. Sci. Technol. 50, 8770–8779. doi: 10.1021/acs.est.6b01761
Jiménez Cisneros, B. E., Oki, T., Arnell, N. W., Benito, J. G., Cogley, P., Döll, T., et al. (2014). “Freshwater resources” in Climate Change 2014: Impacts, Adaptation, and Vulnerability. Part A: Global and Sectoral Aspects. Contribution of Working Group II to the Fifth Assessment Report of the Intergovernmental Panel on Climate Change, eds C. B. Field, V. R. Barros, D. J. Dokken, K. J. Mach, M. D. Mastrandrea, T. E. Bilir, M. Chatterjee, K. L. Ebi, Y. O. Estrada, R. C. Genova, B. Girma, E. S. Kissel, A. N. Levy, S. MacCracken, P. R. Mastrandrea, and L. L. White (Cambridge, UK; New York, NY: Cambridge University Press), 229–269.
Kolbert, C. P., and Persing, D. H. (1999). Ribosomal DNA sequencing as a tool for identification of bacterial pathogens. Curr. Opin. Microbiol. 2, 299–305.
Kozich, J. J., Westcott, S. L., Baxter, N. T., Highlander, S. K., and Schloss, P. D. (2013). Development of a dual-index sequencing strategy and curation pipeline for analyzing amplicon sequence data on the miseq illumina sequencing platform. Appl. Environ. Microbiol. 79, 5112–5120. doi: 10.1128/AEM.01043-13
Legendre, P., Fortin, M., and Borcard, D. (2015). Should the mantel test be used in spatial analysis? Methods Ecol. Evol. 6, 1239–1247. doi: 10.1111/2041-210X.12425
Leibold, M. A., Holyoak, M., Mouquet, N., Amarasekare, P., Chase, J. M., Hoopes, M. F., et al. (2004). The metacommunity concept: a framework for multi-scale community ecology. Ecol. Lett. 7, 601–613. doi: 10.1111/j.1461-0248.2004.00608.x
Li, P., Yang, S. F., Lv, B. B., Zhao, K., Lin, M. F., Zhou, S., et al. (2015). Comparison of extraction methods of total microbial DNA from freshwater. Genet. Mol. Res. 14, 730–738. doi: 10.4238/2015.January.30.16
Lozupone, C., and Knight, R. (2005). UniFrac: a new phylogenetic method for comparing microbial communities. Appl. Environ. Microbiol. 71, 8228–8235. doi: 10.1128/AEM.71.12.8228-8235.2005
Lozupone, C. A., and Knight, R. (2008). Species divergence and the measurement of microbial diversity. FEMS Microbiol. Rev. 32, 557–578. doi: 10.1111/j.1574-6976.2008.00111.x
Mächler, E., Salyani, A., Walser, J. C., Larsen, A., Schaefli, B., Altermatt, F., et al. (2019). Water tracing with environmental DNA in a high-Alpine catchment. Hydrol. Earth Syst. Sci. Discuss. 1–30. doi: 10.5194/hess-2019-551
Mantel, N. (1967). The detection of disease clustering and a generalized regression approach. Cancer Res. 27, 209–220.
Moscrip, A. L., and Montgomery, D. R. (1997). Urbanization, flood frequency, and salmon abundance in puget lowland streams. J. Am. Water Resour. Assoc. 33, 1289–1297. doi: 10.1111/j.1752-1688.1997.tb03553.x
Newby, D. T., Pepper, I. L., and Maier, R. M. (2009). “Microbial transport,” in Environmental Microbiology, eds Maier, R. M., Pepper, I. L., and Gerba, C. P. (Amsterdam: Elsevier Inc.), 365–383.
Nippgen, F., Mcglynn, B. L., and Emanuel, R. E. (2015). The spatial and temporal evolution of contributing areas. Water Resour. Res. 51, 4550–4573. doi: 10.1002/2014WR016719
Quast, C., Pruesse, E., Yilmaz, P., Gerken, J., Schweer, T., Yarza, P., et al. (2013). The SILVA ribosomal RNA gene database project: improved data processing and web-based tools. Nucleic Acids Res. 41:D590. doi: 10.1093/nar/gks1219
Read, D. S., Gweon, H. S., Bowes, M. J., Newbold, L. K., Field, D., Bailey, M. J., et al. (2015). Catchment-scale biogeography of riverine bacterioplankton. ISME J. 9, 516–26. doi: 10.1038/ismej.2014.166
Repert, D. A., Underwood, J. C., Smith, R. L., and Song, B. (2014). Nitrogen cycling processes and microbial community composition in bed sediments in the yukon river at pilot station. J. Geophys. Res. Biogeosci. 119, 2328–2344. doi: 10.1002/2014JG002707
Ricotta, C., and Podani, J. (2017). On some properties of the bray-curtis dissimilarity and their ecological meaning. Ecol. Complex. 31, 201–205. doi: 10.1016/j.ecocom.2017.07.003
Ries, K. G. III., Guthrie, J. D., Rea, A. H., Steeves, P. A., and Stewart, D. W. (2008). StreamStats: A Water Resources Web Application. Fact Sheet 2008-3067. U.S. Geological Survey.
Ruiz-González, C., Niño-García, J. P., and del Giorgio, P. A. (2015). Terrestrial origin of bacterial communities in complex boreal freshwater networks. Ecol. Lett. 18, 1198–1206. doi: 10.1111/ele.12499
Sales, N. G., McKenzie, M. B., Drake, J., Harper, L. R., Browett, S. S., Coscia, I., et al. (2020). Fishing for mammals: landscape-level monitoring of terrestrial and semi-aquatic communities using eDNA from riverine systems. J. Appl. Ecol. 57, 707–716. doi: 10.1111/1365-2664.13592
Savio, D., Sinclair, L., Ijaz, U. Z., Parajka, J., Reischer, G. H., Stadler, P., et al. (2015). Bacterial diversity along a 2600?km river continuum. Environ. Microbiol. 17, 4994–5007. doi: 10.1111/1462-2920.12886
Seibert, J., and McDonnell, J. J. (2015). Gauging the ungauged basin: relative value of soft and hard data. J. Hydrol. Eng. 20:A4014004. doi: 10.1061/(ASCE)HE.1943-5584.0000861
Shannon, C. E., and Weaver, W. (1949). The Mathematical Theory of Communication. Urbana, IL: University of Illinois Press.
Shogren, A. J., Tank, J. L., Andruszkiewicz, E., Olds, B., Mahon, A. R., Jerde, C. L., et al. (2017). Controls on eDNA movement in streams: transport, retention, and resuspension. Sci. Rep. 7:5065. doi: 10.1038/s41598-017-05223-1
Sorensen, J. P. R., Maurice, L., Edwards, F. K., Lapworth, D. J., Read, D. S., Allen, D., et al. (2013). Using boreholes as windows into groundwater ecosystems. PLoS ONE 8:e70264. doi: 10.1371/journal.pone.0070264
Sugiyama, A., Masuda, S., Nagaosa, K., Tsujimura, M., and Kato, K. (2018). Tracking the direct impact of rainfall on groundwater at Mt. Fuji by multiple analyses including microbial DNA. Biogeosciences 15, 721–732. doi: 10.5194/bg-15-721-2018
U.S. Geological Survey (2016a). National Water Information System Data Available on the World Wide Web (USGS Water Data for the Nation).
U.S. Geological Survey (2016b). The StreamStats Program. Available online at: http://streamstats.usgs.gov (accessed December 4, 2019).
URycki, D. R., and Good, S. P. (2020a). StreamStats Data Query (Version 1.0.0). Zenodo. doi: 10.5281/zenodo.3902476
URycki, D. R., and Good, S. P. (2020b). River Microbiome and Watershed Characteristics Analysis. Zenodo. doi: 10.5281/zenodo.3902478
Virtanen, P., Gommers, R., Oliphant, T. E., Haberland, M., Reddy, T., Cournapeau, D., et al. (2020). SciPy 1.0: fundamental algorithms for scientific computing in Python. Nat. Methods 17, 261–272. doi: 10.1038/s41592-019-0686-2
Wheater, H., and Evans, E. (2009). Land use, water management and future flood risk. Land Policy 26, S251–S264. doi: 10.1016/j.landusepol.2009.08.019
Whittaker, R. H. (1972). Evolution and measurement of species diversity. Taxon 21, 213–251. doi: 10.2307/1218190
Keywords: catchment hydrology, ungauged basins, watershed monitoring, 16S rRNA, microbial diversity, Pacific Northwest, ecohydrology
Citation: URycki DR, Good SP, Crump BC, Chadwick J and Jones GD (2020) River Microbiome Composition Reflects Macroscale Climatic and Geomorphic Differences in Headwater Streams. Front. Water 2:574728. doi: 10.3389/frwa.2020.574728
Received: 21 June 2020; Accepted: 08 October 2020;
Published: 19 November 2020.
Edited by:
Tim Scheibe, Pacific Northwest National Laboratory (DOE), United StatesReviewed by:
Christopher L. Jerde, University of California, Santa Barbara, United StatesRaven L. Bier, University of Georgia, United States
Copyright © 2020 URycki, Good, Crump, Chadwick and Jones. This is an open-access article distributed under the terms of the Creative Commons Attribution License (CC BY). The use, distribution or reproduction in other forums is permitted, provided the original author(s) and the copyright owner(s) are credited and that the original publication in this journal is cited, in accordance with accepted academic practice. No use, distribution or reproduction is permitted which does not comply with these terms.
*Correspondence: Dawn R. URycki, dXJ5Y2tpZEBvcmVnb25zdGF0ZS5lZHU=