 Ram A. Barankin
 Michelle E. Portman
 Paul Kirshen
 Robert E. Bowen
- 1School for the Environment, University of Massachusetts Boston, Boston, MA, United States
- 2Faculty of Architecture and Town Planning, Technion - Israel Institute of Technology, Haifa, Israel
Climate change adaptation policy requires assessing a community's vulnerability based on its socio-economic characteristics. A predominant approach to vulnerability assessment is indicator-based, wherein variables are aggregated to assess the vulnerability of units in a system (e.g., neighborhoods in a city). Here we show that a particular evidence-based predictive statistics approach can address two shortcomings of the most commonly-used indicator-based approach: lack of a means of validation and problematic weighting of individual indicators. We demonstrate how robust evidence-based models can produce frameworks that overcome these limitations. Using the case study of Hurricane Sandy in the State of New Jersey, we conducted two-pronged validated vulnerability assessments, based on insurance claim payouts and assistance grants. The latter needs-based assessment shows that “Minorities” are substantially more vulnerable than others based on a significant negative association with assistance approval rate (approved claims divided by all claims). Our findings highlight issues discussed in the literature within the context of climate justice and equity. Such an approach is helpful locally, but also when adaptation plans are developed over broad scales of time and space considering disparities between regions or across multiple jurisdictions.
Background
Climate change is one of the most pressing issues of our time, one that puts many communities at risk from multiple types of catastrophic hazards (O'Neill et al., 2017). For example, sea level rise puts coastal communities at risk, especially when combined with intensive storms and high tides, which create storm surge and flooding (Walsh et al., 2016). Mitigating these risks requires new and proven ways of adaptation planning.
There are several challenges inherent to the adaptation planning process that require significant improvement, including dealing with uncertainties in climatic system forecasting (Nicholls and Cazenave, 2010; Walsh et al., 2016) while incorporating physical, ecological, and socio-economic aspects of human activities within coastal zones (Nicholls et al., 2015; Shao et al., 2017). Socio-economic aspects of adaptation planning involve consideration of social vulnerability and environmental justice issues related to climate change; both need to be addressed for efficient adaptation planning (Kim et al., 2018; van den Berg and Keenan, 2019). Despite its urgency, the practicalities of assessing the vulnerability of human communities and populations, which lays the foundation for designing adaptation plans and for allocating the resources necessary to make plans a reality, need further investigation.
A commonly used vulnerability assessment approach uses indicators (hereafter “indicator-based assessment”) (Zhang et al., 2018). This approach has been widely implemented by governments as part of adaptation policy efforts (e.g., Rowan et al., 2013; Boston, 2016). In the social vulnerability domain, using socio-economic variables (social indicators), such as age, race, and income, the predominant indicator-based vulnerability assessment should enable the prediction of the susceptibility of communities to the negative effects of climate-driven events, whether they be physical, financial, or psychological (Benevolenza and DeRigne, 2019). However, such assessments are based largely on theoretical assumptions of what is perceived to reflect vulnerability and therefore are less accurate than they would be if they were based on empirical findings.
Evidence-based approaches to vulnerability assessment could supplement and improve the standard “indicator-based” approach and thus lead to better allocation of resources for adaptation. Here we show that an evidence-based predictive statistics approach, often claimed infeasible in the past (Hinkel, 2011), can indeed be used as a possible solution for two shortcomings of the most commonly-used indicator-based approach: (1) the lack of a means of validation, and (2) problematic weighting (Tonmoy et al., 2014; Nguyen et al., 2016).
Due to the availability of large quantities of socio-economic data to choose from as indicators (e.g., as a result of increased data from national census programs), it is a common practice to remove correlating indicators, or to perform some type of dimension reduction statistical technique. The most common of these methods is the Principal Component Analysis (PCA). As a case in point, one of the most influential works in the field of indicator-based vulnerability assessments introduced the PCA-based social vulnerability index over a decade and a half ago and trademarked SoVi (R)—the Social Vulnerability Index.
Methods, such as PCA, minimize redundancy, and produce a lower and more manageable number of indicators (alias, “components” in PCA) for the assessment. While the PCA approach is sometimes mistaken to be a predictive data-driven approach, in practice it only analyzes variability in the explanatory dataset while offering no evaluation of its predictive power. Like other works over the years, the original introduction of the social vulnerability index approach explicitly acknowledged the problematic nature of indicator equal-weights practices back in 2003 (Cutter et al., 2003). Now, with new types of information and with the relative abundance and accessibility of big data, previously unforeseen research opportunities have become available and can be used to remedy this situation.
We propose validation of common theoretical assumptions by utilizing harm indicators, i.e., harm experienced by subjects during a climate-related event (e.g., heat waves or hurricanes), in robust predictive statistical models. PCA and other dimension reduction techniques are an important first step in analyses that utilize an initially large number of variables (especially correlating variables), however, these unsupervised approaches (i.e., for which there is no outcome/dependent variable) only analyze the explanatory data (social indicators in this case). They do not analyze how these social indicators come into play in real events which can themselves be analyzed by using a supervised predictive approach, i.e., ones that use an outcome variable.
Predictive supervised statistical models (as opposed to, for example, the unsupervised PCA) tell us whether certain vulnerability indicators are appropriate for predicting de facto vulnerability, always measured based on harm indicators. Furthermore, the results of such predictive models denote the relative importance of each vulnerability indicator and thus can help in (a) deciding on the final set of indicators to include in the assessment (e.g., that are the social indicators shown to be significant in predicting the outcome), and (b) assigning different weights to each indicator in that set.
Such ideas have been addressed in the literature in the past (see Discussion), however, indicator-based vulnerability assessments in general and particularly indicator-based social vulnerability assessments, have rarely used a predictive approach based on empirical observation of outcomes (i.e., harm indicators). Furthermore, they usually employ equal-weighted aggregation, wherein indicators are considered equally important without justification (Tonmoy et al., 2014; Nguyen et al., 2016). As a result, quantitative vulnerability assessments that are available to policy-makers today are largely not based on real-world experience; they are not sufficiently modified or improved based on recent and actual climate events, and thus they remain limited.
The methodology we present here follows several evidence-based predictive statistics studies while addressing some technical and practical limitations of these studies (see Discussion). We demonstrate, using a case study, how robust predictive statistical analysis can produce a validated evidence-based vulnerability assessment. Our case study is based on the impact of Hurricane Sandy (2012) on the State of New Jersey (NJ), USA. We analyzed the relationship between observed harm as reflected by insurance payout data, FEMA assistance data and using various social indicators while controlling for environmental factors. We hypothesize that certain indicators are significant in predicting harm and that the level of impact varies across indicators.
Methods
Data and Variables
Harm Indicators (Outcome Variables)
Harm indicators (the outcome/dependent variables) were derived from two main datasets (Figure 1). The first, containing data related to insurance payouts after Hurricane Sandy was provided by the NJ Department of Banking and Insurance at the zip code level in NJ (Request Number: C115955). It reflects over four billion US dollars paid to subjects who experienced financial damage as a result of Hurricane Sandy. The second dataset contains information about the Federal Emergency Management Agency's (FEMA) Individual and Housing Assistance Program (IHP) of over 400 million US Dollars during Hurricane Sandy (hereinafter: “FEMA assistance” or “government assistance”) which is also available at the zip code level (FEMA, 2014).
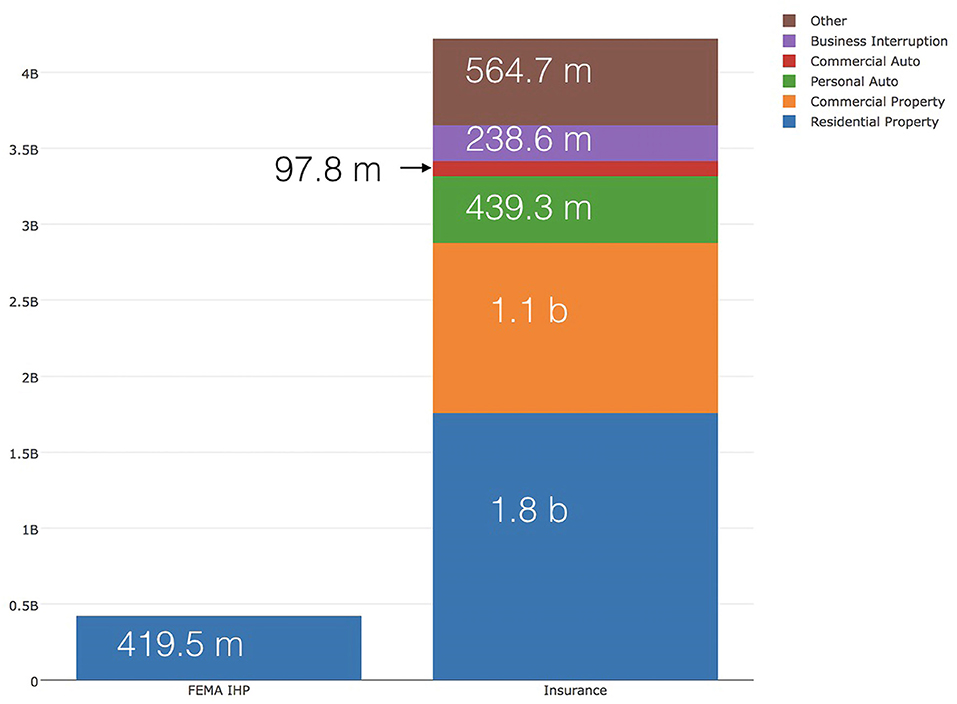
Figure 1. Datasets used in the study to derive harm indicators (US $).
IHP provides assistance to those who had necessary expenses and significant needs, and only if they are unable to meet those needs through other means. It provides temporary housing assistance as well as other grant money that assists in activities, such as the replacement of lost furniture and clothing (Lindsay, 2017). Some typos were identified in the FEMA dataset's zip code numbers (invalid numbers or numbers outside the relevant states) and were subsequently removed from the database before it was used in the analysis.
Social Indicators (Explanatory Variables)
Initially, 15 social indicators (explanatory variables) were considered (see Table 1). These were consistent with the literature and were obtained from the US Census Bureau's American Community Survey (ACS) aggregated for the years of 2008–2012. Since Hurricane Sandy occurred toward the end of 2012, it was assumed that the majority of samples are relevant for the pre-event conditions as required for the analysis.
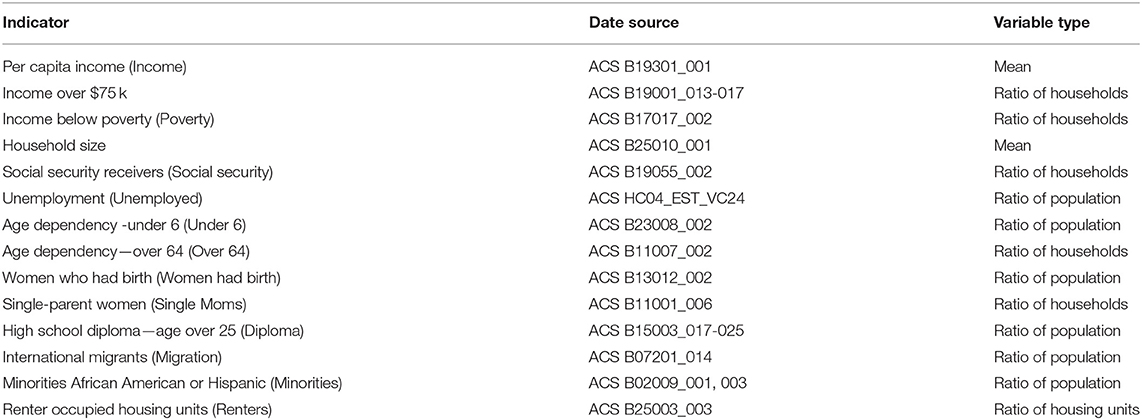
Table 1. Social indicators considered in the initial analysis.
Exposure Indicators (Explanatory/Control Variables)
Three exposure indicators were used: distance from the storm track, maximum wind speed, and flood extent, as presented in Figure 2 (see Supplementary Material for additional information).
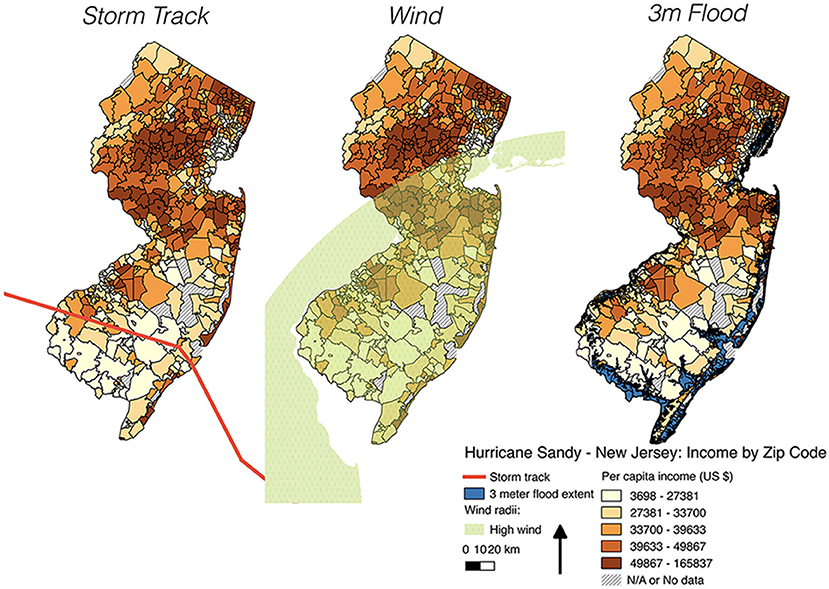
Figure 2. Physical exposure in New Jersey during Hurricane Sandy and income by zip code.
Spatial Resolution
The availability of data at the zip code level offers a sufficient number of observations (a sample size of 516–583 areas) at a relatively fine geospatial resolution for implementing predictive statistical modeling. Consequently, the association between socio-economic characteristics (indicators) of different communities (based on zip codes) and observed harm (insurance payouts and FEMA assistance) could be empirically explored.
Statistical Methodologies
General
Harm indicators derived from the two aforementioned datasets (insurance and FEMA assistance) were used as dependent (outcome) variables in various predictive statistical models in order to explore socio-economical risk and vulnerability patterns. Three main statistical methodologies were used. First, Partial Least Squares Regression (known as PLS or PLSR) was implemented for selecting the relevant social indicators. PLS is a methodology that performs dimension reduction, like PCA but considering an outcome variable(s) in addition to the explanatory variables. Then, multivariate linear regression (hereinafter: “simple regression”), as well as spatial autoregressive regression (hereinafter: “spatial regression” or “spatial lag regression”) was used to explore the relationship between the indicators in the models (i.e., the direction and estimate of coefficients—weight).
Following the results of the statistical models, further analysis was performed to explore potential disparities in approval rates (i.e., approved claims divided by number of claims). The models' results were used to create weighted vulnerability indices as described below. Furthermore, the weighted vulnerability index that was based on the FEMA dataset analysis was validated using available data concerning other neighboring states that experienced harm as a result of Hurricane Sandy (New-York, Connecticut, Rhode Island, and Maryland). Notably, the insurance data were only available for NJ and thus could not be validated in a similar manner. The study workflow is presented in Figure 3.
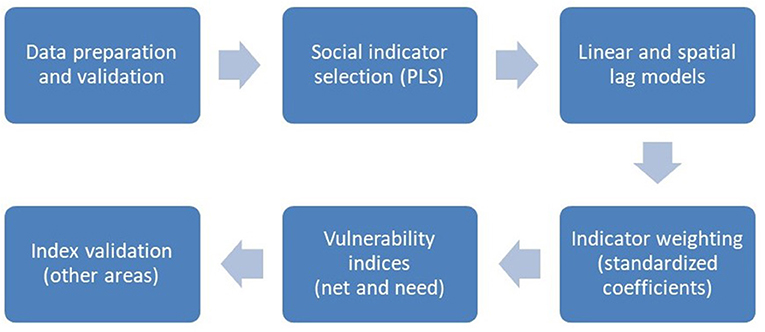
Figure 3. Study workflow.
PLS: Reducing the Number of Social Indicators
A total of 19 PLS models were created by a combination of various harm indicators and different datasets. The pre-selected social indicators were used as the independent variables among all models.
Seven harm indicators were used as outcome (dependent) variables in the different models:
- Reported claims (the total claims that were reported in the dataset).
- Reported claims per household.
- Approved claims (the total claims that were approved for payment).
- Approved claims per household.
- Approval rate (approved claims divided by the reported claims).
- Total amount paid.
- Total amount paid per household.
Each of these indicators was used in several separated models, using different datasets, as follows:
1. All claims aggregated by zip code.
2. Only FEMA assistance claims.
3. Only private insurance's residential property claims.
4. Private insurance's residential property claims and FEMA assistance claims aggregated.
All variables were log-transformed to fulfill the assumptions of normality and linearity and centered by their means for the PLS analysis. The PLS models' results demonstrated several dominant social indicators that thus were selected to be used in the linear and spatial regression models as discussed below (see Supplementary Material for detailed results).
Multivariate Linear Regression: Finding Weights
Linear regression models were used to assess the direction (indicate by plus or minus) and relative weight or importance (thorough standardized coefficients) of the social indicators. The social indicators selected through the PLS analysis were used as the independent (explanatory) variables in the regression models. The three exposure indicators described above were also added to the regression models as independent variables, as well as an additional variable: the number of households. The latter indicator was added in order to control for various sizes of areas captured in a single zip code.
Two outcome (dependent) variables were used in several models: number of approved claims and actual payouts/assistance amounts. These variables were assumed to reflect experienced harm (harm indicators). Approval rate was used in a post-analysis discussed separately below.
The two dependent variables were modeled using four datasets (a total of 8 linear and 8 spatial regression models):
- All aggregated.
- FEMA assistance only.
- Residential—insurance only.
- Private insurance's residential property and FEMA assistance aggregated.
Similar to what was done for the PLS analysis, the socio-economical independent variables and the outcome variables were log-transformed. The exposure indicators were not transformed since two of them are categorical and it was not necessary to transform them to satisfy the regression model assumptions. Furthermore, Variance Inflation Factor (VIF) analysis indicated that multicollinearity did not occur in the model.
Spatial Regression: Correcting for Autocorrelation
The regression models were tested for spatial autocorrelation (Moran I test) and their results were compared with the results of the spatial lag regression models. These analyses revealed that spatial autocorrelation was present in all the regular (non-spatial) models.
To solve this problem, we used spatial lag regression models with a log-likelihood function. For the application of this method, spatial weights are assigned to each observation and considered in generalized linear regression models. The weights list is created through two steps. First, a neighbors list is built based on regions with contiguous perimeters that are sharing one or more boundary points. Then the weighting list is created based on the neighbor list, by summing row-standardized values over links among regions. Detailed results and additional details about the methodologies are provided in the Supplementary Material section.
Results
General
The results of the main spatial regression models (standardized coefficients) are presented in Figure 4, wherein the upper graph represents the overall payouts as the dependent variable and the lower graph approval-rate as the dependent variable. The main influential social indicators, as selected through PLS, were mean income, density, and rates of poverty, unemployment, minority population, and immigration.
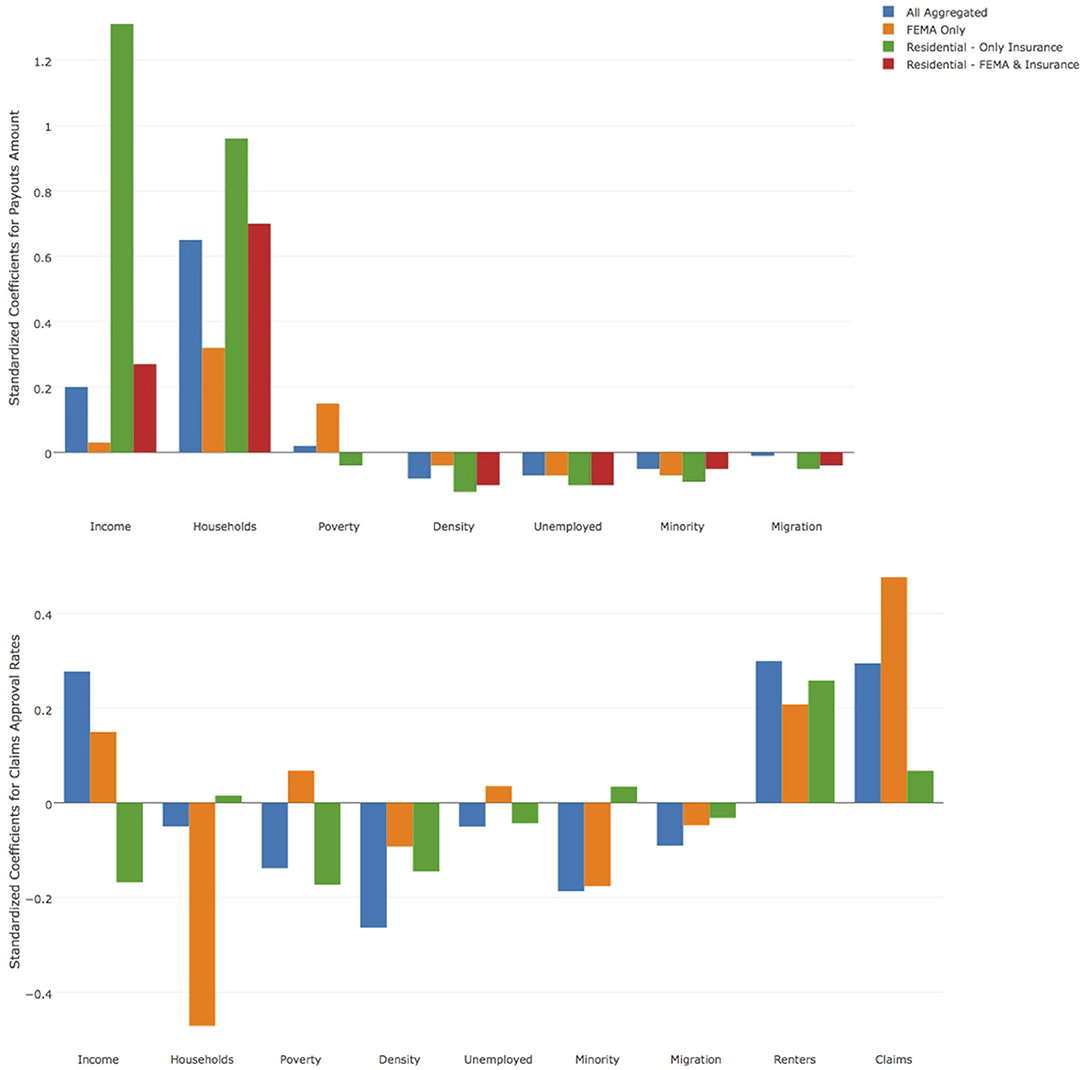
Figure 4. Social indicators' weights according to the predictive model results. These weights were used to create the example vulnerability assessments. Notably, the minority indicator had a negative coefficient for payouts and a significant negative coefficient for assistance approval rate.
Using these coefficients as aggregation weights (Table 2) of the actual values by zip code (modified as discussed below), we demonstrate the creation of two vulnerability assessments (Figure 5): net-value based (meaning, that the models used the net paid claims) and need-based (meaning, that the models used the FEMA assistance paid grants), with the former based on all payouts and the latter using only FEMA assistance data. Beyond their general importance for setting adaptation policy, net-value may be of use to entities such as insurance companies and real-estate organizations for anticipating losses and for planning investments. Need-based vulnerability will likely be most useful for governments and aid organizations seeking to assist communities at high risk.
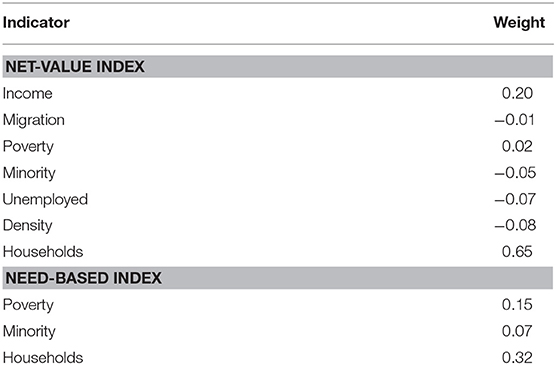
Table 2. Indicator weights for the vulnerability indexes aggregation.
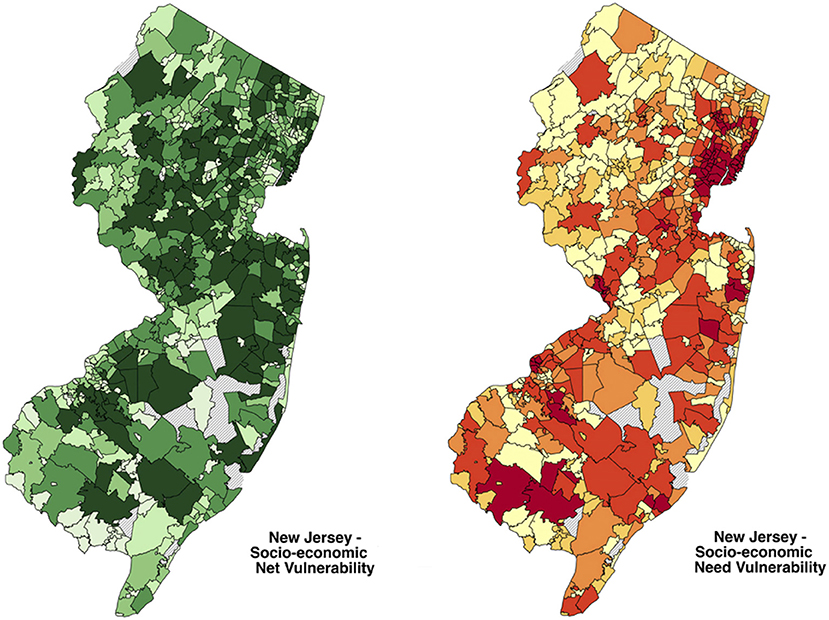
Figure 5. Vulnerability maps: net (Left) for net financial terms and need (Right) for communities in need of assistance. The darker the shade the higher the vulnerability.
From the needs-based assessment, it became clear that the variable “Minorities,” which had a negative coefficient in the FEMA payouts model, actually reflects a substantially higher vulnerability than others since this indicator also demonstrated a significant negative relationship with approval rate (Figure 4, lower graph).
Validation
An important part of the study presented here and an aspect that directly addresses one of the two shortcomings of the most commonly used indicator-based approaches mentioned in the introduction of this paper is the facilitation of validation. Thus, as another means of validating the methodology used in our study (and thus the vulnerability indexes we produced), we extrapolated the selected social indicators' weights (Table 2, Need-based index) to create a need-based vulnerability index for neighboring states that were also affected by Hurricane Sandy.
We used the need-based vulnerability index for these other states in regression models to investigate the index's predictive power and did the same using the traditional PCA-based equal-weights approach. In the latter, we used the same initial list of indicators, selected a smaller number of indicators according to the result of a PCA model (four factors), and aggregated their values into a single index (using equal weighs). Three spatial regression models were produced, in all of them the dependent variable was FEMA assistance and the explanatory variables were the physical exposure variables along with the newly produced indexes as follows: one using our proposed need-based vulnerability index, one using the PCA equal-weights vulnerability index, and one using both.
Subsequently, we found that our proposed method can better predict harm using fewer variables, as shown in Table 3. This may signal to researchers and policy-makers that there is higher value in monitoring specific social indicators over others.
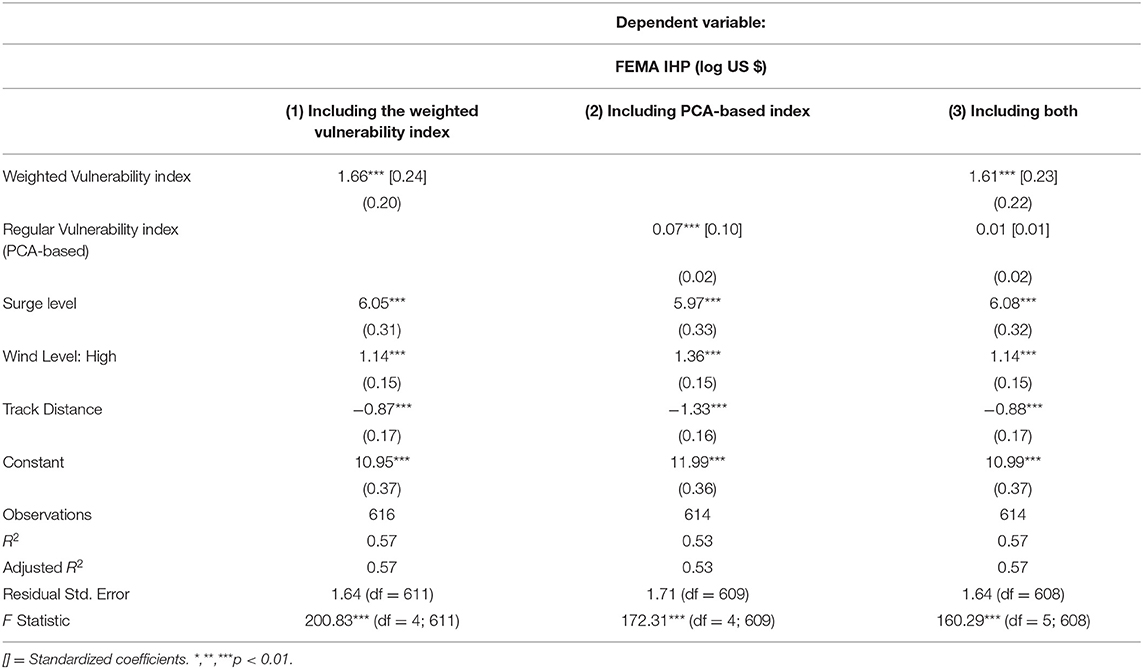
Table 3. Linear regression results.
Discussion
The shortcomings of the common indicator-based methodological approaches often used to conduct vulnerability assessments, such as lack of validation frameworks and the unjustified equal-weighting approach, have been acknowledged in the literature as described above. Only a few studies have taken on the task of validating the relationship between social indicators and observed climate change-driven impact (harm indicators) using robust predictive statistical models (Tonmoy et al., 2014). Even fewer use the results of such models to modify how vulnerability is assessed (i.e., what weight is given to individual indicators in the assembly of the vulnerability index). However, the grave consequences of lethal climate events recently experienced lead us to contend that these common indicator-based methodological limitations must be addressed and that methods can and should be improved. We demonstrate how robust evidence-based models can produce frameworks that overcome these limitations.
Two explanations for not using studies that are based on evidence and predictive statistics are usually offered. The first explanation highlights the lack of proper data at the required geographic resolution used for analysis (Hinkel, 2011). The second explanation originates in the difficulties related to communicating the results of complex methodologies (Beccari, 2016), an argument which renders simplistic approaches preferable over those that could provide more accurate results.
The few studies that implemented predictive statistical techniques that we reviewed (e.g., Burton, 2010) introduce some statistical shortcomings that may bias results. Particularly methodological issues include: not including environmental/exposure as possible predictors in the model (e.g., Finch et al., 2010; Burton, 2015); lack of transparency or misreporting of model results, such as missing information concerning model results and the preprocessing of the data (e.g., Flanagan et al., 2011); not accounting for geographic dependencies in the data (spatial autocorrelation) (e.g., Myers et al., 2008; Fekete, 2009); reliance on correlation without considerations to causation (e.g., Borden et al., 2007; Finch et al., 2010); use of spatial units that may be too large to reflect socio-economic variability (e.g., Fekete, 2009); use of simulated results (e.g., Schmidtlein et al., 2011) or political decisions as outcome variables (e.g., Borden et al., 2007), both which do not serve as evidence of vulnerability; and other statistical assumption violations.
The first shortcoming mentioned above, which is particularly grave and common, results in a particularly low explanatory power of the model. This leads to biases, especially when performing an analysis based on a single climatic event with its unique physical features. The physical exposure (e.g., flood level) would carry a high explanatory power of the climatic event's consequences. Thus, including exposure in the statistical model allows a better examination of the other factors (socio-economic indicators/variables) that impact vulnerability.
Some limitations of this work are that it used only one case study. It also used similar datasets (though with different variables) for the first (supervised dimension reduction) and second (regression) steps of the study due to relatively small sample size (though with different target variables to overcome this limitation), and it explored only a single statistical approach for variable weighing (standardized coefficients). We therefore recommend additional evidence-based regional vulnerability assessments use data from several hurricane/flooding events and explore possible modifications to the model design by using additional statistical techniques, including those incorporating interactions between variables and standardizing model coefficients differently. Furthermore, we suggest exploring the normalization of indicators within a spatial unit using additional types of data from myriad sources, keeping in mind that the interpretability of models is especially important in such cases for driving adaptation policy.
In any case it is important to point out that a crucial aspect of this study that is seldom performed in other studies in this field is the validation of the proposed vulnerability index using a different geographical area. Other methods of validation can be explored, such as holding off some of the internal units (zip codes in this case) for validation when there is a sufficient sample size.
Perhaps most notable in our analysis results is the negative coefficient associated with the minority indicator for approval rate (i.e., successful assistance application rate). This result highlights issues that have been discussed in the literature, particularly within the context of justice and equity when facing the consequences of climate change (Rydin, 2006; Kim et al., 2018). These could be helpful on a local scale, but also when climate change adaptation plans are developed over broader scales of time (i.e., for long-term planning) and space considering disparities between regions or across multiple jurisdictions (Barbier, 2014; van den Berg and Keenan, 2019).
Conclusion
Our analysis suggests a strong association between social indicators and observed vulnerability, empirically demonstrating that some indicators are more meaningful than others. Consequently, adaption planning should consider and prioritize the most vulnerable communities, as reflected by the indicators, with consideration to the indicators' weights. Most importantly, this work sets another steppingstone for methodological advancement for the assessment of hurricane-related vulnerability to climate change. Moving consideration of social vulnerability to climatic events forward, and especially with regard to events related to storm surge and flooding, is of vast importance as new data reveals increased risk of damage to extensive areas and the crucial consequences such damage involves, especially among already vulnerable communities (Flavelle et al., 2020).
Researchers, policy-makers, and other climate change adaptation practitioners should promote additional evidence-based predictive statistics approach implementations, thus expanding knowledge for adaptation planning and increasing the likelihood that appropriate and supportive policies for such planning to be put in place. In view of this position, we call on others to build upon, as well as to question, the proposed vulnerability assessment methodology, consequently improving adaptation planning and mitigating harm caused by climate change to communities at risk.
Author Contributions
RBa developed and performed the statistical analysis, co-wrote the main article, and wrote the Supplementary material document. MP co-wrote the main article and the parts about environmental justice. PK provided expertise in the parts about adaptation planning. RBe provided expertise on the indicator-based approach. All authors contributed to the article and approved the submitted version.
Conflict of Interest
The authors declare that the research was conducted in the absence of any commercial or financial relationships that could be construed as a potential conflict of interest.
Supplementary Material
The Supplementary Material for this article can be found online at: https://www.frontiersin.org/articles/10.3389/frwa.2020.544141/full#supplementary-material
References
Barbier, E. B. (2014). A global strategy for protecting vulnerable coastal populations. Science 345, 1250–1251. doi: 10.1126/science.1254629
Beccari, B. (2016). A comparative analysis of disaster risk, vulnerability and resilience composite indicators. PLoS Curr. 8. doi: 10.1371/currents.dis.453df025e34b682e9737f95070f9b970
Benevolenza, M. A., and DeRigne, L. (2019). The impact of climate change and natural disasters on vulnerable populations: a systematic review of literature. J. Hum. Behav. Soc. Environ. 29, 266–281. doi: 10.1080/10911359.2018.1527739
Borden, K. A., Schmidtlein, M. C., Emrich, C. T., Piegorsch, W. W., and Cutter, S. L. (2007). Vulnerability of US cities to environmental hazards. J. Homel. Secur. Emerg. Manage. 4, 1–21. doi: 10.2202/1547-7355.1279
Burton, C. G. (2010). Social vulnerability and hurricane impact modeling. Nat. Hazards Rev. 11, 58–68. doi: 10.1061/(ASCE)1527-6988(2010)11:2(58)
Burton, C. G. (2015). A validation of metrics for community resilience to natural hazards and disasters using the recovery from hurricane katrina as a case study. Ann. Assoc. Am. Geogr. 105, 67–86. doi: 10.1080/00045608.2014.960039
Cutter, S. L., Boruff, B. J., and Shirley, W. L. (2003). Social vulnerability to environmental hazards*. Soc. Sci. Q 84, 242–261. doi: 10.1111/1540-6237.8402002
Fekete, A. (2009). Validation of a social vulnerability index in context to river-floods in Germany. Nat. Hazards Earth Syst. Sci. 9, 393–403. doi: 10.5194/nhess-9-393-2009
FEMA. (2014). Archived Housing Assistance Program Data. Available online at: https://www.fema.gov/media-library/assets/documents/30714 (accessed April 28, 2017).
Finch, C., Emrich, C. T., and Cutter, S. L. (2010). Disaster disparities and differential recovery in New Orleans. Popul. Environ. 31, 179–202. doi: 10.1007/s11111-009-0099-8
Flanagan, B. E., Gregory, E. W., Hallisey, E. J., Heitgerd, J. L., and Lewis, B. (2011). A social vulnerability index for disaster management. J. Homel. Secur. Emerg. Manage. 8:3. doi: 10.2202/1547-7355.1792
Flavelle, C., Lu, D., Penney, V., Popovich, N., and Schwartz, J. (2020). New Data Reveals Hidden Flood Risk Across America. The New York Times. Available online at: https://www.nytimes.com/interactive/2020/06/29/climate/hidden-flood-risk-maps.html (accessed December 18, 2020).
Hinkel, J. (2011). “Indicators of vulnerability and adaptive capacity”: towards a clarification of the science–policy interface. Glob. Environ. Change 21, 198–208. doi: 10.1016/j.gloenvcha.2010.08.002
Kim, H., Marcouiller, D. W., and Woosnam, K. M. (2018). Rescaling social dynamics in climate change: the implications of cumulative exposure, climate justice, and community resilience. Geoforum 96, 129–140. doi: 10.1016/j.geoforum.2018.08.006
Lindsay, B. (2017). FEMA Disaster Housing: The Individuals and Households Program Implementation and Potential Issues for Congress. Washington, DC: Congressional Research Service.
Myers, C. A., Slack, T., and Singelmann, J. (2008). Social vulnerability and migration in the wake of disaster: the case of hurricanes katrina and rita. Popul. Environ. 29, 271–291. doi: 10.1007/s11111-008-0072-y
Nguyen, T. T., Bonetti, J., Rogers, K., and Woodroffe, C. D. (2016). Indicator-based assessment of climate-change impacts on coasts: a review of concepts, methodological approaches and vulnerability indices. Ocean Coast. Manage. 123, 18–43. doi: 10.1016/j.ocecoaman.2015.11.022
Nicholls, R. J., and Cazenave, A. (2010). Sea-level rise and its impact on coastal zones. Science 328, 1517–1520. doi: 10.1126/science.1185782
Nicholls, R., Zanuttigh, B., Vanderlinden, J. P., Weisse, R., Silva, R., Hanson, S., et al. (2015). “Developing a holistic approach to assessing and managing coastal flood risk,” in Coastal Risk Management in a Changing Climate (London: Elsevier), 9–53. doi: 10.1016/B978-0-12-397310-8.00002-6
O'Neill, B. C., Oppenheimer, M., Warren, R., Hallegatte, S., Kopp, R. E., Pörtner, H. O., et al. (2017). IPCC reasons for concern regarding climate change risks. Nat. Clim. te Change 7:28. doi: 10.1038/nclimate3179
Rowan, E., Evans, C., Riley-Gilbert, M., Hyman, R., Kafalenos, R., Beucler, B., et al. (2013). Assessing the sensitivity of transportation assets to extreme weather events and climate change. Transport. Res. Rec. 5, 16–23. doi: 10.3141/2326-03
Rydin, Y. (2006). Justice and the geography of hurricane katrina. Geoforum 37, 4–6. doi: 10.1016/j.geoforum.2005.10.002
Schmidtlein, M. C., Shafer, J. M., Berry, M., and Cutter, S. L. (2011). Modeled earthquake losses and social vulnerability in Charleston, South Carolina. Appl. Geogr. 31, 269–281. doi: 10.1016/j.apgeog.2010.06.001
Shao, W., Xian, S., Lin, N., Kunreuther, H., Jackson, N., and Goidel, K. (2017). Understanding the effects of past flood events and perceived and estimated flood risks on individuals' voluntary flood insurance purchase behavior. Water Res. 108, 391–400. doi: 10.1016/j.watres.2016.11.021
Tonmoy, F. N., El-Zein, A., and Hinkel, J. (2014). Assessment of vulnerability to climate change using indicators: a meta-analysis of the literature. Wiley Interdiscip. Rev. 5, 775–792. doi: 10.1002/wcc.314
van den Berg, H. J., and Keenan, J. M. (2019). Dynamic vulnerability in the pursuit of just adaptation processes: a Boston case study. Environ. Sci. Policy 94, 90–100. doi: 10.1016/j.envsci.2018.12.015
Walsh, K. J., McBride, J. L., Klotzbach, P. J., Balachandran, S., Camargo, S. J., Holland, G., et al. (2016). Tropical cyclones and climate change. Wiley Interdiscip. Rev. 7, 65–89. doi: 10.1002/wcc.371
Keywords: climate change, social vulnerability assessment, social vulnerability, indicator-based assessment, climate adaptation, climate policy
Citation: Barankin RA, Portman ME, Kirshen P and Bowen RE (2021) Evidence-Driven Approach for Assessing Social Vulnerability and Equality During Extreme Climatic Events. Front. Water 2:544141. doi: 10.3389/frwa.2020.544141
Received: 19 March 2020; Accepted: 10 December 2020;
Published: 22 January 2021.
Edited by:
Abhishek Gaur, National Research Council Canada (NRC-CNRC), CanadaReviewed by:
Sepideh Yazdekhasti, Xylem, United StatesAuroop Ratan Ganguly, Northeastern University, United States
Copyright © 2021 Barankin, Portman, Kirshen and Bowen. This is an open-access article distributed under the terms of the Creative Commons Attribution License (CC BY). The use, distribution or reproduction in other forums is permitted, provided the original author(s) and the copyright owner(s) are credited and that the original publication in this journal is cited, in accordance with accepted academic practice. No use, distribution or reproduction is permitted which does not comply with these terms.
*Correspondence: Ram A. Barankin, cmFtLmJhcmFua2luQGdtYWlsLmNvbQ==