- Science and Technology Research Laboratories, Japan Broadcasting Corporation, Tokyo, Japan
This study presents the horizontal spatial specifications required for developing ideal head-mounted displays (HMDs) that provide visual experiences indistinguishable from those obtained without wearing HMDs. We investigated the minimum specifications for pixel density and field of view (FoV) such that users cannot perceive any degradation in these aspects. Conventional studies have measured visual acuity in the periphery and FoV size without eye movement. However, these results are not sufficient to determine the spatial specifications because users may notice a degradation in the quality of images displayed in the periphery when shifting their gaze away from the front. In this study, we measured visual characteristics under practical conditions, wherein participants moved their eyes naturally in coordination with their head movements, as observed when viewing natural scenes. Using a cylindrical display that covered the participant’s entire horizontal visual field with high resolution images, we asked participants to identify degraded spatial resolution or narrowed FoV. Results showed that ideal HMDs do not have to provide spatial frequency components above 0.5 and 2 cycles per degree outside the visual fields of approximately 210° and 120° horizontally, respectively. These results suggest that a resolution equivalent to one-fifteenth of the frontal area is sufficient for the lateral areas of the head. In addition, we found that ideal HMDs require a FoV of at least 240°. This is considerably smaller than a naive estimate of 310° based on previous studies, obtained by integrating the FoV size during fixation and the movable range of the eyes. We believe that these findings will be helpful in developing ideal HMDs.
1 Introduction
What is the exact goal of head-mounted display (HMD) development? Visual experiences through HMDs have improved substantially since they were initially proposed (Sutherland, 1968). Here, we assume that the goal of evolving HMDs is to provide visual experiences that are indistinguishable from those obtained when users do not wear HMDs and refer to such HMDs as “ideal HMDs.” This study aimed to estimate the minimum spatial specifications required for developing ideal HMDs, focusing in particular on pixel density and field of view (FoV).
Ideal HMDs do not need to uniformly fill pixels with high density and completely surround the user’s head with a display. The spatial specifications of the pixel density and FoV size can be degraded to the extent that users unable to perceive the degradation. For example, as the visual acuity deteriorates with retinal eccentricity (Anstis, 1974), the pixel density at the periphery of ideal HMDs can be suppressed relative to that at the center, which is in the frontal direction of the head. Additionally, previous results of perimetry tests, which determine the edge of the temporal visual field, have shown that people cannot perceive visual stimuli in the far periphery beyond 110° (Traquair, 1938; Lestak et al., 2021). Therefore, it is not necessary to cover the entire head with display panels but rather to present visual information in a limited FoV.
Our research question is to determine the pixel density and FoV required for developing ideal HMDs. To assess this, we measured visual characteristics in the periphery with natural eye movements that occur when using HMDs. In the next subsection, we first describe two representative coordinate systems: retina-centered and head-centered coordinate systems, which have been used to measure visual characteristics. We then justify why the head-centered coordinate system is appropriate for this study, as its origin remains relatively fixed to an HMD even when a user moves the eyes. Further details on eye movements are described in the following subsection. Finally, we present our hypotheses and study design.
1.1 Coordinate systems for measuring visual characteristics
1.1.1 Retina-centered coordinate system
Previous studies have primarily employed retina-centered coordinate systems to measure the capabilities of the human visual system (Traquair, 1938; Anstis, 1974; Lestak et al., 2021). A retina-centered coordinate system is typically represented as a polar coordinate system. Its origin corresponds to the direction of the visual axis, as indicated by the dashed arrows in Figure 1. The radial coordinate reflects the retinal eccentricity of the visual target, as shown by the dashed lines. The angular coordinate specifies the direction of the visual target, e.g., temporal, nasal, upward, or downward. For example, Figure 1A shows a boundary at a certain eccentricity in the temporal direction, depicted by the dashed line, beyond which a person cannot perceive a blurred image.
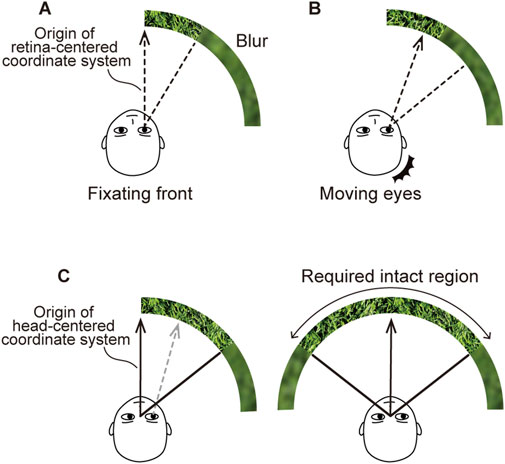
Figure 1. Retina and head-centered coordinate systems for assessing visual characteristics in the periphery. (A) Conventional measurements in retina-centered coordinate system. The dashed arrow represents the origin of the retina-centered coordinate system, corresponding to the direction of fixation. The dashed line indicates the minimum retinal eccentricity beyond which the quality degradation is unnoticeable. (B) Eye movements expected in actual use. When the eyes move, the quality degradation becomes more noticeable. (C) Measurements in head-centered coordinate system. As shown in (C-left), the origin of the head-centered coordinate system is fixed, as represented by the solid arrow even when the eyes move. The solid line indicates the minimum eccentricity from the origin for users not noticing the quality degradation. As shown in (C-right), our investigation focused on determining the minimum intact region beyond which users do not notice quality degradation on both the left and right sides.
However, the capabilities measured in the retina-centered coordinate system are insufficient to estimate the specifications required for ideal HMDs because the retina-centered coordinate system moves relative to the display along with eye movements, as shown in Figure 1B. Eye movements while using HMDs enlarge the perceptual FoV. Consequently, the degraded regions on the display screen captured by the periphery of the visual field become more noticeable. Therefore, eye movements must be considered when measuring the visual capability to estimate the specifications required for ideal HMDs.
1.1.2 Head-centered coordinate system
We employed a head-centered coordinate system to estimate the specifications required for developing ideal HMDs. The head-centered coordinates also represent the direction and eccentricity of the stimulus, but the origin is not on the retina; instead, it is relative to a specific point on the head, usually taken to be the midpoint of the eyes, i.e., the point of the cyclopean eye. The origin of the head-centered coordinate system corresponds to the frontal direction of the head, as shown by the solid arrows in Figure 1C. As the HMD is affixed to the head, the head-centered coordinate system is fixed relatively to the HMD and is unaffected by the directions of the eye. The solid line in Figure 1C-left represents the eccentricity threshold, beyond which the blur is unnoticeable even with eye movements. We determined the size of the minimum intact region, defined as twice the estimated eccentricity threshold, as shown in Figure 1C-right. With the minimum intact region, the display does not induce any perceptual quality degradation in terms of pixel density or FoV.
1.2 Eye movements during measurements
(Harasawa et al., 2021; Harasawa et al., 2023 measured visual characteristics in the head-centered coordinate system with maximal eye movements. In their experiments, participants were asked whether they perceived blurred images or blinking LEDs in their periphery with their eyes deviated as far laterally as possible. Results showed that the region beyond a horizontal FoV of approximately 150° width can filter the spatial frequency components above two cycles per degree (cpd) without being noticed (Harasawa et al., 2023). In addition, the participants were able to identify the LED blinking up to a maximum horizontal FoV of approximately 250° width (Harasawa et al., 2021).
Actual measurements with eye movements are crucial for estimating the specifications required for ideal HMDs because predicted values obtained by compensating the size of the visual field obtained in the absence of eye movements with values for the possible range of eye movements would result in an overestimation. Specifically, the obtained FoV of 250° in the head-centered coordinate system (Harasawa et al., 2021) was approximately 60° smaller than the naively estimated FoV of 310°, which was derived by the linear summation of the previous observations: 220° [the horizontal FoV in the retina-centered coordinate system (Traquair, 1938)] and 90° [the horizontally movable range of the eye (Hanif et al., 2009)]. Plausible factors contributing to a reduction in FoV size may include anatomical structures of the face, such as the eyelids (Harasawa et al., 2021).
1.3 Hypotheses
We hypothesized that smaller intact regions would be required under practical conditions. The maximal eye movements in prior studies (Harasawa et al., 2021; 2023) are not common in the typical usage of HMDs. In natural viewing conditions, we usually move our heads to look at an object in the periphery in coordination with eye movements. This eye–head coordination contributes to suppressing the size of eye movements (Freedman and Sparks, 1997; Sidenmark and Gellersen, 2019). Consequently, we hypothesized that the required intact regions would be smaller for natural gaze shift in coordination with head rotation than for maximal eye movements.
In addition, spatially abrupt changes of the image at the boundary of the intact region may affect the noticeability of the quality degradations, as shown in Figure 4A. The human visual system is more sensitive to spatially steep variations than to gradual ones (Campbell and Robson, 1968). Therefore, we hypothesized that users would be more likely to notice a degradation in pixel density or a change in FoV size if the image at the boundary of the intact region transitioned abruptly into a blurred or black image.
1.4 Study design
In this study, we investigated the minimum horizontal specifications for ideal HMDs based on a head-centered coordinate system under practical conditions of HMD use. We were unable to use off-the-shelf HMDs for the investigation because they cannot present images in the far periphery. Instead, we used a cylindrical display capable of showing images horizontally in 360° with high pixel density. Participants naturally moved their eyes in coordination with their head movements. They observed computer-generated images of natural scenes likely to be displayed during actual usage. At the boundary between the intact and modified regions, there were two types of variations: steep and gradual.
We conducted two experiments. In Experiment 1, we estimated the eccentricity of the boundary above which users cannot identify the cutoff of spatial frequency components above a specific level. In Experiment 2, we estimated the size of FoV above which users cannot identify the absence of image, i.e., a region filled in with black. Additionally, in Experiment 2, we investigated the effect of maximal eye movements on FoV size by asking the participants to move their eyes as far as possible while resting their head on a chinrest.
The remainder of the paper is organized into five sections. Section 2 reviews related works, focusing on the design and development of HMDs. Section 3 describes the methods for Experiments 1 and 2, presented in Sections 3.1 and 3.2, respectively. Section 4 presents the results of each experiment in the same order (Sections 4.1 and 4.2). For quick reference to the results, readers can refer directly to the corresponding subsection. Section 5 provides a discussion, including limitations and directions for future work. Finally, Section 6 concludes our research.
2 Related work
2.1 Specifications of head-mounted displays
Previous studies have investigated the specifications of HMDs, such as pixel density, refresh rate, and latency, necessary to fulfill various objectives. Newman et al. (1998) introduced specifications of HMDs such as pixel density and refresh rate, focusing on performance in specialized tasks such as aggressive visual tracking, assuming actual use in flight. Jerald and Whitton (2009) investigated the imperceptible level of motion-to-photon latency, which is defined as the delay between head movement and its application to the visualization in an HMD. In this study, we focused on the specifications of the pixel density and FoV size such that users do not detect any degradation of these specifications.
Cuervo et al. (2018) introduced the necessary specifications to achieve “life-like virtual reality (VR),” a concept similar to “ideal HMDs” in terms of the criterion that users cannot detect any degradation in quality. However, their study employed retinal coordinates and did not account for eye movements. Our study employed head-centered coordinate system to estimate the specifications required for users not to perceive quality degradation.
2.2 Reduction of rendering resolution in the periphery of head-mounted displays
Foveated rendering saves computational resources by reducing the rendering resolution in the periphery (Guenter et al., 2012; Tan et al., 2018; Singh et al., 2023). Additionally, reducing resolution in the periphery helps alleviate discomfort. Hussain et al. (2021) found that peripheral blur, as a depth-of-field effect, significantly reduces cybersickness. Foveated rendering methods are typically classified into two categories: fixed foveated rendering (FFR) and dynamic foveated rendering (DFR). Without eye tracking, FFR presents an image with high resolution in the frontal direction of the head and gradually decreases the resolution as eccentricity increases in the head-centered coordinate system (Singh et al., 2023). By contrast, DFR leverages eye tracking to generate an image with high resolution in the region being gazed at while gradually decreasing the resolution of pixels away from that region. Using either method, ideal HMDs must have sufficient pixel density to display foveated images without the user perceiving a decrease in pixel density.
Previous quality assessment methods for foveated images are insufficient in revealing the specifications necessary for ideal HMDs. Wang et al. (2001) and Lee et al. (2002) proposed objective metrics to estimate the subjective quality of foveated images. However, these methods cannot predict whether the foveated images are indistinguishable from their original images. To achieve perceptually lossless foveated rendering, Swafford et al. (2016) proposed an objective metric called HDR-VDP2 (Mantiuk et al., 2011), which is based on the cortical magnification factor (Rovamo and Virsu, 1979; Virsu and Rovamo, 1979). Using a similar concept, Mantiuk et al. (2021) proposed an objective metric called FovVideoVDP, which models the perceptual characteristics of contrast sensitivity, cortical magnification, and contrast masking (Legge and Foley, 1980). These objective metrics were constructed based on subjective evaluations using a retina-centered coordinate system with the participants fixating on a specific point on a display placed in front of them. In this study, we used head-centered coordinate system with eye movements to estimate the pixel density required for ideal HMDs.
2.3 Expanding the field of view of head-mounted displays
Various methods have been proposed to expand the FoV of HMDs. Rakkolainen et al. (2017) proposed a method to expand the FoV by including modules consisting of a Fresnel lens and screens on the sides of a frontal display. Rakkolainen et al. (2016) and Ratcliff et al. (2020) achieved FoV expansion utilizing a curved Fresnel lens and curved microlens array, respectively. Xiao and Benko (2016) introduced SparseLightVR, which expands the FoV of off-the-shelf HMDs by arranging LEDs and diffusers at the periphery of the displays.
Although these methods can significantly expand the FoV of HMDs, the extent to which we need to expand the FoV for ideal HMDs remains unclear. A large horizontal FoV of 270° can be achieved for HMDs using curved Fresnel lenses (Rakkolainen et al., 2016). However, the cost of developing HMDs that surpass the human visual function does not commensurate with their benefits. Reducing the FoV to a size where users cannot perceive the edge of the display will result in smaller, lighter, and more power-efficient devices. This study aimed to determine the minimum horizontal FoV for ideal HMDs, considering the natural eye movements.
3 Methods
3.1 Experiment 1
In Experiment 1, we investigated the eccentricity of the boundary above which the participants could not distinguish between high- and low-resolution areas. Specifically, we estimated the size of the minimum intact region above which the cutoff of spatial frequency components above a certain frequency was imperceptible. The participants naturally moved their eyes in coordination with their heads while observing images of natural scenes.
3.1.1 Participants
We recruited 20 participants with visual acuity better than 20/20 without any correction. We assessed their visual acuity using a the vision inspection device based on a tumbling E chart (Screenoscope SS-3, TOPCON, Japan). Their mean age was 25.5 years old, with a standard deviation (SD) of 5.5. The female-to-male ratio was 1:1. The number of participants was determined based on the findings of a previous study (Miyashita et al., 2023). This study was reviewed and approved by the Ethics Committee of NHK Science and Technology Research Laboratories. All participants provided written informed consent to participate in the study.
3.1.2 Apparatus
As shown in Figure 2A, we used a cylindrical display that simulated an HMD with high pixel density and wide horizontal FoV. Currently available HMDs are inadequate for investigating the visual characteristics in the periphery because they lack sufficient pixel resolution and FoV. The cylindrical display consisted of twenty 4K panels (LG, 65EV5E) that were rotated vertically and curved along a cylindrical shape with a radius of 2.6 m. An observer placed at the center of the cylindrical display can view images with a spatial frequency of up to 60 cpd. This frequency exceeds the threshold of 30 cpd at which individuals with normal vision (20/20) can resolve the spatial details in an image. The cylindrical display inevitably showed vertical lines between the panels because each panel had 1-cm-wide bezels. By placing the panels such that the bezels of adjacent panels overlapped to minimize the gaps where no images were displayed, the gaps were suppressed to approximately 0.22° of visual angle. To ensure a continuous image across multiple panels, we created display images with bezel compensation to give viewers a seamless view even with the gaps. The experiment was conducted in a dimly lit room such that the light reflected from the displays was not obvious.
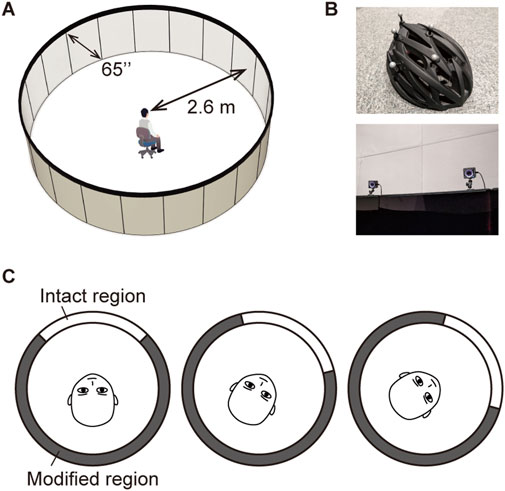
Figure 2. Experimental setup. (A) A cylindrical display that covers the participant’s 360° horizontal FoV with high-resolution images. Each participant sat at the center of the display. (B) A marker-attached helmet and motion-tracking cameras. The participants’ head positions and postures were captured using nine motion-tracking cameras mounted on the upper edge of the displays. (C) The intact region rotated in synchronization with the rotation of the head.
As shown in Figure 2B, we used nine motion trackers (OptiTrack, Prime X13) to capture the participants’ head positions and postures. The participants wore bicycle helmets attached with retroreflective markers. We simulated the displaying manner of HMDs when users rotated their heads, as shown in Figure 2C. We divided the display areas into two regions: the intact and the modified regions, and examined the position of the boundary. In the intact regions, original images with a spatial frequency of 60 cpd were presented, whereas in the modified region, blurred images without spatial frequency components above a certain threshold were presented. The horizontal center of the intact region was always aligned with the forward direction of the head by following the yaw angle of the participant’s head. The participants’ head positions and postures were recorded while they observed the stimuli, allowing us to investigate their head movement patterns.
3.1.3 Stimuli
Figure 3A shows the stimulus images of three virtual scenes with a 360° horizontal FoV. These scenes included both inside and outside locations as well as artificial and natural environments. Figure 3B shows the spatial frequency spectra of these images. The spectral power decreased with frequency, similar to that for images of real scenes (van der Schaaf and van Hateren, 1996). The area of the image that the participants observed in front of them at the beginning of each trial was randomized to avoid any bias caused by the choice of areas. Specifically, the areas were determined by horizontally rotating the 360° image in integer multiples of 72°, and the participants were presented with one of the areas, ensuring equal distribution of frequency (i.e., 20%) across each angular phase.
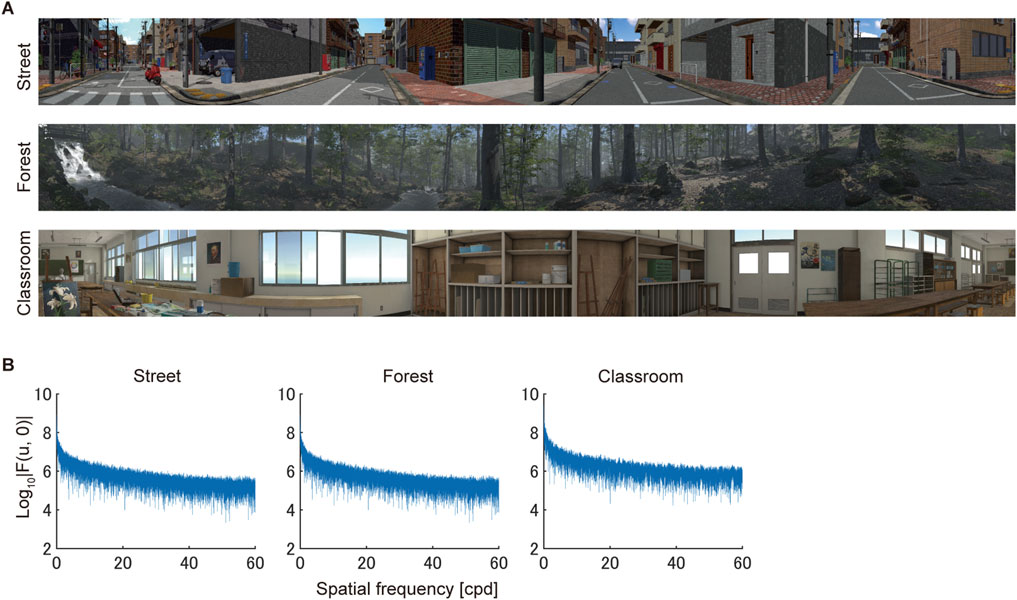
Figure 3. Computer-generated stimuli. (A) Stimulus images. Three images had a horizontal FoV of 360°. (B) Horizontal spatial frequency spectra of the three stimulus images. The vertical axis shows the spectral power, computed as the logarithm of the amplitude in the spatial frequency domain.
Prior to the experiment, we rendered images of these scenes offline and saved them as files using Unity 3D software (Unity Technologies, United States). For each scene, we generated 20 images, each image corresponding to a single panel. The shape of the panels was compensated for in the rendering process. That is, an image rendered for a flat panel appears to be distorted when displayed on a curved panel. To address this issue, we applied pixel warping. Specifically, we filled each pixel of the 4K (2,160 × 3,840) curved panel by selecting the corresponding pixels from an 8K (4,320 × 7,680) virtual flat panel, which was placed tangent to the curved panel.
We created blurred images to be displayed in the modified region by applying low-pass filters (LPFs) of spatial frequency to the original images. We created two levels of blurred images using LPFs with cutoff frequencies of 0.5 and two cpd. The images produced with the 0.5-cpd cutoff LPF were more blurred than those produced with the 2-cpd cutoff LPF. We generated the LPFs of the finite impulse response (FIR) using Filter Designer of MATLAB (MathWorks, United States). We designed the filters such that the amplitude at the cutoff frequency decreased by half of the input, i.e., −6 dB, and the stopband attenuation reached −80 dB. Because a steep cutoff of spectra in the frequency domain can lead to ringing artifacts in the spatial domain (Wang and Healy, 2023), we designed smoother transitions to ensure that low-pass filtering was performed without ring-back artifacts. The kernel sizes were 459 × 459 and 161 × 161 for the LPFs with the 0.5 and 2 cpd cutoffs, respectively. The specific procedure to generate the low-pass filtered images consisted of three steps: 1) increasing the FoV of the original images to compensate for the size of the LPF kernel, 2) generating the filtered images by convolving the LPF kernel with the designed filter parameters onto the original images, and 3) cropping the edges of the filtered images to generate display images that matched the display resolution. This procedure ensured that the images satisfied the designed filter characteristics even at their edges.
At the border between the intact and modified regions, we blended the original and blurred images following two methods: steep and gradual (Figure 4A), wherein the spatial variations in quality degradation occur steeply and gradually, respectively. The pixel values of the original and blurred images,
where the variable
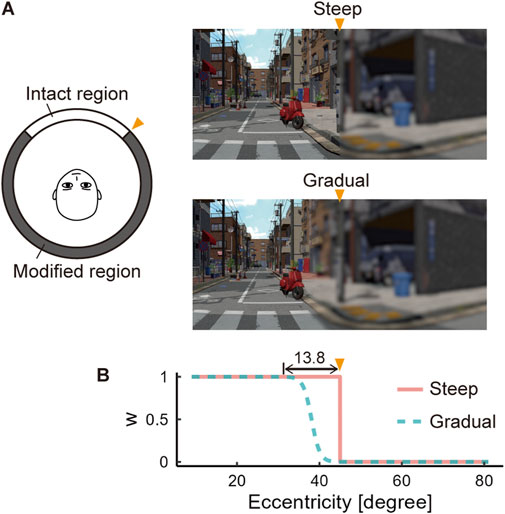
Figure 4. Transition at the border between the intact and modified regions. (A) Schema of the steep and gradual blending methods. The orange triangles indicate the position of the border between the intact and modified regions. (B) Plots of the weight values for image blending versus eccentricity. The stimulus images are generated by blending the original and quality-degraded (blurred) images according to the values of w.
Following the method of constant stimuli, we varied the horizontal angle of the intact region at 11 levels, and the participants were shown the images at each level ten times. When using the 0.5-cpd cutoff LPF, the intact region ranged from 200° to 250° and 188.8°–238.8° at 11 levels with a 5° interval for steep and gradual blending, respectively. When using the 2-cpd cutoff LPF, the intact region ranged from 70° to 170° and 83.8°–183.8° at 11 levels with a 10° interval for steep and gradual blending, respectively. The ranges of the intact region varied depending on the cutoff frequency because the smaller the amount of blurring, the narrower the intact region tends to be. These values were determined based on the preliminary experiments to optimize the number of trials. Each participant observed 330 stimuli (3 scenes × 11 angular levels × 10 repetitions) in a session at a single cutoff frequency with either the steep or gradual blending methods.
3.1.4 Procedure
As shown in Figure 5A, the participants performed a two-interval forced choice (2IFC) task (see the supplementary video for a better understanding). They sequentially observed two images of the same scene, one of which had a modified region and the other had only a 360° intact region, i.e., the original image. They chose an interval in which they perceived the modified region was contained.
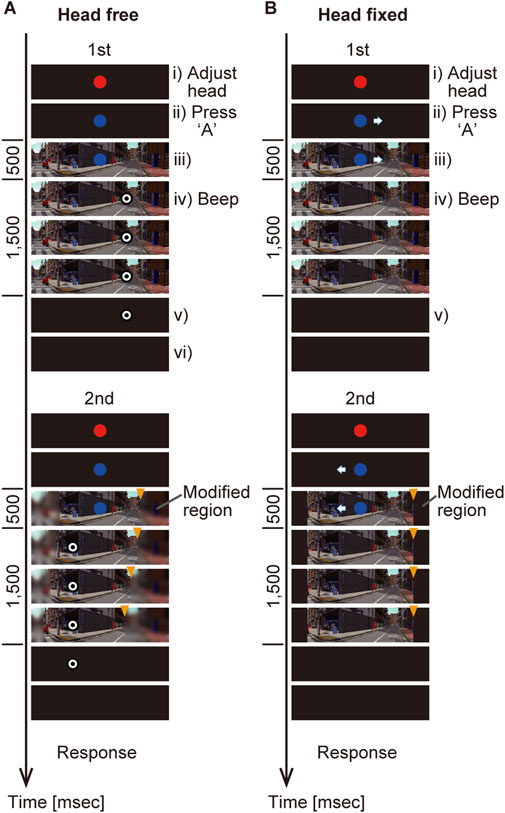
Figure 5. Procedure of the 2IFC task. (A) Head-free condition. (B) Head-fixed condition. The orange triangles indicate the borders of the intact and modified regions. These triangles were drawn for better understanding and were not displayed in the experiments.
Each trial consisted of the following five steps, i) – v), as shown in Figure 5. Before observing each stimulus, the participants adjusted their head positions and postures (Figure 5Ai and Figure 6A). This ensured that the head remained within a 50 mm virtual cube, centered on the cylindrical display. The virtual cube was positioned at a height of approximately 1.2 m, aligning with the height of the center of each curved panel. The adjustment also ensured that the head was oriented within 5° of the frontal direction, as indicated by the red dots in Figure 6A. The participants used two indicators for the adjustment: a white circle and a white cross. The white circle indicated the current position, while the white cross indicated the current orientation of the head. The participants precisely aligned the two indicators with a red dot. Once the adjustment was completed, the color of the dot changed from red to blue.
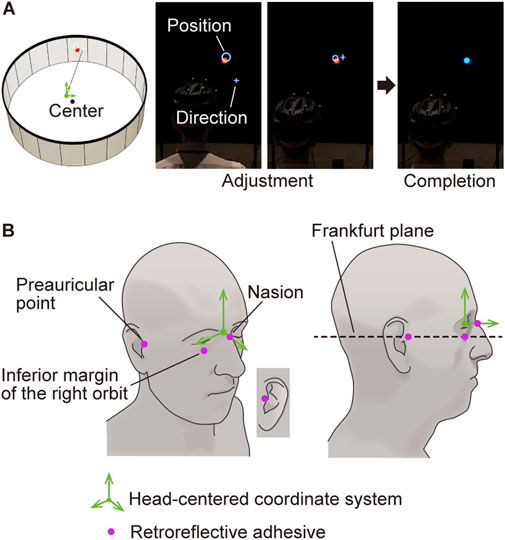
Figure 6. Adjustment of the head position and posture. (A) Head adjustment by aligning the white cross and white circle over the red dot. The red dot indicates the frontal direction of the cylindrical display. The white circle’s position on the display indicates both the horizontal and vertical head positions, while its size represents the front-back positioning of the head. The white cross points in the direction of the head. The adjustments are deemed complete when the color of the red dot changes to blue. (B) Definition of the facial landmarks. We calibrated the head-centered coordinate system using four facial landmarks. The relationship between the coordinate system and positions of markers attached to the helmet (Figure 2B) was recorded before each experiment.
The participants observed an image while naturally moving their heads and eyes. As shown in Figure 5Aii), they initiated the observation of each stimulus by pressing the “A” button on a gaming pad at their preferred timing after completing the adjustment of the head position and orientation. Subsequently, a scene image was presented with or without the modified region while the blue dot remained as a fixation point (Figure 5Aiii). After 500 m, a bullseye target with a diameter of 1° appeared either 60° to the right or left of the fixation point (Figure 5Aiv). We placed the target at the 60° position because the saccadic amplitude is near its peak when the target appears at this eccentricity (Guitton and Volle, 1987). The fixation point disappeared simultaneously with the appearance of the target. The appearance of the target was indicated by a 1 kHz beep lasting for 200 m. The participants were instructed to look at the target with natural head movements. The scene image turned black 1,500 m after the target’s appearance (Figure 5Av). When the head was oriented toward the target within 5°, the target disappeared (Figure 5Avi). The second stimulus was observed in the same manner as the first one. After observing the two stimuli, the participants were asked to select one stimulus that they felt the presence of the modified region using the up and down keys on the game pad.
The participants received instructions before the experiment. We clarified that the modified region rotates synchronously with head rotations using a video of a trial captured with a wide-angle camera. This video also demonstrated how fast they rotate their heads during a trial. They were instructed to move their heads slowly, as they would when looking at surrounding objects without rushing. They were instructed not to rotate their chair seats during the trial. We ensured that the participants had a clear understanding of how to execute the task through a practice session of 30 trials.
Following the instructions, we calibrated the head-centered coordinate system based on the facial landmarks of each participant. The head-centered coordinate system was established using four retroreflective adhesives attached to the faces of the participants (Figure 6B). These markers were attached to four facial landmarks: the nasion, left and right preauricular points, and inferior margin of the right orbit. As shown in Figure 6B-right, the head-centered coordinate system was oriented parallel to the Frankfurt plane, approximately corresponding to the true horizontal plane when the visual axis was horizontal (Leitao and Nanda, 2000). The height and depth of the origin of the coordinate system corresponded to those of the nasion and inferior margin of the right orbit, respectively. Finally, we established the relationships between the head-centered coordinate system and helmet makers, the positions of which were streamed to the rendering computers.
Following a between-participant design, the 20 participants were evenly assigned to two groups for the steep and gradual border types. Each participant completed two sessions, each consisting of either 0.5 cpd or two cpd conditions. The two sessions took place on different days. Participants completed the 0.5 cpd session first, followed by the two cpd session.
3.1.5 Analysis
We estimated the minimum horizontal angle of the intact region as the threshold at which the participants could not distinguish the presence or absence of the modified region. For each participant, we obtained a response in each trial. Let i be the trial number and
We introduce
where
Equation 3 indicates that the probability of not noticing stimulus modification,
An incorrect response indicated that the participant failed to notice the modified region and randomly chose the incorrect stimulus interval (that is, the stimulus interval that was not modified). This probability is described as
We estimated the parameters
The likelihood function
We adopted a uniform distribution as the prior distribution
When estimating the parameters
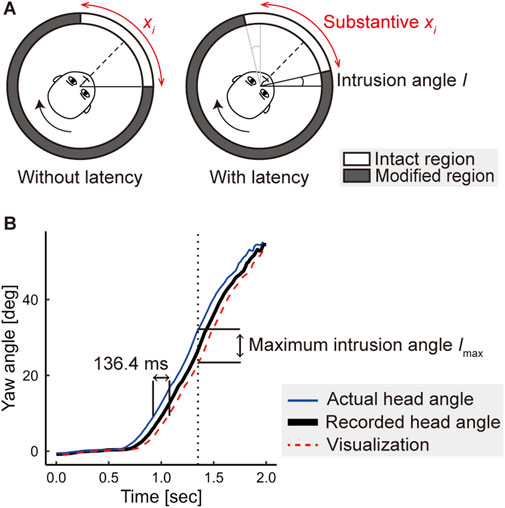
Figure 7. Compensation for motion-to-photon latency in the display system. (A) Substantive intact region corrected by the latency. The intact region was inherently narrowed if the latency existed. (B) Relationship between the actual head direction, the recorded head direction, and the visualization. The plot shows an example of the recorded yaw angles of a participant’s head during a stimulus observation with a target shown on the right. The latency can be estimated based on the maximum difference between the actual head angle and the visualization.
Before the experiment, we measured the motion-to-photon latency using a video camera (SONY, DSC-RX0) operating at 960 Hz. We captured the motion of retroreflective markers and the response images displayed on the cylindrical display. By analyzing the captured video, we obtained the motion-to-photon latency by counting frames from when the retroreflective markers began to move to when the images on the cylindrical display began to move. We iterated this procedure 100 times to estimate the latency as 136.4 ± 6.1 m (mean ± SD).
We corrected the size of the intact region,
We subtracted twice the maximum intrusion angle from the intact region for both the left and right sides, assuming symmetry of the intact region, as shown by gray lines in Figure 7A-right.
In addition, we investigated the effect of border type (steep and gradual blending of the intact and modified images, shown in Figure 4A) on threshold (
3.2 Experiment 2
In Experiment 2, we investigated the size of FoV for ideal HMDs. The FoV was represented by the horizontal angle of the intact region above which the pixels were filled with black. There was no blur region in Experiment 2. Following the same scheme as in Experiment 1, we examined the effects of border type (steep and gradual) on the horizontal FoV. This experiment was conducted in head-free and head-fixed conditions. In the head-free condition, the participants performed the task with natural gaze shifts in coordination with the head movements. In the head-fixed condition, they performed the same task but without head movements, while shifting their gaze maximally to the temporal side.
3.2.1 Participants
We recruited 20 participants, 18 of whom participated in Experiment 1. We assessed their visual acuity using a vision inspection device a tumbling E chart (Screenoscope SS-3, TOPCON, Japan). The visual acuity of all participants was better than 20/20 without any correction. Their mean age was 25.3 years old, with SD = 5.7. The female-to-male ratio was 1:1. All participants provided written informed consent to participate in the study.
3.2.2 Apparatus
For Experiment 2, we used the same cylindrical display and motion-capture system as those in Experiment 1. We captured the participants’ head positions and postures in head-free and head-fixed conditions. In both conditions, the orientation of the intact region was synchronized with that of the head.
In the head-fixed condition, the participants performed the task on a chinrest. Although the head may have moved slightly during stimulus observation, we assumed that this would not affect the response because the intact region rotated synchronously with the head. To ensure that the head movements were small, we recorded the participants’ head positions and postures while they observed the stimuli. After the experiment, we examined how much the participants’ heads were fixed.
3.2.3 Stimuli
We used the same three scenes as those in Experiment 1. We filled the pixels in the modified region with black. At the border between the intact and modified regions, we blended the original and black images based on Equation 1. For Experiment 2,
Following the method of constant stimuli, we varied the horizontal angle of the intact region at 11 levels (5° intervals), and the participants were shown the images at each level ten times. In the head-free condition, the intact region ranged from 225° to 275° and 233.8°–283.8° for stimuli generated using the steep and gradual blending methods, respectively. In the head-fixed condition, we used only the steep method, with the intact region ranging from 235° to 285°. Each participant observed 330 stimuli (3 scenes × 11 angular levels × 10 repetitions) in each condition.
3.2.4 Procedure
For the head-free condition, the procedure was identical to that in Experiment 1. As shown in Figure 5A, the participants sequentially observed two images, one of which had a modified region filled with black. The participants were instructed to naturally shift their gaze toward the bullseye target with head movements. They selected one of the two stimuli for which they felt the presence of a black mask in the modified region.
Figure 5B shows the procedure for the head-fixed condition, wherein the participants observed two images sequentially by shifting their gaze maximally. Each trial consisted of the following five steps. Before stimulus observation, i) the participants adjusted their head positions and postures on the chinrest in the same manner as in Experiment 1. ii) After the completion of head and posture adjustment, the color of the fixation dot changed from red to blue. Simultaneously, an arrow indicating the direction of maximal eye movement was presented adjacent to the dot. The direction of the arrow was randomly selected to be either left or right for each stimulus. After completing the head and posture adjustment, the participants initiated stimulus observation by pressing the “A” button on a gaming pad at their preferred timing. iii) Subsequently, a scene image was presented with or without the modified region while the blue dot and arrow stayed in the same position. The participants maintained their gaze on the blue dot. iv) After 500 m, a 1 kHz beep that lasted for 200 m signaled the start of eye movements. Simultaneously, the blue dot and arrow disappeared. The participants then shifted their gaze maximally in the direction indicated by an arrow. v) The scene image turned black 1,500 m after the beeping sound was emitted. The second stimulus was observed in the same manner as the first one. After the two observations, the participants selected a stimulus that they felt contained the modified region.
The 20 participants were evenly assigned with an equal female-to-male ratio to two groups: one containing stimuli with steep blending and the other with gradual blending. Those assigned to the steep group in Experiment 1 were assigned to the same group in Experiment 2, and vice versa. The participants assigned to the steep group performed the experiments under both head-free and head-fixed conditions. These experiments were conducted on two separate days to minimize participant fatigue.
3.2.5 Analysis
We estimated the threshold of the required size of FoV for each participant under each condition using Bayesian inference using the likelihood function given in Equation 7. Motion-to-photon latency was corrected in both head-free and head-fixed conditions using the method presented in Section 3.1.5. As in Experiment 1, we tested the difference in the thresholds between the border types (steep and gradual blending) using one-sided Welch’s t-test. In the same manner, we tested the difference in the thresholds between the head movement conditions (free and fixed) using one-sided Welch’s t-test.
4 Results
4.1 Experiment 1
We collected the responses
4.1.1 Required horizontal angles of intact region
Figure 8A shows the estimated
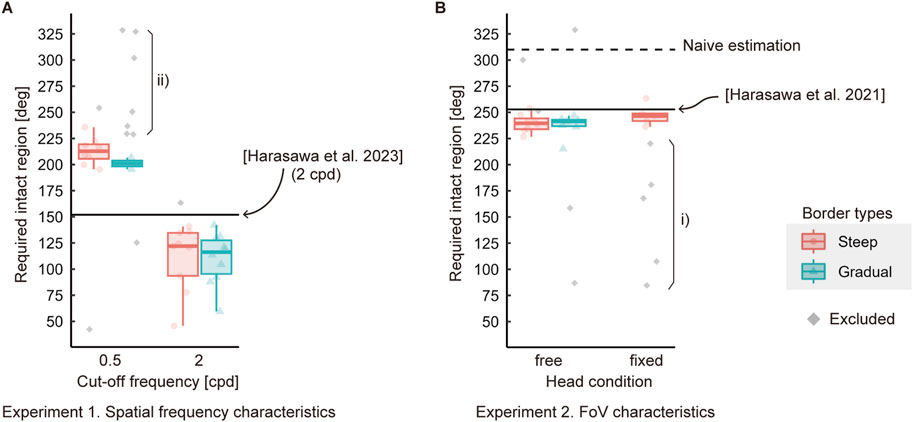
Figure 8. Horizontal angles of intact regions required for participants to not notice quality degradations. Each point indicates the threshold
The medians of
4.1.2 Head motion
The recorded data of head motion indicated that the participants started to move their heads after the appearance of the target. Figure 9A shows the yaw angle transitions for each participant’s head during the observation of stimuli with the modified region in Experiment 1. Each curve represents the regression of the yaw angles per participant, obtained by the geom_smooth function in R (Wickham et al., 2024.) with the generalized additive model (GAM) (Hastie and Tibshirani, 1986). The transition curves indicated that head rotation started approximately 0.5 s after the appearance of the bullseye target, which was approximately 1 s after the scene image appeared. This suggests that the participants were following the task procedures correctly.
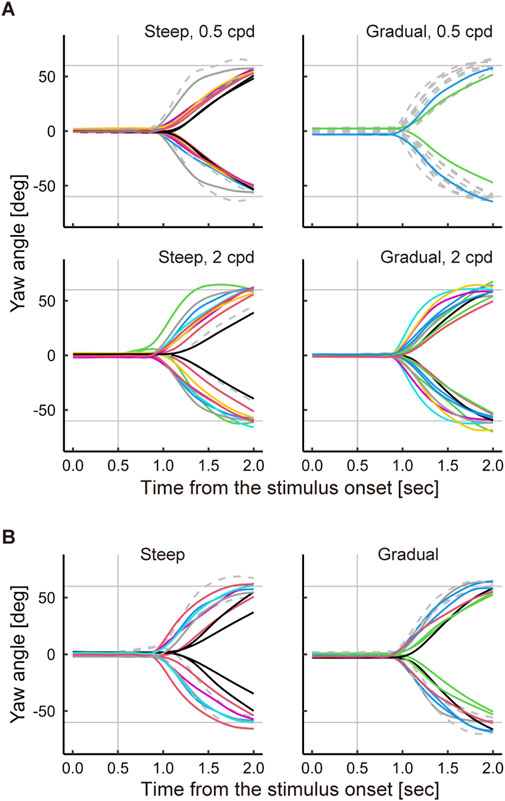
Figure 9. Yaw angle transitions of each participant’s head during stimulus observation. (A) Transitions observed in Experiment 1. (B) Transitions observed in Experiment 2. The left and right panels in A and B compare the observations with respect to the blending methods (border types). The rising and falling curves correspond to head rotations in the right and left directions, respectively. The dashed lines represent the head rotations of the excluded participants in the analysis. The vertical gray lines indicate the time of appearance of the bullseye target. The horizontal gray lines indicate the yaw angles of the bullseye target: 60° for the right and −60° for the left.
The velocity of head rotation varied among the participants. We measured
Faster head movement tended to reduce the size of the intact region, depending on the blending method. The Pearson’s correlation coefficients between the medians of
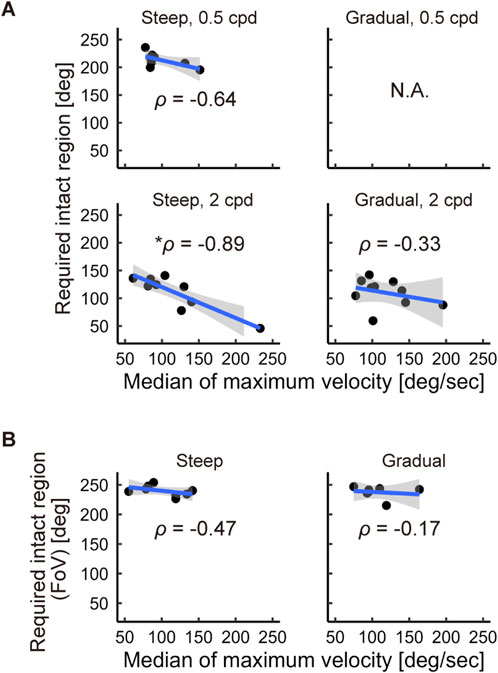
Figure 10. Correlations between the velocity of head rotation and the required intact region. (A) Correlation observed in Experiment 1. (B) Correlation observed in Experiment 2. The shaded areas indicate the 95% confidence intervals.
4.2 Experiment 2
In the analysis, we excluded
4.2.1 Required horizontal angles of intact region
Figure 8B shows the estimated
In the head-free and head-fixed conditions, the medians of
The estimated
4.2.2 Head motion
Figure 9B shows transitions of head rotations in the head-free condition in Experiment 2, with results similar to those obtained in Experiment 1 (Figure 9A). The head rotation started approximately 0.5 s after the appearance of the bullseye target, which was approximately 1 s after the scene image appeared.
In the head-free condition, the velocity of head rotation varied among the participants. The median of
In the head-free condition, we found no correlations between the velocity of the head rotation and
In the head-fixed condition, the head did not rotate or translate significantly and remained close to the center of the cylindrical display. Figure 11A shows the magnitude of the head rotation for each stimulus observation. The medians of rotations in the yaw, pitch, and roll axes were approximately 0.7°, 0.3°, and 0.3°, respectively. Figure 11B shows the extent of head translation during each stimulus observation. The medians of the extent of head translation were approximately 0.08, 0.04, and 0.04 cm along the three axes: left-right, down-up, and back-front, respectively. Figure 11C shows the medians of head positions along each axis for each stimulus observation. We found that the head positions were sufficiently close to the center such that 95% of the medians were within 1.3 cm of the center.
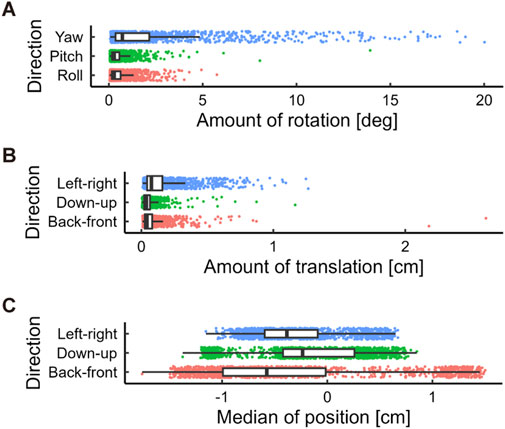
Figure 11. Amount of head movements relative to the display in the head-fixed condition. (A) Amount of rotation angles observed during stimulus viewing. (B) Amount of translation observed during stimulus viewing. These values indicate the difference between the maximum and minimum values along each axis in each stimulus observation. (C) Box plots of the head positions in each stimulus observation. The origin indicates the center of the cylindrical display.
5 Discussion
5.1 Interpretation and significance
We investigated the horizontal specifications of pixel resolution and FoV required for ideal HMDs under practical conditions, wherein the participants naturally shifted their gaze and observed natural scenes. We found that ideal HMDs do not have to provide spatial frequency components higher than 0.5 and two cpd in the periphery outside of approximately 210° and 120°, respectively. We also found that the horizontal FoV required for ideal HMDs was approximately 240°, which is much smaller than the naive estimate of 310° obtained by previous studies (Traquair, 1938; Lee et al., 2019; Lestak et al., 2021). The required sizes of the intact region estimated in this study tended to be lower than those estimated in the previous studies (Harasawa et al., 2021; 2023) in which the participants maximally shifted their gaze. Specifically, specifications lower than the previous estimates were sufficient for all participants except two, when applying the LPF at the 2-cpd cutoff and narrowing FoV. These findings suggest that the specifications required for ideal HMDs can be relaxed in practical conditions.
We observed no significant differences in the required size of the intact region between the head-fixed and head-free conditions, as shown in Figure 8B. This result was unexpected, as the participants should have observed the larger visual field with maximal gaze shift in the head-fixed condition than with moderated gaze shift in the head-free condition. The median of the required FoV in the head-fixed condition is 5° larger than that in the head-free condition. This difference was not statistically significant, possibly due to the small number of participants, resulting in a lack of statistical power. A post hoc analysis indicated that the test had a power of approximately 0.4.
We observed no significant differences in the required specifications between the steep and gradual blending methods in both Experiments 1 and 2. As shown in Figure 4B, the width of the transition from the original to the completely quality-degraded images was approximately 13.8° in the gradual blending method. This means that the definition of the intact region somewhat includes the area with gradual quality degradation. This transition width might be too large and affect
There were much smaller values of
A rapid head rotation might contribute to reducing the size of the required intact region. A faster head rotation induces smaller saccade amplitudes (Guitton and Volle, 1987), which probably reduces the size of the required intact region. As shown in Figure 10, the correlation coefficients between median of
5.2 Limitations and future work
In the condition of 0.5-cpd cutoff LPF with the gradual method, the estimated
In this study, we used only static images. We suppose that when observing dynamic images, the intact region required for not noticing the cutoff of spatial frequency components does not surpass that with static images. In dynamic images, the stimulus velocity on the retina could be greater than that in static images. Dynamic visual acuity (DVA), the ability to identify the details of a moving stimulus, becomes worse as the stimulus velocity on the retina increases (Brown, 1972; Antonio Aznar-Casanova et al., 2005; Lewis et al., 2011; Patrick et al., 2019). This DVA degradation might make the cutoff of spatial frequency components less noticeable. By contrast, a narrowed FoV might become more noticeable owing to the greater temporal luminance variation in the periphery in dynamic images. Therefore, an investigation using dynamic images is expected to provide a more conservative estimate of the required FoV.
In this study, we investigated the size of required intact region with cutoff frequencies of 0.5 and two cpd. Harasawa et al. (2023) showed that the required intact regions with 4- and 8-cpd LPFs were approximately 34° and 45° smaller, respectively, than that with 2-cpd LPF under the condition of maximal eye movements. It remains unclear whether differences between 2-cpd and higher cut-off frequencies during natural eye movements are comparable to those during maximal eye movements. If they are comparable, then the required intact regions during the natural eye movements could be predicted based on the results obtained under the condition of maximal eye movements, and vice versa. Future studies will include estimations involving higher cut-off frequencies in practical conditions.
It is known that there are sex-based differences in human visual system (Vanston and Strother, 2017). Investigating these differences in the specifications required for ideal HMDs is valuable for developing more personalized HMDs tailored to each user’s gender.
6 Conclusion
In this study, we estimated the horizontal specifications required for developing ideal HMDs under practical conditions wherein the participants moved their eyes in coordination with head rotations while observing natural scene images. The study revealed that ideal HMDs do not have to provide images with spatial frequencies above 0.5 and two cpd in the periphery horizontally outside of approximately 210° and 120°, respectively. In addition, we found that ideal HMDs need to provide a FoV of at least 240°. This is much smaller than a naively estimated FoV of 310° obtained by summing the FoVs in retina-centered coordinate system and the eye’s movable range. We believe that our findings will aid the design of ideal HMDs.
Data availability statement
The raw data supporting the conclusions of this article will be made available by the authors, without undue reservation.
Ethics statement
The studies involving humans were approved by Ethics Committee of NHK Science and Technology Research Laboratories. The studies were conducted in accordance with the local legislation and institutional requirements. The participants provided their written informed consent to participate in this study.
Author contributions
YM: Data curation, Formal Analysis, Investigation, Methodology, Software, Visualization, Writing–original draft. MH: Conceptualization, Methodology, Supervision, Writing–review and editing. KH: Resources, Software, Writing–review and editing. YS: Methodology, Writing–review and editing. KK: Project administration, Writing–review and editing.
Funding
The author(s) declare that no financial support was received for the research, authorship, and/or publication of this article.
Conflict of interest
Authors YM, MH, KH, YS, and KK were employed by Japan Broadcasting Corporation.
Publisher’s note
All claims expressed in this article are solely those of the authors and do not necessarily represent those of their affiliated organizations, or those of the publisher, the editors and the reviewers. Any product that may be evaluated in this article, or claim that may be made by its manufacturer, is not guaranteed or endorsed by the publisher.
Supplementary material
The Supplementary Material for this article can be found online at: https://www.frontiersin.org/articles/10.3389/frvir.2024.1485243/full#supplementary-material
References
Anstis, S. M. (1974). A chart demonstrating variations in acuity with retinal position. Vis. Res. 14, 589–592. doi:10.1016/0042-6989(74)90049-2
Antonio Aznar-Casanova, J., Quevedo, L., and Sinnett, S. (2005). The effects of drift and displacement motion on Dynamic Visual Acuity. Psicológica 26, 105–119.
Brown, B. (1972). Resolution thresholds for moving targets at the fovea and in the peripheral retina. Vis. Res. 12, 293–304. doi:10.1016/0042-6989(72)90119-8
Campbell, F. W., and Robson, J. G. (1968). Application of Fourier analysis to the visibility of gratings. J. Physiol. 197, 551–566. doi:10.1113/jphysiol.1968.sp008574
Cuervo, E., Chintalapudi, K., and Kotaru, M. (2018). “Creating the perfect illusion: what will it take to create life-like virtual reality headsets?,” in HotMobile 2018 - proceedings of the 19th international workshop on mobile computing systems and applications (New York, NY, USA: Association for Computing Machinery), 7–12. doi:10.1145/3177102.3177115
Freedman, E. G., and Sparks, D. L. (1997). Eye-head coordination during head-unrestrained gaze shifts in rhesus monkeys. J. Neurophysiol. 77, 2328–2348. doi:10.1152/jn.1997.77.5.2328
Guenter, B., Finch, M., Drucker, S., Tan, D., and Snyder, J. (2012). “Foveated 3D graphics,” in ACM transactions on graphics. doi:10.1145/2366145.2366183
Guitton, D., and Volle, M. (1987). Gaze control in humans: eye-head coordination during orienting movements to targets within and beyond the oculomotor range. J. Neurophysiol. 58, 427–459. doi:10.1152/jn.1987.58.3.427
Hanif, S., Rowe, F. J., and O’connor, A. R. (2009). A comparative review of methods to record ocular rotations. Br. Ir. Orthopt. J. 6, 47. doi:10.22599/bioj.8
Harasawa, M., Miyashita, Y., and Komine, K. (2021). Perimetry on head-centered coordinate system for requirements of head-mounted display. Proc. Int. Disp. Work. 28, 587–589. doi:10.36463/idw.2021.0587
Harasawa, M., Miyashita, Y., and Komine, K. (2023). Required specification on spatial aspects for ideal HMD estimated on head-centered coordinate system. Proc. Int. Disp. Work. 30, 748–750. doi:10.36463/idw.2023.0748
Hastie, T., and Tibshirani, R. (1986). Generalized additive models. Stat. Sci. 1. doi:10.1214/ss/1177013604
Hoffman, M. D., and Gelman, A. (2014). The No-U-turn sampler: adaptively setting path lengths in Hamiltonian Monte Carlo. J. Mach. Learn. Res. 15, 1593–1623. Available at: http://jmlr.org/papers/v15/hoffman14a.html (Accessed July 2, 2024).
Hussain, R., Chessa, M., and Solari, F. (2021). Mitigating cybersickness in virtual reality systems through foveated depth-of-field blur. Sensors 21, 4006. doi:10.3390/s21124006
Jerald, J., and Whitton, M. (2009). “Relating scene-motion thresholds to latency thresholds for head-mounted displays,” in 2009 IEEE virtual reality conference, Lafayette, LA, USA, 14-18 March 2009 (IEEE), 211–218. doi:10.1109/VR.2009.4811025
Lee, S., Pattichis, M. S., and Bovik, A. C. (2002). Foveated video quality assessment. IEEE Trans. Multimed. 4, 129–132. doi:10.1109/6046.985561
Lee, W. J., Kim, J. H., Shin, Y. U., Hwang, S., and Lim, H. W. (2019). Differences in eye movement range based on age and gaze direction. Eye 33, 1145–1151. doi:10.1038/s41433-019-0376-4
Legge, G. E., and Foley, J. M. (1980). Contrast masking in human vision. J. Opt. Soc. Am. 70, 1458–1471. doi:10.1364/JOSA.70.001458
Leitao, P., and Nanda, R. S. (2000). Relationship of natural head position to craniofacial morphology. Am. J. Orthod. Dentofac. Orthop. 117, 406–417. doi:10.1016/S0889-5406(00)70160-0
Lestak, J., Lestak, T., Fus, M., and Klimesova, I. (2021). Temporal visual field border. Clin. Ophthalmol. 15, 3241–3246. doi:10.2147/OPTH.S321110
Levitt, H. (1971). Transformed up-down methods in psychoacoustics. J. Acoust. Soc. Am. 49, 467–477. doi:10.1121/1.1912375
Lewis, P., Rosén, R., Unsbo, P., and Gustafsson, J. (2011). Resolution of static and dynamic stimuli in the peripheral visual field. Vis. Res. 51, 1829–1834. doi:10.1016/j.visres.2011.06.011
Mantiuk, R., Kim, K. J., Rempel, A. G., and Heidrich, W. (2011). “HDR-VDP-2: a calibrated visual metric for visibility and quality predictions in all luminance conditions,” in ACM SIGGRAPH 2011 papers (New York, NY, USA: ACM), 1–14. doi:10.1145/1964921.1964935
Mantiuk, R. K., Denes, G., Chapiro, A., Kaplanyan, A., Rufo, G., Bachy, R., et al. (2021). FovVideoVDP: a visible difference predictor for wide field-of-view video. ACM Trans. Graph 40, 1–19. doi:10.1145/3450626.3459831
Miyashita, Y., Harasawa, M., Hara, K., Sawahata, Y., and Komine, K. (2023). “Estimation of required horizontal FoV for ideal HMD utilizing vignetting under practical range of eye displacement,” in Proceedings - 2023 IEEE conference on virtual reality and 3D user interfaces abstracts and workshops, VRW 2023. Shanghai, China, 25-29 March 2023 (IEEE), 691–692. doi:10.1109/VRW58643.2023.00188
Newman, R. L., Greeley, K. W., and Turpin, T. S. (1998). in HMDs: a standard and a design guide. Editors R. J. Lewandowski, L. A. Haworth, and H. J. Girolamo, 103–109. doi:10.1117/12.317423
Patrick, J. A., Roach, N. W., and McGraw, P. V. (2019). Temporal modulation improves dynamic peripheral acuity. J. Vis. 19, 12. doi:10.1167/19.13.12
Rakkolainen, I., Raisamo, R., Turk, M., and Höllerer, T. (2017). “Field-of-view extension for VR viewers,” in Proceedings of the 21st international academic mindtrek conference, AcademicMindtrek 2017 (Association for Computing Machinery, Inc). doi:10.1145/3131085.3131088
Rakkolainen, I., Turk, M., and Höllerer, T. (2016). “A compact, wide-FOV optical design for head-mounted displays,” in Proceedings of the ACM symposium on virtual reality software and Technology (VRST: Association for Computing Machinery), 293–294. doi:10.1145/2993369.2996322
Ratcliff, J., Supikov, A., Alfaro, S., and Azuma, R. (2020). ThinVR: heterogeneous microlens arrays for compact, 180 degree FOV VR near-eye displays. IEEE Trans. Vis. Comput. Graph 26, 1981–1990. doi:10.1109/TVCG.2020.2973064
Rovamo, J., and Virsu, V. (1979). An estimation and application of the human cortical magnification factor. Exp. Brain Res. 37, 495–510. doi:10.1007/BF00236819
Sidenmark, L., and Gellersen, H. (2019). Eye, head and torso coordination during gaze shifts in virtual reality. ACM Trans. Computer-Human Interact. 27, 1–40. doi:10.1145/3361218
Singh, R., Huzaifa, M., Liu, J., Patney, A., Sharif, H., Zhao, Y., et al. (2023). “Power, performance, and image quality tradeoffs in foveated rendering,” in 2023 IEEE conference virtual reality and 3D user interfaces (VR), Shanghai, China, 25-29 March 2023 (IEEE), 205–214. doi:10.1109/VR55154.2023.00036
Wickham, H., Chang, W., Henry, L., Pedersen, T., Takahashi, K., Wilke, C., et al. (2024). Smoothed conditional means. Available at: https://ggplot2.tidyverse.org/reference/geom_smooth.html. (Accessed June 10, 2024)
Stan Development Team (2023). RStan: the R interface to Stan. R. package version 2.26.1. Available at: https://mc-stan.org/.
Sutherland, I. (1968). A head-mounted three dimensional display. Proc. Fall Jt. Comput. Conf. 33, 757–764. doi:10.1145/1476589.1476686
Swafford, N. T., Iglesias-Guitian, J. A., Cosker, D., Koniaris, C., Mitchell, K., and Moon, B. (2016). “User, metric, and computational evaluation of foveated rendering methods,” in Proceedings of the ACM symposium on applied perception, SAP 2016 (Association for Computing Machinery, Inc), 7–14. doi:10.1145/2931002.2931011
Tan, G., Lee, Y.-H., Zhan, T., Yang, J., Liu, S., Zhao, D., et al. (2018). Foveated imaging for near-eye displays. Opt. Express 26, 25076. doi:10.1364/oe.26.025076
van der Schaaf, A., and van Hateren, J. H. (1996). Modelling the power spectra of natural images: statistics and information. Vis. Res. 36, 2759–2770. doi:10.1016/0042-6989(96)00002-8
Vanston, J. E., and Strother, L. (2017). Sex differences in the human visual system. J. Neurosci. Res. 95, 617–625. doi:10.1002/jnr.23895
Virsu, V., and Rovamo, J. (1979). Visual resolution, contrast sensitivity, and the cortical magnification factor. Exp. Brain Res. 37, 475–494. doi:10.1007/bf00236818
Wang, Y., and Healy, J. J. (2023). Image quality assessment for gibbs ringing reduction. Algorithms 16, 96. doi:10.3390/a16020096
Wang, Z., Bovik, A. C., Lu, L., and Kouloheris, J. L. (2001). in Foveated wavelet image quality index. Editor A. G. Tescher, 42–52. doi:10.1117/12.449797
Keywords: head-mounted display, spatial frequency, field of view, eye-head coordination, perimetry, foveated rendering, specification, human visual system
Citation: Miyashita Y, Harasawa M, Hara K, Sawahata Y and Komine K (2024) Estimation of horizontal spatial specifications for ideal head-mounted displays in practical conditions. Front. Virtual Real. 5:1485243. doi: 10.3389/frvir.2024.1485243
Received: 23 August 2024; Accepted: 23 October 2024;
Published: 05 November 2024.
Edited by:
Xueni Pan, Goldsmiths University of London, United KingdomReviewed by:
David Lindlbauer, Carnegie Mellon University, United StatesRohith Venkatakrishnan, University of Florida, United States
Copyright © 2024 Miyashita, Harasawa, Hara, Sawahata and Komine. This is an open-access article distributed under the terms of the Creative Commons Attribution License (CC BY). The use, distribution or reproduction in other forums is permitted, provided the original author(s) and the copyright owner(s) are credited and that the original publication in this journal is cited, in accordance with accepted academic practice. No use, distribution or reproduction is permitted which does not comply with these terms.
*Correspondence: Yamato Miyashita, bWl5YXNoaXRhLnktZmNAbmhrLm9yLmpw
 Yamato Miyashita
 Masamitsu Harasawa
 Kazuhiro Hara
 Yasuhito Sawahata
 Kazuteru Komine