 Jessica de Souza
 Robert Tartz
94% of researchers rate our articles as excellent or good
Learn more about the work of our research integrity team to safeguard the quality of each article we publish.
Find out more
ORIGINAL RESEARCH article
Front. Virtual Real., 10 June 2024
Sec. Virtual Reality in Industry
Volume 5 - 2024 | https://doi.org/10.3389/frvir.2024.1368721
This article is part of the Research TopicUse of AR/MR/VR in the Context of Occupational Safety and HealthView all 7 articles
Objective: Our study addresses the challenges limiting the adoption of Extended Reality (XR) Head-Mounted Displays (HMDs), mainly focusing on device quality and cybersickness. We aim to investigate the impact of hardware and software on user experience and task performance while wearing Video See-Through (VST) HMDs. We employ a novel methodology designed to bridge the gaps identified in previous research.
Methods: This study uses a convergent mixed-methods approach, combining qualitative and quantitative data in a within-subjects evaluation involving 20 participants. This comprehensive evaluation examines visual perception, visual quality, and user experience through a range of tasks. Usability, comfort, and cybersickness are assessed, with insights derived from both user performance metrics and subjective measures collected through in-depth interviews and comments. The study includes three distinct HMDs—two prototypes (PD1 and PD2) and one commercial device (CD1)—to provide a broad analysis of the technology.
Findings: Our findings reveal that while participants were generally satisfied with VST mode, their preferences varied across devices. CD1 was preferred for its realistic color representation and superior reading task performance due to its high-resolution display and camera. However, visual disturbances and temporal issues differed across devices, with CD1 exhibiting fewer artifacts when stationary but showing more disturbances when participants were moving. Participants found PD1 and PD2 more comfortable for extended use and fewer cybersickness symptoms, but they highlighted color and display resolution issues. These variations underscore the importance of considering both qualitative and quantitative measures in HMD evaluations.
Conclusion: This mixed-methods evaluation emphasizes the limitations of relying solely on visual perception performance measures for VST HMDs. By integrating both quantitative and qualitative insights, we offer a more detailed evaluation framework to identify design flaws and user experience issues that quantitative metrics alone might miss. This methodology contributes to the field by illustrating how a mixed-methods approach provides a broader perspective on XR technology, guiding future improvements and enhancing VST adoption in future applications.
The field of extended reality (XR) has experienced numerous transformations, where the fusion of virtual reality (VR) and augmented reality (AR) has brought the possibility of even more realistic experiences between the user and virtual content. Video See-Through (VST) technology lets users virtually immerse themselves in the real world while superimposing virtual content onto their view. Video see-through (VST) technology in VR Head-Mounted Displays (HMDs) uses forward-facing cameras to capture the surrounding environment, which is processed and reprojected to a Liquid Crystal Display (LCD) (Rokhsaritalemi et al., 2020; Pfeil et al., 2021; Xiao et al., 2022). While VR HMDs provide entirely virtual visuals by blocking out the physical surroundings and isolating the user from their environment, VST solutions address this limitation by displaying the user’s real-world perspective (Xiao et al., 2022). VST has a wider field-of-view and offers clearer graphical overlays since the projection is not affected by the environment’s brightness (Jerald, 2015). Additionally, VST devices compose both VR and AR experiences, eliminating the need for separate devices for each modality and not requiring the user to remove the HMD to see the real world, adding cost and convenience for the consumer (Pfeil et al., 2021).
XR made it possible to superimpose virtual content in high fidelity to the user’s environment, which several application domains can benefit from (Condino et al., 2019). For example, XR systems are incorporated in medicine, entertainment, industry development and training, military, real estate, and education (Alnagrat et al., 2021). However, several improvements need to be made in current XR devices since the population is reluctant to adopt these devices. For example, there is limited availability of virtual content and reduced device quality, which causes physical side effects (i.e., cybersickness), and general discomfort to the user due to an inadequate user experience (Stanney et al., 2020; Çöltekin et al., 2020). Some other issues, such as latency, can lead to simulation sickness (Gruen et al., 2020), narrower field of view, device obtrusiveness, frequent recalibrations for precise spatial alignment, low micro-display luminance, and conflicts between 3D real-world and 2D virtual images (Condino et al., 2019) are also found in current devices.
Low frame rate latency during head and limb movements in dynamic scenes can lead to discomfort, cybersickness, and reduced interaction performance in HMDs (Buker et al., 2012; Jerald, 2015; Freiwald et al., 2018). Factors such as camera auto-exposure time, display field of view, lens distortion, intra-camera and intra-lens distances, display flicker, head tracking accuracy and calibration, and vergence-accommodation conflict play critical roles in the visual comfort of these devices within VST applications (McCauley and Sharkey, 1992; Fernandes and Feiner, 2016; Kemeny et al., 2020; Eftekharifar et al., 2021). Depth misperception in VR can cause motion sickness and dizziness (Li et al., 2022; Xiao et al., 2022), which poses a persistent challenge. Associated with symptoms like nausea and visual disturbances, cybersickness hampers prolonged use of HMDs, impacting postural stability and coordination (Rokhsaritalemi et al., 2020). Addressing challenges such as field of view, cybersickness, and visual latency is crucial for enhancing the user experience and promoting increased adoption (Stanney et al., 2020). Despite previous investigations broadly tackling challenges in XR devices, a focused investigation into VST-related cybersickness and discomfort is needed from a user experience perspective.
The study from (Kim et al., 2020) highlights the importance of incorporating techniques like in-depth interviews or observations to gain nuanced insights into subjective assessments and unexpected contextual details. Meanwhile, quantitative performance metrics in technical evaluations can be reproduced and compared with previous works (Golafshani, 2003). However, using only objective measures is insufficient to show how device performance translates into user’s perceptions (Sutcliffe and Gault, 2004). We present a laboratory-based within-subjects study to comprehensively understand hardware and software influence factors on user performance and subjective perceptions of visual quality while using HMDs featuring VST image mode. Our study incorporated and adapted measures used in previous works with AR and VR (Sahm et al., 2005; Maruhn et al., 2019; Somrak et al., 2019; Pfeil et al., 2021; Li et al., 2022) and involved visual perception measures, visual quality measures, and user experience tasks that incorporated usability, comfort, and cybersickness. These measures composed a mixed-methods evaluation of VST mode across headsets with different technical specifications. To the authors’ best knowledge, no studies have employed mixed methods for systematically evaluating user performance, user experience, and user comfort for VST-enabled HMDs by simultaneously examining visual acuity, latency, depth perception, cybersickness, image quality, and color discrimination.
This paper makes the following contributions: a) A mixed-methods within-subjects study (N = 20) evaluating the efficacy of video see-through in virtual reality devices through visual perception performance tests, user experience tasks, and subjective measures; b) Comparative analysis of three distinct head-mounted displays in video see-through mode and key factors influencing user preferences; and c) Key end-user insights that can be leveraged to inform the development of future video see-through applications. Given the existing gaps in design standards regarding user satisfaction in VST technology applications, our findings provide researchers and developers with perspectives on the field and offer insights for future development.
The study design employs a convergent approach, blending qualitative and quantitative methodologies to provide a complete understanding of the research problem (Creswell and Clark, 2017). This design focuses on obtaining the strengths of both data types, allowing for a more robust data analysis (Golafshani, 2003).
For this study, we created a procedure specifically focused on evaluating VST-enabled HMDs, incorporating and adapting several methodologies to evaluate these devices into the five phases described below. We used a within-subjects design approach where all the participants in the evaluation performed various visual perception tests, user experience tasks, and subjective measures while wearing different HMDs. In the evaluation, we gather quantitative data through user performance across several visual perception tests and subjective measures. We also gather qualitative data through comments made during several user experience tasks and in an in-depth interview following the study. The quantitative and qualitative data will then be merged for a complete analysis of the VST solutions.
Participants were recruited through email, where the targets were employees from a large technology company who might be interested in exploring VST technologies. If interested in joining the study, the potential participant needed to complete the study eligibility form hosted online. The eligibility assessment form collects data on participant demographics, vision-related conditions (e.g., color blindness, night blindness, stereo blindness), the need for prescription glasses, medical conditions that may be impacted by 3D VR content, cybersickness susceptibility, and past experience with XR devices (AR, VR, VST, and gaming).
To qualify for the study, participants must meet the following criteria: 1) have normal or corrected-to-normal vision (eyeglasses or contact lenses are acceptable), 2) not experience color blindness, night blindness, or stereo blindness, 3) exhibit low susceptibility to motion sickness (MSSQ
• Motion Sickness Susceptibility Questionnaire (MSSQ) (Golding, 2006) helps to predict an individual’s susceptibility to experience motion sickness caused by a variety of stimuli in previous experiences as a child and adult, and it is used as a baseline in participant selection for the study. We only included participants with MSSQ scores under the 90th percentile (a score of 26.8), since participants with scores above this threshold have lower tolerance to motion and are highly susceptible to cybersickness, meaning they may not be capable of fully completing the study without severe symptoms related to motion sickness.
• XR Experience Score (Xexp) was constructed to evaluate each participant’s prior experience with Extended Reality (XR) devices in categories with and without head-mounted displays (Stanney et al., 2021): Virtual Reality, Augmented Reality, Video See-through (VST), and Gaming. The scale ranges from 0 to 24, with more experienced users scoring at the top range of the scale. To measure a participant’s proficiency in each modality, we used a four-point Likert Scale (Albaum, 1997) ranging from 0 (never experienced) to three (experienced more than 10 times). All experience modalities are then weighted and summed. Eq. (1) shows how the XR Experience Score is calculated: A defines a weight to the score for prior VR experience VR by first determining prior experience with VST technology. If a user rated prior VST experience greater than 1, the value of VR is multiplied by 4, otherwise, the value of VR is multiplied by 2. The prior experience score for AR (AR) has a weight of three and gaming experience (G) has a weight of 1. We then calculate XRexp by adding the weighted experiences for each XR modality.
Upon arrival, we introduced participants to the study goals and activities and then presented them with an informed consent form which asked for their signature. Participants then answered pre-study questions about medications taken on the study day, recent illnesses, sleep habits, and anxiety levels (see Supplementary Material S2), all factors that can affect how a user might respond to 3D content. If any of the responses do not pass the criteria, it can invalidate the data and impair the participant from proceeding with the study, therefore the test session can either be rescheduled or the user can be terminated with compensation. Finally, the researcher used a PD ruler1 to measure the interpupillary distance (IPD) of each participant.
The researcher introduced the participant to the visual perception tests and provided instructions on how to perform them. To mitigate practice effects and ensure the participant’s understanding, some of the tests were practiced at least five times each with no HMD using everyday vision (e.g., near and far depth perception, color discrimination, and latency). No measures were recorded during practice.
The participant performed all UX tasks for all VST conditions and all visual perception tests for all conditions, including a Control condition with no HMD (everyday vision). After completing all VST conditions, participants were asked to respond to the Simulator Sickness Questionnaire (SSQ) to measure cybersickness. Then, they rated the overall visual quality of the VST condition via a MOS. Finally, after completing all UX tasks and visual perception tests, we conducted an interview to collect qualitative data about the participant’s experience using VST for the tested HMD. This phase was repeated N times: one for the Control condition and N-1 VST conditions. The questions used in the post-HMD interview can be referred to in Supplementary Material S3.
• Simulator Sickness Questionnaire (SSQ) (Kennedy et al., 1993) evaluates the participant’s level of cybersickness and is given directly following all testing for each condition. The questionnaire asks participants to rate the severity of 16 symptoms of cybersickness on a four-point Likert scale ranging from none 0) to severe 3) across three categories: disorientation, oculomotor disturbance, and nausea. The total cybersickness score was calculated to determine the severity of cybersickness for each VST condition.
• Global Discomfort Scale (GDS) is a patient-defined 10-point Likert scale that is handled to the participant right after performing the tasks using an HMD. It asks the participant how they currently are feeling in the moment in levels of comfort before continuing with other conditions involving VST technology. The scale ranges from ‘No discomfort at all = 0′, to ‘Severe discomfort = 9’. If a participant scores higher than five on the scale, the study should be interrupted and continued on another day.
• Mean Opinion Score (MOS) (Streijl et al., 2016) is used to rate the visual quality of VST experienced by participants in each condition. The five-point Likert rating ranged from 1 (bad quality) to five (excellent quality), with five being equal to everyday vision with no HMD.
After completing all the VST conditions, each participant was asked to rank the VST HMDs based on their overall experience throughout the testing. The device(s) were ranked from their most preferred (score = 1) to their least preferred (score = 3). Finally, each participant was asked to justify their ranking, providing their impressions across VST conditions through a final interview.
The experiment was split into UX tasks and visual perception performance tests, in which both quantitative and qualitative data were gathered for the evaluation. Figure 1 shows the items used during the study.
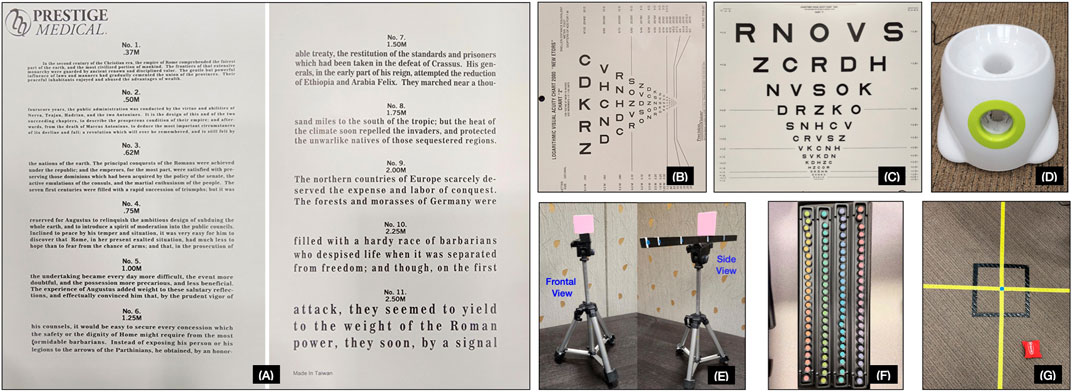
Figure 1. Tools used during the tasks. (A) Jaeger card for the subjective reading task. LogMAR ETDRS charts for (B) near visual acuity and (C) far visual acuity tests. (D) An automatic ball launcher for the latency test. (E) A custom-built platform for the near-depth perception test consisting of a tripod, a wooden ruler, and a flat square object. (F) A Farnsworth-Munsell 100 Hue Test for the color discrimination test. (G) A metered tape with a target on the floor and beanbags for the far-depth perception test.
Within each VST condition, the participant performed five tasks in a laboratory resembling an office-like setting. After each task, they were asked qualitative questions regarding their ability to perform each task and how they felt regarding the complexity, comfort, and visual ability while performing the task. The tasks explored the participant’s movement and organization, including spatial awareness, object manipulation, motor coordination, and sensory perception. It also involved writing and reading in different mediums, with activities associated with written communication, reading comprehension, and interacting with various mediums for written expression.
• Picking and placing objects: This task was adapted from Suznjevic et al. (2017) (Suznjevic et al., 2017) and required the participant to use natural physical movement, visual perception, and fine motor skills to locate, pick up, and place objects in specific locations of the laboratory. Objects like a tennis ball, sticky notes, or colored pens with specific characteristics such as texture and colors were used in this task.
• Read Jaeger Card: The Jaeger reading card (Khurana et al., 2014) has several sentence blocks in progressively smaller font sizes. The participant held the card 14 inches away from their face, aligning the text block with the VST cameras for best legibility, and then read aloud the smallest block of text they could see without straining their eyes.
• Writing and reading on paper: The participant wrote a sentence with a pen and a pencil on a white piece of paper, which appeared differently on the paper due to contrast and lighting conditions.
• Writing and reading on a smartphone: The participant held their smartphone with brightness and fonts set to their normal preferred setting, adjusted the device to find the best reading angle, and then read and typed a short text message. The participant first needed to find and correctly select the messaging application, then locate and select a message to read. After attempting to read the selected message, they then attempted to type a short message by first locating the phone keyboard and then typing the message. Finally, they were asked to read what they had typed and describe what they could see. Depending on the exposure of the VST camera(s), the phone’s brightness may have needed adjustment to better view the phone content.
• Writing and reading on a PC: The participant used a standard PC keyboard and LCD display monitor with brightness set to the middle setting. They first attempted to read a short sentence presented on a white background using the Notepad app on Windows PCs with the font set to Consolas, black color, size 12. They then attempted to type a short sentence by first locating the keyboard and then typing a sentence. Finally, they were asked to read what they had typed and describe what they could see. Depending on the exposure of the VST camera(s), the PC display’s brightness may have needed adjustment to better view the computer content.
For all conditions (all VST conditions and the Control condition), participants performed six quantitative visual perception tests. These tests included near and far visual acuity, near and far depth perception, color discrimination, and a motor skills test to measure how HMD latency impacted the UX.
• Far vision acuity (LogMAR ETDRS chart): This task assesses the clarity of vision for distant objects using a LogMAR ETDRS chart (Ferris III et al., 1982), which is a standardized visual acuity chart (Kaiser, 2009). The participant stood 12-foot (3.66 m) from the chart and, using both eyes, read each letter from left to right that they could see in each progressively smaller horizontal line. The number of correct letters was counted on each line, and the counting stopped when the participant could read less than two letters on a line. The total letter count was recorded, and the letter count at the test distance was then converted into a Snellen score. The original Snellen score is designed for use at a 20-foot (6-m) distance. Therefore, we adapted the Snellen fraction formula and adjusted the scores accordingly to our used distance (Ferris III et al., 1982).
• Near vision acuity (LogMAR ETDRS chart): Similar to far vision acuity, this task assesses the clarity of vision for near objects using a LogMAR ETDRS chart. The participant stood 40 cm from the chart and, using both eyes, read each letter from top to bottom that they could see in each progressively smaller vertical line. The number of correct letters was counted on each line, and the counting stopped when the participant could read less than two letters on a line. The total letter count was recorded, and the letter count at the test distance was then converted into a Snellen score.
• Far depth acuity (Blind throw test): This perception test was adapted from Pfeil et al. (2021) (Pfeil et al., 2021), and involved blindly throwing a beanbag towards a marked target placed 3 m away on the floor. The participants started by first focusing on the target for as long as they wished, then closed their eyes and tossed the beanbag towards the target. The participant was instructed to keep their hands outside of the field of view of the HMD before the toss to reduce inadvertent use of the hands to guide the throw, ensuring accurate far-depth estimation without visual cues. With their eyes still closed, the researcher measured the distance of the beanbag location relative to the target (in the Z direction, which is the depth dimension), then the beanbag was removed. This process was repeated five times, and the beanbag was removed from the floor before each throw so no feedback was conveyed to the participant, ensuring the independence of each throw.
• Near depth acuity (Blind reach): This perception test was adapted from Napieralski et al. (2011) (Napieralski et al., 2011) and Diaz et al. (2017) (Diaz et al., 2017) and involved blind parallel reaching to a flat target object placed on a platform ranging from 15 cm to 45 cm away from the participant’s forehead for the Control condition or from the HMD cameras for all VST conditions. Each participant attempted three reaches to the target placed at three out of five possible counterbalanced distances Sheehe (1961). The platform itself was 30 cm long, was aligned with the participant’s eye height, and was centered between the eyes for the Control condition or between the HMD cameras for all VST conditions to ensure no depth cues were conveyed, such as volume. The user started by focusing on the target as long as they wished, then closed their eyes, then used a pointer to point to the target’s location parallel to the platform. With their eyes still closed, the researcher measured the distance of the pointer location relative to the target (in the Z direction, which gives the depth error), and then the target object was removed. This process was repeated three times using three counterbalanced target distances across participants.
• Color discrimination (FM-100): The Farnsworth-Munsell 100 Hue Test2 (Farnsworth, 1943) from the brand Xrite was used to evaluate fine hue discrimination across the full-color spectrum. This test is commonly used to classify color discrimination skills and uses 85 colored caps in four trays with hues that vary by equal perceptual steps. The task requires the participant to organize a disordered arrangement of caps into the correct hue order, following a gradual color progression on a table. The arrangement should form a smooth sequential transition between two fixed hues, guided by two anchor caps placed at the ends of each tray. The Total Error Score (TES) quantifies the participant’s precision in arranging the caps. If caps are not positioned in order, the number of transpositions of the caps result in a higher TES. We obtained the resulting score from the arrangement of caps using the Farnsworth-Munsell software3 which accurately calculates deviations from the correct sequence resulting in a Total Error Score (TES) based in the original literature (Farnsworth, 1943). The software also produced the radial color plot later used for the results, that helps identify the color deficiencies across the spectrum. Due to test time considerations, participants were only tested on two out of the four total trays, with each tray displaying fine color variations between two hues on 22 colored caps. The two selected trays were counterbalanced using a Latin Square Sheehe (1961) across all participants to ensure testing across the full-color spectrum. Also, to mitigate learning effects for this task, we did not include the same tray used for practice prior to testing. The same two selected trays were used to test across each condition for a particular participant.
• Latency (Ball catch): To determine if VST system latency impacted the user experience, a ball catching test was devised that used an automated ball launcher that projects a small tennis ball towards the participant at two different speeds: ‘slow’ at 1.6 m/s and ‘fast’ at 2.5 m/s. The participant either knelt or stood 3 m away from the ball launcher and attempted to catch the ball five times each at two different speeds. During the Control condition, each participant established their baseline speed (‘slow’ or ‘fast’) for later comparison to VST conditions. If the participant could not perform at the fast speed, then the score for the slow speed was used as a baseline for comparison. The number of balls caught at each speed was recorded.
A total of 56 employees from a technology company completed the study eligibility assessment. None of the participants scored above the 90th percentile on the MSSQ, and two individuals were excluded due to color blindness. For this study, we aimed to achieve a balanced representation of participants across various factors, including age, gender, ethnicity, and varied MSSQ scores. Consequently, out of the 54 eligible respondents, we selected twenty participants who expressed interest in exploring VST technologies and had the availability to participate in the study. Participants included ten males and ten females sampled across age categories (Mean Age = 44.5 years, SD = 14.3 years) and ethnic backgrounds (Asian = 4, African American = 1, Hispanic = 5, Caucasian = 10) (see Table 1 for more details). Among these participants, 13 did not wear any prescription eyewear (glasses or contacts), one wore prescription glasses for farsightedness (hyperopia), three wore prescription glasses for nearsightedness (myopia), and three wore bifocals.
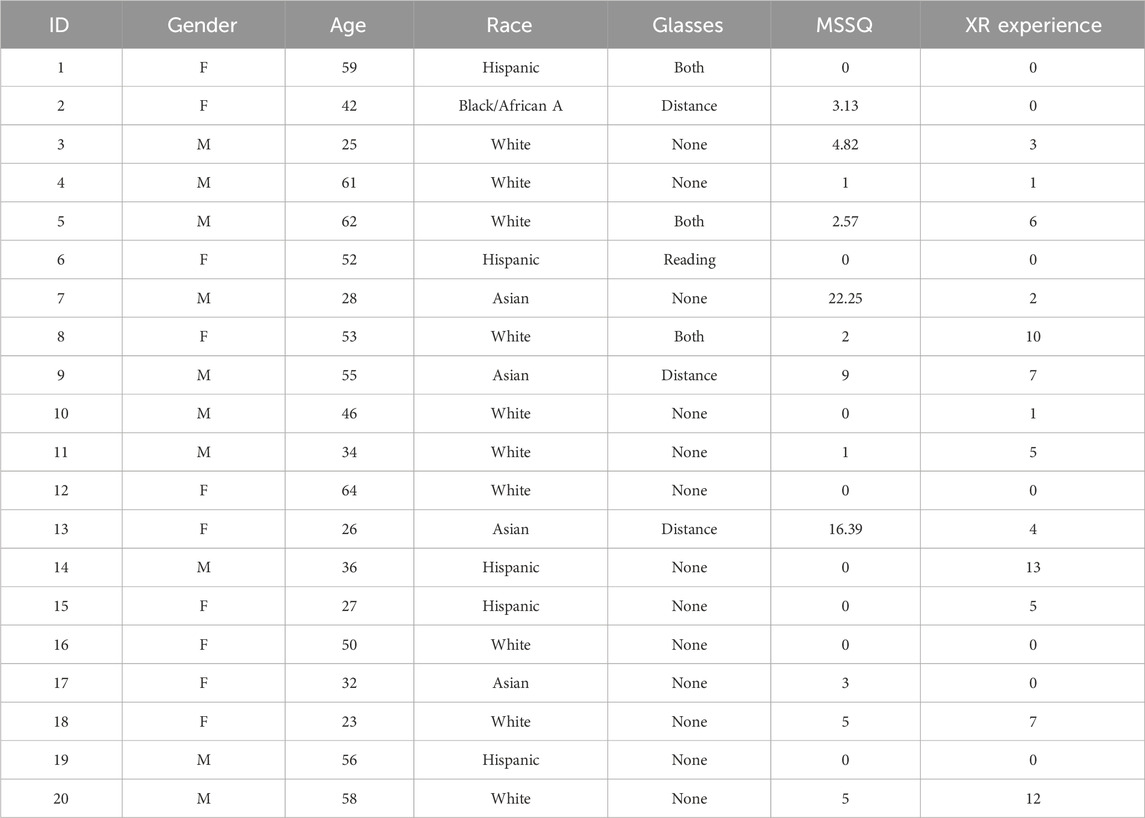
Table 1. Participants’ demographics. MSSQ scores are based on previous experiences with motion sickness as a child and as an adult. Participants’ proficiency with XR devices and HMDs would have higher scores for XR Experience.
The study was approved by the company’s ethics committee prior to its beginning. We explained the study’s purpose and tasks to participants, ensuring they understood their right to withdraw at any time. We asked participants to provide their written consent prior to the study to perform the evaluation and to take pictures of them while performing tasks. In appreciation of their participation, we provided compensation in the form of two movie tickets (equivalent to a $25.00 incentive). Each participant attended two meetings, each lasting 1.5 h, totaling 3 h over 2 days. The participants completed the study in a laboratory, simulating an in-office setting. To maintain participant confidentiality, the anonymity of all participants was guaranteed by not using their name and assigning a user identification number to all collected data, questionnaires, and forms. All the collected data was kept in a computer with restricted access to authorized personnel only.
This study evaluated three HMDs each with VST technology, totaling four conditions in which each participant performed all the above tasks: a) Control (no HMD); b) Prototype Device 1 (PD1); c) Prototype Device 2 (PD2); and d) Commercial Device 1 (CD1). For confidentiality purposes, the names and brands of the actual devices have been anonymized.
The study consisted of one ‘Control’ condition where tasks were performed in the real world and three conditions using HMDs in the VST mode (PD1, PD2, and CD1). The HMD devices were worn so the participant could view the real world from the viewpoint of the VST cameras, where the VST view will be compared to their natural view without an HMD (Control) to assess the quality of each VST solution. The PD1 and PD2 HMDs share similar technical features as shown in Table 1 below. Both HMDs have 6 MP passthrough cameras that operate at 90FPS and offer a resolution of 2160 × 2160 for each LCD display. Both have a fixed distance between lenses at 63 mm, and both HMDs weigh 650 g. The main difference between the HMDs is that PD1 has a horizontal field-of-view (FOV) of 80°, while PD2 offers a slightly narrower FOV of 62°. The different FOVs across devices would allow us to investigate if smaller FOV leads to less cybersickness across participants, as suggested by other researchers (Jerald, 2015).
The CD1 HMD has 12 MP passthrough cameras that operate at 90FPS and offers a resolution of 1920 × 1920 for each peripheral LCD display and 2880 × 2720 for each central foveated uOLED display. The distance between lenses auto-calibrates to each participant’s IPD within a range of 58mm–72 mm. The HMD weighs 1060 g and has a horizontal FOV of 115°. Table 2 describes the detailed technical specifications of all HMDs used in the study.

Table 2. Technical specifications of the four VR HMDs used in this study: PD1, PD2, and CD1.
The laboratory where the study was conducted resembles an office-like room with standard ambiance light (approximately 350 lux). The lab has resources that can be found in any office, such as a computer, desk, chair, paper, and various other items. We did not move any objects in the lab during data collection to maintain consistency, ensuring that any potential reference objects in the environment remained constant for all the conditions.
The present study employed a comprehensive data analysis approach, combining both qualitative and quantitative data from diverse sources. Qualitative data were gathered through in-depth interviews with study participants, and their subjective comments throughout the tasks were annotated for thematic analysis. This qualitative analysis involved generating thematic codes using the software Nvivo, providing more insights with added depth to the overall evaluation.
We conducted correlation analyses to explore potential relationships between different quantitative measures and components. Additionally, we integrated qualitative UX themes with quantitative measures to enhance the comprehensiveness of our evaluation. Data from online questionnaires were exported to.xls files and processed using Microsoft Excel. In the context of the present study, we used the Kolmogorov-Smirnov single sample distribution test (Berger and Zhou, 2014) to verify that the data were not normally distributed. Therefore we chose to analyze the data using the pairwise Wilcoxon signed-rank test (Keselman et al., 2002) and Friedman’s test for the non-parametric statistical tests. To mitigate the risk of type I errors, we applied the Bonferroni correction to all pairwise tests, with α being 0.05 divided by 6 (total comparisons across four conditions). Only for the pairwise comparisons for MOS Rating (Section 3.6.1) and Ranking (Section 3.6.2), the Bonferroni correction used α being 0.05 divided by 3.
For each of the 20 participants, the study was scheduled for 2 days, where only two conditions were tested at a time to mitigate cybersickness symptoms. The four conditions described above were counterbalanced across participants using a Latin Square Sheehe (1961), used to balance and reduce the time using XR devices, reducing cybersickness symptoms during and after the study and mitigating order effects. Additioinally, between the two VST conditions, we provided a 15-min pause in the study for the participant not wear any device to reduce cybersickness effects. All user experience tasks were performed before the visual perception tests so the participants’ subjective comments about device quality and satisfaction were not influenced by their performance on the visual perception tests. The perception tests were also counterbalanced using Latin Square Sheehe (1961) to reduce biases in the results. The participants spent on average 30 min in each VST condition while performing all user experience tasks and all visual perception tests. For the Control condition, participants performed only the visual perception tests to serve as a comparison to performance in the VST conditions. Additionally, if corrected vision was needed in the Control condition with either eyeglasses or contact lenses, participants continued to wear the corrected vision in all VST conditions. Figure 2 shows the participants during the experiment performing the tasks.
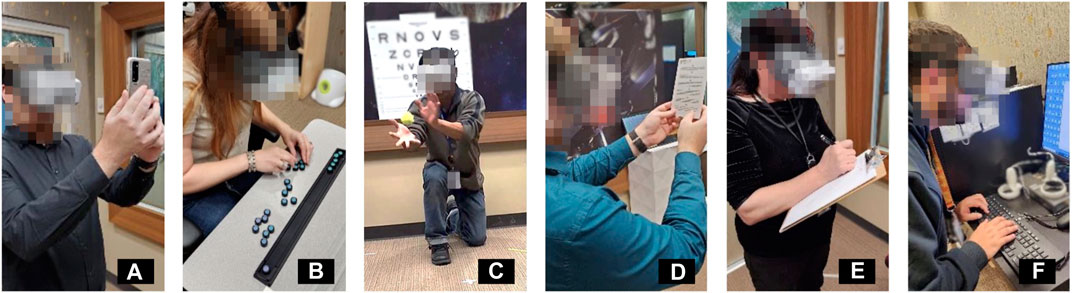
Figure 2. Participants during UX tasks and visual perception tests. (A) Participant reading on a smartphone. (B) Performing the color discrimination test. (C) Catching a ball during the latency test. (D) Reading the Jaeger card. (E) Writing on a piece of paper. (F) Typing on a computer. Participants and HMDs are blurred for confidentiality purposes.
We first introduce the quantitative results from the visual perception tests and subjective measures. We then perform a quantitative analysis of the variables pertaining to participants’ test performance. Throughout Sections 3.1–3.6, we report the descriptive statistics for each of the quantitative measures and significance analysis. The qualitative results from the interviews and comments during the UX tasks are then described in Section 3.7.
The results for visual acuity for far and near vision are shown in Figure 3, where the bar graph shows the mean of correct read letters for each test. The Snellen score McGraw et al. (1995) for normal vision at a 20-foot distance is 20/20, and the Control conditions for far and near vision were both close to that standard. The far vision Snellen score for Control was 20/21, with the mean total correct letters of 55.25 letters (SD = 6.47 letters). The near vision Snellen score for Control was 20/28, with the mean total correct letters of 60.7 letters (SD = 6.15 letters). The performance values of the Control condition served as a standard for comparison to the performance across the other VST conditions.
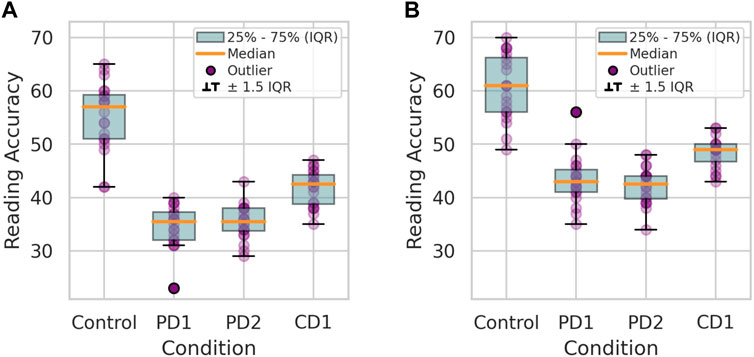
Figure 3. Visual Acuity Test Results: Mean number of correctly read letters on far vision (A) and near vision charts (B). Higher values indicate better performance.
For the far vision acuity test, the performance of the VST conditions ranked from highest to lowest were as follows: CD1 (Mean = 41.75 letters, SD = 3.44 letters), PD2 (Mean = 35.35 letters, SD = 3.31 letters), and PD1 (Mean = 34.65 letters, SD = 4.01 letters). When comparing the conditions PD1, PD2, and CD1 to the Control condition, it is noticeable that the use of VST resulted in significantly lower scores during the far vision acuity test (Friedman p < 0.001). The pairwise Wilcoxon test indicated no significant differences between PD1 and PD2. Additionally, there were significant differences between the performances of both prototype devices (PD1 and PD2) and CD1, (W = 0.0, p < 0.001).
For the near vision acuity test, the performance of the conditions ranked from highest to lowest as follows: CD1 (Mean = 48.4 letters, SD = 2.83 letters), PD1 (Mean = 43.3 letters, SD = 4.60 letters), and PD2 (Mean = 42.25 letters, SD = 3.55 letters). In this test, all VST conditions contributed to significantly lower scores (Friedman p < 0.001). Similar to the far-distance reading task, PD1 and PD2 showed no statistically significant differences. Also, both prototype devices showed significant differences with CD1: W = 10.0 and p < 0.001 for PD1, and W = 0.0 and p < 0.001 for PD2.
For the near-depth perception test, a comparative analysis of median target error was conducted across the Control and VST conditions (PD1, PD2, and CD1) using the Wilcoxon test. Table 3 shows the results of this analysis. The Control condition showed significant differences with PD1, PD2 and CD1 (Friedman p < 0.001). The conditions PD1, PD2 and CD1 did not show significant statistical differences between each other across all pairwise tests. The median error across all conditions was 2.00 cm for Control (SD = 4.18 cm), −2.00 cm for PD1 (SD = 3.52 cm), −2.25 cm for PD2 (SD = 4.01 cm), and −2.25 cm for CD1 (SD = 3.10 cm). Overall, the near-depth estimations for Control tended to overestimate the distances, while those for PD1, PD2, and CD1 tended to underestimate the distances, as shown in Figure 4. Also, PD1 demonstrated the best performance among the VST conditions. However, there were no statistically significant differences observed in the pairwise comparisons.
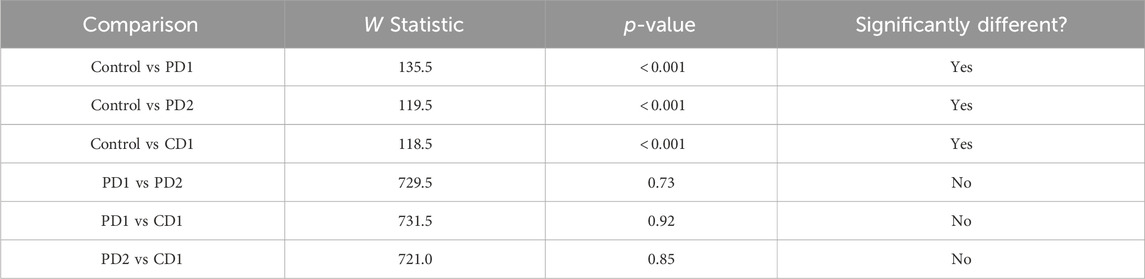
Table 3. Wilcoxon test results for near depth acuity.
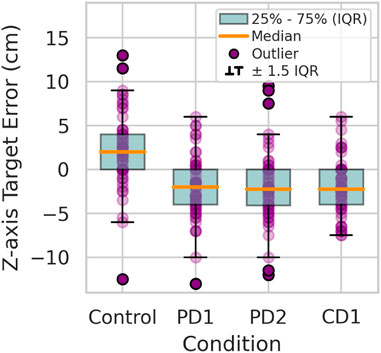
Figure 4. Distribution of target error for the near depth acuity task.
For the far-depth perception test, only the Z-axis was used for the depth error estimation Pfeil et al. (2021). Table 4 shows the results of the Wilcoxon analysis. The results show that all conditions demonstrated underestimation of the distances towards the main target, as seen in Figure 5, although no statistical significance across the conditions was found. We found the median error across all conditions to be −10.79 cm for Control (SD = 23.64 cm), −12.44 cm for PD1 (SD = 21.85 cm), −16.25 cm for PD2 (SD = 30.35 cm), and −12.82 cm for CD1 (SD = 34.07 cm). This systematic underestimation is consistent with prior findings in virtual and augmented reality Swan et al. (2015). PD1 demonstrated the best performance among the VST conditions. However, no statistically significant difference is observed.
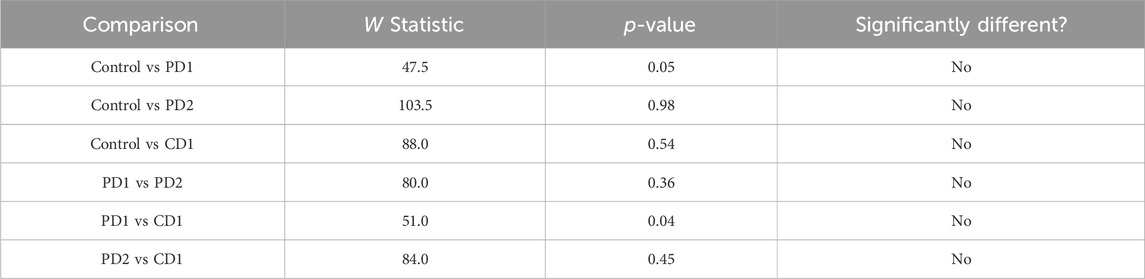
Table 4. Wilcoxon test results for far depth acuity.
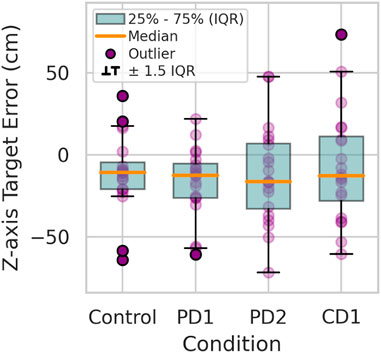
Figure 5. Distribution of target error for the far depth acuity task.
Performance on the Farnsworth-Munsell 100 Hue Test (FM-100), which measures color discrimination, is calculated as a Total Error Score (TES). The TES is calculated from the FM-100 scoring software tool provided with the colored caps set based on the number of color cap transpositions. While a standard TES is calculated using transpositions from all four color trays, an adjusted TES was calculated in our study since only two color trays were used during testing to minimize test time. The TES is categorized into three levels: superior (0 < TES < 20), average (20 < TES < 100), and low (TES > 100) Ghose et al. (2014). Additionally, older age is associated with a higher TES Kinnear and Sahraie (2002), where and the results obtained are near the expected average for age range of our participants. The Control condition had the lowest TES, and PD1 was the VST condition with the lowest TES (Figure 6). The mean TES for each condition was as follows: Control (M = 37.80 and SD = 23.12), PD1 (M = 46.6 and SD = 27.63), PD2 (M = 46.8 and SD = 22.67), and CD1 (M = 50.40 and SD = 26.06). No statistically significant differences were observed in the pairwise Wilcoxon comparison (Table 5). For Control condition, six participants were part of the superior category while 14 were in the average category. For VST conditions, PD1 had four participants, CD1 had three participants, and PD2 had two participants, all in the superior category. Only participant P20 demonstrated being in the low category in the CD1 condition, who has TES of 104.
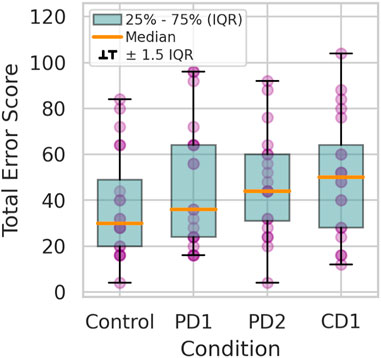
Figure 6. Distribution of TES for the color discrimination task.
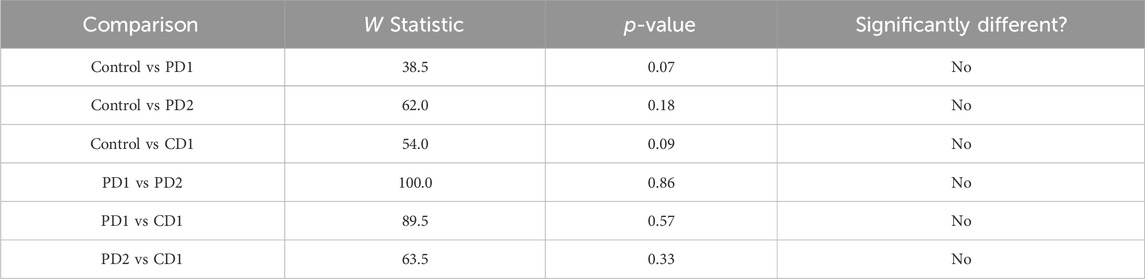
Table 5. Wilcoxon results for the color discrimination task.
Figure 7 (a), (b), and (c) presents radar charts for each condition, illustrating the mean error by hue. The colored traces represent each VST condition, and the light gray trace represents the Control condition. Despite the overall TES not exhibiting statistical significance across conditions, the charts offer insights into the hues where participants experienced greater errors. In the Control condition, participants encountered challenges in differentiating green-yellow hues. In condition PD1, participants struggled with distinguishing green tones and cyan-blue tones. The condition PD2 revealed errors in differentiating green, cyan-blue, and some yellow tones. The CD1 condition showed high errors in discriminating some yellow tones, blue-purple hues, and pink tones. These observations shed light on how the HMDs present specific color differences that led to higher errors among participants, especially in the blue-cyan hues.
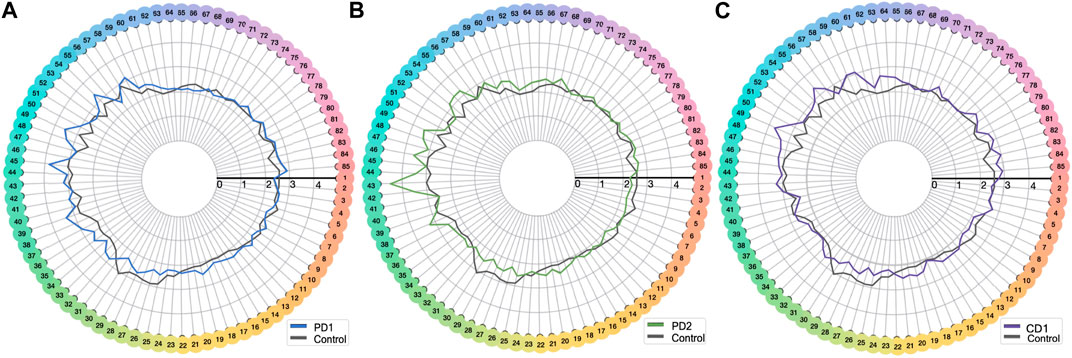
Figure 7. Hue error across participants in (A) PD1 vs Control, (B) PD2 vs Control, and (C) CD1 vs Control.
The performance of participants on the latency test is shown in Figure 8, where the mean number of balls caught by participants in their speed modality was used as a performance measure for each condition. Participants demonstrated the highest performance in the Control condition (Friedman p < 0.001) and the lowest performance in the CD1 condition (only significant when compared with the Control condition) (Table 6). Specifically, the median number of balls caught in the Control condition was four balls (M = 4.4 balls, SD = 0.59 balls); in PD1 it was 3.5 balls (M = 3.4 balls, SD = 1.18 balls); in PD2 it was three balls (M = 3.15 balls, SD = 1.53 balls), and in CD1 it was three balls (M = 2.95 balls, SD = 1.70 balls).
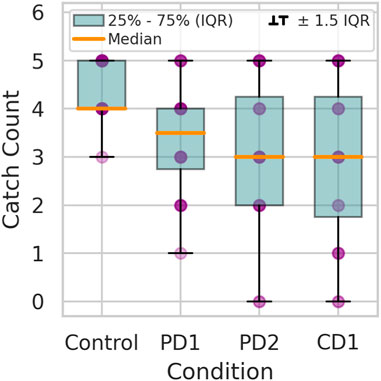
Figure 8. Distribution of total balls caught out of five attempts for each condition during the latency test.
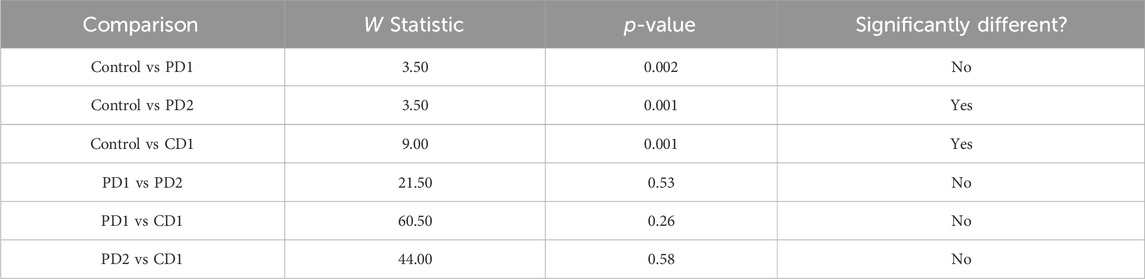
Table 6. Wilcoxon test results for latency task.
The results for the three conditions are shown in Figure 9, where all questions from the SSQ questionnaire are grouped into symptoms of Nausea (N), Oculomotor (O), and Disorientation (D). The median total SSQ score was 1.87 (SD 31.63) for the PD1 condition, 3.74 (SD 22.28) for the PD2 condition, and 16.83 (SD 22.02) for the CD1 condition. For the SSQ subscores, cybersickness in VST shows a D
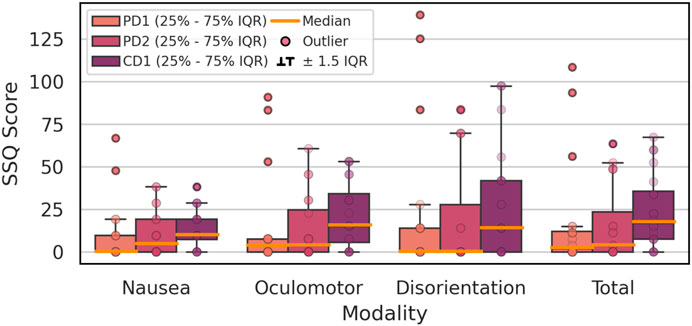
Figure 9. Cybersickness measures show the subscores for nausea, oculomotor, and disorientation, as well as the total scores by condition.
The total SSQ scores and disorientation symptoms both showed significant differences across the VST conditions (Friedman p = 0.04). In this case, CD1 had the highest total SSQ score and disorientation symptoms, while PD1 had the lowest total SSQ score and disorientation symptoms. However, these results showed no significance at the conservatively corrected alpha level for oculomotor (p = 0.12), nausea (p = 0.17), and disorientation (p = 0.04) symptoms. Although CD1 has higher median values compared to PD1 and PD2, this difference is not significant. These results identify PD1 and PD2 as exposing participants to ‘low’ cybersickness levels, while CD1 exposes participants to ‘moderate’ cybersickness levels Hale and Stanney (2014); Stanney et al. (2020).
After completing all the UX tasks and visual perception tests for each condition with VST, participants then rated the visual experience of the condition using a MOS ranging from one to 5, with five being equal to the visual experience without an HMD (i.e., normal vision). The rating of the participants on the comparison of each device with normal vision is shown in Figure 10. The mean MOS rating for each condition was as follows: PD1 (M = 3.09 and SD = 0.77), PD2 (M = 3.05 and SD = 0.74), and CD1 (M = 3.29 and SD = 0.71). Thus, condition CD1 resulted in the highest MOS rating, followed by PD1 and PD2 (Friedman p = 0.11). However, as shown in Table 7, the pairwise comparison indicates that none of the conditions differed significantly.
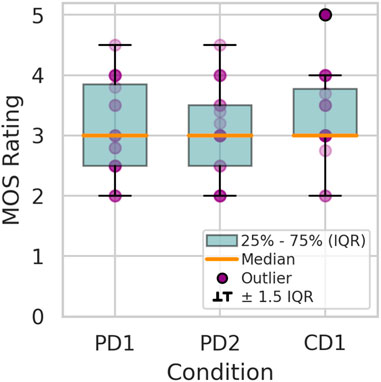
Figure 10. Distribution of Mean Opinion Score (MOS) rating.
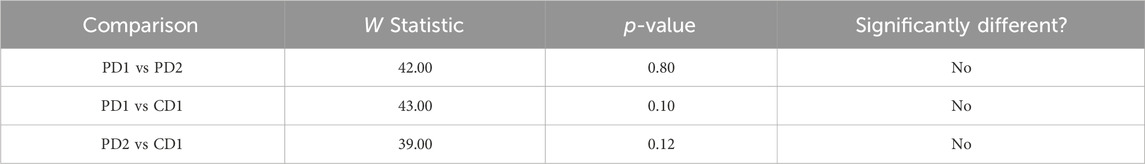
Table 7. Wilcoxon test results for MOS rating.
After all four conditions were tested (i.e., at the end of the entire study), each participant was asked to rank all three HMDs according to their subjective preference, from their least favorite (ranking = 3) to their primary choice (ranking = 1). This ranking (shown in Figure 11) was part of the subjective interview; therefore, the participants also included personal responses and qualitative comments to support their ranking (refer to Subsection 3.7). The mean ranking for each condition was as follows: PD1 (M = 2.25 and SD = 0.85), PD2 (M = 2.00 and SD = 0.65), and CD1 (M = 1.8 and SD = 0.95). Condition CD1 presented the best ranking (Friedman p = 0.35), followed by PD2 and PD1. However, despite these observed differences, the pairwise comparisons between the conditions did not yield statistically significant results, as shown in Table 8.

Figure 11. Device ranking distribution.
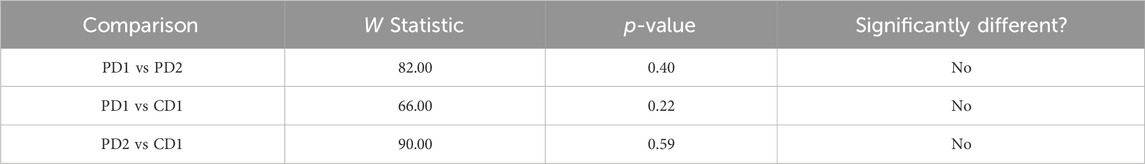
Table 8. Wilcoxon test results for device ranking.
The qualitative portion of the study involved analyzing the collection of interview quotes and extensive notes based on participants’ comments throughout the UX tasks. For the data analysis, we employed thematic analysis techniques Braun and Clarke (2006), Braun and Clarke (2019), which mainly followed an inductive coding approach. The initial coding of the transcripts was undertaken by a single researcher, ensuring a consistent and focused application of codes across the transcripts. During the analysis, the researcher individually read the transcripts and identified recurring ideas or patterns of ideas that emerged as themes. To ensure the analysis was strong and trustworthy, the initial results and themes set by the main coder were thoroughly checked and discussed by the research team, to confirm that the analysis accurately reflected the data and met the study’s objectives. We present below the themes identified in the analysis and quotes from participants during the experiment to give context to our research questions.
In total, each of the 20 participants generated three paragraphs of responses from the subjective interview and comments during the UX tasks for each condition, totaling 4,000 words distributed across 60 narratives. Through the segmentation achieved by the thematic analysis, we were able to extract 283 quotes that mirrored the participants’ perceptions of each VST solution across 12 distinct themes. Table 9 presents sample participant quotes corresponding to each identified theme for every condition. The emerged themes reflected general user perceptions when experiencing each HMD and also drew certain comparisons among the devices. User perceptions and comments during UX task performance for each condition were mapped to the many technical features unique to the HMD they were experiencing. These descriptions provided helpful observations about the limitations of the technology present in each VST solution, while also providing opportunities for improvement.
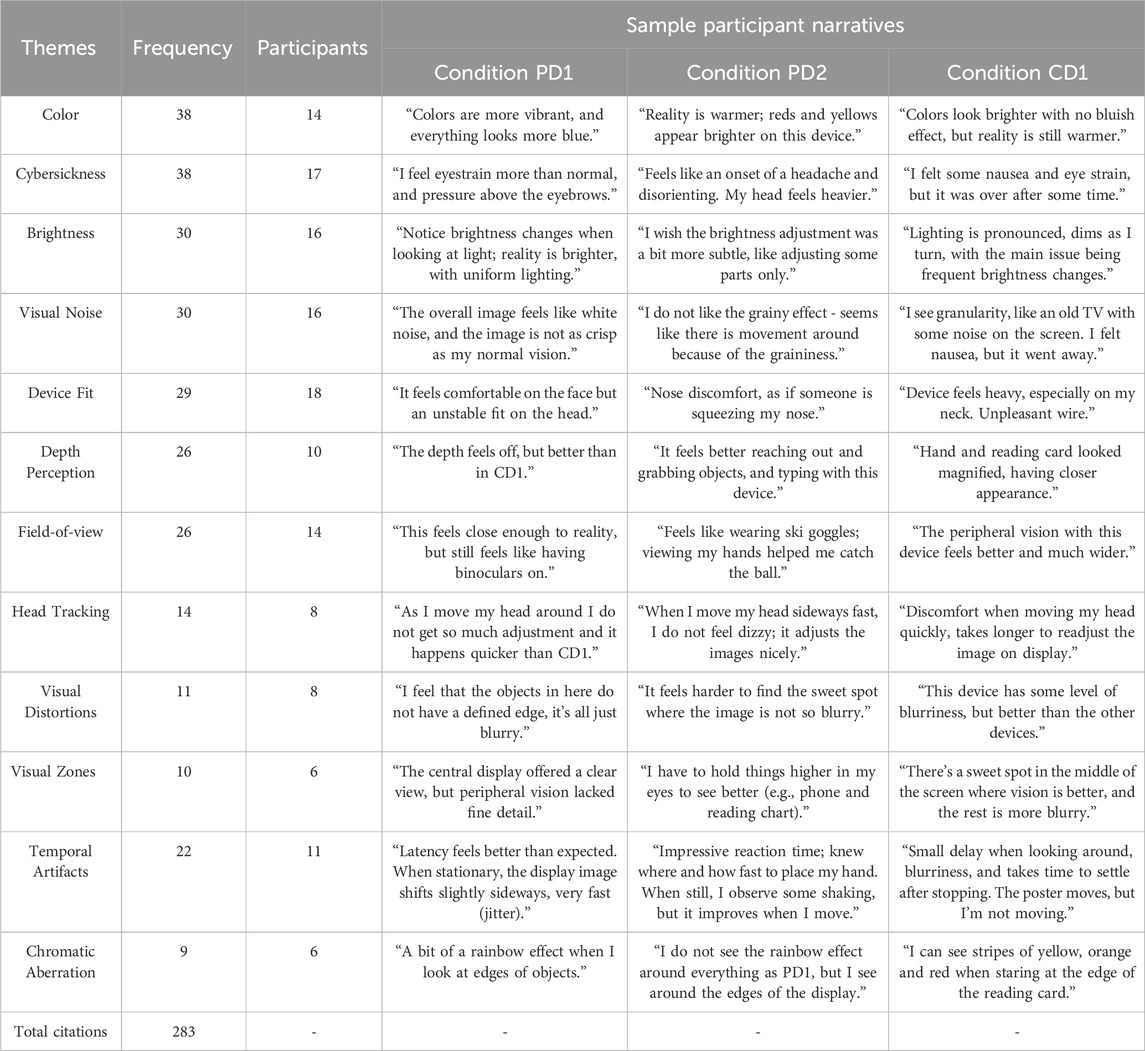
Table 9. User perceptions matrix for various video see-through head-mounted displays.
Participants expressed that all three conditions exhibited more cold tones overall when compared to real life, with the HMDs neutralizing yellow tones in the scenes. Among the citations, there was a consensus that both PD1 and PD2 had a more pronounced blue-toned view compared to CD1, which demonstrated a more natural neutralization of yellows. Additionally, for both PD1 and PD2, participants noted that red, green, yellow, and blue objects appeared brighter than normal. In contrast, this effect was not as pronounced for CD1 according to the comments. One participant mentioned that CD2 displayed colors that were ‘closer to normal,’ although there was a consensus that brown tones appeared more authentic with PD1 and PD2, while CD1 rendered browns with a somewhat grayer appearance.
Comments related to cybersickness varied among participants and across conditions. For Condition PD1, some participants with lower SSQ scores mentioned finding it easier to wear the device for an extended duration due to its greater adaptability and comfort for the eyes. Conversely, other participants reported feeling significantly more nauseous with PD1, citing symptoms such as heightened eyestrain, increased nausea, disorientation and a sensation of fullness in the head. In the case of PD2, fewer comments concerning symptoms were noted compared to the other conditions. Participants who experienced discomfort mentioned symptoms including nausea, head fullness, mild dizziness, headaches, and disorientation. Condition CD1 received the highest number of SSQ symptom citations, with participants reporting symptoms like nausea, eyestrain, dizziness, slight headaches, and a sensation of fullness in the head, mostly at slight to moderate levels.
In terms of brightness adjustment for both PD1 and PD2, participants shared common observations. They noted that the brightness adjustments were noticeable when transitioning between lighter and darker scenes. However, the consensus among participants was that the adjustment speed was comfortable and subtle. On the other hand, CD1 participants also noted the brightness adjustments, but they noticed a delay in the adjustment process and how the HMD needed to recalibrate more frequently compared to the prototypes. Some participants mentioned that this recalibration was sometimes distracting and would bother them during tasks.
Participants described the visual manifestation of display noise using terms like ‘grainy,’ ‘fuzzy,’ or ‘snowy’, where they compared these artifacts to the appearance of old cathode-ray tube display static or white noise. While most participants observed these noise patterns across all devices, PD1 and PD2 exhibited this artifact more prominently than CD1. There was a consensus that the noise became more noticeable when staring at darker colors, lower brightness areas or while staying motionless.
The assembly mechanisms of devices PD1 and PD2 involved adjustable straps, while CD1 featured a precision headband. Regarding fit, participants characterized PD1 and PD2 as lighter than CD1. They found these devices more comfortable for prolonged use due to the absence of a connected cable. However, some participants noted that PD1 and PD2 could feel tight on the nose. The effectiveness of the head straps depended on proper adjustments, as they could lead to discomfort if too loose or tight. On the other hand, participants described CD1 as relatively heavy to wear, mainly on the neck and during activities involving downward gazes. The cable was considered intrusive, limiting movement in certain tasks, but some participants found the headband more secure when holding the device in place.
Both PD1 and PD2 demonstrated potential for improvement in terms of depth, yet user satisfaction surpassed CD1. The participants noted that the depth perception was somewhat distorted, leading to a sensation of objects appearing closer than they should. Despite this, participants mentioned that they quickly adapted to these conditions. Participants also noted CD1 displayed objects closer than their actual distance, resulting in moments where they expected to grasp an item only to realize it was farther away. This sensation was more often mentioned while experiencing CD1 compared to PD1 and PD2, with participants frequently expressing frustration over the challenge of accurately reaching distances.
During the PD1 condition, most participants noted that the FOV felt reasonably close to reality, yet some mentioned having the sensation of ‘binocular vision’ or experiencing a ‘tunnel effect’. In the case of PD2, a greater number of comments concerning the FOV were observed. Participants frequently associated the experience with looking ‘through a box’, being more aware of black edges around the view, and described it as uncomfortable. Additionally, participants verbalized their frustration in not being able to see their hands to perform the study tasks adequately. For CD1 however, participants experienced an extended peripheral vision, resulting in a considerably wider view, which they verbalized as being more comfortable.
The 6dof head tracking technology in all the HMDs enables participants to track their position in 3-dimensional space. For PD1 and PD2, the head tracking technology is integrated within the device via the cameras and inertial measurement unit (i.e., inside-out tracking), while for CD1 head tracking requires several external infrared towers positioned in corners of the lab to triangulate the user’s position (i.e., outside-in tracking). In conditions PD1 and PD2, participants noticed very little latency and fast updates of the camera view according to their movements. In contrast, participants experiencing CD1 often complained about the latency of the camera view to correctly update and focus after they moved, which was especially noticeable when they moved their heads quickly.
For PD1 and PD2 conditions, participants reported seeing blurry or double vision. Their descriptions expressed how external objects lacked well-defined shapes and how much harder it was to read in these conditions compared to the Control condition. Meanwhile, condition CD1 was perceived as more visually clear, allowing participants to read more easily than the other HMD conditions and view the environment with more definition. However, participants still expressed a level of blurriness.
Across all VST conditions, participants recognized that the central view of the display had better image definition, while the periphery appeared more blurry or even pixelated. For conditions PD1 and PD2, participants would intentionally place any object related to their task in the center of their view and overall agreed that the transition between the central view and the peripheral view was smooth. However, participants stated in the CD1 condition that the central, higher definition view appeared wider than the other conditions. They also verbalized that the transition between the higher definition central view and lower definition peripheral view was ‘too sudden’, meaning they could easily see the edges between the two views. Also, we noted that although CD1 had better visual definition, participants needed to purposely stop moving so the central view could render well and deliver a higher quality view, while they noted that this effect was more natural with PD1 and PD2.
In PD1 and PD2 conditions, participants noted the presence of artifacts (e.g., jitter and flicker) when they were not in motion, describing the view as a sideways movement or as objects appearing as if they were shaking. Despite these artifacts, both devices provided a sense of real-time (low latency) operation without apparent lag. There was reduced occurrence of these artifacts in CD1, but the camera view and focus latency/lag during user motion was more commonly reported as an issue.
Chromatic aberration introduces color artifacts caused by the HMD’s lenses, failing to focus all colors to the same point. Participants noticed it across all VST conditions but with varied frequencies: in PD1 and CD1, it was seen when looking at straight lines and objects with a defined edge. In PD2, participants noticed this less than the other conditions when viewing the same objects. However, many participants verbalized that they could see a blue stripe in the lower part of the display, which they described as distracting, possibly caused by the reduced FOV.
This study used qualitative and quantitative data to evaluate video see-through HMDs. The convergence of the data in the evaluation brings insights about each HMD’s technical factors that influence image quality and usability, user performance, and user satisfaction. This evaluation demonstrated how VST devices benefit from a mixed methods approach and what factors had more impact on user satisfaction than others. Based on the subjective comments during the qualitative portion of the study, most participants showed some satisfaction with the VST technology across all devices. However, there were preferences in different areas across groups of participants. The participants described the technical differences among the three HMDs during the interviews. Even participants with less experience were capable of explaining these differences informally. An image sample from all three prototypes is shown in Figure 12. Since we could not capture the ground truth reference images at the target eye view, we provided the closest segments from the camera views as a visual reference.
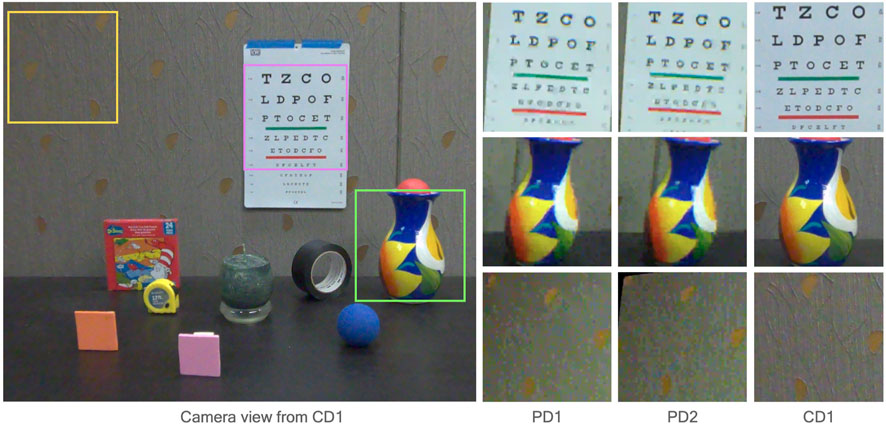
Figure 12. Qualitative comparisons of the camera view from PD1, PD2 and CD1. Differences in image noise, camera distortion and definition are shown in each condition.
Regarding visual quality, we observed that the PD1 and PD2 devices exhibited a higher presence of blue tones, similar to a cold temperature filter. In contrast, the CD1 system presented more neutral tones, but none of the devices rendered the warmer tones well, commonly experienced in the Control condition. Overall, all systems displayed brighter colors. Despite CD1’s slightly poorer performance in the color discrimination task, participants preferred it due to its more realistic representation of color. When assessing participants’ perceptions of the brightness adjustments in the HMDs, PD1 and PD2 outperformed CD1. Participants perceived the brightness adjustments in the prototype devices as more natural and consistent. In contrast, brightness transitions in CD1 appeared too frequently and caused some degree of distraction among participants when performing tasks. Several experienced participants with VST technology (N = 4) noted chromatic aberration across devices, mostly when looking at edges and objects with straight lines. In this case, CD1 performed the best with fewer comments about this effect.
The visual disturbances in the devices, such as noise, double vision, blurriness, and effects due to camera resolution, had more implications for the participants’ performance on tasks that involved reading and typing/writing. PD1 and PD2 had more comments regarding the level of blurriness when compared to CD1. Due to this issue, CD1 outperformed the prototypes significantly on the reading tasks and far and near visual acuity tests. This could be explained by the display and camera differences across the devices, where PD1 and PD2 had only an LCD binocular display and 6 MP cameras, while CD1 had an LCD binocular display and a high resolution (foveated) central OLED display as well as higher resolution 12 MP cameras.
There were common comments regarding image graininess across devices, especially when staring at darker areas, which had graininess intensified. Regarding differences in visual zones, participants noted that they experienced smoother visual differences between central and peripheral vision with PD1 and PD2 than with CD1. This was likely due to both PD1 and PD2 having a small optical center on the lenses, while CD1 had a dedicated foveated display for displaying high-definition central view. In contrast, CD1 presented more frequent auto-focus changes as participants moved their heads around the lab, which they described as distracting and problematic. The constant auto-focus in CD1 relates to the focal length of the device. In PD1 and PD2, the fixed focal length has no custom refocusing, while CD1 follows a range from 40 cm to 5 m, which will change based on the participant’s gaze direction. The discomfort caused by the frequent auto-focus is consistent with the literature, which indicates that dynamic focal length is prone to cause more discomfort over time Cao et al. (2018).
For the temporal issues found across devices, participants reported latency in image focus when moving, display flicker, and jitter. They mentioned that CD1 had a longer delay for focusing and a sensation that the device had lag when updating the display’s view during head motion. Still, participants experienced fewer occurrences of display artifacts with CD1 when stationary. Meanwhile, participants experienced more display artifacts with PD1 and PD2 when stationary, but noticed that it rendered the display view faster during user motion, such that lag was not noticeable. Since PD1 and PD2 are standalone devices with all processing occurring within the HMD, it is possible that this enabled some advantages such as reduced frame lag during user motion. However, visual artifacts were especially noticeable when stationary due to reduced camera resolution on these devices. In contrast, CD1 is not a standalone device, requiring an external CPU and GPU installed in a computer for graphics rendering, which may have introduced transmission delays noticed as frame lag during user motion. However, the high-resolution display and camera likely reduced the presence of visual artifacts when stationary. The scene lag noticed by participants experiencing CD1 correlates with their performance during the latency task, where the average balls caught in PD1 and PD2 were higher than for CD1, although the effect was small.
Participants commented that depth perception for PD1 and PD2 seemed better than CD1. Participants described being more adapted and more aware of where external objects appeared. However, for CD1 participants mentioned that external objects appeared to be much closer than they actually were and commented how noticeable the depth difference was. These comments are consistent with the performance during the near and far depth perception tests, although there were no significant differences across the medians. Participants also noted CD1 had a wider FOV than PD1 and PD2, with the view of PD1 and PD2 described as ‘viewing with binoculars’ or ‘seeing through a box’, respectively. These comments were made when participants realized they could not easily view their hands, and needed them to comfortably perform tasks, such as the color-discrimination test and the ball-catching latency test. Some participants preferred having their view more limited (as in PD1 with 80°, and PD2 with 62°), and others preferred more immersion of the scene with the wider FOV from CD1 of 115°. Researchers have found that a wider FOV is related to increased immersion in VR but also correlates with increased cybersickness (SSQ scores) across participants Ramaseri Chandra et al. (2022). In this study, the same rule applies to VST devices, where participants experienced moderate cybersickness when using CD1, and experienced low cybersickness when using PD1 and PD2. The main factors that contributed to cybersickness with PD1 and PD2 were related to the blurriness and temporal artifacts that added noise, distortions and jitter to the display. The symptoms reported by participants using CD1 are a combination of wider FOV, device weight and head pressure, 6dof head tracking lag and distortions, and auto-exposure lag. There were no statistically significant correlation with participants’ IPD and the levels of cybersickness experienced in this study.
Participants also reported being unsatisfied with the weight of CD1 and the long cable that was required for it to function, which limited their movements and was challenging to use for extended periods. They also considered PD1 and PD2 more comfortable to wear for longer periods of time and easier to navigate around the lab to perform tasks, although proper adjustments of the head straps did influence how well the fit was perceived. Regarding how each VST condition compared to normal vision without an HMD as reflected in the MOS rating, CD1 had the highest rating across the devices, followed by PD1 and PD2 with nearly the same rating. Finally, from the results summarized in Table 10, participants considered the positive and negative aspects of each VST solution before making their preferences for the overall device ranking. The majority ranked device CD1 as the most preferred (N = 11), followed by PD1 (N = 5) and PD2 (N = 4). Neither the MOS rating nor device ranking differences were statistically significant between devices. Among the seven participants who chose CD1 as their least preferred VST solution, three had cybersickness scores at a high level (above 33.3), two at a moderate level (between 15.5 and 20.1), and two at a low level (below 15.5). This highlights the possibility that increased cybersickness and discomfort from the device may have guided their choices. All participants had a novice level of experience with XR (score below 8). No gender or age effects were significant in the ranking. Still, it is useful to note what features were most critical to participants when evaluating each device’s visual quality and deciding on preference.
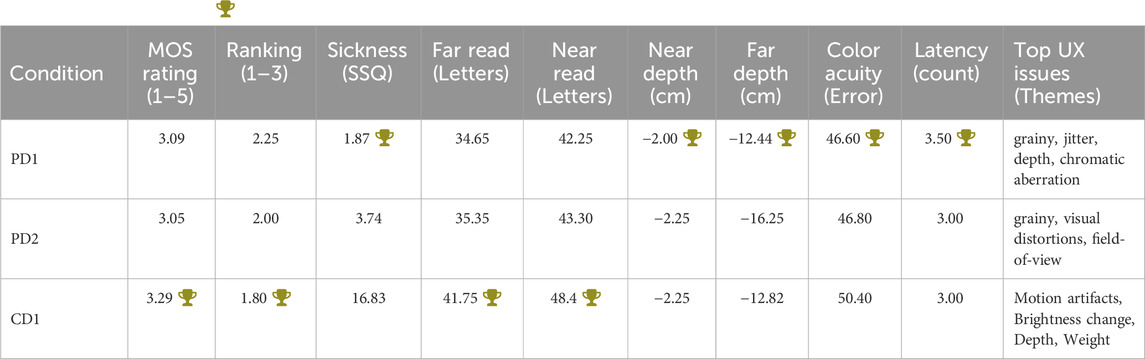
Table 10. Results summary ( : winner condition).
In summary, this mixed-methods evaluation demonstrates that visual perception performance measures alone do not fully capture the quality of a product. Subjective measures and qualitative data add rigor, especially when evaluating a technology involving multiple devices. The methodology presented in this paper shows that performance metrics alone inform only a limited view of the capabilities of a device. When combining performance metrics with qualitative interviews, it provided rigorous detail that can inform technical improvements needed in such devices. For example, even though PD1 performed slightly better in several tasks, some factors were more critical than task performance itself and had more weight when users decided that the device CD1 was preferred for long-term use.
When assessing how comprehensive our evaluation was, we found that while performance metrics themselves are important to show the user’s ability to perform tasks, they were not reflective of the experience and preferences of the users. The quantitative data gathered from the user performance allowed us to numerically compare the different devices across several tasks, but did not showed significant variations between devices. On the other hand, the qualitative data gathered during the study provided more depth of information that were true to the user experience, giving much more insights into the users preferences, discomforts, and more information on areas for improvements on the devices that were not seen during the quantitative measures.
The most significant limitation of our study is that our evaluation was restricted to a controlled UX laboratory environment. Further studies may include indoor investigations incorporating participants’ current workspace. Additionally, it was unfeasible to conduct outdoor assessments with the current technical limitations of the devices we tested, particularly given the challenges posed by the tethered PC, 6DOF head tracking towers, and auto-exposure limitations of CD1. Furthermore, as part of our future work, we plan on incorporating a broader range of commercial devices for such evaluations. Since we were concerned about prolonged HMD use, which could lead to significant cybersickness symptoms, we limited the number of devices we evaluated in this study to reduce the total time participants spent in VST. Also, because participants were company employees, additional constraints on time availability and coordination of schedules were required for a within-subjects approach, which suggests that future studies should also incorporate a power analysis to assess the effects on sample size.
In addition to these considerations, our future implementation plans involve facilitating multiple quick comparisons between devices, which may need an even more controlled testing environment. This would involve having a custom-built platform with the HMDs placed at a fixed height and positioning, where the participants would constantly switch between devices for a more comprehensive evaluation of visual distinctions between HMDs. Furthermore, evaluating interactions with virtual content should be considered in future research to better understand how VST solutions compare to OST in terms of interaction, object occlusion, and content fidelity and discover how different methods of mixed reality content projection might benefit and challenge users.
This study presents a novel mixed-methods evaluation approach to assess visual perception and user satisfaction in HMDs using VST technology. We created a comprehensive evaluation framework by combining a range of metrics from previous studies in VR, AR, and VST. This involved visual perception performance tests, user experience tasks, and subjective questionnaires. Our within-subjects study in a controlled environment involved 20 participants using three different HMDs with VST and one Control condition without HMD. The methodology offered a more detailed view of HMDs in various contexts by integrating 1) qualitative insights from UX tasks related to spatial awareness, object manipulation, and sensory perception and 2) quantitative measures from visual perception performance tests, including visual acuity, depth perception, color discrimination, and motor skills.
Our findings reveal significant influences of the HMDs’ technical specifications on visual quality, performance, and user satisfaction, enriching our understanding through both qualitative and quantitative perspectives. Also, user preferences and perceptions highlight the necessity for a nuanced evaluation approach beyond performance metrics alone, providing insights contributing to the enhancement of VST technology by addressing specific technical features for improvement. Participants preferred CD1 for visual quality (N = 11/20) despite its lower performance in many of the quantitative subcategories we evaluated.
Overall, this mixed-methods evaluation has helped identify design flaws in VST technology, which, when addressed, can significantly enhance the adoption of VST in Extended Reality (XR) applications. By showcasing the benefits of this comprehensive approach, this study contributes to a deeper understanding of VST technology and sets a foundation for future research in XR, emphasizing the value of integrating qualitative and quantitative perspectives for a more accurate evaluation.
The raw data supporting the conclusion of this article will be made available by the authors, without undue reservation.
The studies involving humans were approved by Ethics Committee Board from Qualcomm Technologies. The studies were conducted in accordance with the local legislation and institutional requirements. The participants provided their written informed consent to participate in this study. Written informed consent was obtained from the individual(s) for the publication of any potentially identifiable images or data included in this article.
JDS: Conceptualization, Data curation, Formal Analysis, Funding acquisition, Investigation, Methodology, Project administration, Resources, Software, Supervision, Validation, Visualization, Writing–original draft, Writing–review and editing. RT: Conceptualization, Data curation, Formal Analysis, Funding acquisition, Investigation, Methodology, Project administration, Resources, Software, Supervision, Validation, Visualization, Writing–original draft, Writing–review and editing.
The author(s) declare that financial support was received for the research, authorship, and/or publication of this article. We would like to acknowledge that this research received no external funding.
We are thankful to the study participants who patiently participated and completed all study stages.
The authors declare that the research was conducted in the absence of any commercial or financial relationships that could be construed as a potential conflict of interest.
All claims expressed in this article are solely those of the authors and do not necessarily represent those of their affiliated organizations, or those of the publisher, the editors and the reviewers. Any product that may be evaluated in this article, or claim that may be made by its manufacturer, is not guaranteed or endorsed by the publisher.
The Supplementary Material for this article can be found online at: https://www.frontiersin.org/articles/10.3389/frvir.2024.1368721/full#supplementary-material
1Pioway PD-668 PD Ruler (Centrometer), http://pioway.com/pd-668.htm
2Farnsworth Munsell 100 Hue Test, https://www.xrite.com/categories/visual-assessment-tools/fm-100-hue-test
3Farnsworth-Munsell 100 Hue Scoring Software, https://www.xrite.com/categories/visual-assessment-tools/fm-100-hue-scoring-system
Albaum, G. (1997). The likert scale revisited. Mark. Res. Soc. J. 39, 1–21. doi:10.1177/147078539703900202
Alnagrat, A. J. A., Ismail, R. C., and Idrus, S. Z. S. (2021). “Extended reality (xr) in virtual laboratories: a review of challenges and future training directions,” in Journal of Physics: Conference Series (Paris, France: IOP Publishing), 012031.
Berger, V. W., and Zhou, Y. (2014) Kolmogorov–smirnov test: overview. Wiley statsref: Statistics reference online.
Braun, V., and Clarke, V. (2006). Using thematic analysis in psychology. Qual. Res. Psychol. 3, 77–101. doi:10.1191/1478088706qp063oa
Braun, V., and Clarke, V. (2019). Reflecting on reflexive thematic analysis. Qual. Res. Sport, Exerc. Health 11, 589–597. doi:10.1080/2159676x.2019.1628806
Buker, T. J., Vincenzi, D. A., and Deaton, J. E. (2012). The effect of apparent latency on simulator sickness while using a see-through helmet-mounted display: reducing apparent latency with predictive compensation. Hum. factors 54, 235–249. doi:10.1177/0018720811428734
Cao, Z., Jerald, J., and Kopper, R. (2018). “Visually-induced motion sickness reduction via static and dynamic rest frames,” in 2018 IEEE conference on virtual reality and 3D user interfaces (VR) (IEEE), 105–112.
Çöltekin, A., Lochhead, I., Madden, M., Christophe, S., Devaux, A., Pettit, C., et al. (2020). Extended reality in spatial sciences: a review of research challenges and future directions. ISPRS Int. J. Geo-Information 9, 439. doi:10.3390/ijgi9070439
Condino, S., Carbone, M., Piazza, R., Ferrari, M., and Ferrari, V. (2019). Perceptual limits of optical see-through visors for augmented reality guidance of manual tasks. IEEE Trans. Biomed. Eng. 67, 411–419. doi:10.1109/tbme.2019.2914517
Creswell, J. W., and Clark, V. L. P. (2017) Designing and conducting mixed methods research. Thousand Oaks, California: Sage publications.
Diaz, C., Walker, M., Szafir, D. A., and Szafir, D. (2017). “Designing for depth perceptions in augmented reality,” in 2017 IEEE international symposium on mixed and augmented reality (ISMAR) (IEEE), 111–122.
Eftekharifar, S., Thaler, A., Bebko, A. O., and Troje, N. F. (2021). The role of binocular disparity and active motion parallax in cybersickness. Exp. brain Res. 239, 2649–2660. doi:10.1007/s00221-021-06124-6
Farnsworth, D. (1943). The farnsworth-munsell 100-hue and dichotomous tests for color vision. JOSA 33, 568–578. doi:10.1364/josa.33.000568
Fernandes, A. S., and Feiner, S. K. (2016). “Combating vr sickness through subtle dynamic field-of-view modification,” in 2016 IEEE symposium on 3D user interfaces (3DUI) (IEEE), 201–210.
Ferris III, F. L., Kassoff, A., Bresnick, G. H., and Bailey, I. (1982). New visual acuity charts for clinical research. Am. J. Ophthalmol. 94, 91–96. doi:10.1016/0002-9394(82)90197-0
Freiwald, J. P., Katzakis, N., and Steinicke, F. (2018). “Camera time warp: compensating latency in video see-through head-mounted-displays for reduced cybersickness effects,” in Proceedings of the 24th ACM symposium on virtual reality software and technology, 1–7.
Gallagher, M., and Ferrè, E. R. (2018). Cybersickness: a multisensory integration perspective. Multisensory Res. 31, 645–674. doi:10.1163/22134808-20181293
Ghose, S., Parmar, T., Dada, T., Vanathi, M., and Sharma, S. (2014). A new computer-based farnsworth munsell 100-hue test for evaluation of color vision. Int. Ophthalmol. 34, 747–751. doi:10.1007/s10792-013-9865-9
Golafshani, N. (2003). Understanding reliability and validity in qualitative research. Qual. Rep. 8, 597–607. doi:10.46743/2160-3715/2003.1870
Golding, J. F. (2006). Predicting individual differences in motion sickness susceptibility by questionnaire. Personality Individ. Differ. 41, 237–248. doi:10.1016/j.paid.2006.01.012
Gruen, R., Ofek, E., Steed, A., Gal, R., Sinclair, M., and Gonzalez-Franco, M. (2020). “Measuring system visual latency through cognitive latency on video see-through ar devices,” in 2020 IEEE Conference on Virtual Reality and 3D User Interfaces (VR) (IEEE), 791–799.
Hale, K. S., and Stanney, K. M. (2014) Handbook of virtual environments: design, implementation, and applications. United States: CRC Press.
Jerald, J. (2015) The VR book: human-centered design for virtual reality. New York: Morgan & Claypool.
Kaiser, P. K. (2009). Prospective evaluation of visual acuity assessment: a comparison of snellen versus etdrs charts in clinical practice (an aos thesis). Trans. Am. Ophthalmol. Soc. 107, 311–324.
Kemeny, A., Chardonnet, J.-R., and Colombet, F. (2020). “Getting rid of cybersickness,” in Virtual reality, augmented reality, and simulators.
Kennedy, R. S., Lane, N. E., Berbaum, K. S., and Lilienthal, M. G. (1993). Simulator sickness questionnaire: an enhanced method for quantifying simulator sickness. Int. J. Aviat. Psychol. 3, 203–220. doi:10.1207/s15327108ijap0303_3
Keselman, H., Cribbie, R. A., and Wilcox, R. R. (2002). Pairwise multiple comparison tests when data are nonnormal. Educ. Psychol. Meas. 62, 420–434. doi:10.1177/001316402128774888
Khurana, A., Khurana, A. K., and Khurana, B. (2014) Theory and practice of optics and refraction. Elsevier India.
Kim, Y. M., Rhiu, I., and Yun, M. H. (2020). A systematic review of a virtual reality system from the perspective of user experience. Int. J. Human–Computer Interact. 36, 893–910. doi:10.1080/10447318.2019.1699746
Kinnear, P. R., and Sahraie, A. (2002). New farnsworth-munsell 100 hue test norms of normal observers for each year of age 5–22 and for age decades 30–70. Br. J. Ophthalmol. 86, 1408–1411. doi:10.1136/bjo.86.12.1408
Li, Z., Cui, Y., Zhou, T., Jiang, Y., Wang, Y., Yan, Y., et al. (2022). “Color-to-depth mappings as depth cues in virtual reality,” in Proceedings of the 35th annual ACM symposium on user interface software and technology, 1–14.
Maruhn, P., Schneider, S., and Bengler, K. (2019). Measuring egocentric distance perception in virtual reality: influence of methodologies, locomotion and translation gains. PloS one 14, e0224651. doi:10.1371/journal.pone.0224651
McCauley, M. E., and Sharkey, T. J. (1992). Cybersickness: perception of self-motion in virtual environments. Presence Teleoperators Virtual Environ. 1, 311–318. doi:10.1162/pres.1992.1.3.311
McGraw, P., Winn, B., and Whitaker, D. (1995). Reliability of the snellen chart. Bmj 310, 1481–1482. doi:10.1136/bmj.310.6993.1481
Napieralski, P. E., Altenhoff, B. M., Bertrand, J. W., Long, L. O., Babu, S. V., Pagano, C. C., et al. (2011). Near-field distance perception in real and virtual environments using both verbal and action responses. ACM Trans. Appl. Percept. (TAP) 8, 1–19. doi:10.1145/2010325.2010328
Pfeil, K., Masnadi, S., Belga, J., Sera-Josef, J.-V. T., and LaViola, J. (2021). “Distance perception with a video see-through head-mounted display,” in Proceedings of the 2021 CHI Conference on Human Factors in Computing Systems, 1–9.
Ramaseri Chandra, A. N., El Jamiy, F., and Reza, H. (2022). A systematic survey on cybersickness in virtual environments. Computers 11, 51. doi:10.3390/computers11040051
Rokhsaritalemi, S., Sadeghi-Niaraki, A., and Choi, S.-M. (2020). A review on mixed reality: current trends, challenges and prospects. Appl. Sci. 10, 636. doi:10.3390/app10020636
Sahm, C. S., Creem-Regehr, S. H., Thompson, W. B., and Willemsen, P. (2005). Throwing versus walking as indicators of distance perception in similar real and virtual environments. ACM Trans. Appl. Percept. (TAP) 2, 35–45. doi:10.1145/1048687.1048690
Sheehe, P. R., and Bross, I. D. J. (1961). Latin squares to balance immediate residual, and other order, effects. Biometrics 17, 405–414. doi:10.2307/2527834
Somrak, A., Humar, I., Hossain, M. S., Alhamid, M. F., Hossain, M. A., and Guna, J. (2019). Estimating vr sickness and user experience using different hmd technologies: an evaluation study. Future Gener. Comput. Syst. 94, 302–316. doi:10.1016/j.future.2018.11.041
Stanney, K., Lawson, B. D., Rokers, B., Dennison, M., Fidopiastis, C., Stoffregen, T., et al. (2020). Identifying causes of and solutions for cybersickness in immersive technology: reformulation of a research and development agenda. Int. J. Human–Computer Interact. 36, 1783–1803. doi:10.1080/10447318.2020.1828535
Stanney, K. M., Nye, H., Haddad, S., Hale, K. S., Padron, C. K., and Cohn, J. V. (2021). Extended reality (xr) environments. Handb. Hum. factors ergonomics, 782–815. doi:10.1002/9781119636113.ch30
Streijl, R. C., Winkler, S., and Hands, D. S. (2016). Mean opinion score (mos) revisited: methods and applications, limitations and alternatives. Multimed. Syst. 22, 213–227. doi:10.1007/s00530-014-0446-1
Sutcliffe, A., and Gault, B. (2004). Heuristic evaluation of virtual reality applications. Interact. Comput. 16, 831–849. doi:10.1016/j.intcom.2004.05.001
Suznjevic, M., Mandurov, M., and Matijasevic, M. (2017). “Performance and qoe assessment of htc vive and oculus rift for pick-and-place tasks in vr,” in 2017 Ninth international conference on quality of multimedia experience (QoMEX) (IEEE), 1–3.
Swan, J. E., Singh, G., and Ellis, S. R. (2015). Matching and reaching depth judgments with real and augmented reality targets. IEEE Trans. Vis. Comput. Graph. 21, 1289–1298. doi:10.1109/tvcg.2015.2459895
Keywords: video see-through, video pass-through, extended reality, user experience, cybersickness, user satisfaction, mixed-methods evaluation
Citation: de Souza J and Tartz R (2024) Visual perception and user satisfaction in video see-through head-mounted displays: a mixed-methods evaluation. Front. Virtual Real. 5:1368721. doi: 10.3389/frvir.2024.1368721
Received: 11 January 2024; Accepted: 01 May 2024;
Published: 10 June 2024.
Edited by:
Francisco Rebelo, University of Lisbon, PortugalReviewed by:
Wolfgang Einhauser, Chemnitz University of Technology, GermanyCopyright © 2024 de Souza and Tartz. This is an open-access article distributed under the terms of the Creative Commons Attribution License (CC BY). The use, distribution or reproduction in other forums is permitted, provided the original author(s) and the copyright owner(s) are credited and that the original publication in this journal is cited, in accordance with accepted academic practice. No use, distribution or reproduction is permitted which does not comply with these terms.
*Correspondence: Jessica de Souza, amRlc291emFAdWNzZC5lZHU=
Disclaimer: All claims expressed in this article are solely those of the authors and do not necessarily represent those of their affiliated organizations, or those of the publisher, the editors and the reviewers. Any product that may be evaluated in this article or claim that may be made by its manufacturer is not guaranteed or endorsed by the publisher.
Research integrity at Frontiers
Learn more about the work of our research integrity team to safeguard the quality of each article we publish.