 Jacob Stuart
 Anita Stephen
 Karen Aul
 Michael D. Bumbach
 Shari Huffman
 Brooke Russo
 Benjamin Lok
94% of researchers rate our articles as excellent or good
Learn more about the work of our research integrity team to safeguard the quality of each article we publish.
Find out more
ORIGINAL RESEARCH article
Front. Virtual Real. , 03 July 2024
Sec. Virtual Reality in Medicine
Volume 5 - 2024 | https://doi.org/10.3389/frvir.2024.1363193
This article is part of the Research Topic Machine Learning and Immersive Technologies for User-centered Digital Healthcare Innovation View all 14 articles
Introduction: Variations in skin tone can significantly alter the appearance of symptoms such as rashes or bruises. Unfortunately, previous works utilizing Augmented Reality (AR) in simulating visual symptoms have often failed to consider this critical aspect, potentially leading to inadequate training and education. This study seeks to address this gap by integrating generative artificial intelligence (AI) into the AR filter design process.
Methods: We conducted a 2 × 5 within-subjects study with second-year nursing students (N = 117) from the University of Florida. The study manipulated two factors: symptom generation style and skin tone. Symptom generation style was manipulated using a filter based on a real symptom image or a filter based on a computer-generated symptom image. Skin tone variations were created by applying AR filters to computer-generated images of faces with five skin tones ranging from light to dark. To control for factors like lighting or 3D tracking, 101 pre-generated images were created for each condition, representing a range of filter transparency levels (0–100). Participants used visual analog scales on a computer screen to adjust the symptom transparency in the images until they observed image changes and distinct symptom patterns. Participants also rated the realism of each condition and provided feedback on how the symptom style and skin tone impacted their perceptions.
Results: Students rated the symptoms displayed by the computer-generated AR filters as marginally more realistic than those displayed by the real image AR filters. However, students identified symptoms earlier with the real-image filters. Additionally, SET-M and Theory of Planned Behavior questions indicate that the activity increased students’ feelings of confidence and self-efficacy. Finally, we found that similar to the real world, where symptoms on dark skin tones are identified at later stages of development, students identified symptoms at later stages as skin tone darkened regardless of cue type.
Conclusion: This work implemented a novel approach to develop AR filters that display time-based visual cues on diverse skin tones. Additionally, this work provides evidence-based recommendations on how and when generative AI-based AR filters can be effectively used in healthcare education.
In healthcare simulations, the accurate representation of diverse skin tones is not merely an ethical imperative, but a medical necessity. Patients with skin of color are more likely to experience misdiagnosis or be diagnosed later in their disease’s development (Narla et al., 2022). A major contributor to these disparities is the lack of adequate training for skin of color in medical education. For example, multiple works have researched the inclusion of images containing dark skin tones in medical textbooks and resources and found that dark skin tones are only represented in 4%–18% of images (Ebede and Papier, 2006; Kaundinya and Kundu, 2021; Harp et al., 2022). Further, a previous study found that only 19.5% of program directors and 25.4% chief residents reported having lectures on skin of color from an acknowledged expert (Nijhawan et al., 2008). Given the scarcity of resources for skin of color, it is unsurprising that previous research found that healthcare providers reported significantly less confidence assessing lupus-related rashes in people with skin of color than in patients with fair skin (Kannuthurai et al., 2021). However, this issue is not isolated to just Lupus as another work reports that 47% of dermatologists believed their medical training was inadequate in teaching them how to identify skin conditions for people with darker skin tones (Buster et al., 2012). Those who felt their training was inadequate stated the need for more exposure to training materials and patients with skin of color (Buster et al., 2012).
The logical approach to addressing this disparity would involve educating learners on recognizing symptoms across a broad spectrum of skin tones. Yet, the aforementioned shortage of medical imagery showcasing dark skin tones complicates this solution. However, Augmented reality (AR) filters, which digitally overlay graphics or effects onto real-world images or videos (Fribourg et al., 2021), are a promising solution to display symptoms during healthcare training. Previous works have used AR to depict a variety of medical conditions. Some examples include Noll et al. using AR based tracking to overlay melanoma onto users (Noll et al., 2017), Liang et al. overlaying a virtual head depicting stroke symptoms onto a manikin (Liang et al., 2021), Stuart et al. using AR filters to overlay allergic reaction symptoms onto a conversational agent (Stuart et al., 2022), and Stuart et al. using AR filters to develop a system that allowed students to manipulate Lupus symptoms in real-time (Stuart et al., 2023). Unfortunately, current explorations into using AR for simulating visual symptoms are still in early stages. As such, they were mainly focused on making the symptoms visible for just one person/manikin and did not investigate how AR application/development would need to differ to be applied to multiple skin tones (Noll et al., 2017; Liang et al., 2021; Stuart et al., 2022; 2023). AR filters particularly need to be tailored to skin tone for diseases like lupus and melanoma which can manifest differently depending on skin color (Gloster and Neal, 2006; Nelson, 2020; Lee et al., 2023). For example, what appears as a red rash on lighter skin may appear dark brown on darker skin (Ludmann, 2022).
To work towards a solution for having AR filters depict symptoms on a range of diverse skin tones, this work builds upon that of Stuart et al. by introducing the use of generative artificial intelligence (AI) within the AR filter design process (Stuart et al., 2023). Generative AI has been defined as the use of models, such as generative adversarial networks or encoder-decoder networks, to generate various resources (García-Peñalvo and Vázquez-Ingelmo, 2023). Specifically, this work examines using a commercial diffusion model training system (Scenario, 2023) to create an image generator that can take in a face image and output a similar face with a Malar rash, a distinct butterfly shaped (i.e., mainly covers the cheeks and nose) face rash that can develop over time by those with Systemic Lupus Erythematosus (Ludmann, 2022). This new image can then be used to produce an AR filter. This AR filter creation method is evaluated for five different skin tones using a similar web-based evaluation system to Stuart et al. (Stuart et al., 2023) gathering information on when users could identify symptoms when increasing the alpha (transparency) value of the AR filter and how realistic users thought the symptoms appeared.
This work focuses on the process of using generative AI in the design process to allow designers to create AR filters that better represent time-based visual symptoms across a broad spectrum of skin tones. By doing so, this research can help identify potential biases, address disparities in perception, and inform ethical development/deployment of AR experiences. Ultimately, these findings can contribute to industry best practices, promote diversity, equity, and inclusion in technology development, and ensure that AR technology is accessible and enjoyable for all users, regardless of their skin tone or background.
Five different skin tones were examined in this study. We will refer to these as light, medium-light, medium-dark, dark-light, and dark. For each skin tone, participants saw visual cues based on real images and visual cues based on generated images. Thus, participants were asked to complete visual analog scale questions for a total of 10 conditions (Skin tone X Cue type): Light-Real, Light-Generated, Medium-Light-Real, Medium-Light-Generated, Medium-Dark-Real, Medium-Dark-Generated, Dark-Light-Real, Dark-Light-Generated, Dark-Real, and Dark-Generated (Figure 1).

Figure 1. Chart showing skin tone X cue type variables. The real row shows faces with AR filters that are made using real images of people with malar rash symptoms. The generated row shows faces with AR filters that are made using images created using the generative AI platform Scenario.
To create the real-image skin conditions, we selected computer-generated faces from generated. photos, a company focused on producing photorealistic images of people, with skin tones ranging from light to dark (Generated, 2023). Once images were selected, a similar process to (Stuart et al., 2023) was used to overlay the symptoms on to the faces (Section 2.2). The five faces depicted were chosen as they were good skin tone matches to existing medical imagery that could be used for the real conditions.
To create the generated conditions, image generators were trained using images depicting malar rash symptoms for each skin tone (Section 2.1). The objective of the image generator is to take an input image of an individual and output a new image. This output image depicts a new person with a similar skin tone and shows the signs of malar rash symptoms. Output images are used to develop the computer-generated AR filter conditions (Figure 2).
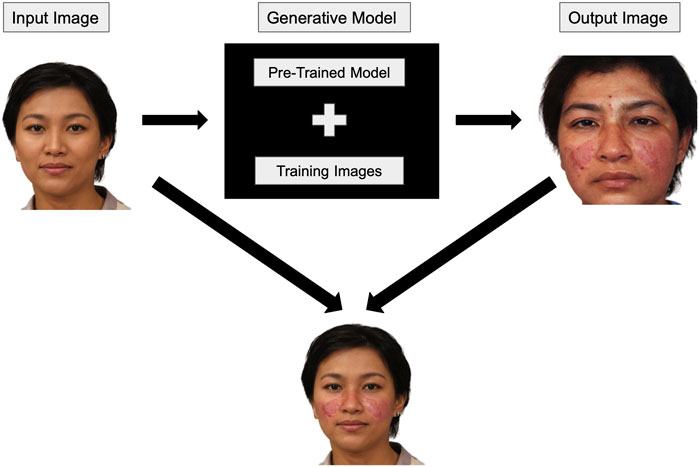
Figure 2. An input image is given to the model to generate a picture of a person with a similar skin tone with malar rash symptoms. The output image is then used to produce the AR filter which can be applied to the original input image.
We utilized Scenario, a commercial platform specializing in generative image models, to create our image generator (Scenario, 2023). This platform provides pre-trained models capable of generating human figures and avatars. Users can fine-tune these pre-trained models by uploading their unique set of images. This flexibility is highly advantageous as the pre-trained model already understands human facial features, allowing the additional data to focus on the appearance of individuals with malar rash symptoms. This approach reduces the necessity for an extensive training set that portrays people exhibiting malar rash symptoms.
An iterative design process was used to create the training sets for each model. The first model included all (n = 66) images that could be found from reputable online sources of systemic lupus erythematosus patients depicting malar rash. This initial model often lightened the skin tone around the nose and cheeks, contained visual artifacts that harmed the visual quality of the malar rash visual cue, and generally lightened darker skin tones, which interfered with the visual accuracy of the malar rash (Figure 3).
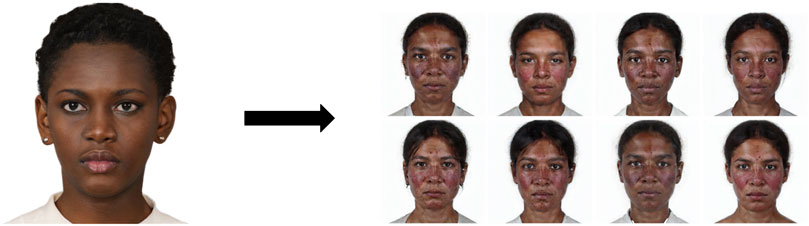
Figure 3. This figure shows examples of images generated using the first model. Note that many of the images are significantly lighter than the input image. Additionally, these may end up exhibiting features that are more representative of those with lighter skin tones (e.g., different facial features).
After creating this initial model, several steps were taken to enhance the image quality for subsequent models, in line with established best practices (Shorten and Khoshgoftaar, 2019; Larrazabal et al., 2020; Wang et al., 2020; Maluleke et al., 2022):
1. Images suffering from poor or low-lighting conditions were eliminated as they often resulted in output images with lighter skin tones in the rash pattern area, largely due to significant specular reflections in these images.
2. Low-resolution images were removed to minimize output image artifacts.
3. The original dataset was divided into subsets representing different skin tones to counter the lightening (whitewashing) of darker skin tones caused by an overrepresentation of lighter skin tone examples.
This dataset division resulted in smaller training sets for each skin tone. While feasible in this case, such an approach might not be viable in scenarios with limited diverse images or when the visual cue is not as clearly defined.
Future improvements can be made to the dataset division and output image selection processes, which were manually executed in this project. A system that measures skin tone similarity, perhaps referencing Fitzpatrick Phototypes, might allow a more rigorous division of training sets and selection of final output images. However, designing an accurate skin tone comparison system would necessitate further research, as factors like shadows, lighting, and reflections would need to be considered. For the current iteration of this process, once the generated images passed the author’s approval (i.e., did not have obvious visual artifacts or racial bias), they were reviewed by nursing collaborators for face validity before being used to create the AR filters (Figure 1).
To create the ten AR filters, the real symptom images, the generated symptom images, and the face images from Generated. photos were uploaded to Lens Studio, a program for AR filter creation for the Snapchat platform (Snap Inc, 2021). Once uploaded, a face mask was created for each condition. Facial details that are not relevant to the Malar rash symptoms (e.g., areas of the forehead) are removed from the face mask using an opacity texture. This would result in an AR Filter that would overlay areas of the face that present Malar rash symptoms. The face images from Generated. photos could then be set as the camera source and the real and generated symptom images could be applied to a face using the face mask. The face mask would automatically track to the face in the camera source.
For each of the ten conditions, we used an AR filter to create 101 images, with the alpha (i.e., transparency) level of the Malar rash face mask ranging from 0 to 100. The images were then uploaded to Qualtrics to create visual analog questions.
Similar to Stuart et al., this work uses visual analog scales to depict patient deterioration over time by manipulating the alpha level of the AR visual cue (Stuart et al., 2023). These scales enabled students to manipulate the Malar rash symptoms in real-time. This method let us use the created AR filters while managing variables introduced by AR, such as tracking, lighting, or hardware issues.
The visual analog scales use modified versions of Qualtrics’ visual analog scale question. Each question utilized 101 images (Section 2.2) with alpha levels ranging from 0% (full transparency) to 100% (full visibility). This allowed for the use of a 0–100 scale. Other benefits of this method include allowing students to provide precise points at which they noticed symptom developments, allowing students to easily control the state of the symptom that was being displayed, and go back to a previous state if they accidentally passed where they believe they noticed changes, and it helped to reduce the total time needed to complete the survey (which is vital with the limited class time allowed to complete the study).
Other options for displaying symptoms were considered. These included 1) applying the AR filters in real-time using Snap’s Camera Kit an SDK that allows developers to implement Snap’s AR technology into websites, and 2) creating short videos that automatically had the symptoms develop over time with students clicking when they noticed the desire stages. The slider method was chosen over the real-time application because it was unclear if all student’s laptops would be capable of running Camera Kit. Additionally, the slider method was chosen instead of showing students a video of the symptom developing over time and getting an actual time amount for several reasons. Most importantly, rash symptoms vary in the severity they can reach, and the time it takes to develop (Brown, 2003). Therefore, it is more important to identify stages of symptom development, such as initial changes and pattern identification, by the variable being manipulated (alpha level) rather than the time the variables are changed over. Time as a variable can be manipulated in future works to investigate different symptom development speeds.
In addition to reviewing the output images discussed in section 2.1, the five nursing faculty also separately reviewed the visual analog questions for all conditions. The nursing collaborators were asked to evaluate the face validity of the rash and its development using the visual analog questions (i.e., does this look like an accurate representation of Malar rash symptoms on each of the skin tones?) and the visibility of the symptoms. Visibility was assessed because faculty wanted to see if the images would provide educational value to students. If the symptoms displayed in the images were too difficult for students to acknowledge and assess with different skin tones the educational value provided by the images would be low.
Second-year nursing students (N = 117) were recruited from a nursing course (Principals of Personalized Nursing Care 2) taught at the University of Florida in the Spring of 2023. Six students reported not having normal or corrected-to-normal vision and a colorblindness test determined that 13 students experienced some level of color blindness. These participants are excluded from analysis in this paper due to potential differences in visual perception of the conditions. This led to a remaining population of 98 nursing students.
Of the 98 remaining students, all were 18–24 years old. Students’ self-reported genders were: 9 Males and 88 Females, and one non-binary. Students’ self-reported races were: 8 Asian, 1 Asian/Other, 3 Black or African American, 1 Black or African American/Asian, 2 Other, 79 White or Caucasian, 2 White or Caucasian/Asian, 1 White or Caucasian/Other, and one preferred not to say. As for their familiarity with the malar rash symptoms presented: five were slightly familiar, one was somewhat familiar, and 92 were not familiar at all.
During class, participants were provided a link to the Qualtrics study in their course management software to follow the study flow shown in Figure 4. Participants began by reading and signing the informed consent. Then participants completed a pre-survey that included demographics, screen brightness, and color blindness questions. Following the pre-survey, a pre-brief section informed participants about malar rash symptoms and explained the questions they would answer regarding the malar rash visual cues. After the pre-brief, participants completed two visual analog scale questions and a semantic differential scale for each of the 10 conditions. Finally, participants completed a post-survey and ended the study.
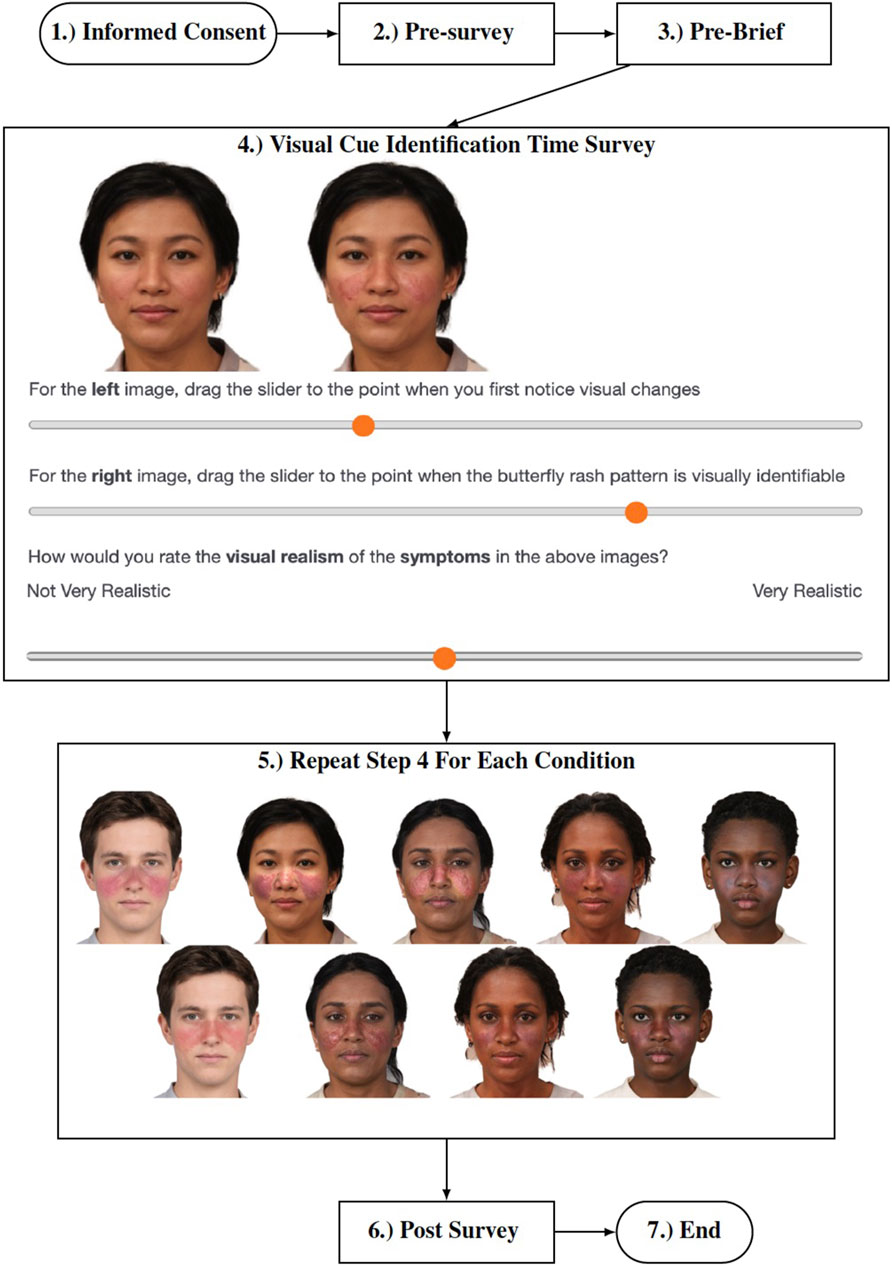
Figure 4. Procedure followed by participants in the study.
The pre-survey questionnaire asked seven demographics questions regarding participants’ age, race, gender, vision status, malar rash familiarity, screen brightness, and color blindness.
In addition to the demographics questions, students were also asked to answer eight theory of planned behavior (TPB) intention questions before and after the intervention. These questions adapted from Ajzen et al. were used to gather changes in user perceptions regarding their intention to take patient skin characteristics into consideration the next time they perform a skin assessment (Ajzen, 2006). This survey measures three variables that influence a users intentions to perform a behavior as well as their overall perception of their own intentions. The three variables measured are behavioral beliefs, normative beliefs, and control beliefs. Each of these variables is measured using two seven-point semantic scale questions.
Behavioral beliefs are “beliefs about the likely outcomes of the behavior and the evaluations of these outcomes” (Ajzen, 2006). The two questions in the results that correspond to this belief are labeled AttitudeGood and AttitudeBeneficial. These questions are “Taking patient skin characteristics into consideration the next time I perform a skin assessment would be X for the patient’s health outcome” where X was a rating from bad to good, and “Taking patient skin characteristics into consideration the next time I perform a skin assessment would be X″ where X was a rating from not beneficial to beneficial.
Normative beliefs are “beliefs about the normative expectations of others and motivation to comply with these expectations” (Ajzen, 2006). The two questions in the results that correspond to this belief are labeled NormLikeMe and NormApprove. These questions are “Most people like me take patient skin characteristics into consideration every time they perform a skin assessment” rated from unlikely to likely, and “Most people who are important to me approve of taking patient skin characteristics into consideration every time I perform a skin assessment” rated from disagree to agree.
Control beliefs are “beliefs about the presence of factors that may facilitate or impede performance of the behavior and the perceived power of these factors” (Ajzen, 2006). The two questions in the results that correspond to this belief are labeled ControlUpToMe and ControlEfficacy. These questions are “Taking patient skin characteristics into consideration the next time I perform a skin assessment is up to me” rated from disagree to agree, and “I am confident that I can take patient skin characteristics into consideration every time I perform a skin assessment” rated from true to false.
This questionnaire ends with a direct measure of user intentions with the question “I intend to take patient skin characteristics into consideration the next time I participate in a skin assessment to have a good patient health outcome” with a rating from false to true.
In addition to following the theory of planned behavior framework, these questions were also reviewed by nursing collaborators to verify that they would be coherent to those in the nursing domain.
Following the TPB intention questions, participants were asked to complete visual analog scale questions and the semantic differential scale for each condition, a total of 30 questions (Figure 4). The visual analog scale questions are used to measure at what point users identified different stages of patient deterioration (initial changes in appearance and the butterfly pattern appearance). The semantic differential scale question was used to measure users perceptions of symptom realism rated from 0 to 100 with 0 labeled as “Not Very Realistic” and 100 labeled as “Very Realistic”. We asked users to assess the realism of the stages they identified (just noticeable and a clear butterfly pattern), to understand whether they perceive these symptoms as realistic before full development. This differs from Stuart et al. which asked about realism when the symptoms were fully developed (fully opaque symptoms) Stuart et al. (2023). Our approach in this study aimed to understand whether using transparency as a manipulative variable maintains the realism of symptoms during critical stages of their development. If realism was rated low overall or if realism was much lower for a specific skin tone, then it would have been reasonable to assume that alpha level was not a feasible variable to manipulate when looking at symptom development over time for diverse skin tones.
The study concluded with a post-survey gathering user intentions again (TPB), a subset of four questions related to confidence and self-efficacy from the simulation-effectiveness tool (SET-M) which is used to evaluate perceptions of the effectiveness of learning in the simulation environment (Leighton et al., 2015), and two questions gathering open-ended qualitative responses from participants regarding their perceptions of the visual cues and how they believe their perceptions were affected by the differences in filter and object fidelity.
Descriptive and inferential statistics are reported for participants first noticing changes, noticing the malar rash pattern, and the perceived realism of the malar rash. Similar to (Stuart et al., 2022), we utilized the filter alpha level to determine when students first identified changes and noticed the malar rash pattern. In these sections, a lower score signifies students identifying changes and patterns sooner. Additionally, the units of measurement for realism is similar to the previous work and refers to the students’ self-reported perceptions on a 0–100 visual analog scale. A lower score for this is interpreted as students perceiving the visual cue as less realistic.
For each visual analog scale question and the semantic differential scale, a two-way repeated measures ANOVA was performed. All questions were assessed for normality using Q-Q plots and Kolmogorov-Smirnov tests and all were found to follow normal distributions. A Mauchly test of sphericity was performed to check for sphericity assumptions. For tests that violated sphericity, the Greenhouse-Geisser and the Huynh-Feldt epsilon values are greater than 0.75. Therefore the repeated measures ANOVA results for these measures are reported based on the Huynh-Feldt corrections. When repeated measures ANOVA indicated significant differences, post hoc tests were performed using the Holm correction. The post hocs allowed for the analysis of the perceptual differences between skin tones and cue types.
For the Simulation Effectiveness Tool Modified (SET-M), frequencies of student responses are reported since there are no comparisons to pre-intervention data or other conditions to be made.
For the theory of planned behavior questions, a wilcoxon signed-rank test was conducted to compare the ordinal data from the pre-post responses. Additionally, the frequencies of each response are reported.
For the qualitative questions, we analyzed the responses to identify if students believed the symptom style affected their perception of realism of the symptoms and their ability to identify the symptoms. There were 89 and 86 responses for these questions respectively. A first pass of the responses was completed for each question to determine categories. During this first pass, it was determined that the majority of user responses were comparing the conditions. From this finding, it was decided to categorize the responses for the realism question as either stating the symptom realism was similar for both cue styles, more realistic for the AR-filter based on the computer-generated image, or more realistic for the AR filter based on the real symptom image. The ability to identify symptoms categories were similarly created. Responses were only counted towards categories if answers were clear and unambiguous, so no discussion between coders was necessary.
A Mauchly’s test of sphericity was significant for skin tones for this measure, therefore the Huynh-Feldt correction was used. A two-way repeated measures ANOVA showed that first changes ratings differed significantly between skin tone levels, F (3.23, 313.68) = 105.02, p
Post hoc testing using the Holm correction revealed that the light skin tone condition was rated significantly lower in regards to first noticing changes when compared to all other skin tones, the medium-light skin tone condition was rated significantly lower in regards to first noticing changes when compared to the dark-light and dark skin tones, and the medium-dark skin tone condition was rated significantly lower in regards to first noticing changes when compared to the dark-light and dark skin tone conditions (Table 1). Overall these results along with descriptive statistics results suggest that ratings on the first changes slider increased as skin tone darkened (Figure 5).

Table 1. Post Hoc results for skin tone in regards to first noticing changes.
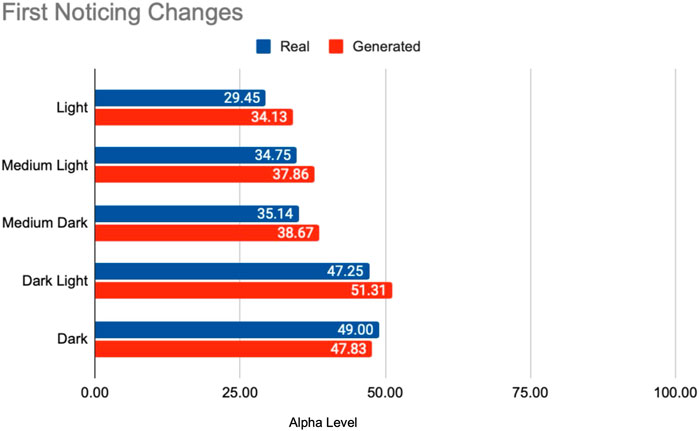
Figure 5. Visual depiction of means showing how as skin tone darkened, it took users longer to notice initial changes occurring with the visual cue.
As for cue type, post hoc testing revealed that ratings on the first changes slider were lower for the cues based on real images (mean difference = −2.84, p

Table 2. Post Hoc results for cue type in regards to first noticing changes.
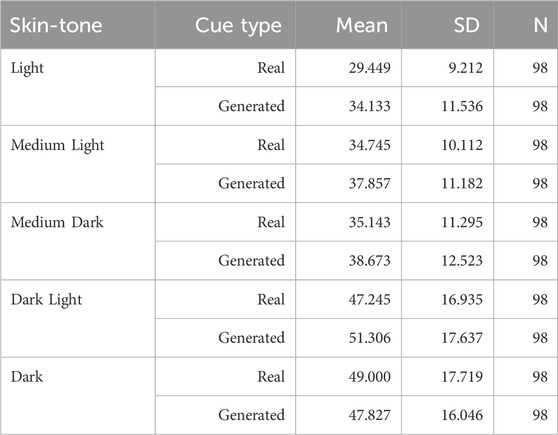
Table 3. Descriptive Statistics for first noticing changes.
A Mauchly’s test of sphericity was significant for skin tones for this measure, therefore the Huynh-Feldt correction was used. A two-way repeated measures ANOVA showed that noticing pattern ratings differed significantly between skin tone levels, F (3.84, 372.54) = 176.95, p
Post hoc testing using the Holm correction revealed that the light skin tone condition was rated significantly lower in regards to noticing pattern changes when compared to all other skin tones, the medium-light skin tone condition was rated significantly lower when compared to all other skin tones except for the light skin tone, and the medium-dark skin tone condition was rated significantly lower when compared to the dark-light and dark skin tone conditions (Table 4. Overall these results along with descriptive statistics results suggest that ratings on the noticing pattern slider increased as skin tone darkened (Figure 6).
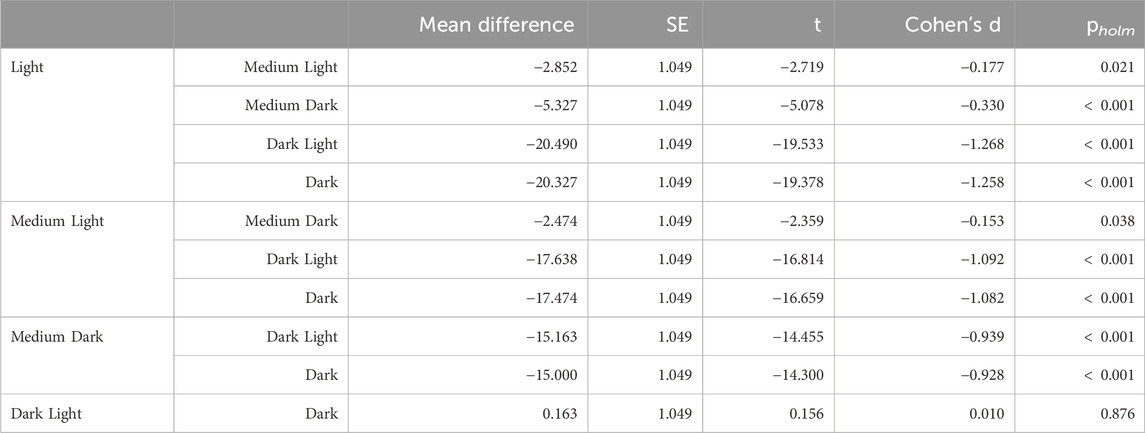
Table 4. Post Hoc results for skin tone in regards to noticing pattern.
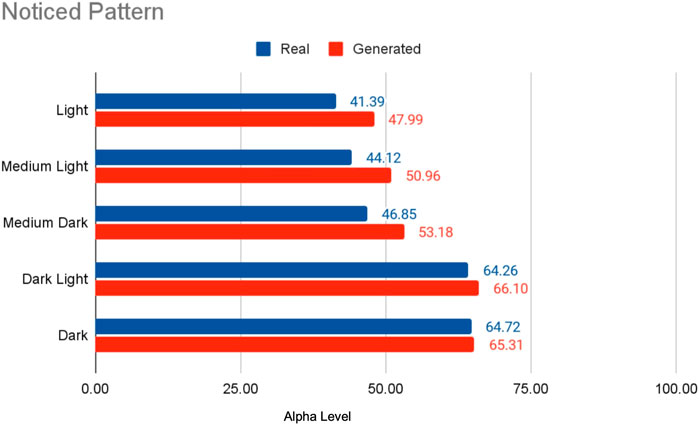
Figure 6. Visual depiction of means showing how as skin tone darkened, it took users longer to notice the butterfly pattern that occurs with the visual cue.
As for cue type, post hoc testing revealed that ratings on the noticing pattern slider were lower for the cues based on real images (mean difference = −4.44, p

Table 5. Post Hoc results for cue type in regards to noticing pattern.
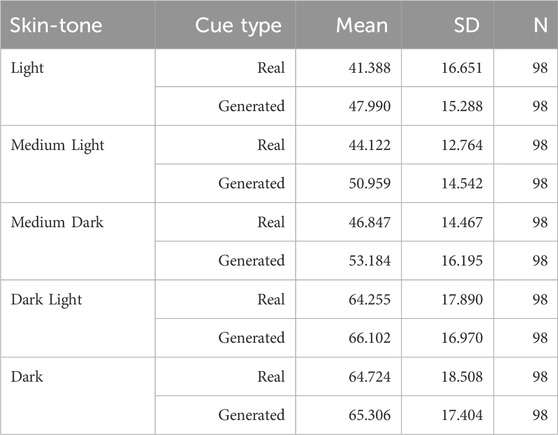
Table 6. Descriptive Statistics for noticing pattern.
A Mauchly’s test of sphericity was significant for skin tones for this measure, therefore the Huynh-Feldt correction was used. A two-way repeated measures ANOVA showed that realism ratings differed significantly between skin tone levels, F (3.73, 361.66) = 4.71, p
Post hoc testing using the Holm correction revealed that ratings on the realism slider were significantly lower for the dark skin tone condition when compared to the light skin tone condition (mean difference = 2.95, p = 0.002) and the medium-dark skin tone condition (mean difference = 2.70, p = 0.005) (Table 7). As for the cue type, the results suggest that learners viewed the cues based on the real images as less realistic than the computer generated cues (mean difference = −1.47, p = 0.031) (Table 8). Descriptive statistics are shown in Table 9, Figure 7.

Figure 7. Visual depiction of user rating of realism.
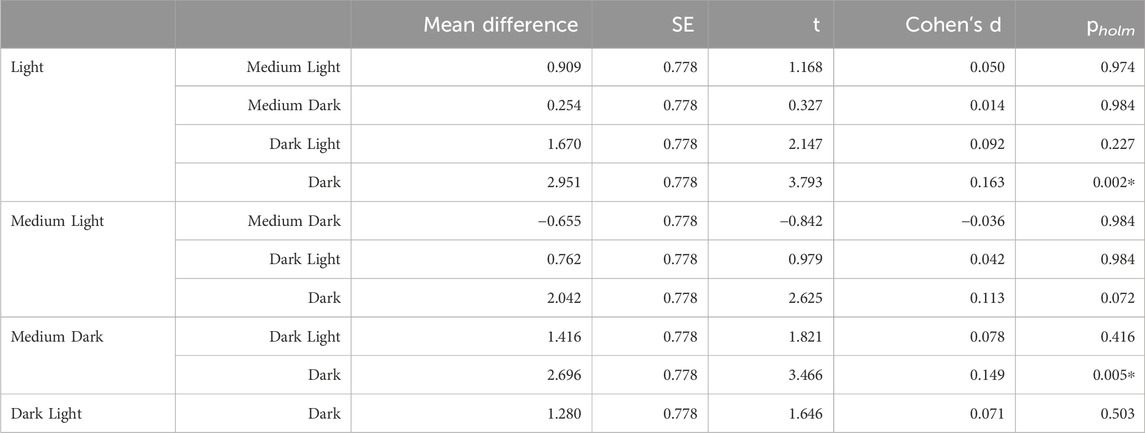
Table 7. Post Hoc results for cue skin tone in regards to realism.

Table 8. Post Hoc results for cue type in regards to realism.
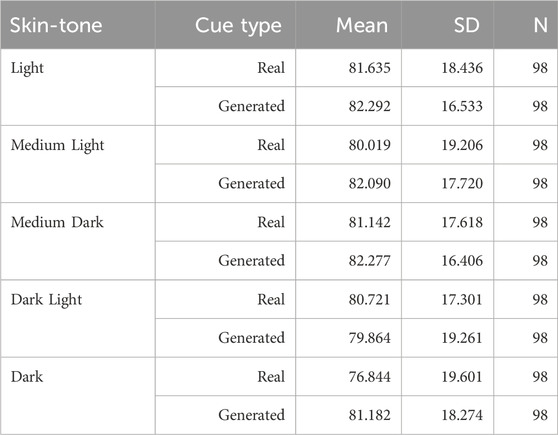
Table 9. Descriptive statistics for realism ratings.
Analyzing the results from the SET-M questions, we focused on the frequencies of student responses rather than a pre-post comparison or contrasting against other conditions, eliminating the need for statistical inference. The data gathered suggests a positive learner reception towards the slider interface intervention. A majority of the students reported feeling more prepared, more understanding of the pathophysiology, and more confident in their assessment and teaching skills upon completing the study (Table 10). This perception of benefit gives a strong indication that the intervention was effective in enhancing student readiness and understanding.
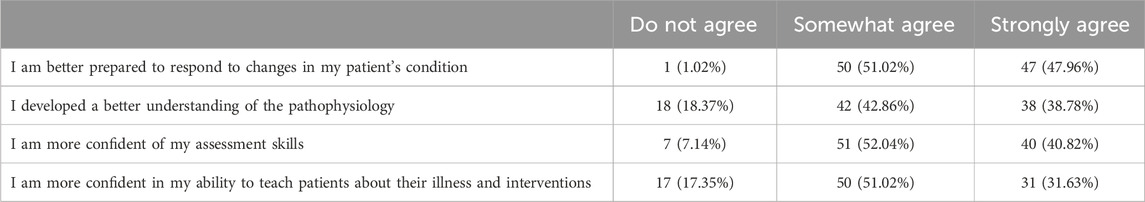
Table 10. Frequencies: SET-M questions.
A Wilcoxon’s signed-rank test showed that completing the visual cue activity significantly increased ratings for the AttitudeGood (W = 0.00, p
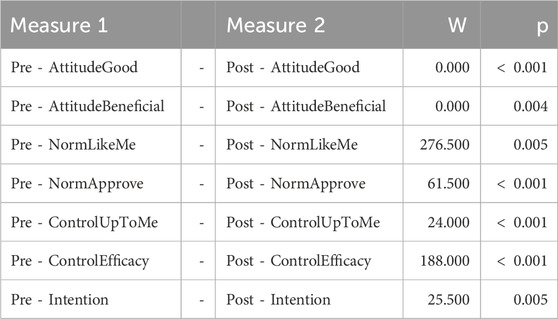
Table 11. Theory of Planned Behavior: Wilcoxon signed-rank test.
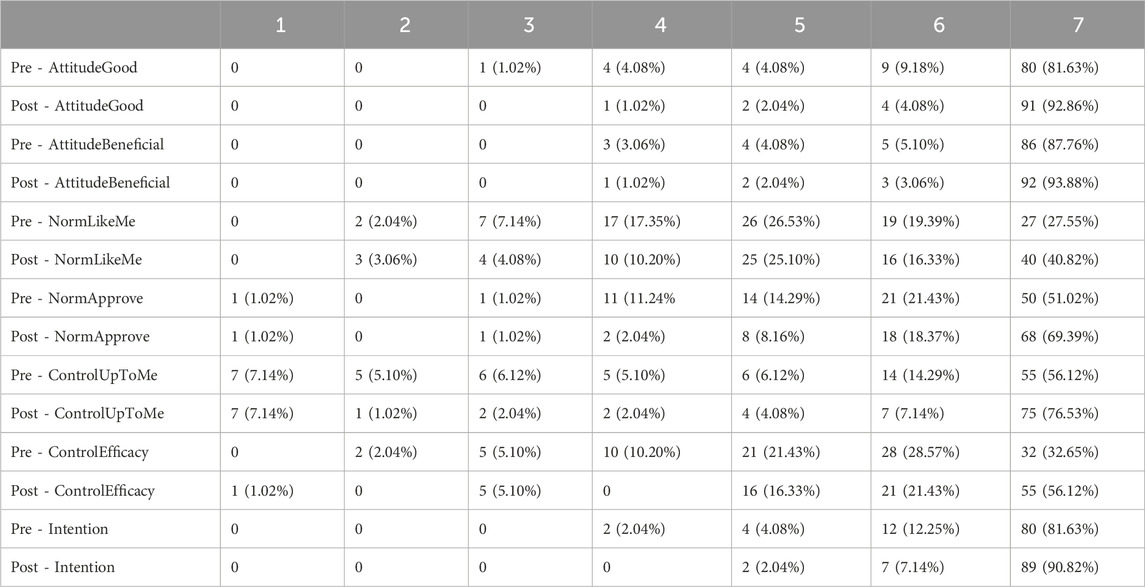
Table 12. Theory of planned behavior frequencies table.
There were 89 total responses for this question though not all responses were relevant so are not counted in the following data description. 31 stated that the symptom realism was similar or not affected by the symptom style, five stated that the symptoms appeared more realistic when the AR filter based on the computer-generated image was used, and two stated the symptoms appeared more realistic when the AR filter based on the real image was used. These responses align with the realism results which found that students perceived the computer generated images as marginally more realistic compared to the AR filter based on the real image.
There were 86 total responses for this question though not all responses were relevant so are not counted in the following data description. 24 stated that their ability to identify the symptoms was similar or not affected by the symptom style, eight stated that it was easier to identify the symptoms when the AR filter based on the computer-generated image was used, and 14 stated it was easier to identify the symptoms when the AR filter based on the real image was used. These responses align with the change and pattern identification results which found that students identified changes and patterns marginally sooner when the AR filter based on the real image was used.
In this work, we found that students rated the symptoms displayed by the computer-generated AR filters as marginally more realistic than the symptoms displayed by the real image AR filters. However, students identified symptoms earlier with the real-image filters. Additionally, SET-M and theory of planned behavior questions indicate that the activity increased students feelings of confidence and self-efficacy. Finally, we found that similar to the real world, where symptoms on dark skin tones are identified at later stages of development, students identified symptoms at later stages of development as skin tone darkened regardless of cue type (Schwartz et al., 2003; Hu et al., 2006; Khan and Mian, 2020; Nelson, 2020).
Overall, the results indicate that this method of using AR filters to depict time-based visual cues is effective at improving student self-efficacy and confidence regarding their abilities to identify malar rash symptoms on different skin tones. This is supported by the SET-M results, which indicate that the majority of students found the activity to improve their perceptions of self-efficacy and self-confidence, and the results of the theory of planned behavior questions which indicate that the activity led to improvements in students’ perceptions of using skin characteristics while performing a skin assessment and their perceived self-efficacy in their ability to use skin characteristics the next time they perform a skin assessment.
Additionally, the findings indicate that AR filters based on computer-generated images perform similarly to AR filters based on real images. This conclusion is supported by the realism and both identification ratings. The realism ratings reveal that students generally perceived the computer-generated symptoms as slightly more realistic than the real-image symptoms with a mean difference of 1.47 on a 101 point scale. The initial changes and pattern identification ratings show that students noticed the initial changes and butterfly pattern in real-image symptoms marginally sooner than in the computer-generated symptoms with mean differences of 2.84 and 4.44 on 101 point scales.
We believe the differences that are observed between the symptom styles are connected with the salience of symptoms. It appears that the computer-generated images blended better with the skin and had less specular reflections because they were taken using cameras with photographic flashes. This led to a reduced salience of the symptoms, which seemed to render the symptoms more realistic in appearance.
We also found that the real images were identified at earlier stages of development. We believe this was due to the nature of real image AR filters. Unlike the computer-generated images, they do not perfectly blend with the skin and often demonstrate specular reflections from the lighting conditions the source images were taken in. These characteristics resulted in filters that did not blend as well and thus, exhibited higher salience.
Both observations underscore the role of symptom salience in the perceived authenticity of images. The blending property of computer-generated images lent a realism to the symptoms, whereas the pronounced salience in real images made the symptoms more readily noticeable at the early stages of the disease.
Overall though, it appears that both methods used to generate the AR filters are effective when used to develop training opportunities that depict visual cues on a range of diverse skin tones, indicating the computer-generated images are a viable alternative to provide source images for AR filters. This contributes to addressing persistent disparities in healthcare education, such as the insufficient diversity and quality of medical images.
However, while these methods have shown promise, ensuring their continued accuracy and effectiveness in representing diverse skin tones is critical. Machine-generated images can lead to bias if an expert is not included in future design processes. For instance, the machine learning model may generate symptoms on minority skin tones in a way that mirrors their depiction on light skin tones, which might not be an accurate representation of the symptoms (Figure 3). To prevent such potential inaccuracies, we recommend maintaining an ‘expert-in-the-loop’ model for the cue design process. This would require the active participation of a specialist in the development of stimuli, ensuring that the medical images produced accurately and appropriately represent symptoms on different skin tones (Girardi et al., 2015; Guo et al., 2016; Li et al., 2020).
Based on our findings, we provide the following design guidelines.
• Generative AI for visual cue training: Generative AI might be a preferable alternative for developing visual cue training using AR filters compared to medical illustrations or real images. While the computer-generated images took learners slightly longer to identify (Sections 4.2.1 and 4.2.2), the learners also perceived the computer-generated images as more realistic (Section 4.2.3). The slight delay in identification time may be an acceptable trade-off for ensuring that training can accommodate a variety of skin tones and adapt to different lighting conditions. Additionally, the use of computer-generated images helps to alleviate potential privacy concerns with overlaying portions of real patient faces onto training stimuli. Overall, we recommend future work to explore generative AI as an alternative for developing visual cue training when real medical imagery is scarce. However, the validity of the generated images should be verified by experts to ensure their suitability for training.
• Iterative Evaluation of AI-generated Images: To avoid potential inconsistencies or inaccuracies in AI-generated images, it is recommended to implement an iterative evaluation process. This process should involve experts in the field who can verify the validity of the images produced. If needed, the machine learning models used can be refined based on their feedback.
• Diversity in Training: AR visual cue training should accurately represent a diverse range of skin tones. The results of this work highlighted that learners took longer to identify the visual cues as skin tone darkened (Sections 4.2.1Sections .1 and 4.2.2). This phenomena exists in the real-world as nurses and physicians diagnose individuals with darker skin tones at a later stages than light skin tone counterparts (Schwartz et al., 2003; Hu et al., 2006; Khan and Mian, 2020; Nelson, 2020). Our solution provides an avenue to provide opportunities for practice that may not otherwise be possible due to a lack of existing resources. We recommend continuing to provide learners with stimuli depicting a variety of skin tones to help increase the number of diverse training opportunities and potentially reduce this disparity gap.
• Need for Better Metrics: While our results suggest that this intervention increased learners’ feelings of self-efficacy and confidence (Sections 4.2.4Sections .4 and 4.2.5), it is unclear how this may actually improve their future performance. We recommend future work should aim to improve the metrics used to measure if learners are identifying visual cues. Ideally, future training can identify a learners current level, provide feedback on potential disparities they may contribute to, and the measure their improvement at identifying symptoms in multipart training simulations.
This study faces several limitations, such as not using an AR device, varying screen brightness and color calibrations among users, using transparency as an indicator of symptom progression, and limited symptom types. These issues are discussed briefly:
1) This study does not use an AR device to display filters. This prevents the inclusion of variables like tracking, viewing angle, and device calibration. Despite some persistent screen differences (like brightness and color), our approach, alongside measures to regulate screen brightness, ensures a more controlled design. Future research can apply these findings in simulations to explore how AR display variables and tracking influence user perceptions of symptoms.
2) The alpha level slider, scaling linearly from 0 to 100, is used to approximate symptom development, but symptom progression is not necessarily linear. Symptoms may initially change rapidly before slowly reaching peak severity and can vary among patients, even for the same symptom (Brown, 2003). Future studies should explore more methods to more accurately represent symptom developments, enhancing healthcare education.
3) This study focuses solely on the malar rash due to its distinctiveness and prevalence in various conditions. It is an additive symptom, adding redness to the face, which may differ from subtractive symptoms like paleness, where color is removed. Further research is required to understand the nuances of different symptom types.
This study demonstrates the potential of utilizing generative AI in the AR filter design process. Using the evaluation tool developed by Stuart et al. (Stuart et al., 2023), our results indicate that AR filters designed using generative AI can be effective teaching tools for healthcare students to enhance their self-efficacy and confidence in identifying malar rash symptoms across a range of diverse skin tones. The positive outcomes observed in both SET-M scores and theory of planned behavior questions highlight the effectiveness of this approach in improving students’ perceptions of their clinical assessment skills. Most importantly, our findings suggest that computer-generated images can be a viable alternative to real images in the development of AR filters, as they were found to be comparable in terms of realism and pattern identification, providing a potential avenue to reduce healthcare disparities. Together, the findings of this research indicate that using generative AI in the AR filter design process is a promising direction to help improve the inclusivity of healthcare training.
The raw data supporting the conclusion of this article will be made available by the authors, without undue reservation.
The studies involving humans were approved by University of Florida Internal Review Board. The studies were conducted in accordance with the local legislation and institutional requirements. The participants provided their written informed consent to participate in this study. Written informed consent was obtained from the individual(s) for the publication of any potentially identifiable images or data included in this article.
JS: Conceptualization, Data curation, Formal Analysis, Funding acquisition, Investigation, Methodology, Project administration, Resources, Software, Supervision, Validation, Visualization, Writing–original draft, Writing–review and editing. AS: Conceptualization, Project administration, Resources, Supervision, Validation, Writing–original draft, Writing–review and editing. KA: Conceptualization, Project administration, Resources, Supervision, Validation, Writing–original draft, Writing–review and editing. MB: Conceptualization, Project administration, Resources, Supervision, Validation, Writing–original draft, Writing–review and editing. SH: Writing–original draft, Writing–review and editing. BR: Writing–original draft, Writing–review and editing. BL: Conceptualization, Data curation, Formal Analysis, Funding acquisition, Investigation, Methodology, Project administration, Resources, Supervision, Validation, Visualization, Writing–original draft, Writing–review and editing.
The author(s) declare that financial support was received for the research, authorship, and/or publication of this article. This work was funded by the National Science Foundation award numbers 1800961 and 1800947.
We would like to thank the members of the virtual experiences research group for their assistance throughout the paper writing process.
The authors declare that the research was conducted in the absence of any commercial or financial relationships that could be construed as a potential conflict of interest.
All claims expressed in this article are solely those of the authors and do not necessarily represent those of their affiliated organizations, or those of the publisher, the editors and the reviewers. Any product that may be evaluated in this article, or claim that may be made by its manufacturer, is not guaranteed or endorsed by the publisher.
Brown, A. F. (2003). The emergency department epidemiology of acute allergic events: can we ever compare apples with apples? Emerg. Med. Australasia 15, 315–317. doi:10.1046/j.1442-2026.2003.00468.x
Buster, K. J., Stevens, E. I., and Elmets, C. A. (2012). Dermatologic health disparities. Dermatol. Clin. 30, 53–59. doi:10.1016/j.det.2011.08.002
Ebede, T., and Papier, A. (2006). Disparities in dermatology educational resources. J. Am. Acad. Dermatology 55, 687–690. doi:10.1016/j.jaad.2005.10.068
Fribourg, R., Peillard, E., and McDonnell, R. (2021). “Mirror, mirror on my phone: investigating dimensions of self-face perception induced by augmented reality filters,” in 2021 IEEE International Symposium on Mixed and Augmented Reality (ISMAR), Bari, Italy, 04-08 October 2021 (IEEE), 470–478.
García-Peñalvo, F., and Vázquez-Ingelmo, A. (2023). What do we mean by GenAI? A systematic mapping of the evolution, trends, and techniques involved in generative AI. Int. J. Interact. Multimedia Artif. Intell. 8, 7. doi:10.9781/ijimai.2023.07.006
Girardi, D., Kueng, J., and Holzinger, A. (2015). A domain-expert centered process model for knowledge discovery in medical research: putting the expert-in-the-loop. Brain Inf. Health, 389–398. doi:10.1007/978-3-319-23344-4_38
Gloster, H. M., and Neal, K. (2006). Skin cancer in skin of color. J. Am. Acad. Dermatology 55, 741–760. doi:10.1016/j.jaad.2005.08.063
Guo, X., Yu, Q., Li, R., Alm, C. O., Calvelli, C., Shi, P., et al. (2016). An expert-in-the-loop paradigm for learning medical image grouping. Adv. Knowl. Discov. Data Min., 477–488. doi:10.1007/978-3-319-31753-3_38
Harp, T., Militello, M., McCarver, V., Johnson, C., Gray, T., Harrison, T., et al. (2022). Further analysis of skin of color representation in dermatology textbooks used by residents. J. Am. Acad. Dermatology 87, e39–e41. doi:10.1016/j.jaad.2022.02.069
Hu, S., Soza-Vento, R. M., Parker, D. F., and Kirsner, R. S. (2006). Comparison of stage at diagnosis of melanoma among hispanic, Black, and white patients in miami-dade county, Florida. Archives Dermatology 142, 704–708. doi:10.1001/archderm.142.6.704
Kannuthurai, V., Murray, J., Chen, L., Baker, E. A., and Zickuhr, L. (2021). Health care practitioners’ confidence assessing lupus-related rashes in patients of color. Lupus 30, 1998–2002. doi:10.1177/09612033211045284
Kaundinya, T., and Kundu, R. V. (2021). Diversity of skin images in medical texts: recommendations for student advocacy in medical education. J. Med. Educ. Curric. Dev. 8, 238212052110258. doi:10.1177/23821205211025855
Khan, S., and Mian, A. (2020). Racism and medical education. Lancet Infect. Dis. 20, 1009. doi:10.1016/S1473-3099(20)30639-3
Larrazabal, A. J., Nieto, N., Peterson, V., Milone, D. H., and Ferrante, E. (2020). Gender imbalance in medical imaging datasets produces biased classifiers for computer-aided diagnosis. Proc. Natl. Acad. Sci. 117, 12592–12594. doi:10.1073/pnas.1919012117
Lee, V., Sokumbi, O., and Onajin, O. (2023). Collagen vascular diseases. Dermatol. Clin. 41, 435–454. doi:10.1016/j.det.2023.02.009
Leighton, K., Ravert, P., Mudra, V., and Macintosh, C. (2015). Updating the simulation effectiveness tool: item modifications and reevaluation of psychometric properties. Nurs. Educ. Perspect. 36, 317–323. doi:10.5480/15-1671
Li, G., Mao, R., Hildre, H. P., and Zhang, H. (2020). Visual attention assessment for expert-in-the-loop training in a maritime operation simulator. IEEE Trans. Industrial Inf. 16, 522–531. doi:10.1109/TII.2019.2945361
Liang, C.-J., Start, C., Boley, H., Kamat, V. R., Menassa, C. C., and Aebersold, M. (2021). Enhancing stroke assessment simulation experience in clinical training using augmented reality. Virtual Real. 25, 575–584. doi:10.1007/s10055-020-00475-1
Maluleke, V. H., Thakkar, N., Brooks, T., Weber, E., Darrell, T., Efros, A. A., et al. (2022). Studying bias in GANs through the Lens of race. arXiv:2209.02836, 344–360. doi:10.1007/978-3-031-19778-9_20
Narla, S., Heath, C. R., Alexis, A., and Silverberg, J. I. (2022). Racial disparities in dermatology. Archives Dermatological Res. 315, 1215–1223. doi:10.1007/s00403-022-02507-z
Nelson, B. (2020). How dermatology is failing melanoma patients with skin of color. Cancer Cytopathol. 128, 7–8. doi:10.1002/cncy.22229
Nijhawan, R. I., Jacob, S. E., and Woolery-Lloyd, H. (2008). Skin of color education in dermatology residency programs: does residency training reflect the changing demographics of the United States? J. Am. Acad. Dermatology 59, 615–618. doi:10.1016/j.jaad.2008.06.024
Noll, C., von Jan, U., Raap, U., and Albrecht, U.-V. (2017). Mobile augmented reality as a feature for self-oriented, blended learning in medicine: randomized controlled trial. JMIR mHealth uHealth 5, e139. doi:10.2196/mhealth.7943
Schwartz, K. L., Crossley-May, H., Vigneau, F. D., Brown, K., and Banerjee, M. (2003). Race, socioeconomic status and stage at diagnosis for five common malignancies. Cancer Causes Control 14, 761–766. doi:10.1023/A:1026321923883
Shorten, C., and Khoshgoftaar, T. M. (2019). A survey on image data augmentation for deep learning. J. Big Data 6, 60. doi:10.1186/s40537-019-0197-0
Stuart, J., Aul, K., Stephen, A., Bumbach, M. D., and Lok, B. (2022). The effect of virtual human rendering style on user perceptions of visual cues. Front. Virtual Real. 3. doi:10.3389/frvir.2022.864676
Stuart, J., Stephen, A., Aul, K., Bumbach, M. D., Huffman, S., Russo, B., et al. (2023). Using augmented reality filters to display time-based visual cues. Front. Virtual Real. 4. doi:10.3389/frvir.2023.1127000
Keywords: augmented reality, visual cue training, healthcare, simulation, symptoms, fidelity, realism
Citation: Stuart J, Stephen A, Aul K, Bumbach MD, Huffman S, Russo B and Lok B (2024) Developing augmented reality filters to display visual cues on diverse skin tones. Front. Virtual Real. 5:1363193. doi: 10.3389/frvir.2024.1363193
Received: 30 December 2023; Accepted: 20 May 2024;
Published: 03 July 2024.
Edited by:
Daniele Giunchi, University College London, United KingdomReviewed by:
Ilias Maglogiannis, University of Piraeus, GreeceCopyright © 2024 Stuart, Stephen, Aul, Bumbach, Huffman, Russo and Lok. This is an open-access article distributed under the terms of the Creative Commons Attribution License (CC BY). The use, distribution or reproduction in other forums is permitted, provided the original author(s) and the copyright owner(s) are credited and that the original publication in this journal is cited, in accordance with accepted academic practice. No use, distribution or reproduction is permitted which does not comply with these terms.
*Correspondence: Jacob Stuart, anBzdHVhckBlbW9yeS5lZHU=
Disclaimer: All claims expressed in this article are solely those of the authors and do not necessarily represent those of their affiliated organizations, or those of the publisher, the editors and the reviewers. Any product that may be evaluated in this article or claim that may be made by its manufacturer is not guaranteed or endorsed by the publisher.
Research integrity at Frontiers
Learn more about the work of our research integrity team to safeguard the quality of each article we publish.