 Tad T. Brunyé1,2*
 Grace E. Giles1,2
- 1U.S. Army DEVCOM Soldier Center, Natick, MA, United States
- 2Center for Applied Brain and Cognitive Sciences, Tufts University, Medford, MA, United States
Military operations are characterized by high levels of stress and uncertainty, and these states can influence cognitive and physical performance outcomes. These states, however, can be difficult to reliably induce in laboratory contexts, making it challenging to quantify and model their influences on perceptual and cognitive processes underlying performance on applied tasks. Herein we describe the development and validation of a novel scenario-based virtual reality methodology, the decision making under uncertainty and stress (DeMUS) scenario, that accomplishes four primary goals. First, it induces physiological and biochemical stress responses through a threat of shock manipulation. Second, it induces transient states of uncertainty by manipulating stimulus clarity in a perceptual decision-making task. Third, it generates several performance metrics regarding recognition memory, spatial orienting, threat classification, and marksmanship decision making. Finally, the task combines behavioral, physiological, and biochemical measures to provide a more comprehensive understanding of how stress and uncertainty influence applied task performance. To provide an initial validation of the scenario and its associated tasks and measures, we conducted a pilot study (n = 18) involving stress induction and cognitive performance assessment. Analyses revealed that: 1) the DeMUS scenario elicited tonic and phasic biochemical (salivary alpha amylase and cortisol) and physiological (heart rate, pupil diameter) stress responses, 2) the scenario elicited variable sympathetic autonomic nervous system and hypothalamic-pituitary adrenal (HPA) axis responses, and 3) stress influenced some measures of memory and decision-making in both negative and positive directions. Continuing research will assess individual- and group-level predictors of performance on these virtual reality tasks, and emerging performance enhancement techniques that can help military personnel sustain performance during stressful operations.
1 Introduction
Military training and operations expose personnel to diverse stressors across the physical and mental domains. Examples include strenuous bouts of load carriage and physical exertion, and prolonged mental states of isolation, ambiguity, danger and threat, powerlessness, and high workload (Bartone, 2006). Many of these adverse states are compounded by the operational realities of sleep loss, fatigue, thermal load, dehydration, resource limitations, and constantly changing mission demands (Adam et al., 2008; Troxel et al., 2015; Parsons et al., 2019; Sullivan-Kwantes et al., 2020). Substantial research and engineering is aimed at biosensing ongoing stress levels, predicting cognitive performance under stress, and training or technological interventions to help military personnel sustain performance under stress (Kavanagh, 2005; Taylor et al., 2008; Jha et al., 2015; Martin et al., 2019; Jensen et al., 2020; Terse-Thakoor et al., 2020; Beckner et al., 2021; Brunyé et al., 2021; Morales et al., 2021).
Given the importance of detecting, understanding, and reducing stress responses, validated laboratory methods are needed to reliably elicit stress states among military personnel and measure their influence on a range of cognitive performance outcomes relevant to military operations. To address this goal, the present paper reports efforts to develop and validate a scientifically rigorous and repeatable virtual reality methodology for eliciting and measuring the influence of stress on military-relevant task performance. For the purposes of this paper, we call this methodology the Decision Making under Uncertainty and Stress (DeMUS) scenario. The DeMUS scenario serves as a foundation for testing and evaluating novel biosensing methods, predictive performance algorithms, and performance optimization and enhancement techniques. To motivate our work, we briefly review research on stress, uncertainty, and cognitive performance, and then describe our methodology and validation data.
1.1 Stress and performance
Stress is elicited by the inherent novelty, uncontrollability, unpredictability, or threatening nature of human experience (McEwen, 2007; Gagnon and Wagner, 2016), and is considered a normal physiological and mental response to such challenges. Stress carries diverse neurotransmitter, hormonal, genomic, and immune implications through its activation of the autonomic nervous system and hypothalamic-pituitary-adrenal (HPA) axis (Axelrod & Reisine, 1984; Padgett and Glaser, 2003; Charmandari et al., 2005; McEwen, 2007; Gagnon & Wagner, 2016; Buchheim et al., 2019; Angelova et al., 2021). Two systems are generally implicated in the body’s response to stress exposure. First is a relatively rapid catecholamine response, including the release of epinephrine and norepinephrine from the adrenal medulla, which correlates with several physiological changes such as increased heart rate and blood pressure, increased blood flow to skeletal muscles, sweating, and decreased heart rate variability (Dimsdale & Moss, 1980; Doornen and Blokland, 1992; Terkelsen et al., 2005; Schwabe et al., 2012). This rapid stress response is often linked to sympatho-adrenal medullary (SAM) activity, and salivary alpha-amylase is a popular non-invasive marker of SAM system status (Chatterton et al., 1996; Nater et al., 2005; Nagy et al., 2015) Second is a relatively slow HPA response and glucocorticoid (cortisol) release, which is known to cause genomic and non-genomic effects on the central nervous system (Sapolsky et al., 2000). These two systems produce highly diverse effects on the brain, particularly in regions such as the amygdala, hippocampus, striatum, and prefrontal cortex, many of which show high catecholamine and/or glucocorticoid receptor densities (Arnsten, 1998; 2009; Roozendaal et al., 2009; Kim et al., 2015).
The diverse central nervous system effects of stress are related to highly varied effects on perception, cognition, and emotion. One method for conceptualizing stress effects on these processes is to understand the demands associated with specific mental tasks, and the intensity of experienced stressors. In a general sense, stress is thought to narrow attention towards the source of stress, detracting from attentional resources that could be allocated to a primary task (Joëls et al., 2006; Mather and Sutherland, 2011; Shields et al., 2019). On relatively basic tasks such as simple reaction time, or well-learned and rehearsed tasks that do not require cognitive control, stress can exert a positive influence on performance (Broadbent, 1971; Arnsten, 2009; Brunyé et al., 2021). This is especially the case when induced stress is mild to moderate in intensity (Hupbach and Fieman, 2012; Shields et al., 2019), which may relate to the initial rise and the peak of an inverted-U function relating stress and cognitive performance (Arnsten, 2009). On the other hand, tasks that are more demanding of executive processes, memory retrieval, and prefrontal cortical function tend to be adversely influenced by stress (Arnsten, 1998; 2009; Cerqueira et al., 2007), especially when that stress is moderate to high intensity (Shields et al., 2015; 2016; 2017). Perhaps due to high glucocorticoid receptor density in the hippocampus and/or the inherent complexity of allocentric spatial processing, spatial memory and orienting appear to be particularly impaired by moderate to high stress (Luine et al., 1994; McEwen, 2007; Schwabe et al., 2007; Richardson and VanderKaay Tomasulo, 2011; Olver et al., 2015; Brunyé et al., 2016; Gagnon and Wagner, 2016; Brunyé et al., 2019a). Given the relevance of spatial processing to military operations (i.e., during route planning and navigation), we decided to incorporate a spatial orienting and distance estimation task in the DeMUS scenario.
There are several research paradigms used to induce acute stress in laboratory settings. These include social-evaluative threat (e.g., Trier Social Stress Test), aversive images and videos (e.g., International Affective Picture System), threat of aversive shock (e.g., finger shock, torso shock), noxious noise exposure, demanding cognitive tasks, and the cold pressor test (Lang et al., 1993; 2008; Dickerson and Kemeny, 2004; Giles et al., 2014; Gamble et al., 2018). In general, the most robust and reliable subjective and physiological stress responses are induced by unpredictable physical or psychological threats. Electric shock poses both a physical threat to comfort and wellbeing, and a psychological threat given its unpredictability and resulting anticipatory anxiety. For example, relative to control conditions, moderate-intensity (but not mild) electric shock is associated with higher heart rate and lower heart rate variability, increased subjective anxiety ratings, hypervigilance to threat, and increased aversive processing (Dickerson and Kemeny, 2004; Grillon et al., 2004; Hansen et al., 2009; Robinson et al., 2011; Patton et al., 2013; Patton and Gamble, 2016). In the most comprehensive review and meta-analysis of stress induction methods to date (Dickerson and Kemeny, 2004), the authors consider threat of shock one of the more intense physical and psychological stressors that can be employed in laboratory settings. However, no studies have examined human alpha amylase (SAM) response to threat of shock, and only two studies have examined human cortisol responses to threat of shock (Berghorst et al., 2013; De Berker et al., 2016). In those studies, unpredictable mild (Berghorst et al., 2013) or moderate (De Berker et al., 2016) finger shock caused sustained cortisol responses relative to the control (no shock) conditions. Given these results and the fact that physical and psychological stress characterize military operations, we decided to use electric shock to elicit stress. However, because the DeMUS scenario involves participants using both hands to complete tasks, we chose to administer shock via torso belt; to our knowledge, no study has specifically examined how this form of shock influences alpha amylase or cortisol responses, though we do know that it can alter decision criteria (Patton et al., 2013).
1.2 Uncertainty and decision making
Most decisions are made with some degree of uncertainty that arises from a failure to control attention, inadequate understanding, incomplete information, failure to retrieve memory, or poorly-differentiated alternatives (Lipshitz and Strauss, 1997; Gigerenzer, 2008; Heekeren et al., 2008). In high-stakes contexts, decision uncertainty is very common: law enforcement officers show uncertainty when distinguishing handheld objects as weapons or non-weapons, airport security screeners experience uncertainty when discriminating threatening versus non-threatening objects in luggage, and physicians experience uncertainty when interpreting challenging medical cases (e.g., in pathology and radiology) (Payne, 2001; McCarley et al., 2004; Brunyé et al., 2017; Brunyé and Gardony, 2017). One reliable method to elicit uncertainty in laboratory contexts is using a perceptual decision-making task, which measures how people accumulate sensory evidence and use it to categorize the world (Heekeren et al., 2008; Green & Heekeren, 2009; Shadlen and Kiani, 2013; Brunyé and Gardony, 2017). Recent theories of perceptual decision making propose that four complementary and interactive systems are engaged during this type of task. First, information is gathered and compared via sensory systems (visual, tactile). Second, when uncertainty is encountered, attention will be further deployed and constrained towards information gathering. Third, accumulated evidence is compared against memory and a motor response is prepared (and/or executed). Finally, a feedback loop monitors performance by judging outcomes and adjusting behavior.
To elicit uncertainty during perceptual decision-making tasks, studies typically vary the ambiguity of stimuli presented during a somewhat simple perceptual discrimination task. For example, one common methodology is to ask participants to distinguish between visually-presented faces, houses, or cars (Heekeren et al., 2004; Philiastides and Sajda, 2006; Philiastides et al., 2011; Brunyé and Gardony, 2017). In many cases, distinguishing these classes of objects would be rather simple; however, in these tasks the clarity of stimuli is manipulated by altering image phase coherence (Filimon et al., 2013) or opacity (Brunyé and Gardony, 2017), effectively reducing image clarity and increasing the confusability of categories. This type of perceptual decision-making task tends to reliably elicit varying levels of accuracy (i.e., lower decision accuracy with lower image clarity) and confidence (i.e., lower confidence ratings with lower image clarity). Lower image clarity also tends to increase frontal brain activity, increase the number or duration of eye fixations on a stimulus, reduce eye blink rate, and increase phasic pupil diameter (Zelinsky and Sheinberg, 1995; Hooge and Erkelens, 1996; Krajbich et al., 2010; Fiedler and Glockner, 2012; Brunyé & Gardony, 2017). In the DeMUS scenario, we adopted the model of perceptual decision making to elicit uncertainty in a manner relevant to military personnel: discriminating between enemy and friendly targets based on camouflage patterns worn by virtual targets.
2 DeMUS scenario overview
The DeMUS scenario involves participants performing four primary tasks, outlined below. The first involves learning all task-related stimuli to criterion, and then the second to fourth tasks were selected given evidence that acute stress influences memory retrieval (Schwabe et al., 2012; Gagnon and Wagner, 2016; Shields et al., 2017), spatial processing (Duncko et al., 2007; Richardson and VanderKaay Tomasulo, 2011; Olver et al., 2015; Brunyé et al., 2016; Keller et al., 2020), and decision making (Edland and Svenson, 1993; Starcke and Brand, 2012; Pabst et al., 2013; Flin et al., 1997; Gamble et al., 2018), all of which are highly relevant to military operations.
1) Criterial Learning Tasks (CLT). Participants learn task-related stimuli to a pre-specified criterion. The learning phase ensures that all participants have sufficiently and similarly learned all task-related stimuli. Specifically, during this phase participants learn targets to search for during the recognition memory task (RMT), a map of the virtual environment layout to support the spatial orienting task (SOT), and how to distinguish friendly from enemy camouflage patterns to support the shoot/don’t-shoot decision-making task (DMT).
2) Recognition Memory Task (RMT). For this task, participants are placed in a series of locations within the virtual environment and asked to search for previously learned targets (e.g., people, vehicles, graffiti markings). In military terms, the RMT involves recognizing targets on a Be On the Lookout (BOLO) list.
3) Spatial Orienting Task (SOT). For this task, participants are placed in a series of locations within the virtual environment and asked to orient themselves towards waypoints. For example, a participant might be placed next to the Theater and asked to point in the general direction of the Park. They are then asked to estimate the distance to that waypoint, in meters.
4) Shoot/Don’t-Shoot Decision-Making Task (DMT). For this task, participants are asked to discriminate friendly versus enemy targets based upon the camouflage pattern displayed on a virtual avatar. An animated soldier-style avatar walks towards the participant in the virtual environment, and the participant must decide to shoot the target (enemy) using a gaming rifle, or let it pass (friendly).
The CLT is performed on a standard desktop computer and monitor prior to entering the virtual reality system, whereas the RMT, SOT, and DMT are performed in an immersive virtual reality system.
2.1 Task development and pilot testing
Developing the four tasks outlined above (CLT, RMT, SOT, DMT) generally involved task programming, software testing, and pilot testing. Because we aimed to use the DeMUS scenario in studies employing a repeated-measures design, we developed four versions of each task.
Note that the stimuli used in the CLTs were contingent upon the RMT, SOT, and DMT development, so we describe those first and then turn to the CLT.
2.1.1 Recognition memory task (RMT)
The RMT was developed to test intentional learning and recognition memory (Eagle and Leiter, 1964; Shepard, 1967). For this test, we evaluated whether participants could distinguish between old (learned) and new (unlearned) images in virtual reality. We consulted with experienced military personnel to understand the objects they might typically search for in real-world scenes, and how we might adequately represent these objects in virtual reality. Five main object categories were identified: people, vehicles, bomb-making materials, improvised explosive devices, and graffiti markings. Using the Unity 3D gaming engine (Unity Technologies, San Francisco, CA, United States) and the 3ds Max software (Autodesk, Inc., San Rafael, CA, USA), we designed a total of 120 stimuli across the object categories (30 per each of the four task versions). Half of the stimuli were to be studied in the CLT, with each of those stimuli paired with a similar-looking stimulus to be used as lures. For example, the same vehicle model but in a different color, or a similar-looking graffiti marking with slightly different features (see Figure 1).
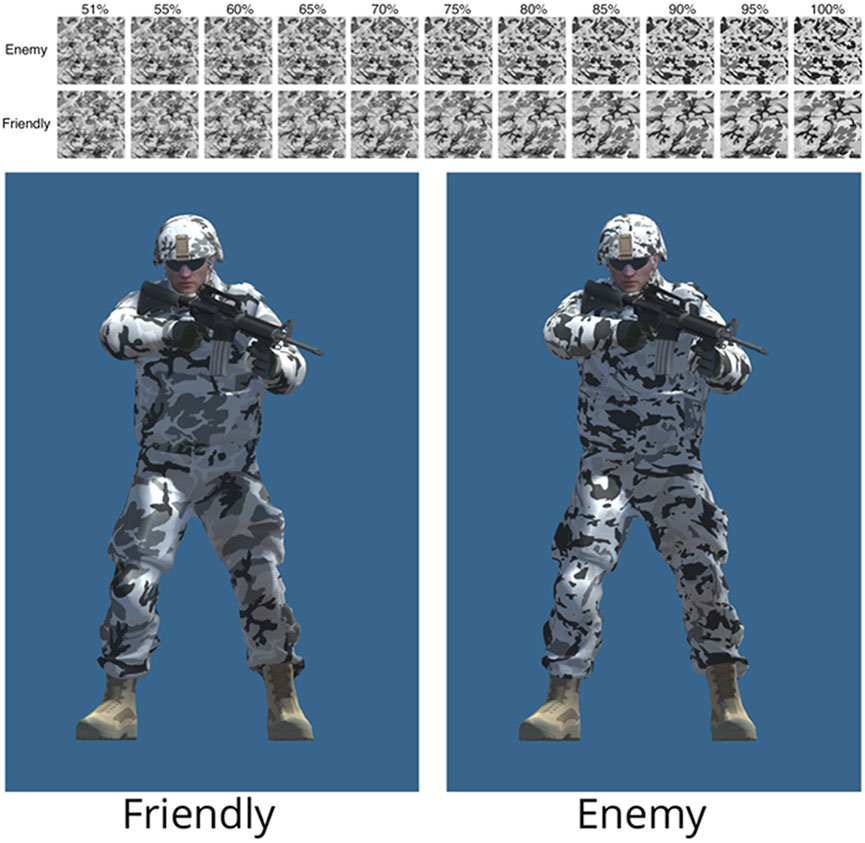
FIGURE 1. An example (from test version 1) of the eleven levels of opacity shifting for the enemy and friendly camouflage pattern pilot testing (upper panel), and an example of the original (100%) versions of the friendly and enemy patterns adorning an avatar.
To ensure that the stimuli were memorable and the lures marginally confusable, that the four task versions were similarly challenging, and to identify an adequate performance criterion for the CLT, we conducted a pilot study (n = 12). In this study, participants studied pictures of 15 objects presented one at a time on a computer monitor for 5 seconds each. After this learning phase, participants completed a 30-s filler arithmetic task (retention interval), and then were tested on their memory for the studied objects. During the test, they were presented with 30 stimuli one at a time on the computer monitor in random order, and asked to decide whether each stimulus was old (previously studied) or new (unlearned); 15 of the tested stimuli were old, and 15 were the similar but new objects (lures). We set an accuracy criterion at .8 hit rate; if a participant did not achieve this level of performance, they would repeat the study and test sequence.
In general, 11 of the 12 participants were able to achieve a hit rate of at least .8 and false alarm rate below .14 on their first learning attempt; one participant scored a .73 hit rate (and .07 false alarm rate) on their first attempt and needed a second attempt at learning (after which they achieved a perfect hit rate while maintaining the same false alarm rate). The overall hit rate across all four versions of the task was high (M = .91) and corresponds to missing approximately 1.42 of the 15 old items. The overall false alarm rate was low (M = .08) and corresponds with false alarming on approximately 1.25 of the 15 lures. Both hit and false alarm rates were very similar across the four versions of the task, as detailed in Table 1 and confirmed by non-significant one-way analyses of variance (ANOVA) for hit rate, F (3, 11) = .13, p = .94, and false alarm rate, F (3, 11) = .21, p = .89.
TABLE 1. Mean, standard deviation (SD), and minimum and maximum hit rate and false alarm rates for the RMT, reported separately for each of the four task versions.
We chose to adopt these four task versions, and the .8 hit rate (and <.2 false alarm rate) criterion, for use in our scenario without modification. While overall performance was high on the task, we anticipated that it would be lower in the context of our full study given a longer retention interval, other learning (SOT, DMT) demands, and the relatively high visual complexity of the virtual environments where stimuli would be placed during testing.
2.1.2 Spatial orienting task (SOT)
The SOT was developed to test the ability to orient the body within large-scale space, which involves retrieving allocentric memory of the environment, transforming allocentric memories to the egocentric frame of reference, relating perceived and remembered cues, and rotating the body to face an estimated direction (Kozlowski and Bryant, 1977; Shelton and Mcnamara, 2001; Allahyar and Hunt, 2003). For this test, we evaluated whether participants could point in the general direction of a cued waypoint while standing at different locations in a previously learned environment, and then estimate the distance to the cued waypoint. For this task we needed to first develop four versions of a large-scale urban environment in Unity 3D. To do so, we used the CScape City System (OliVR, Unity Asset Store) to generate four urban virtual environments (each measuring approximately 2.7 km2, see Figure 2), each with unique combinations of buildings and road networks. We then distributed 10 landmarks evenly throughout each environment (e.g., hotel, park, post office, toy store), using labeled building facades that visually matched the landmark function (e.g., the toy store had a “toy store” label and pictures of toys on the façade). We chose to use 10 landmarks given earlier research showing that this number of landmarks tends to produce below-ceiling and variable (across participants) memory performance (Bruns and Chamberlain, 2019; Franke and Schweikart, 2017; C. D; Smith, 1984; Werkhoven et al., 2014).
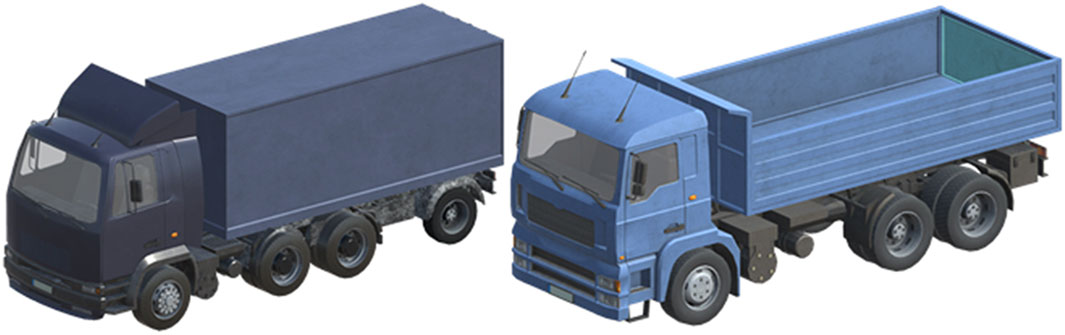
FIGURE 2. Example learned (old, left) and lure (new, right) stimuli developed for use in the RMT.
For the SOT we developed a series of 10 orienting trials for each of the four test versions. During each trial, the participant would be placed at one of the ten learned landmarks (e.g., hotel) in the virtual environment (i.e., placed in the road, facing the landmark), and asked to point in the general direction of a cued target landmark (e.g., post office). To create the landmark pairs (e.g., hotel—post office), we began with a reference landmark (e.g., hotel) and randomly sampled from the remaining landmarks without replacement. In this manner, each landmark served as both a reference and target once. For each landmark pair there existed a correct angle (e.g., 158˚ for the hotel—post office pair), and distance (e.g., 640 m for the hotel—post office pair) between the two landmarks.
We conducted a pilot study to identify an adequate performance criterion that could be reasonably expected of participants and adopted for use with the CLT. Each participant studied a single labeled map of the virtual environment for 3 min (on the computer screen), performed a 30-s arithmetic filler task, and then were asked to reconstruct the map from memory. Map reconstruction involved displaying the studied map devoid of landmarks and asking participants to drag each of 10 labeled landmark markers from a list into their correct positions on the map. From these data, we measured the distance (in pixels) between the placed markers and their correct locations. Each participant performed this task twice in succession, allowing us to examine how knowledge and error rates might change with repeated study. Table 2 (upper) details the overall results from this pilot study. A one-way ANOVA demonstrated that the four test versions did not differ significantly in mean distance error for the first attempt, F (3, 8) = .16, p = .92, or second attempt, F (3, 8) = .89, p = .51. A repeated-measures ANOVA, however, demonstrated that the second attempt showed significantly lower distance error than the first attempt, F (1, 8) = 38.27, p < .001.
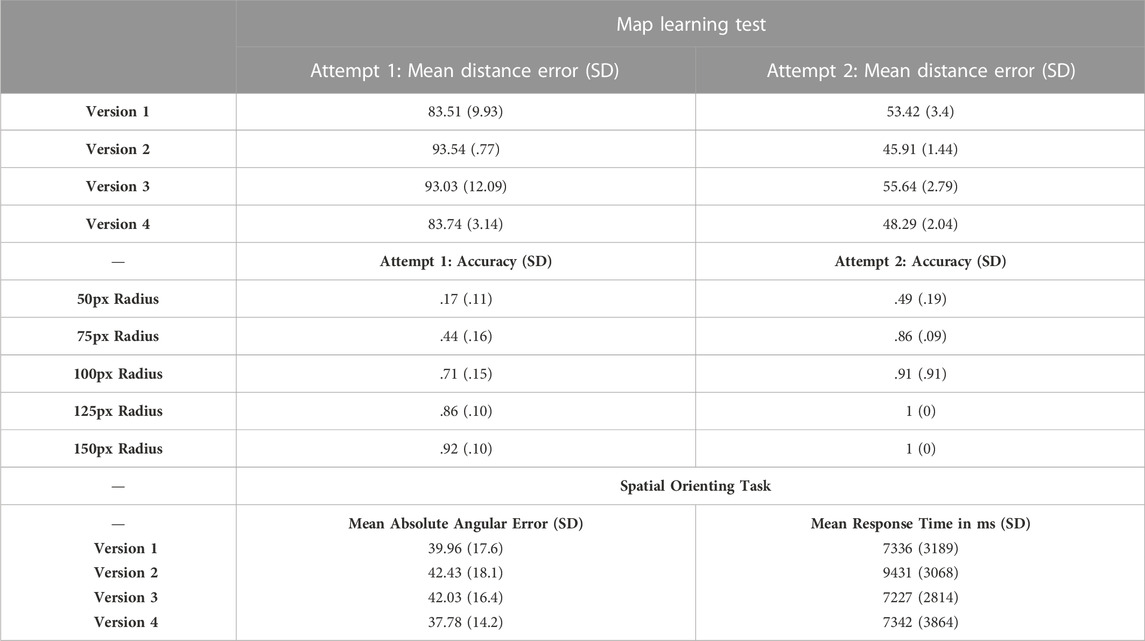
TABLE 2. Upper: Mean, standard deviation (SD), and minimum and maximum distance error (in pixels) for the map learning criterial learning test (for first and second learning attempts), reported separately for each of the four task versions. Middle: Mean and standard deviation accuracy level by distance criterion (in pixels), for the two learning attempts on the map learning pilot test, separated by the four task versions. Lower: Mean absolute angular error and response times (with standard deviation) during the spatial orienting task, separated by the four task versions.
We also evaluated the effect of setting various distance scoring criteria (Table 2, middle) on overall accuracy in placing landmarks. For these calculations, we assigned a radius (in pixels) around the correct landmark location (e.g., 50px, 75px), and then scored each placed landmark as falling within or outside of the radii.
As would be expected, accuracy increased with a more liberal radius criterion. After the first attempt, accuracy reached above .8 with a 125px radius; in other words, at least eight of the 10 landmarks placed on the map were within 125px of their correct location. With the 125px radius, seven of the eight participants reached .8 accuracy or higher on the first attempt; the one participant who did not reach .8 accuracy required a second attempt, after which they achieved perfect accuracy with the 125px radius criterion. Given these data, for the CLT we decided to use a 125px radius with the requirement that participants reach .8 accuracy. This level of accuracy should reflect spatial knowledge sufficient to support orienting in the SOT component of the DeMUS scenario.
To test this possibility, we conducted a separate pilot study (n = 8) that involved learning one of the four maps to criterion (.8 accuracy with a 125px radius) and then orienting in the virtual environment. After learning to criterion, participants stood in the large-scale virtual reality system and were virtually placed standing in front of each of the 10 landmarks in random order. At each position they were asked to point towards one of the other nine landmarks by rotating their body (yaw change, using a thumb joystick) towards the second location (e.g., standing at the hotel and pointing towards the post office). They pressed a button on a wireless game controller to confirm an orientation response, and then continued to the next trial. The Unity 3D software automatically logged pointing direction, and we calculated absolute angular error between pointing direction and correct direction to the cued landmark. Table 2 (lower) details mean (ranging from 0° to −180°) absolute angular error for each of the four versions of the task (i.e., the four environments).
As detailed in Table 2 (lower), mean angular error rates were very similar across the four versions of the task (within about 5° error of one another), as were response times (within about 2 s of one another). This pattern was confirmed in a non-significant one-way ANOVA comparing task versions for angular error, F (3, 7) = .48, p = .72, and response time, F (3, 7) = 1.77, p = .29. In examining the 10 trials per participant, most trials (M = 6.5 of 10 trials) were answered within 45° of the correct orientation; in fact, only three of the eight participants did not answer more than half of the trials within a 45° threshold. One participant answered only four of the 10 within that threshold, and the other two answered five of the 10 within that threshold. Given that most participants were able to respond to most trials within approximately 45° of the correct orientation, that angular threshold was chosen for determining when a shock would be administered in our DeMUS scenario (i.e., shock administered when absolute pointing error >45°).
2.1.3 Decision-making task (DMT)
Our decision-making task was inspired by research tasks used to probe perceptual decision making and elicit variable uncertainty (Heekeren et al., 2004; 2008; Green and Heekeren, 2009; Brunyé and Gardony, 2017). In our version of the task, participants distinguished between enemy and friendly versions of a camouflage pattern. We developed four versions of this task, each with two grayscale camouflage patterns that were sufficiently distinguishable from one another. To develop the camouflage patterns, we used a publicly-available binary space partitioning algorithm (Åström, 2011), and then manually modified the pattern features in Photoshop (Adobe Inc., San Jose, CA, USA). For example, we needed to make each pattern capable of vertically repeating, and ensure that the two versions (enemy, friendly) of each of the four pattern versions had similar distributions of each grayscale component. Example camouflage images can be found in Figure 2. To introduce uncertainty, we used Photoshop to layer the friendly and enemy camouflage patterns atop one another and vary the top layer opacity. For a pilot study, we varied the opacity across 11 levels for each of the two patterns: 100% (original), 95%, 90%, 85%, 80%, 75%, 70%, 65%, 60%, 55%, and 51% (Figure 2). In this manner, even if the patterns may be indistinguishable at a 51% opacity (i.e., lowest clarity), there was always an objectively correct answer (e.g., friendly if the pattern is 51% friendly and 49% enemy).
For each of the four versions of 22 camouflage patterns, we used the Unity 3D gaming engine to wrap a virtual avatar (of a military member) with the pattern, adoring the uniform and helmet (Figure 2).
We used the 22 versions of each camouflage version (11 friendly, 11 enemy) to conduct a pilot study (n = 16) examining psychometric functions relating image clarity level and accuracy. The goal of the study was to identify image clarity levels for each version that would reliably elicit high uncertainty, moderate uncertainty, and low uncertainty, to be used in the DeMUS scenario. In the pilot study, we presented participants with the two canonical (100%) versions of enemy and friendly camouflage patterns simultaneously on a computer monitor, labeled Enemy and Friendly (Figure 2, lower panel). Participants studied the two images for 3 minutes and then completed a recognition test. The recognition test involved presenting the 22 versions of the patterns one at a time on the computer monitor and asking participants to rate each pattern on a 10-point scale ranging from −5 (definitely friendly) to 5 (definitely enemy). In this manner, we could assess both binary accuracy (i.e., −1 to −5, and 1–5) and confidence of responses. This process of studying two patterns and being tested on 22 versions of the patterns was repeated four times, once for each version of camouflage patterns.
To analyze the data, we plotted psychometric functions relating the image clarity to the probability of responding friendly (converting scale responses to binary); we also assessed confidence ratings. Figure 3 depicts a psychometric function for one of the four stimulus versions. For each version of the test, we selected six stimuli to use in the DeMUS scenario: three enemy stimuli eliciting low, moderate, and high uncertainty, and three friendly stimuli eliciting the same. To do so, we examined the psychometric function and selected the two stimuli closest to .5 probability (high uncertainty), the two closest to .75 probability (moderate uncertainty), and two at ceiling performance (low uncertainty).
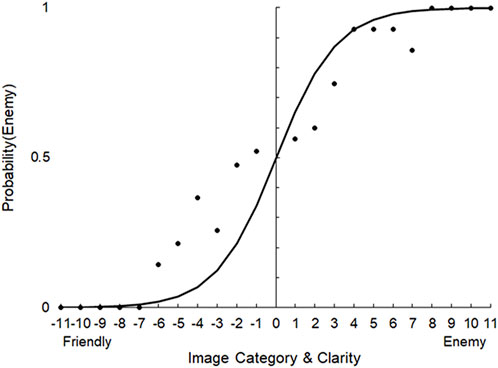
FIGURE 3. Psychometric function relating image category (friendly versus enemy) and image clarity (−11 to 11) to the probability of a participant categorizing the image as Enemy during the DMT pilot study (stimulus version 1).
For example, for the test version corresponding to data depicted in Figure 3 we selected levels −1 and 1 (high uncertainty), levels −4 and 3 (moderate uncertainty), and levels −11 and 11 (low uncertainty). For this version of the test, these levels corresponded to (respectively) 51% enemy and 51% friendly, 65% enemy and 60% friendly, and 100% enemy and 100% friendly. For these six selected stimuli, we verified that confidence ratings (on the 6-point scale) were different across the levels. The values were as follows: Enemy 51% (M = 1.4, SD = .52), Friendly 51% (M = 1.9, SD = .74), Enemy 65% (M = 2.8, SD = .63), Friendly 60% (M = 3.0, SD = .82), Enemy 100% (M = 4.4, SD = .70), and Friendly 100% (M = 4.5, SD = .53). Thus, the clarity manipulation successfully modulated rated uncertainty, as expected.
A repeated-measures ANOVA with two factors, stimulus category (2: enemy, friendly) and image clarity (3: low, moderate, high) demonstrated that confidence ratings varied as a function of image clarity, F (2, 18) = 92.79, p < .001, but not stimulus category, F (1, 9) = 1.12, p = .32. This same process was followed for the other three versions of camouflage patterns, to achieve a total of 24 patterns (six per each of four versions) while conforming to the same accuracy and confidence rating criteria (and statistical testing). These final patterns were carried forward to be used in the DMT portion of the DeMUS scenario.
2.1.4 Criterial learning task (CLT)
The CLT was designed to ensure that participants learned the required stimuli before beginning each of the three DeMUS scenario tasks: the RMT, SOT, and DMT. We developed the CLT study and testing materials in Unity 3D, which provided a framework for presenting stimuli, recording and evaluating test responses, and readministering tests as necessary to reach the task-specific criterion. Four versions of the CLT were developed, one for each version of the RMT, SOT, and DMT.
For the RMT phase of the CLT, participants were presented with a series of 15 stimuli to study; each of the four versions of the CLT used a unique set of 15 RMT stimuli. Each stimulus was presented one at a time in the center of a 24″ computer monitor running at 1920 × 1,080 resolution, in random order, for 5 s each. After studying the 15 stimuli, participants completed a filler task (solving simple arithmetic problems) for 30 s, and then were tested on their memory for the stimuli. During the test, 30 stimuli were presented including the 15 studied stimuli and 15 lures that were designed to look like the studied stimuli (e.g., a grey van versus a brown van). Each test stimulus was presented one at a time in the center of the computer monitor, in random order, and the participant was asked to respond yes or no to the question “Have you seen this item before?” in a self-paced manner (by clicking a corresponding button on the screen). If the participant received an accuracy level (hit and correct rejection rate) lower than .80 (i.e., responding yes to fewer than 12 old items, and/or responding no to fewer than 12 lures), they repeated the study-test cycle until their performance reached the two performance criteria.
For the SOT phase of the CLT, participants were presented with a map of the virtual environment; each of the four versions of the SOT used a unique map. The presented map had labeled icons to indicate landmark positions and was presented for a 3-min study period, in the center of the computer monitor. After studying the map, participants completed the arithmetic filler task for 30 s, and then were tested on their memory for landmark positions. During the test, an empty (i.e., no landmark icons) map was displayed on the computer monitor, along with a list of landmark names to the side of the map. Participants were instructed to “place all of the landmarks back in their correct locations,” and to do so, they clicked and dragged (with the computer mouse) each landmark icon onto the map. Once they finished placing landmarks, they pressed a “submit” button. Immediately after pressing submit, they were told whether they passed or failed the test, and then given feedback about landmark positions. For the feedback, the map was displayed with their placed landmark positions, and for any incorrectly placed landmark (i.e., exceeding 125px from the correct location, as determined in our pilot study), red lines were drawn from the landmark to the correct position, indicating where they should have placed the landmarks. At that point, if the participant did not place at least eight of the landmarks into a position within 125px of its correct location, they repeated the study-test cycle until their performance reached criterion.
For the DMT phase of the CLT, participants were presented with the two canonical (100%) versions of the friendly and enemy camouflage patterns; each of the four versions of the DMT used a unique pairing of camouflage patterns, as described previously. The presented enemy-friendly pair was labeled and presented in the center of the computer monitor for 3 min. Participants then completed a 30-s arithmetic filler task and were tested on their memory for the camouflage pairing. During the test, the low uncertainty (always 100%) and moderate uncertainty (typically 60%–70% but varied based on version, as detailed in pilot testing section) versions of the patterns were presented, one at a time on the computer monitor, in random order. Participants were instructed to “as quickly and accurately as you can, choose whether the camouflage pattern you see more closely resembles that of a friendly or enemy.” Responses were provided by clicking a labeled button corresponding to one of the two options (enemy, friendly). A total of 16 trials were presented, repeating each of the four patterns four times. Over the sequence of 16 successive trials, participants were required to meet the .8 accuracy criterion by correctly categorizing at least 13 of the 16 stimuli. If they did not reach this accuracy level, they repeated the study-test cycle until their performance reached criterion. Note that participants were never exposed to the high uncertainty stimulus versions during the DMT.
3 DeMUS scenario development
We built a set of virtual reality tasks that would demand the application of knowledge gained during the CLT to a military-relevant scenario. To do so, we developed four versions of a scenario using the Unity 3D gaming engine; the scenario had three phases corresponding to the three tasks: RMT, SOT, and DMT. The RMT and SOT trials were temporally interleaved (i.e., Trial 1 RMT then SOT, Trial two RMT then SOT, and so forth), and the DMT stood alone.
The DeMUS scenario was centered around a fictitious military vignette in which participants would need to scan their local environment for potential threats (i.e., find the objects they learned for the RMT), direct coalition forces around the environment by pointing towards waypoints and estimating their distance (i.e., point and estimate distance to the landmarks they learned for the SOT), and guard an entry control point where they need to decide whether to let approaching personnel pass or engage (fire upon) them with a replica airsoft rifle (i.e., distinguish friendly versus enemy using the pattern distinctions learned for the DMT).
3.1 Virtual reality system
The scenario was executed in a large-scale rear-projection virtual reality system with approximately 220° horizontal and 90° vertical field of view, made possible by an array of five viewing panels. The virtual reality system uses the Unity 3D gaming engine to display dynamic virtual content across the five panels, each running at 1920 × 1,080 resolution; for this study, the system was used in monocular (i.e., not 3D) mode to ensure compatibility with our eye tracking glasses (described later). Participants stood on a rumble platform that uses an array of low frequency audio transducers to vibrate the platform in response to low frequency sound events (e.g., explosions, vehicles). They held an airsoft rifle with electric recoil (model M4A1, KWA, Inc., City of Industry, CA) modified to use a Logitech (Laussane, Switzerland) wireless game controller mounted to the handrail of the rifle; this controller had a thumb joystick (to use with the thumb), and we configured (soldered and wired) two response buttons on the weapon: one mounted to the handrail (to use with the index finger), and one mounted behind the trigger (to send a button press command when trigger was pulled). The Bluetooth controller communicated with the computer running Unity 3D to recognize and log participant responses (button presses, thumb joystick inputs, trigger pulls). The rifle was equipped with an array of four retroreflective marker balls that were tracked using six TRACKPACK/E infrared motion tracking cameras, controlled using DTrack software (both from ART, Advanced Realtime Tracking, GmbH, Weilheim, Germany). This allowed all rifle movement to be tracked with six degrees of freedom (xyz and roll, pitch, yaw), which is necessary for translating the weapon aiming vector into the virtual environment.
3.2 RMT and SOT trials
The scenario began with a series of ten interleaved RMT and SOT trials, one for each landmark in the environment. During a trial, the participant would appear in the virtual environment at the ground-level perspective in the center of the road next to one of the ten landmarks (e.g., hotel), with a compass rose (depicting current orientation relative to cardinal directions NSEW) depicted in the lower half of the scene. Translational (forward/back/left/right) and pitch (up/down) movement were restricted during this phase: participants could only change their orientation (yaw) within the environment to look around. To control orientation, participants used the thumb joystick mounted to the handgrip of the rifle to rotate their orientation upon the virtual scene (in doing so, they could rotate across the entire 360° scene). The participant was provided with 30 s to scan the scene and identify any suspicious objects that they had previously studied for the RMT (e.g., a vehicle, person, graffiti marking).
Each location had one old (previously studied) object or one new (lure) object; across the 10 trials there were five old objects and five new objects. If the participant identified what they believed to be an old object, they were instructed to mark the object with their weapon by aiming at it and pressing a button mounted on the handrail of the rifle; when doing so, a green arrow would appear above the object to indicate successful marking. If the participant accidentally marked an object, they could remove the marking by reselecting the object.
After the 30 s elapsed (indicated by a countdown timer in the scene), participants were given an SOT trial while continuing to stand at the same location in the environment (e.g., hotel). From that location, participants were asked to point in the general direction (as the crow flies) of a second landmark (e.g., post office), as depicted in Figure 4. To do so, they used the thumb joystick to rotate and point a green arrow (overlaid onto the scene) in the general direction of the target landmark, and then confirm their answer using the button on the handgrip. Participants were then asked to rate their confidence in the pointing estimate on a scale from 1 (least confident) to 5 (most confident) by using the thumb joystick to move between options and the pressing the button to confirm a response. If the participant’s orienting response was not within 45° of the correct direction, the software would send a trigger to activate the torso shock (described in more detail in a subsequent section).
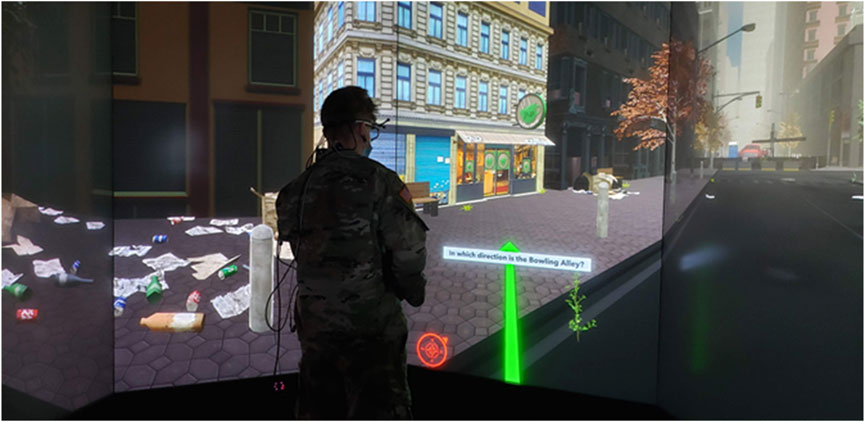
FIGURE 4. An example trial during the SOT, during which the participant is placed adjacent to a landmark (e.g., coffee shop) and is asked to point in the general direction of a target landmark (e.g., bowling alley). Compass rose depicted at lower center.
Finally, the participant was asked to estimate the distance, as the crow flies, from their current location (e.g., hotel) to the same target landmark (e.g., post office). To do so, they were presented with a slider on the screen that ranged from 1 to the maximum distance between two landmarks in the environment, in meters (e.g., 1,830 m). Participants used the thumb joystick to move a slider from left to right to provide a numerical distance estimate and the button to confirm a response; they then rated their confidence in the distance judgment, using the same confidence rating scale. The SOT was self-paced, with no time limits for the orienting or distance estimation phases. This process of arriving at a landmark location, looking for old objects (RMT), and then pointing and estimating distances to another landmark (SOT) was repeated 10 times, once for each of the environment’s landmarks.
3.3 DMT trials
When the 10 RMT and SOT trials were completed, participants began a series of 15 DMT trials corresponding to one of the four task versions. There were two trials for each of the six patterns (12 total), and three additional trials with three randomly chosen patterns (15 total). The three additional trials were included to avoid an exact 50% proportion of friend/foe trials, reducing the likelihood of probability matching and strategic response shifts towards the end of the task (Edwards, 1956; Meyers, 2014).
For the DMT, participants were virtually located in a relatively open virtual urban scene, standing on a road that continued forward from their position (Figure 5), with an intersecting road about 50 m ahead. Aversive ambient sounds were played through the VR system, including gunshots, explosions, and helicopter noises. The participant’s view of the scene was fixed, and their pitch, yaw, and translational movement were restricted. On a given trial, a potential target could emerge (begin walking) from one of three locations in the scene: from the left or right side of the intersecting road, or from straight ahead in the distance (about 100 m ahead). The potential target would emerge, walk to the central road (if emerged from left or right), and begin walking towards the participant’s position at a walking pace of about 1 m/s. The potential target was holding a rifle in the relatively unthreatening “low-ready” position (pointing down towards the ground), and wearing one of the six camouflage patterns (three friendly, three enemy). The participant was asked to examine the camouflage pattern and decide whether the avatar was more likely a friendly or enemy; based on their perceived evidence, they would indicate a decision by either allowing the avatar to “pass” (by pressing the button on the weapon’s handgrip), or shooting at the avatar (by aiming the rifle and pulling the trigger). They were asked to make the pass or shoot decision before the avatar reached the horizontal red line overlaid onto the scene (Figure 5).
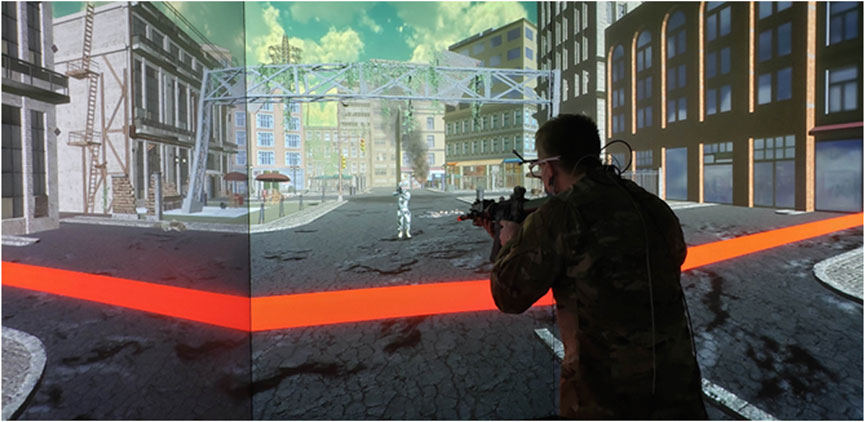
FIGURE 5. An example DMT trial, with a potential target approaching the participant. The participant has raised their weapon, usually in preparation to fire upon the target.
If the participant chose to let the avatar pass, they would press the button and a message told to pass would appear on the screen. If the participant chose to shoot the avatar, they would fire rounds with the airsoft rifle until the avatar responded by falling to the ground. Any shot placement on the body of the avatar was sufficient to make the avatar fall, and typically only one shot was required to defeat the target (unless the rifle was inadequately aimed). Immediately after a pass or shoot decision was made, an on-screen confidence rating scale would appear, asking the participant to rate their confidence in the decision; the scale ranged from 1 (least confident) to 5 (most confident), and participants used the thumb joystick to move between options and pressed the button to confirm a response. If the participant’s decision was incorrect (i.e., a miss or false alarm), the Unity 3D software would send a trigger to wirelessly activate the torso shock at this time (described in more detail in a subsequent section). This process repeated for each of the 15 DMT trials, which were randomly paired with an entrance location (scene center, left, right) and presented in random order.
4 Threat of shock and DeMUS measures
To induce anticipatory anxiety and stress in participants, electric shock was delivered using a StressX PRO Belt (StressVest, Winnipeg, Canada) worn around the torso. This belt has the capability to deliver up to 4,500 V at less than 1 mA over a maximum discharge duration of 150 m (maximum joules .092 or 92 mJ). The belt uses five amperage-modulating intensity settings ranging from lowest (1) to highest (5) shock intensity. The rechargeable device is triggered wirelessly by a rechargeable base station connected to the virtual reality computer via USB.
The StressX PRO Belt also can be switched to a vibrate-only mode, allowing close experimental comparisons of conditions involving shock versus no-shock; specifically, the participant physically dons the belt, the belt is powered on, and task-related feedback (i.e., shock or vibrate upon incorrect decision) is maintained in both conditions.
To understand the effects of stress, the DeMUS scenario incorporated a range of devices and performance measures. Temporal synchronization of streaming data from each device was done using Lab Streaming Layer and LabRecorder (Kothe et al., 2021).
Behavioral task responses were logged by the Unity 3D software including all button presses, thumb joystick movements, and trigger pulls. During the RMT, participant orientation on the scene and all marked objects were logged including object identity and marking time. During the SOT, participant orientation on the scene, button presses, confidence ratings, and distance estimates were logged including the nature of the response and time stamp. During the DMT, button presses, trigger pulls, and confidence ratings were logged including the nature of the response and time stamp. Together, these behavioral measures allowed us to calculate signal detection measures, pointing and distance estimation accuracy, confidence, and response latencies.
Eye tracking was performed using a pair of SMI, Inc. (formerly of Boston, MA) Eye Tracking Glasses (ETG2). These glasses collect binocular eye position data at 60 Hz from an array of infrared lights and cameras embedded in the frame of specially designed eyeglasses. Data were streamed from the glasses via USB to a computer running the SMI iView software to manage a manual three-point calibration process and receive streaming data from the device and transfer it to Lab Streaming Layer over wired local area network (LAN). Due to difficulty managing spatial drift of the eye tracker calibration relative the VR scene without repeated (e.g., once a minute) calibration/validation, we restrict our analyses to pupil diameter over time and do not consider eye fixation position. Pupil diameter allowed us to assess tonic pupil responses to the stress induction, and phasic pupil responses during discrete torso shock events.
Cardiac physiology was measured using a Zephyr BioModule device and chest strap (Medtronic, Boulder, CO). This device records several cardiorespiratory measures including heart rate, heart rate variability, and respiration rate. The device communicates via low energy Bluetooth to a computer running Lab Streaming Layer, where data are temporally synchronized with behavioral and eye tracking data. Data derived from the BioModule device allowed us to assess the physiological influence of stress induction on basic measures of cardiac physiology.
In addition to measuring cardiac physiology, the DeMUS scenario involved intermittently assessing two salivary biomarkers of stress: alpha amylase and cortisol. As discussed in Section 1.1, salivary alpha amylase is an increasingly popular biomarker for assessing SAM activity in response to stress (Chatterton et al., 1996; Nater et al., 2005; 2006; Nagy et al., 2015; Ali and Nater, 2020). Alpha amylase is a salivary enzyme that acutely increases during stress (Chatterton et al., 1996; Nater et al., 2005), reflecting engagement of the sympathetic nervous system (Ditzen et al., 2014) and more specifically, noradrenergic activity (Nater & Rohleder, 2009). Herein, we leverage these attributes of salivary alpha amylase to measure early SAM-related stress responses. To measure the relatively latent HPA-related stress response, we also assessed salivary cortisol levels in response to our scenario. Salivary free cortisol is a commonly used measure of an HPA-related stress response (Sapolsky et al., 2000), with increases resulting from the secretion of glucocorticoids from the adrenal cortex (S. M. Smith & Vale, 2006); supporting this mechanism, salivary cortisol levels correlate very strongly (i.e., r = .9) with plasma cortisol (Teruhisa et al., 1981; Levine et al., 2007).
The time course of salivary alpha amylase and cortisol responses to stress are very different. Salivary alpha amylase rises in response to stress rapidly and transiently, with increases typically detected within 10 min of stress exposure and then falling rapidly within another 10–20 min following stress cessation (van Stegeren et al., 2008; Nater and Rohleder, 2009). Salivary cortisol has a slower time course relative to alpha amylase, rising and peaking within about 20–30 min of an acute stress exposure, and remaining elevated for up to about an hour following stress cessation (Sapolsky et al., 2000; Kemeny, 2003). We measured these two salivary biomarkers of stress, alpha amylase and cortisol, repeatedly during the course of our study: prior to DeMUS exposure, immediately following exposure, and then repeatedly during a recovery period (at 25-, 45-, and 65-min post DeMUS). If the DeMUS scenario activates the SAM system, we expect to see a transient rise of alpha amylase immediately post-scenario that quickly returns to baseline at 25-, 45-, and 65-min post scenario; if the scenario activates the HPA system, we expect to see a relatively latent and sustained rise of cortisol at 25-min post-scenario, possibly continuing through 45- and 65-min post-scenario. Repeatedly assessing both alpha amylase and cortisol levels allows us to test these possibilities. Rifle tracking was made possible by the array of ART motion tracking cameras and marker balls affixed to the weapon. The rifle was registered as an object in the DTrack software (ART, GmbH), which continuously (at 1,000 Hz) tracked rifle position (xyz) and roll, pitch, yaw. Using this information and head tracking data, when the weapon was properly aimed by the participant, the Unity 3D software created a virtual vector (raycast) emanating from the barrel of the weapon into the virtual scene. All weapon position data were continuously logged and temporally synchronized with behavioral, eye tracking, and cardiac physiology data via Lab Streaming Layer. Tracking the rifle allowed us to assess whether participant successfully aimed and used their weapon to defeat the virtual avatar.
5 DeMUS validation study
A validation study was conducted to assess the viability of our scenario, hardware and software integration, data logging, and analysis, and provide a first understanding of whether our stress manipulation influenced any of our measures.
5.1 Method
Because this study was conducted during the SARS-CoV-2 pandemic, all experimenters and participants followed approved (by safety committees at Tufts University and U.S. Army) safety protocols including procedures for personal protective equipment (e.g., masks, gloves, glasses, gowns, and/or face shields), biospecimen handling, hand sanitizing, social distancing, and equipment and space sanitization.
5.1.1 Participants and design
A total of 18 male active-duty military personnel freely volunteered to participate in the pilot study (Mage = 23 years, Age range = 18–35, Meducation = 16.9 years) in accordance with research procedures approved by the ethics committees at Tufts University and the U.S. Army (protocol #18-007). While this pilot study sample size is limited, it is like other within-participants designs examining stress effects on biochemical, physiological, and behavioral responses. For example, the sample size is identical to studies examining stress effects on cortisol, working memory, and prefrontal brain activity (n = 18) (Porcelli et al., 2008), and stress effects on physiological responses (n = 18) (Pakhomov et al., 2020), It is also similar to a study examining stress effects on cortisol and working memory (n = 20) (Oei et al., 2006). In fact, a meta-analysis examining stress induction effects on heart rate showed a mean effect size of .89, which estimates a sample size of n = 16 to detect a difference between two dependent means in our within-participants design (α = .05, power = .95) (Seddon et al., 2020). For these reasons, we believe our sample size (n = 18) will be sufficient to detect stress effects on at least one of the physiological measures used in this pilot study.
The participants were all infantry members and had completed the Army’s basic and advanced individual training, and only two of them had been deployed overseas. The targeted age range (18–35) was intended to reflect the fact that most (over 76%) of active duty U.S. military personnel are within this age range. To reduce the chance of coercion during participant recruitment, an ombudsperson was present and senior leadership within participants’ chain of command were not permitted to be present; participants were also informed that choosing not to participate would not affect their relationship with their employer. Participants were informed of all potential risks inherent to the experiment, including the torso shock (e.g., mild skin irritation). We manipulated stress across two levels in a within-participants design: low versus high, by using torso shock (high stress) or a torso vibration (low stress). Each participant was scheduled for two sessions, each occurring at the same time of the morning (to account for diurnal variation in salivary cortisol); one session was with a threat of shock, and one without (i.e., the belt was set to vibrate mode).
5.1.2 Procedure
Participants provided written consent in accordance with ethics approvals prior to arrival to the laboratory. Upon arrival for their first session, participants were seated in a private testing room and completed a demographics instrument (e.g., age, sex, education, military occupational specialty) and pre-task surveys on a computer monitor (24” at 1920 × 1,080 resolution, with standard keyboard and mouse). These surveys included the state-trait anxiety inventory (STAI) (Spielberger et al., 1983) and the positive and negative affect schedule (PANAS) (Watson, 1988). We used these measures to ensure that there were no baseline differences in affective states between the two experimental sessions, and to assess any changes in subjective affective states between the shock and vibrate conditions. They then provided their first of several saliva samples. All saliva samples were taken using the SalivaBio Oral Swab method (Salimetrics, LLC, Carlsbad, CA), which involves placing a swab under the tongue for 2 min to collect approximately 2 mL saliva volume, placing the swab into a storage tube, and storing the sample in a −20°C freezer until analysis.
Because each participant likely has varied pain tolerance and would respond differently to shock intensity levels, they performed a shock belt calibration. During the calibration, participants were asked to don the StressX PRO shock belt around the torso and administer shock to themselves (using a provided button). They were asked to try each intensity level, starting at the lowest (1), and stopping when they were no longer comfortable increasing the intensity; they then removed the belt. The experimenter recorded the highest intensity achieved by the participant (e.g., 3) and one level below this value was used (e.g., 2) for the DeMUS scenario, in accordance with our approved safety protocol. If a participant never tried above level 1, that level was used in the DeMUS scenario.
Participants then began the CRT phase to ensure adequate memory for the RMT objects, SOT environment, and DMT camouflage patterns. On average, this phase took about 15 min to complete, depending upon how many learning iterations were required to reach criterion (which we detail in the Results section).
Participants were then walked to the virtual reality system where they donned the bioharness strap and eye tracking glasses, and were provided with instructions on how to use the rifle and attached controller (button press, thumb joystick). They then stepped onto the platform positioned in the center of the VR system, surrounded by the five display panels.
Because each participant aims the rifle in a unique manner, we conducted a brief DTrack software calibration involving the participant shouldering and aiming the weapon at a bullseye positioned in the center of an otherwise empty scene. After taking a few shots at the virtual bullseye, weapon position was manually adjusted in DTrack along the XYZ axes to ensure shot placement matched the participant’s aiming intent. This process typically took about 2 min to complete. After the rifle was calibrated, participants completed a three-point eye tracker calibration and manual correction procedure using the iView software, during which the participant was asked to direct their gaze towards three dots positioned on a wall. Participants then sat in a chair for 10 minutes to gather baseline physiological data. Finally, the StressX PRO Belt was donned and set to the appropriate condition (shock or vibrate) and intensity.
Participants were then guided through a brief practice session for each of the three DeMUS tasks (RMT, SOT, DMT). Written and verbal instructions were provided for each task, and the participant was able to practice two to three trials for each task, using environments and stimuli that were not previously learned (i.e., one of the two other task versions that were not used). No shock was administered during practice. Once the participant was familiar with each task, they began the DeMUS scenario; one of the four developed scenario versions was randomly chosen for use in each of the two experimental sessions, without replacement. First, they performed the sequence of 10 RMT and SOT trials, which took about 10 min, and then performed the series of 15 DMT trials, which took about 10 min. When the participant finished, the experimenter removed the eye tracking glasses, bioharness, and shock belt, and then walked the participant back to the private seated testing room.
The participant then provided their second saliva sample 5 min after completing the DeMUS scenario. They then completed the same two surveys (STAI, PANAS) three times in succession, every 20 min, with an additional saliva sample interleaved. In this manner, a total of five saliva samples were provided (prior to DeMUS, 5 min post-DeMUS, 25 min post DeMUS, 45 min post DeMUS, and 65 min post-DeMUS), and five survey responses were provided (at the same time points). The repeated saliva sampling and survey administration allowed us to assess both objective and subjective responses to stress over time. After providing their final saliva sample and survey responses, the participants were thanked for their time and excused from the session.
5.1.3 Data processing and analysis
Basic descriptive statistics were gathered from the CLT phase, to report on the number of study-test iterations that were necessary for participants to reach criterion on each (RMT, SOT, DMT) task, and overall performance.
For the DeMUS scenario, Lab Streaming Layer streams data to the Lab Recorder software, which saves a single extensible data format (.xdf) file for each participant; this file contains all temporally synchronized data collected from participant responses, the bioharness, and eye tracking glasses. This file was imported into MATLAB (Mathworks, Inc., Natick, MA) and parsed into separate data files capturing participant behavioral responses (button presses, trigger pulls, thumb joystick movements), physiology (bioharness data), and eye tracking (pupil diameter). These data files were saved as comma separated value (.csv) files and imported to SPSS (v21, IBM, Inc., Armonk, NY) for statistical analysis.
For the RMT, behavioral data were parsed into the number of hits, correct rejections, false alarms, and misses on each of the 10 RMT trials (per session), to allow analyses using signal detection methods. Analyses focus on accuracy, discriminability (d-prime), and decision criterion. For the SOT, behavioral data were processed to calculate absolute angular error for each pointing response (from 0 to 180), and absolute distance error for each distance estimate. For the SOT, analyses focus on pointing error, distance estimation error, pointing confidence, and distance estimation confidence on each of the 10 SOT trials (per session). Given that participants needed to variably reorient to scan the environment for studied objects (RMT) or orient towards target locations (SOT), response latencies were not suitable for analysis.
For the DMT, we calculated two primary measures. First, we examined participants’ decisions, including whether they were hits (firing at an enemy), correct rejections (letting a friendly pass), misses (letting an enemy pass), or false alarms (firing at a friendly), and response latencies on each of the 15 DMT trials (per session). Because there were variable avatar entry locations, response latencies were calculated as the distance in meters to the avatar upon the participant response. In this manner, higher distances indicated faster responses, and vice versa. Note that in the event of a potential target reaching the red line prior to a participant response, we scored this as a pass response, and response distance was not considered.
For physiology, we output three data streams from the Biomodule: heart rate, heart rate variability, and respiration rate. Heart rate was measured in beats per minute at 1Hz, heart rate variability was measured in standard deviation in milliseconds (RMSSD derived from an 18 Hz R-R interval extracted from contiguous 250 m blocks of electrocardiogram/ECG data), and respiration rate was measured in breaths per minute at 1 Hz. To assess biochemical stress responses, salivary analyses for alpha amylase and cortisol were done using the Enzyme-Linked Immunosorbent Assay (ELISA) kit for cortisol. All samples were assayed in triplicate using a maximum permissible 15% coefficient of variation, which no samples reached. Analyses of physiological and biochemical data were used to examine tonic stress differences between the shock and no-shock condition (i.e., cortisol, heart rate, heart rate variability, respiration rate, pupil diameter), and phasic uncertainty responses time-locked to the onset of each DMT trial (i.e., pupil diameter). We hypothesized increases in cortisol and heart rate in the shock versus vibrate conditions; we did not expect heart rate variability (HRV) differences given that participants were standing and actively moving their bodies during the task (which can produce floor-effects and reduce HRV sensitivity to condition-based differences (Chan et al., 2007; DiDomenico and Nussbaum, 2011)), or respiration rate differences given evidence that it is generally insufficient for detecting stress-induced ventilatory changes (Suess et al., 1980).
Due to our relatively small sample size (N = 18) and to reduce the likelihood of a Type I error, we use the non-parametric Wilcoxon signed rank test for all paired comparisons (α = .05); for posterity, we also calculate Hedges’ g for effect size. For comparisons involving more than two levels of a variable, we use analyses of variance (ANOVAs).
6 Results
The number of study-test iterations required to reach criterion for the RMT, SOT, and DMT were 1.08 (SD = .37), 1.92 (SD = .37), and 1.19 (SD = .46), respectively. Mean performance at the last iteration of the RMT was .94 accuracy (SD = .08), the SOT was .96 accuracy (SD = .08), and the DMT was .97 accuracy (SD = .10). The SOT required more study-test iterations to reach criterion relative to the RMT or DMT, matching what would be expected from our pilot data and using the 125px accuracy threshold (as shown in Table 2).
There were no participants who could not reach criterion on the RMT within three attempts, on the SOT within five attempts, or on the DMT within three attempts.
6.1 Stress responses: Biochemical
To evaluate the stress response, we used salivary alpha amylase and cortisol as the gold-standard measures of a SAM and HPA axis stress response, respectively.
Recall that alpha amylase and cortisol were sampled at five time points: prior to DeMUS (Time 1), 5 min post-DeMUS (Time 2), 25 min post DeMUS (Time 3), 45 min post DeMUS (Time 4), and 65 min post-DeMUS (Time 5). Two of the 180 alpha amylase values, and one of the 180 cortisol values were missing and imputed with the condition means. Because cortisol data were positively skewed (Fisher’s skewness = 3.42), we fourth-root transformed the data to reduce skewness (Fisher’s skewness = 1.21), as recommended in previous research (Miller and Plessow, 2013).
We analyzed alpha amylase data to answer two questions. First, we asked whether the shock versus vibrate conditions were different at baseline (Time 1), which revealed a non-significant result, W = 60, p = .44, Hedges’ g = .10, as expected. Second, given that salivary alpha amylase responses to stress tend to rise and peak within minutes of an acute stressor (Nagy et al., 2015), we tested for differences between the shock and vibrate conditions at Time 2, W = 25, p = .014, Hedges’ g = .58, and Time 3, W = 64, p = .55, Hedges’ g = .26 The overall pattern of alpha amylase results is depicted in Figure 6 (upper).
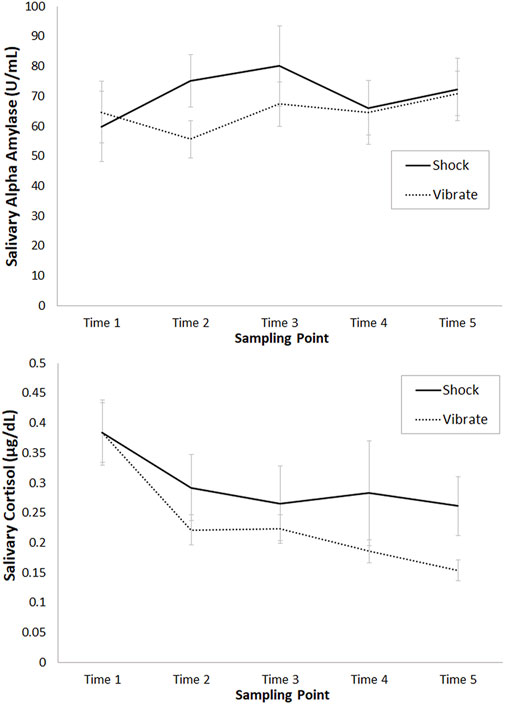
FIGURE 6. Mean untransformed salivary alpha amylase (upper panel, in U/mL) and cortisol (lower panel, in µg/dL) levels (and standard error) at each of the five sampling times, for the shock versus vibrate conditions.
We analyzed cortisol data to answer two questions. First, we asked whether the shock versus vibrate conditions were different at baseline (Time 1), which revealed a non-significant result, W = 75, p = .65, Hedges’ g = .08, as expected. Second, given that salivary cortisol responses to stress tend to rise and peak about 10–30 min after the cessation of an acute stressor (Kudielka et al., 2004; Kudielka and Kirschbaum, 2005; Balodis et al., 2010; Foley and Kirschbaum, 2010; Giles et al., 2014), we tested for differences between the shock and vibrate conditions at Time 3, W = 76, p = .68, Hedges’ g = .11, Time 4, W = 64, p = .35, Hedges’ g = .38, and Time 5, W = 24, p < .01, Hedges’ g = .73. The overall pattern of cortisol results is depicted in Figure 6 (lower).
There are three notable patterns in Figure 6. First, the alpha amylase response demonstrated a brief but robust SAM response in the shock condition immediately post-stressor. Second, the cortisol response in the shock condition showed numerically higher cortisol levels from Time 2 onward; this pattern was marginally significant at Time 4, and statistically significant at Time 5. Second, the shock condition was associated with high variability (plotted as standard error) relative to the vibrate condition. To examine this pattern, for each participant we calculated the mean difference score between Shock and Vibrate (i.e., Shock-Vibrate) at Times 2–5. The mean difference score was .08, with 11 participants falling above 0 (i.e., higher cortisol with shock versus vibrate) and seven participants falling below 0 (i.e., higher cortisol with vibrate versus shock). In other words, participants showed highly varied biochemical stress responses to our threat of shock manipulation.
6.2 Stress response: Subjective
We also examined secondary subjective (questionnaire-based) measures of the stress response, including the STAI and PANAS (positive and negative affect).
Subjective responses on the STAI and PANAS are detailed in Table 3. For the STAI, one of the 180 values was missing and imputed with the condition mean. We first tested whether pre-manipulation STAI scores were different at baseline (Time 1), which was non-significant, W = 40, p = .43, Hedges’ g = .09. Second, as the critical comparison we tested whether STAI scores were higher in the shock versus vibrate condition at the first time point following the scenario (Time 2); scores were numerically but not statistically higher in the shock versus vibrate condition, W = 30, p = .16, Hedges’ g = .14.
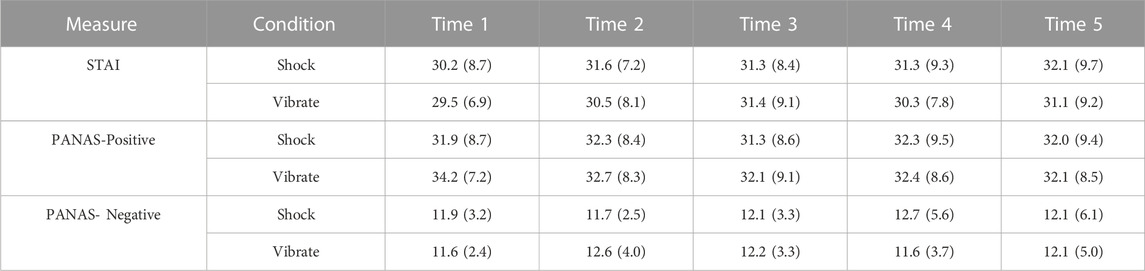
TABLE 3. Mean and standard deviation scores from the STAI and PANAS, at each of the five time points.
For the PANAS Positive Affect (PANAS-PA) scale, we first tested whether pre-manipulation PANAS-PA scores were different at baseline (Time 1), which was marginally significant, W = 14, p = .05, Hedges’ g = .05, with a trend towards lower positive affect at baseline in the shock versus vibrate session. Second, we tested whether PANAS-PA scores were lower in the shock versus vibrate condition at the time point immediately following the scenario (Time 2); scores did not significantly differ between the shock versus vibrate conditions, W = 51, p = .90, Hedges’ g = .09.
For the PANAS Negative Affect (PANAS-NA) scale, we first tested whether pre-manipulation PANAS-NA scores were different at baseline (Time 1), which was non-significant, W = 27, p = .56, Hedges’ g = .10. Second, we tested whether PANAS-NA scores were higher in the shock versus vibrate condition at the time point immediately following the scenario (Time 2); scores did not significantly differ between the shock versus vibrate conditions, W = 36, p = .41, Hedges’ g = .26.
6.3 Stress response: Physiological
Physiological measures include heart rate, heart rate variability, respiration rate, and pupil diameter. To examine the stress response due to threat of shock, we examined tonic changes in these variables as a function of shock versus vibrate conditions. For all physiological measures, we imputed any missing data with condition means.
For heart rate, we calculated mean beats per minute (BPM) in 10-s increments. The overall pattern of heart rate is depicted in Figure 7. Approximately, the RMT and SOT took place between minutes 0–10, and the DMT between minutes 11–20. Overall; Figure 7 depicts higher heart rate in the shock versus vibrate condition. To test this pattern, we conducted a repeated-measures analysis of variance (ANOVA) with two factors: Threat of Shock (2: shock vs. vibrate), and Time (20: 1-min increments). We found a main effect of Threat of Shock, with higher heart rate in the shock (M = 90.9, SD = 3.1) versus vibrate (M = 86.7, SD = 2.9), F (1, 17) = 7.72, p = .01, η2 = .15, and a main effect of Time, with generally higher heart rate as scenario time progressed, F (1, 17) = 7.02, p < .01, η2 = .09. The interaction was non-significant, F (19, 323) = 1.25, p = .22, η2 = .01.
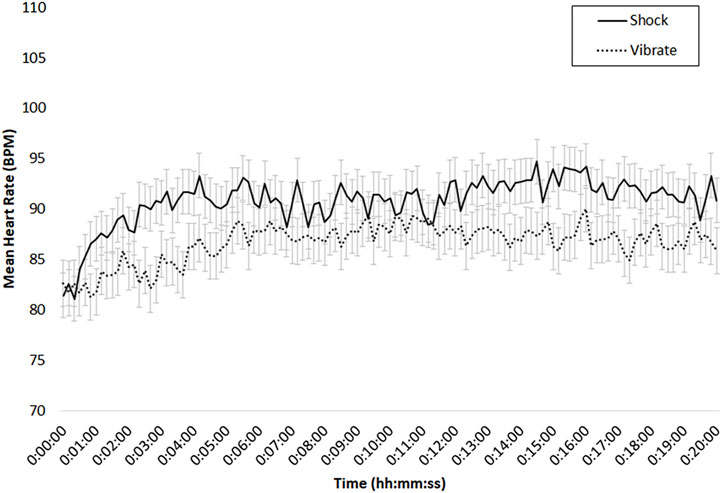
FIGURE 7. Mean heart rate (BPM) in the shock (solid) versus vibrate (dotted) condition, for the 20-min period of the DeMUS scenario; bars indicate standard error of the mean.
For heart rate variability, we calculated mean values in 10-s increments. Using the same ANOVA design as with heart rate, we found only (other p’s > .23) a main effect of Time, F (19, 323) = 2.39, p < .01, η2 = .05. In general, heart rate variability decreased as scenario time progressed, but was not influenced by shock condition.
For respiration rate (RR), we calculated mean values in 10-s increments. Using the same ANOVA design as with heart rate and heart rate variability, we found only (other p’s > .12) a main effect of Time, F (19, 323) = 1.65, p < .05, η2 = .05. In general, respiration rate decreased as scenario time progressed, but was not influenced by shock condition.
For pupil diameter, we calculated mean values in 10-s increments for the right eye; due to a mean pupil diameter (M = .12 mm) difference between the shock and vibrate conditions at baseline (time 0), we baseline-corrected relative to the first 10 s of each participant’s data stream. We used the same ANOVA design as with heart rate, heart rate variability, and respiration, and found a main effect of Time, F (19, 323) = 16.51, p < .01, η2 = .15, and an interaction between Threat of Shock and Time, F (19, 323) = 2.59, p < .01, η2 = .02. As depicted in Figure 8, there was a large pupil diameter difference between the shock and vibrate condition early in the scenario, but this difference tended to diminish over time (with experience with the scenario). Note that the main and interactive effects were both present when analyzing data without the baseline correction.
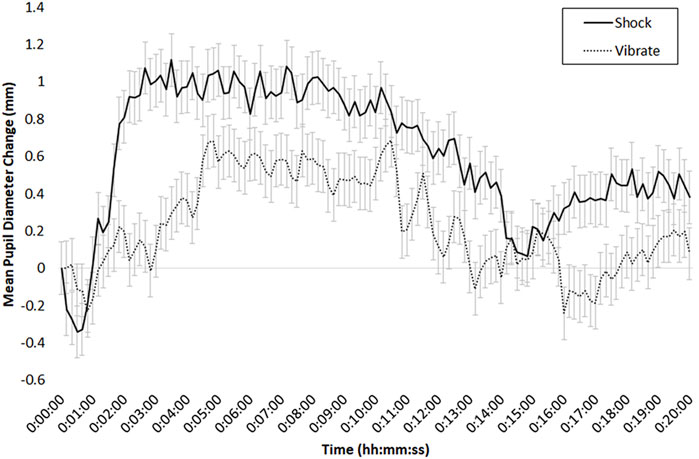
FIGURE 8. Mean change in pupil diameter (in mm), for the 20-min period of the DeMUS scenario, in the shock (solid line) and vibrate (dotted line) conditions; bars indicate standard error of the mean.
Because we assume that some portion of the tonic pupil dilation in the shock condition was due to the discrete shock events, we also examined phasic pupil dilation in response to trials when the participant was shocked (or vibrated) relative to when no shock or vibration was administered (i.e., the trial was answered correctly). To do so, we time-locked and zero-referenced pupil data to the onset of a shock (or non-shock) or vibrate (or non-vibrate) event; these phasic pupil responses are depicted in Figures 9, 10, respectively. To examine these patterns, we conducted two ANOVAs, one for shock session data, and the other for vibration session data.
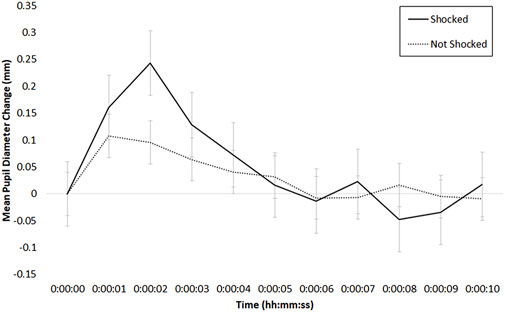
FIGURE 9. Mean phasic change in pupil diameter (in mm) during the shock session, time-locked to the onset of a shock (solid line) or no shock (dotted line) event; bars indicate standard error of the mean.
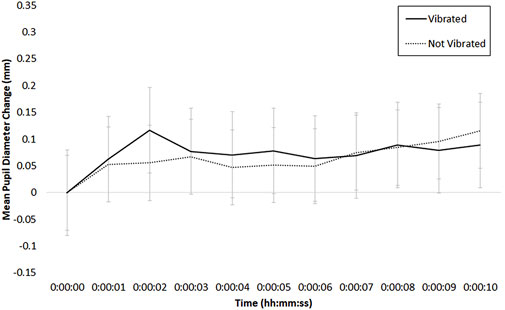
FIGURE 10. Mean phasic change in pupil diameter (in mm) during the vibrate session, time-locked to the onset of a vibration (solid line) or no vibration (dotted line) event; bars indicate standard error of the mean.
The ANOVA examining shock session data had two factors: Shock (2: shocked, not shocked) and Time (11: 10-s increments). As depicted in Figure 9, there was a main effect of Time, F (10, 170) = 5.96, p < .01, η2 = .16, and an interaction between Time and Threat of Shock, F (10, 170) = 2.24, p < .05, η2 = .03. There was no main effect of Threat of Shock (p > .41). In examining Figure 9, pupil diameter appears to increase briefly in the shocked condition relative to the not-shocked condition, peaking at about 2 s following the shock event; this difference at 2 s was significant in a test comparing the shocked versus not shocked conditions, W = 17, p < .01, Hedges’ g = .49.
The same ANOVA conducted in the vibrate session, with two factors, Vibrate (2: vibrated, not vibrated) and Time (11: 10-s increments), similarly demonstrated a main effect of Time, F (10, 170) = 2.63, p < .01, η2 = .08, and an interaction between Time and Vibrate, F (10, 170) = 2.63, p < .01, η2 = .03. There was no main effect of Threat of Shock (p > .58). In examining Figure 10, pupil diameter appears to follow a similar but less pronounced pattern than seen in the shock session (Figure 9); indeed the difference between vibrated and not vibrated trials at 2 s was non-significant, W = 45, p = .08, Hedges’ g = .15.
6.4 Recognition memory task (RMT)
For the RMT, we calculated accuracy, discriminability (d-prime), and decision criterion (c). Data from each of these measures is summarized in Table 4 (upper), along with the results of Wilcoxon signed ranks tests comparing shock versus vibrate. Overall, there was significantly lower accuracy in the shock versus vibrate condition, and marginally lower discriminability (d-prime) in the shock versus vibrate condition.
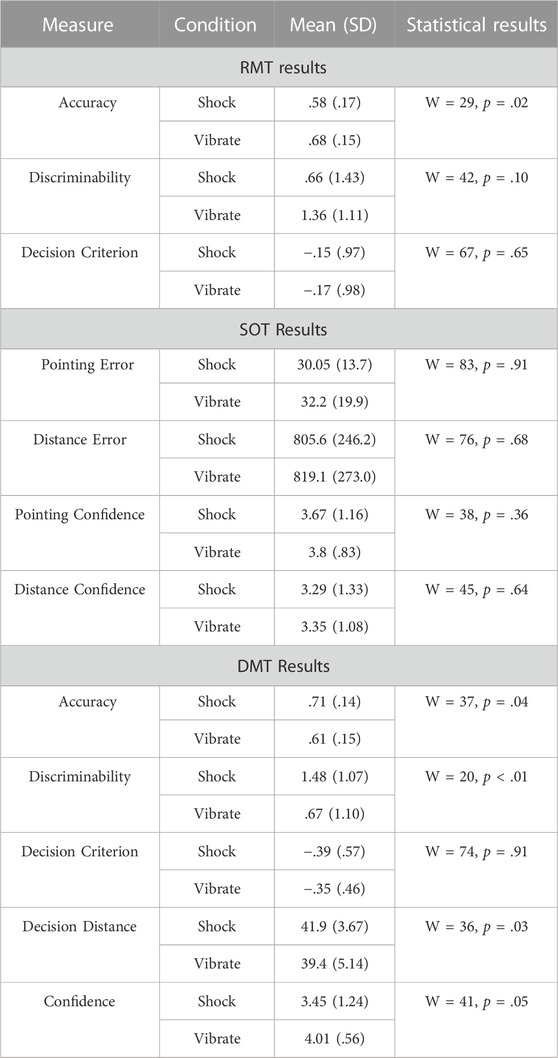
TABLE 4. Upper: Mean and standard deviation accuracy, discriminability (d-prime), and decision criterion (c) scores from the RMT, along with results from Wilcoxon signed rank tests comparing shock to vibrate. Middle: Mean and standard deviation absolute pointing and distance error, and pointing and distance confidence from the SOT, along with results from Wilcoxon signed rank tests comparing shock to vibrate. Lower: Mean and standard deviation accuracy, discriminability (d-prime), decision criterion (c), decision distance, and confidence from the DMT, along with results from Wilcoxon signed rank tests comparing shock to vibrate.
6.5 Spatial orienting task (SOT)
For the SOT, we calculated absolute pointing direction error (in degrees), absolute distance error (in meters), and confidence in the pointing direction and distance judgment. Data from each of these measures are summarized in Table 4 (middle), along with the results of Wilcoxon signed ranks tests comparing shock versus vibrate. Overall, there were no effects of our shock manipulation across any of the outcomes.
6.6 Decision-making task (DMT)
For the DMT, we calculated accuracy, discriminability (d-prime), decision criterion (c), decision distance (as a proxy for response time), and confidence. Data from each of these measures are summarized in Table 4 (lower), along with the results of Wilcoxon signed ranks tests comparing shock versus vibrate. Overall, participants generally showed improved performance under threat of shock relative to vibrate, with higher accuracy and discriminability; they also tended to make decisions earlier, but with lower subjective confidence.
6.7 Stress responses and performance
Because the cortisol stress response was highly variable across participants, we conducted an exploratory analysis examining whether the magnitude of each participant’s cortisol-based stress response was associated with the magnitude of any performance change on the RMT, SOT, or DMT. To do so, we calculated difference scores for the cortisol response (i.e., Shock—Vibrate, at Time 3) and correlated them with difference scores for RMT, SOT, and DMT performance (i.e., Shock—Vibrate).
Two of the 12 outcome measures were associated with the cortisol response: higher magnitude cortisol responses to stress were marginally associated with higher decision distances (i.e., faster response times), r (18) = .32, p < .10, and significantly associated with lower confidence during the DMT, r (18) = −.58, p < .01.
7 General discussion
We report on the design, development, and validation of a novel virtual reality scenario involving several aspects of perception, memory, and decision making under conditions of variable stress. The scenario, termed DeMUS, involved a criterial learning phase and then applying new knowledge to three tasks: a recognition memory task, a spatial orienting task, and a decision-making task. In the validation study, 18 military personnel performed the DeMUS scenario in two sessions: one involving the threat of electric torso shock upon making an incorrect decision, and one with relatively innocuous torso vibration. We asked whether threat of shock during the DeMUS scenario would reliably induce stress, and whether we would see an influence of stress on biochemical, physiological, and behavioral outcomes. Results of the validation study were generally mixed.
The acute stress response involves a rapid sympathetic autonomic nervous system (ANS) activation that is generally associated with elevated heart rate, respiration rate, sweating, and increased pupil diameter (Callister et al., 1992; Sloan et al., 1996; Bradley et al., 2008; 2017). The relatively slow-moving activation of the HPA axis during acute stress involves a glucocorticoid elevation that can be reliably measured by sampling salivary free cortisol (Kudielka et al., 2004; Foley and Kirschbaum, 2010). In the present study, the DeMUS scenario appears to have initiated a strong SAM response in conjunction with a relatively weak HPA axis response, as indicated by three patterns of results. First, we found higher heart rate, tonic pupil diameter, and salivary alpha amylase in the shock versus vibrate condition. Second, we found a strong phasic pupil diameter response when participants were shocked, relative to when they were not shocked; the magnitude of this response was far greater than when participants received versus did not receive a vibration. Third, in contrast to finding evidence for sympathetic ANS responses to our stressor, the cortisol results were less than compelling: salivary cortisol levels were numerically higher in the shock versus vibrate condition, but this pattern was non-significant at most time points. Specifically, the cortisol response was only significantly higher in the shock versus vibrate condition at our last sampled time point, which was approximately 60 min after cessation of the stressor. This result contrasts past research suggesting that stress-induced cortisol responses tend to return to baseline levels after 60–90 min (Kirschbaum and Hellhammer, 1994; Foley and Kirschbaum, 2010). Together, we believe our pattern of biochemical and physiological data suggests that threat of shock reliably activates relatively early (i.e., noradrenergic) SAM responses but does not appear to reliably influence relatively latent HPA axis-related (i.e., glucocorticoid) stress responses.
There are at least three reasons why our stress induction may have differentially activated these two stress systems (Dimsdale and Moss, 1980; Doornen and Blokland, 1992; Gagnon and Wagner, 2016). First, our ethics approvals dictated that we custom-tailor shock intensity to each participant’s individual pain tolerance. While this procedural detail may have helped prevent undue discomfort in participants, it also made it possible for participants to volitionally select relatively low shock levels. In reviewing our shock calibration results, we found that most (13/18) of our participants selected the lowest shock, level 1, three selected level 2, and only two selected level 3. Higher shock levels may provide a more intense and sustained stress response that more reliably triggers an increase in glucocorticoid levels; while our sample size and restricted range of selected shock levels make our data unsuitable for testing such a hypothesis, it is a compelling direction for continuing research. Second, the low shock intensity levels may have been compounded by the fact that we only recruited military personnel. Military personnel self-select into a career that involves training and operating under extreme conditions, and may be characterized by a higher ability to positively adapt to (and recover from) adversity (Britt et al., 2013; Ledford et al., 2020). Because we did not measure resilience-related constructs in our sample we cannot assess whether our sample deviated from the general population, but it is possible. If so, this could have reduced HPA axis-related stress responses relative to, for example, a college student sample. Third, it is possible that the DeMUS scenario was marginally stressful in the vibrate condition, limiting our ability to detect differences between the shock and vibrate condition. Recall that in both sessions participants made decisions under uncertainty and in the context of aversive ambient sounds (e.g., gunshots, explosions), which are known to produce acute stress responses (Blanchard et al., 1982; Liberzon et al., 1999; Seidel et al., 2015; De Berker et al., 2016). The uncertainty elicited by our tasks could have caused a cortisol increase that is masking our ability to detect cortisol differences between the shock and vibrate conditions.
Our stress manipulation involved a threat of shock that is related to the accuracy of task performance in virtual reality; our intent was to relate our stressor to the threat to safety and wellbeing experienced by military personnel during routine operations. For example, we attempted to emulate the stress of not responding correctly during real-world operations, including the life-altering repercussions of missing a threat or false-alarming to a non-threat, in VR. However, it is worth pointing out that there are many methods for inducing stress in VR, many of which do not necessitate a threat of shock (Bali and Jaggi, 2015). In some cases, mere exposure to a compelling VR scenario that elicits feelings of uncertainty and unpredictability can elicit a mild to moderate stress response without a performance-related external threat to comfort or safety (Zimmer et al., 2019; Dibbets, 2020; Kerous et al., 2020). For example, a virtual environment with fear-triggering sounds (e.g., crying, howling) and sights (e.g., mutilated corpse, werewolf) can elicit neurophysiological (i.e., electroencephalography) and cardiorespiratory (i.e., heart rate variability) signs of anxiety and fear (Kisker et al., 2021).
It was not our intent to demonstrate that an immersive VR scenario is superior to any other scenario (e.g., desktop virtual environments), nor can our data speak to this possibility; however, we do know that immersive VR displays such as head-mounted displays (HMDs) and cave automatic virtual environments (CAVEs) are more reliable at eliciting emotions such as fear and anger than desktop virtual environments, that these effects carry influences for decision making, and they do so via increased presence, immersion, and embodiment (Felnhofer et al., 2015; Susindar et al., 2019; Diniz Bernardo et al., 2021). We believe these three mechanisms (presence, immersion, embodiment) were important for eliciting the stress responses seen in the current study, but we cannot disentangle the contributions of the immersive multisensory CAVE displays, the rich virtual reality scenario, and the threat of torso shock. It is possible that our DeMUS scenario, even in the absence of a vibration cue or threat of shock, could elicit a mild sympathetic stress response. While our design does not make it possible to directly examine this possibility, Figure 8 does suggest that mean pupil diameter increased in both vibrate and shock conditions relative to the pre-scenario baseline; in other words, mere exposure to our VR scenario without a threat of shock seems to elicit a mild sympathetic stress response. It is unknown whether that response would be present had the participants not donned the shock belt in the first place, but it is possible that the uncertainty associated with the decision-making tasks in VR may have been sufficient to produce the mild stress response. While we believe that the threat of shock compounded the mild stress experienced by participants in our VR scenario, our design does not make it possible to fully isolate those sources of stress. Continuing research should ascertain the necessary and sufficient conditions under which the two stress systems (SAM, HPA) are reliably activated by our VR scenario itself versus our external stressor.
With the DeMUS scenario will include more intense shock administration, assessing potential relationships between trait resilience and responses to threat of shock, and identifying potential control conditions that can help isolate the influence of our scenario on different stress systems.
Behavioral outcomes of the three DeMUS tasks, the RMT, SOT, and DMT, were also mixed. With the RMT, we found evidence that threat of shock significantly reduced accuracy and marginally reduced discriminability. This result supports earlier research suggesting that acute stress can decrease recognition memory, particularly among those with high cortisol reactivity to the stressor (McCullough et al., 2015; Gagnon and Wagner, 2016; Shields et al., 2017). However, we did not find any influence of our stress induction on the SOT, which involved complex spatial transformations of perspective and orientation. This finding was surprising given earlier work suggesting that acute stress, even when it does not involve HPA activation, can reduce performance on spatial orientation and navigation tasks (Richardson and VanderKaay Tomasulo, 2011; Brunyé et al., 2019b). Because our task involved realistic but time-consuming whole-body reorientations, it was not possible to meaningfully measure response latencies, which may have been more sensitive to our stress induction than measures of angular or distance error (Richardson and VanderKaay Tomasulo, 2011). On the DMT, we found some evidence that the threat of shock caused participants to make decisions faster and with higher accuracy and discriminability, but at the cost of confidence. The threat of shock on this task may have increased motivation to more closely attend to the perceptual features of targets and extract the necessary information to achieve more accurate decisions. In perceptual decision-making tasks, such a pattern would typically be associated with a speed-accuracy tradeoff that slows decision making (Miletic, 2016). In other words, hasty decisions are typically associated with reduced accuracy (Bogacz et al., 2010; Standage et al., 2014); in the present results, we found both increased accuracy and faster decisions, suggesting that motivational phenomena (e.g., effort, value) may underlie this pattern (Kuhl, 1986).
Some limitations are worth considering and guide future research and the translational value of these research findings. First, while the within-participants design affords higher statistical power, it is possible that participants reactively modified their behavior to match perceived expectations of experimenters. The contrasting sessions, one with threat of shock and one with relatively innocuous vibration, could have led participants to believe their behavior should be negatively influenced in the former condition. A between-participants design might help reduce the likelihood of any such effect. Second, while we attempted to elicit a robust stress response, our manipulation appeared to selectively activate SAM but not HPA axis; during military training and operations, it is likely that the HPA axis is also activated. Continuing research will identify additional stress inductions that more reliably elicit a SAM and HPA axis response, perhaps via psychosocial manipulations.
An additional limitation involves this study’s restricted use of the full range of possible VR technologies and capabilities. For example, our study did not leverage stereoscopic displays, full sensory immersion, or ambulation through virtual spaces. Indeed, it is possible that our study could be executed on a seated desktop display and elicit similar stress responses and behavioral outcomes. Two obvious benefits of using the CAVE-based system were that participants could stand and use the replica rifle to interact with realistically sized targets presented on the screens in front of them. An advantage of not using stereoscopic displays was the ability to use eye-tracking glasses, and an advantage of restricting translational movement through VR was reducing the incidence of simulator sickness. However, it is currently unknown whether our use of large VR displays and rifle-based inputs influenced immersion or engagement in our scenario, or whether VR itself increased or decreased the experience of uncertainty or stress during our tasks. These questions provide opportunities to measure the result of improving immersion in our scenarios, a focus of our continuing research.
The military seeks new methodologies for engaging and challenging military personnel in realistic virtual reality scenarios that emulate occupational stressors, and measuring outcomes across biochemical, physiological, and performance-related domains. The present study highlighted several methodological and practical considerations for the development and validation of the novel and comprehensive DeMUS virtual reality scenario, revealing important characteristics of the human stress response and motivating continuing research. As we continue to expand upon the DeMUS scenario, we intend to leverage it for evaluating how individual differences in baseline traits and abilities (e.g., resilience, emotion regulation skills, cognitive capacities) and enhancement techniques (e.g., neuromodulation, nutritional supplementation) modulate performance (Brunyé et al., 2019b; Farina et al., 2019; Feltman et al., 2019; Brunyé et al., 2020). Results from these studies will be critical for developing and validating new methods to predict and optimize performance in high-stakes military training and operations.
Data Availability Statement
The datasets presented in this article are not readily available because small and highly specialized samples can be potentially identifiable. Requests to access the datasets should be directed to Grace Giles, Z3JhY2UuZ2lsZXNAdHVmdHMuZWR1.
Ethics statement
The studies involving human participants were reviewed and approved by U.S. Army DEVCOM Armament Center IRB, and Tufts University SBER IRB. The participants provided their written informed consent to participate in this study.
Author contributions
TB and GG conceptualized and implemented the scenario and study, processed and analyzed the data, and jointly prepared the manuscript.
Funding
This work was supported by the U.S. Army DEVCOM Soldier Center under a cooperative agreement (W911QY-19-2-0003) with Tufts University.
Acknowledgments
We thank Focus Vision Media, Inc. (Pawtucket, RI), for developing the VR scenarios, Daniel Grover and Manob Jyoti Saikia for their support in integrating multimodal data streams, Draper Laboratory (Cambridge, MA) for developing a data processing pipeline, and research assistants Sara Olenich, Hannah Hart-Pomerantz, Kate Powell, Dalit Hendel, and Grace Elliott for data collection support.
Conflict of interest
The authors declare that the research was conducted in the absence of any commercial or financial relationships that could be construed as a potential conflict of interest.
Publisher’s note
All claims expressed in this article are solely those of the authors and do not necessarily represent those of their affiliated organizations, or those of the publisher, the editors and the reviewers. Any product that may be evaluated in this article, or claim that may be made by its manufacturer, is not guaranteed or endorsed by the publisher.
Author disclaimer
The views expressed in this article are solely those of the authors and do not reflect the official policies or positions of the Department of Army, the Department of Defense, or any other department or agency of the U.S. government.
References
Adam, G. E., Carter, R., Cheuvront, S. N., Merullo, D. J., Castellani, J. W., Lieberman, H. R., et al. (2008). Hydration effects on cognitive performance during military tasks in temperate and cold environments. Physiology Behav. 93 (4), 748–756. doi:10.1016/j.physbeh.2007.11.028
Ali, N., and Nater, U. M. (2020). Salivary alpha-amylase as a biomarker of stress in behavioral medicine. Int. J. Behav. Med. 27 (3), 337–342. doi:10.1007/s12529-019-09843-x
Allahyar, M., and Hunt, E. (2003). The assessment of spatial orientation using virtual reality techniques. Int. J. Test. 3 (3), 263–275. doi:10.1207/S15327574IJT0303_5
Angelova, M., Holloway, P. M., Shelyag, S., Rajasegarar, S., and Rauch, H. G. L. (2021). Effect of stress on cardiorespiratory synchronization of ironman athletes. Front. Physiology 12, 612245. doi:10.3389/fphys.2021.612245
Arnsten, A. F. T. (1998). Catecholamine modulation of prefrontal cortical cognitive function. Trends Cognitive Sci. 2 (11), 436–447. doi:10.1016/S1364-6613(98)01240-6
Arnsten, A. F. T. (2009). Stress signalling pathways that impair prefrontal cortex structure and function. Nat. Rev. Neurosci. 10 (6), 410–422. Article 6. doi:10.1038/nrn2648
Åström, U. (2011). Camouflage generator. Available at: http://www.happyponyland.net/camogen.php?about.
Axelrod, J., and Reisine, T. D. (1984). Stress hormones: Their interaction and regulation. Science 224 (4648), 452–459. doi:10.1126/science.6143403
Bali, A., and Jaggi, A. S. (2015). Clinical experimental stress studies: Methods and assessment. Rev. Neurosci. 26 (5), 555–579. doi:10.1515/revneuro-2015-0004
Balodis, I. M., Wynne-Edwards, K. E., and Olmstead, M. C. (2010). The other side of the curve: Examining the relationship between pre-stressor physiological responses and stress reactivity. Psychoneuroendocrinology 35 (9), 1363–1373. doi:10.1016/j.psyneuen.2010.03.011
Bartone, P. T. (2006). Resilience under military operational stress: Can leaders influence hardiness? Mil. Psychol. 18 (1), S131–S148. doi:10.1207/s15327876mp1803s_10
Beckner, M. E., Conkright, W. R., Eagle, S. R., Martin, B. J., Sinnott, A. M., LaGoy, A. D., et al. (2021). Impact of simulated military operational stress on executive function relative to trait resilience, aerobic fitness, and neuroendocrine biomarkers. Physiology Behav. 236, 113413. doi:10.1016/j.physbeh.2021.113413
Berghorst, L. H., Bogdan, R., Frank, M. J., and Pizzagalli, D. A. (2013). Acute stress selectively reduces reward sensitivity. Front. Hum. Neurosci. 7, 133. doi:10.3389/fnhum.2013.00133
Blanchard, E. B., Kolb, L. C., Pallmeyer, T. P., and Gerardi, R. J. (1982). A psychophysiological study of post traumatic stress disorder in Vietnam veterans. Psychiatric Q. 54 (4), 220–229. doi:10.1007/BF01064817
Bogacz, R., Hu, P. T., Holmes, P. J., and Cohen, J. D. (2010). Do humans produce the speed–accuracy trade-off that maximizes reward rate? Q. J. Exp. Psychol. 63 (5), 863–891. doi:10.1080/17470210903091643
Bradley, M. M., Miccoli, L., Escrig, M. A., and Lang, P. J. (2008). The pupil as a measure of emotional arousal and autonomic activation. Psychophysiology 45 (4), 602–607. doi:10.1111/j.1469-8986.2008.00654.x
Bradley, M. M., Sapigao, R. G., and Lang, P. J. (2017). Sympathetic ANS modulation of pupil diameter in emotional scene perception: Effects of hedonic content, brightness, and contrast. Psychophysiology 54 (10), 1419–1435. doi:10.1111/psyp.12890
Britt, T. W., Sinclair, R. R., and McFadden, A. C. (2013). “Introduction: The meaning and importance of military resilience,” in Building psychological resilience in military personnel (Washington, DC: American Psychological Association), 3.
Bruns, C. R., and Chamberlain, B. C. (2019). The influence of landmarks and urban form on cognitive maps using virtual reality. Landsc. Urban Plan. 189, 296–306. doi:10.1016/j.landurbplan.2019.05.006
Brunyé, T. T., Brou, R., Doty, T. J., Gregory, F. D., Hussey, E. K., Lieberman, H. R., et al. (2020). A review of US army research contributing to cognitive enhancement in military contexts. J. Cognitive Enhanc. 4, 453–468. doi:10.1007/s41465-020-00167-3
Brunyé, T. T., and Gardony, A. L. (2017). Eye tracking measures of uncertainty during perceptual decision making. Int. J. Psychophysiol. 120, 60–68. doi:10.1016/j.ijpsycho.2017.07.008
Brunyé, T. T., Hussey, E. K., Fontes, E. B., and Ward, N. (2019a). Modulating applied task performance via transcranial electrical stimulation. Front. Hum. Neurosci. 13, 140. doi:10.3389/fnhum.2019.00140
Brunyé, T. T., Martis, S. B., Hawes, B., and Taylor, H. A. (2019b). Risk-taking during wayfinding is modulated by external stressors and personality traits. Spatial Cognition Comput. 19 (4), 283–308. doi:10.1080/13875868.2019.1633540
Brunyé, T. T., Mercan, E., Weaver, D. L. D. L., and Elmore, J. G. J. G. (2017). Accuracy is in the eyes of the pathologist: The visual interpretive process and diagnostic accuracy with digital whole slide images. J. Biomed. Inf. 66, 171–179. doi:10.1016/j.jbi.2017.01.004
Brunyé, T. T., Wood, M. D., Houck, L. A., and Taylor, H. A. (2016). The path more travelled: Time pressure increases reliance on familiar route-based strategies during navigation. Q. J. Exp. Psychol. 70 (8), 1439–1452. doi:10.1080/17470218.2016.1187637
Brunyé, T. T., Yau, K., Okano, K., Elliott, G., Olenich, S., Giles, G. E., et al. (2021). Toward predicting human performance outcomes from wearable technologies: A computational modeling approach. Front. Physiology 12, 738973. doi:10.3389/fphys.2021.738973
Buchheim, J.-I., Matzel, S., Rykova, M., Vassilieva, G., Ponomarev, S., Nichiporuk, I., et al. (2019). Stress related shift toward inflammaging in cosmonauts after long-duration space flight. Front. Physiology 10, 85. doi:10.3389/fphys.2019.00085
Callister, R., Suwarno, N. O., and Seals, D. R. (1992). Sympathetic activity is influenced by task difficulty and stress perception during mental challenge in humans. J. Physiology 454 (1), 373–387. doi:10.1113/jphysiol.1992.sp019269
Cerqueira, J. J., Mailliet, F., Almeida, O. F. X., Jay, T. M., and Sousa, N. (2007). The prefrontal cortex as a key target of the maladaptive response to stress. J. Neurosci. 27 (11), 2781–2787. doi:10.1523/JNEUROSCI.4372-06.2007
Chan, H.-L., Lin, L.-Y., Lin, M.-A., Fang, S.-C., and Lin, C.-H. (2007). Nonlinear characteristics of heart rate variability during unsupervised and steady physical activities. Physiol. Meas. 28 (3), 277–286. doi:10.1088/0967-3334/28/3/004
Charmandari, E., Tsigos, C., and Chrousos, G. (2005). Endocrinology of the stress response. Annu. Rev. Physiology 67 (1), 259–284. doi:10.1146/annurev.physiol.67.040403.120816
Chatterton, R. T., Vogelsong, K. M., Lu, Y. C., Ellman, A. B., and Hudgens, G. A. (1996). Salivary alpha-amylase as a measure of endogenous adrenergic activity. Clin. Physiol. Oxf. Engl. 16 (4), 433–448. doi:10.1111/j.1475-097x.1996.tb00731.x
De Berker, A. O., Rutledge, R. B., Mathys, C., Marshall, L., Cross, G. F., Dolan, R. J., et al. (2016). Computations of uncertainty mediate acute stress responses in humans. Nat. Commun. 7, 10996. doi:10.1038/ncomms10996
Dibbets, P. (2020). A novel virtual reality paradigm: Predictors for stress-related intrusions and avoidance behavior. J. Behav. Ther. Exp. Psychiatry 67, 101449. doi:10.1016/j.jbtep.2019.01.001
Dickerson, S. S., and Kemeny, M. E. (2004). Acute stressors and cortisol responses: A theoretical integration and synthesis of laboratory research. Psychol. Bull. 130 (3), 355–391. doi:10.1037/0033-2909.130.3.355
DiDomenico, A., and Nussbaum, M. A. (2011). Effects of different physical workload parameters on mental workload and performance. Int. J. Industrial Ergonomics 41 (3), 255–260. doi:10.1016/j.ergon.2011.01.008
Dimsdale, J. E., and Moss, J. (1980). Short-term catecholamine response to psychological stress. Psychosom. Med. 42 (5), 493–497. doi:10.1097/00006842-198009000-00003
Diniz Bernardo, P., Bains, A., Westwood, S., and Mograbi, D. C. (2021). Mood induction using virtual reality: A systematic review of recent findings. J. Technol. Behav. Sci. 6 (1), 3–24. doi:10.1007/s41347-020-00152-9
Ditzen, B., Ehlert, U., and Nater, U. M. (2014). Associations between salivary alpha-amylase and catecholamines – a multilevel modeling approach. Biol. Psychol. 103, 15–18. doi:10.1016/j.biopsycho.2014.08.001
Doornen, L. J. P. van, and Blokland, R. W. van. (1992). The relationship between cardiovascular and catecholamine reactions to laboratory and real-life stress. Psychophysiology 29 (2), 173–181. doi:10.1111/j.1469-8986.1992.tb01682.x
Duncko, R., Cornwell, B., Cui, L., Merikangas, K. R., and Grillon, C. (2007). Acute exposure to stress improves performance in trace eyeblink conditioning and spatial learning tasks in healthy men. Learn. Mem. 14, 329–335. doi:10.1101/lm.483807
Eagle, M., and Leiter, E. (1964). Recall and recognition in intentional and incidental learning. J. Exp. Psychol. 68 (1), 58–63. doi:10.1037/h0044655
Edland, A., and Svenson, O. (1993). “Judgment and decision making under time pressure: Studies and findings,” in Time pressure and stress in human judgment and decision making. Editors O. Svenson, and A. J. Maule (New York, NY: Springer Science + Business Media), 27.
Edwards, W. (1956). Reward probability, amount, and information as determiners of sequential two-alternative decisions. J. Exp. Psychol. 52 (3), 177–188. doi:10.1037/h0047727
Farina, E. K., Thompson, L. A., Knapik, J., Pasiakos, S. M., McClung, J. P., and Lieberman, H. R. (2019). Physical performance, demographic, psychological, and physiological predictors of success in the U.S. Army Special Forces Assessment and Selection course. Physiology Behav. 210, 112647. doi:10.1016/j.physbeh.2019.112647
Felnhofer, A., Kothgassner, O. D., Schmidt, M., Heinzle, A.-K., Beutl, L., Hlavacs, H., et al. (2015). Is virtual reality emotionally arousing? Investigating five emotion inducing virtual park scenarios. Int. J. Human-Computer Stud. 82, 48–56. doi:10.1016/j.ijhcs.2015.05.004
Feltman, K. A., Hayes, A. M., Bernhardt, K. A., Nwala, E., and Kelley, A. M. (2019). Viability of tDCS in military environments for performance enhancement: A systematic review. Mil. Med. 185 (1–2), e53–e60. doi:10.1093/milmed/usz189
Fiedler, S., and Glockner, A. (2012). The dynamics of decision making in risky choice: An eye-tracking analysis. Front. Psychol. 3, 335. doi:10.3389/fpsyg.2012.00335
Filimon, F., Philiastides, M. G., Nelson, J. D., Kloosterman, N. A., and Heekeren, H. R. (2013). How embodied is perceptual decision making? Evidence for separate processing of perceptual and motor decisions. J. Neurosci. 33 (5), 2121–2136. doi:10.1523/JNEUROSCI.2334-12.2013
Flin, R., Salas, E., Straub, M., and Martin, L. (1997). Decision-making under stress: Emerging themes and applications. London, England: Ashgate.
Foley, P., and Kirschbaum, C. (2010). Human hypothalamus–pituitary–adrenal axis responses to acute psychosocial stress in laboratory settings. Neurosci. Biobehav. Rev. 35 (1), 91–96. doi:10.1016/j.neubiorev.2010.01.010
Franke, C., and Schweikart, J. (2017). Mental representation of landmarks on maps: Investigating cartographic visualization methods with eye tracking technology. Spatial Cognition Comput. 17 (1–2), 20–38. doi:10.1080/13875868.2016.1219912
Gagnon, S. A., and Wagner, A. D. (2016). Acute stress and episodic memory retrieval: Neurobiological mechanisms and behavioral consequences. Ann. N. Y. Acad. Sci. 1369, 55–75. doi:10.1111/nyas.12996
Gamble, K. R., Vettel, J. M., Patton, D. J., Eddy, M. D., Caroline Davis, F., Garcia, J. O., et al. (2018). Different profiles of decision making and physiology under varying levels of stress in trained military personnel. Int. J. Psychophysiol. 131, 73–80. doi:10.1016/j.ijpsycho.2018.03.017
Gigerenzer, G. (2008). Rationality for mortals: How people cope with uncertainty. Oxford University Press, 256. http://books.google.com/books?hl=en&lr=&id=16oCw8RLhNcC&pgis=1.
Giles, G. E., Mahoney, C. R., Brunyé, T. T., Taylor, H. A., and Kanarek, R. B. (2014). Stress effects on mood, HPA axis, and autonomic response: Comparison of three psychosocial stress paradigms. PLoS ONE 9 (12), e113618. doi:10.1371/journal.pone.0113618
Green, N., and Heekeren, H. R. (2009). Perceptual decision making: A bidirectional link between mind and motion. Prog. Brain Res. 174, 207–218. doi:10.1016/S0079-6123(09)01317-X
Grillon, C., Baas, J. P., Lissek, S., Smith, K., and Milstein, J. (2004). Anxious responses to predictable and unpredictable aversive events. Behav. Neurosci. 118 (5), 916–924. doi:10.1037/0735-7044.118.5.916
Hansen, A. L., Johnsen, B. H., and Thayer, J. F. (2009). Relationship between heart rate variability and cognitive function during threat of shock. Anxiety, Stress, Coping 22 (1), 77–89. doi:10.1080/10615800802272251
Heekeren, H. R., Marrett, S., Bandettini, P. A., and Ungerleider, L. G. (2004). A general mechanism for perceptual decision-making in the human brain. Nature 431, 859–862. doi:10.1038/nature02966
Heekeren, H. R., Marrett, S., and Ungerleider, L. G. (2008). The neural systems that mediate human perceptual decision making. Nat. Rev. Neurosci. 9 (6), 467–479. doi:10.1038/nrn2374
Hooge, I. T., and Erkelens, C. J. (1996). Control of fixation duration in a simple search task. Percept. Psychophys. 58 (7), 969–976. doi:10.3758/bf03206825
Hupbach, A., and Fieman, R. (2012). Moderate stress enhances immediate and delayed retrieval of educationally relevant material in healthy young men. Behav. Neurosci. 126 (6), 819–825. doi:10.1037/a0030489
Jensen, A. E., Bernards, J. R., Jameson, J. T., Johnson, D. C., and Kelly, K. R. (2020). The benefit of mental skills training on performance and stress response in military personnel. Front. Psychol. 10, 2964. doi:10.3389/fpsyg.2019.02964
Jha, A. P., Morrison, A. B., Dainer-Best, J., Parker, S., Rostrup, N., and Stanley, E. A. (2015). Minds "at attention ": Mindfulness training curbs attentional lapses in military cohorts. PLoS ONE 10, e0116889. doi:10.1371/journal.pone.0116889
Joëls, M., Pu, Z., Wiegert, O., Oitzl, M. S., and Krugers, H. J. (2006). Learning under stress: How does it work? Trends Cognitive Sci. 10 (4), 152–158. doi:10.1016/j.tics.2006.02.002
Kavanagh, J. (2005). Stress and performance: A review of the literature and its applicability to the military. Santa Monica, CA: RAND Corporation.
Keller, A. M., Taylor, H. A., and Brunyé, T. T. (2020). Uncertainty promotes information-seeking actions, but what information? Cognitive Res. Princ. Implic. 5 (1), 42. doi:10.1186/s41235-020-00245-2
Kemeny, M. E. (2003). The psychobiology of stress. Curr. Dir. Psychol. Sci. 12 (4), 124–129. doi:10.1111/1467-8721.01246
Kerous, B., Barteček, R., Roman, R., Sojka, P., Bečev, O., and Liarokapis, F. (2020). Examination of electrodermal and cardio-vascular reactivity in virtual reality through a combined stress induction protocol. J. Ambient Intell. Humaniz. Comput. 11 (12), 6033–6042. doi:10.1007/s12652-020-01858-7
Kim, E. J., Pellman, B., and Kim, J. J. (2015). Stress effects on the hippocampus: A critical review. Learn. Mem. 22 (9), 411–416. doi:10.1101/lm.037291.114
Kirschbaum, C., and Hellhammer, D. H. (1994). Salivary cortisol in psychoneuroendocrine research: Recent developments and applications. Psychoneuroendocrinology 19 (4), 313–333. doi:10.1016/0306-4530(94)90013-2
Kisker, J., Lange, L., Flinkenflügel, K., Kaup, M., Labersweiler, N., Tetenborg, F., et al. (2021). Authentic fear responses in virtual reality: A mobile eeg study on affective, behavioral and electrophysiological correlates of fear. Front. Virtual Real. 2. doi:10.3389/frvir.2021.716318
Kothe, C., Medine, D., Boulay, C., Grivich, M., and Stenner, K. (2021). Lab streaming layer. Available at: https://github.com/sccn/labstreaminglayer.
Kozlowski, L. T., and Bryant, K. J. (1977). Sense of direction, spatial orientation, and cognitive maps. J. Exp. Psychol. Hum. Percept. Perform. 3 (4), 590–598. doi:10.1037/0096-1523.3.4.590
Krajbich, I., Armel, C., and Rangel, A. (2010). Visual fixations and the computation and comparison of value in simple choice. Nat. Neurosci. 13, 1292–1298. doi:10.1038/nn.2635
Kudielka, B. M., and Kirschbaum, C. (2005). Sex differences in HPA axis responses to stress: A review. Biol. Psychol. 69 (1), 113–132. doi:10.1016/j.biopsycho.2004.11.009
Kudielka, B. M., Schommer, N. C., Hellhammer, D. H., and Kirschbaum, C. (2004). Acute HPA axis responses, heart rate, and mood changes to psychosocial stress (TSST) in humans at different times of day. Psychoneuroendocrinology 29 (8), 983–992. doi:10.1016/j.psyneuen.2003.08.009
Kuhl, J. (1986). “Motivation and information processing: A new look at decision making, dynamic change, and action control,” in Handbook of motivation and cognition: Foundations of social behavior (New York, NY: Guilford Press), 404–434.
Lang, P., Bradley, M., and Cuthbert, B. (2008). International affective picture system (IAPS): Affective ratings of pictures and instruction manual. Gailesville, FL: University of Florida. Technical Report A-8. In Technical Report A-8. (Technical Report A-4; p. Technical Report A-8.). doi:10.1016/j.epsr.2006.03.016
Lang, P., Greenwald, M., Bradley, M., and Hamm, A. (1993). Looking at pictures: Affective, facial, visceral, and behavioral reactions. Psychophysiology 30 (3), 261–273. doi:10.1111/j.1469-8986.1993.tb03352.x
Ledford, A. K., Dixon, D., Luning, C. R., Martin, B. J., Miles, P. C., Beckner, M., et al. (2020). Psychological and physiological predictors of resilience in navy SEAL training. Behav. Med. 46 (3–4), 290–301. doi:10.1080/08964289.2020.1712648
Levine, A., Zagoory-Sharon, O., Feldman, R., Lewis, J. G., and Weller, A. (2007). Measuring cortisol in human psychobiological studies. Physiology Behav. 90 (1), 43–53. doi:10.1016/j.physbeh.2006.08.025
Liberzon, I., Taylor, S. F., Amdur, R., Jung, T. D., Chamberlain, K. R., Minoshima, S., et al. (1999). Brain activation in PTSD in response to trauma-related stimuli. Biol. Psychiatry 45 (7), 817–826. doi:10.1016/S0006-3223(98)00246-7
Lipshitz, R., and Strauss, O. (1997). Coping with uncertainty: A naturalistic decision-making analysis. Organ. Behav. Hum. Decis. Process. 69 (2), 149–163. doi:10.1006/obhd.1997.2679
Luine, V., Villegas, M., Martinez, C., and McEwen, B. S. (1994). Repeated stress causes reversible impairments of spatial memory performance. Brain Res. 639 (1), 167–170. doi:10.1016/0006-8993(94)91778-7
Martin, K., McLeod, E., Periard, J., Rattray, B., Keegan, R., and Pyne, D. B. (2019). The impact of environmental stress on cognitive performance: A systematic review. Impact Environ. Stress Cognitive Perform. A Syst. Rev. 61 (8), 1205–1246. doi:10.1177/0018720819839817
Mather, M., and Sutherland, M. R. (2011). Arousal-biased competition in perception and memory. Perspect. Psychol. Sci. 6 (2), 114–133. doi:10.1177/1745691611400234
McCarley, J. S., Kramer, A. F., Wickens, C. D., Vidoni, E. D., and Boot, W. R. (2004). Visual skills in airport-security screening. Psychol. Sci. 15 (5), 302–306. doi:10.1111/j.0956-7976.2004.00673.x
McCullough, A. M., Ritchey, M., Ranganath, C., and Yonelinas, A. (2015). Differential effects of stress-induced cortisol responses on recollection and familiarity-based recognition memory. Neurobiol. Learn. Mem. 123, 1–10. doi:10.1016/j.nlm.2015.04.007
McEwen, B. S. (2007). Physiology and neurobiology of stress and adaptation: Central role of the brain. Physiol. Rev. 87 (3), 873–904. doi:10.1152/physrev.00041.2006
Meyers, J. L. (2014). “Probability learning and sequence learning,” in Handbook of learning and cognitive processes (London: Psychology Press), Vol. 3.
Miletic, S. (2016). Neural evidence for a role of urgency in the speed-accuracy trade-off in perceptual decision-making. J. Neurosci. 36 (22), 5909–5910. doi:10.1523/jneurosci.0894-16.2016
Miller, R., and Plessow, F. (2013). Transformation techniques for cross-sectional and longitudinal endocrine data: Application to salivary cortisol concentrations. Psychoneuroendocrinology 38 (6), 941–946. doi:10.1016/j.psyneuen.2012.09.013
Morales, J. M., Cho, P., Bickford, J. R., Pellegrino, P. M., Leake, G., and Fanto, M. L. (2021). Development of army relevant wearable Photonic Integrated Circuit (PIC) biosensors. Chem. Biol. Radiological, Nucl. Explos. (CBRNE) Sens. XXII, 11749117490G. doi:10.1117/12.2587098
Nagy, T., van Lien, R., Willemsen, G., Proctor, G., Efting, M., Fülöp, M., et al. (2015). A fluid response: Alpha-amylase reactions to acute laboratory stress are related to sample timing and saliva flow rate. Biol. Psychol. 109, 111–119. doi:10.1016/j.biopsycho.2015.04.012
Nater, U. M., La Marca, R., Florin, L., Moses, A., Langhans, W., Koller, M. M., et al. (2006). Stress-induced changes in human salivary alpha-amylase activity—associations with adrenergic activity. Psychoneuroendocrinology 31 (1), 49–58. doi:10.1016/j.psyneuen.2005.05.010
Nater, U. M., Rohleder, N., Gaab, J., Berger, S., Jud, A., Kirschbaum, C., et al. (2005). Human salivary alpha-amylase reactivity in a psychosocial stress paradigm. Int. J. Psychophysiol. 55 (3), 333–342. doi:10.1016/j.ijpsycho.2004.09.009
Nater, U. M., and Rohleder, N. (2009). Salivary alpha-amylase as a non-invasive biomarker for the sympathetic nervous system: Current state of research. Psychoneuroendocrinology 34 (4), 486–496. doi:10.1016/j.psyneuen.2009.01.014
Oei, N. Y. L., Everaerd, W. T. A. M., Elzinga, B. M., van Well, S., and Bermond, B. (2006). Psychosocial stress impairs working memory at high loads: An association with cortisol levels and memory retrieval. Stress 9 (3), 133–141. doi:10.1080/10253890600965773
Olver, J. S., Pinney, M., Maruff, P., and Norman, T. R. (2015). Impairments of spatial working memory and attention following acute psychosocial stress. Stress Health 31 (2), 115–123. doi:10.1002/smi.2533
Pabst, S., Brand, M., and Wolf, O. T. (2013). Stress and decision making: A few minutes make all the difference. Behav. Brain Res. 250, 39–45. doi:10.1016/j.bbr.2013.04.046
Padgett, D. A., and Glaser, R. (2003). How stress influences the immune response. Trends Immunol. 24 (8), 444–448. doi:10.1016/S1471-4906(03)00173-X
Pakhomov, S. V. S., Thuras, P. D., Finzel, R., Eppel, J., and Kotlyar, M. (2020). Using consumer-wearable technology for remote assessment of physiological response to stress in the naturalistic environment. PLOS ONE 15 (3), e0229942. doi:10.1371/journal.pone.0229942
Parsons, I. T., Stacey, M. J., and Woods, D. R. (2019). Heat adaptation in military personnel: Mitigating risk, maximizing performance. Front. Physiology 10, 1485. doi:10.3389/fphys.2019.01485
Patton, D., and Gamble, K. (2016). “Physiological measures of arousal during soldier-relevant tasks performed in a simulated environment,” in Foundations of augmented cognition: Neuroergonomics and operational neuroscience. Editors D. D. Schmorrow, and C. M. Fidopiastis (Springer International Publishing), 372–382. doi:10.1007/978-3-319-39955-3_35
Patton, D., Loukota, P., and Avery, E. (2013). “Using the immersive cognitive readiness simulator to validate the ThreatFire belt as an operational stressor: A pilot study,” in Proceedings of the 22nd annual conference on behavior representation in modeling and simulation. Available at: https://www.researchgate.net/profile/Debbie-Patton/publication/309631573_BRIMS2013-140/links/581aa76208ae30a2c01cb506/BRIMS2013-140.pdf.
Payne, B. K. (2001). Prejudice and perception: The role of automatic and controlled processes in misperceiving a weapon. J. Personality Soc. Psychol. 81, 181–192. doi:10.1037/0022-3514.81.2.181
Philiastides, M. G., Auksztulewicz, R., Heekeren, H. R., and Blankenburg, F. (2011). Causal role of dorsolateral prefrontal cortex in human perceptual decision making. Curr. Biol. 21 (11), 980–983. doi:10.1016/j.cub.2011.04.034
Philiastides, M. G., and Sajda, P. (2006). Temporal characterization of the neural correlates of perceptual decision making in the human brain. Cereb. Cortex 16 (4), 509–518. doi:10.1093/cercor/bhi130
Porcelli, A. J., Cruz, D., Wenberg, K., Patterson, M. D., Biswal, B. B., and Rypma, B. (2008). The effects of acute stress on human prefrontal working memory systems. Physiology Behav. 95 (3), 282–289. doi:10.1016/j.physbeh.2008.04.027
Richardson, A. E., and VanderKaay Tomasulo, M. M. (2011). Influence of acute stress on spatial tasks in humans. Physiology Behav. 103, 459–466. doi:10.1016/j.physbeh.2011.03.019
Robinson, O. J., Letkiewicz, A. M., Overstreet, C., Ernst, M., and Grillon, C. (2011). The effect of induced anxiety on cognition: Threat of shock enhances aversive processing in healthy individuals. Cognitive, Affect. Behav. Neurosci. 11 (2), 217–227. doi:10.3758/s13415-011-0030-5
Roozendaal, B., McEwen, B. S., and Chattarji, S. (2009). Stress, memory and the amygdala. Nat. Rev. Neurosci. 10 (6), 423–433. doi:10.1038/nrn2651
Sapolsky, R. M., Romero, L. M., and Munck, A. U. (2000). How do glucocorticoids influence stress responses? Integrating permissive, suppressive, stimulatory, and preparative actions. Endocr. Rev. 21 (1), 55–89. doi:10.1210/edrv.21.1.0389
Schwabe, L., Joëls, M., Roozendaal, B., Wolf, O. T., and Oitzl, M. S. (2012). Stress effects on memory: An update and integration. Neurosci. Biobehav. Rev. 36 (7), 1740–1749. doi:10.1016/j.neubiorev.2011.07.002
Schwabe, L., Oitzl, M. S., Philippsen, C., Richter, S., Bohringer, A., Wippich, W., et al. (2007). Stress modulates the use of spatial versus stimulus-response learning strategies in humans. Learn. Mem. 14 (1), 109–116. doi:10.1101/lm.435807
Seddon, J. A., Rodriguez, V. J., Provencher, Y., Raftery-Helmer, J., Hersh, J., Labelle, P. R., et al. (2020). Meta-analysis of the effectiveness of the Trier Social Stress Test in eliciting physiological stress responses in children and adolescents. Psychoneuroendocrinology 116, 104582. doi:10.1016/j.psyneuen.2020.104582
Seidel, E.-M., Pfabigan, D. M., Hahn, A., Sladky, R., Grahl, A., Paul, K., et al. (2015). Uncertainty during pain anticipation: The adaptive value of preparatory processes. Hum. Brain Mapp. 36 (2), 744–755. doi:10.1002/hbm.22661
Shadlen, M. N., and Kiani, R. (2013). Decision making as a window on cognition. Neuron 80, 791–806. doi:10.1016/j.neuron.2013.10.047
Shelton, A. L., and Mcnamara, T. P. (2001). Systems of spatial reference in human memory. Cogn. Psychol. 43 (4), 274–310. doi:10.1006/cogp.2001.0758
Shepard, R. N. (1967). Recognition memory for words, sentences, and pictures. J. Verbal Learn. Verbal Behav. 6 (1), 156–163. doi:10.1016/S0022-5371(67)80067-7
Shields, G. S., Bonner, J., and Moons, W. (2015). Does cortisol influence core executive functions? A meta-analysis of acute cortisol administration effects on working memory, inhibition, and set-shifting. Psychoneuroendocrinology 58, 91–103. doi:10.1016/j.psyneuen.2015.04.017
Shields, G. S., Rivers, A. M., Ramey, M. M., Trainor, B. C., and Yonelinas, A. P. (2019). Mild acute stress improves response speed without impairing accuracy or interference control in two selective attention tasks: Implications for theories of stress and cognition. Psychoneuroendocrinology 108, 78–86. doi:10.1016/j.psyneuen.2019.06.001
Shields, G. S., Sazma, M. A., McCullough, A. M., and Yonelinas, A. P. (2017). The effects of acute stress on episodic memory: A meta-analysis and integrative review. Psychol. Bull. 143 (6), 636–675. doi:10.1037/bul0000100
Shields, G. S., Sazma, M. A., and Yonelinas, A. P. (2016). The effects of acute stress on core executive functions: A meta-analysis and comparison with cortisol. Neurosci. Biobehav. Rev. 68, 651–668. doi:10.1016/j.neubiorev.2016.06.038
Sloan, R. P., Shapiro, P. A., Bagiella, E., Bigger, J. T., Lo, E. S., and Gorman, J. M. (1996). Relationships between circulating catecholamines and low frequency heart period variability as indices of cardiac sympathetic activity during mental stress. Psychosom. Med. 58 (1), 25–31. doi:10.1097/00006842-199601000-00005
Smith, C. D. (1984). The relationship between the pleasingness of landmarks and the judgement of distance in cognitive maps. J. Environ. Psychol. 4 (3), 229–234. doi:10.1016/S0272-4944(84)80044-4
Smith, S. M., and Vale, W. W. (2006). The role of the hypothalamic-pituitary-adrenal axis in neuroendocrine responses to stress. Dialogues Clin. Neurosci. 8 (4), 383–395. doi:10.31887/dcns.2006.8.4/ssmith
Spielberger, C. D., Gorsuch, R. L., Lushene, P. R., Vagg, P. R., and Jacobs, G. A. (1983). Manual for the state-trait anxiety inventory. Palo Alto, CA: Consulting Psychologists Press. doi:10.1037/t06496-000
Standage, D., Blohm, G., and Dorris, M. C. (2014). On the neural implementation of the speed-accuracy trade-off. Front. Neurosci. 8, 236. doi:10.3389/fnins.2014.00236
Starcke, K., and Brand, M. (2012). Decision making under stress: A selective review. Neurosci. Biobehav. Rev. 36 (4), 1228–1248. doi:10.1016/j.neubiorev.2012.02.003
Suess, W. M., Alexander, A. B., Smith, D. D., Sweeney, H. W., and Marion, R. J. (1980). The effects of psychological stress on respiration: A preliminary study of anxiety and hyperventilation. Psychophysiology 17 (6), 535–540. doi:10.1111/j.1469-8986.1980.tb02293.x
Sullivan-Kwantes, W., Haman, F., Kingma, B. R. M., Martini, S., Gautier-Wong, E., Chen, K. Y., et al. (2020). Human performance research for military operations in extreme cold environments. J. Sci. Med. Sport 24, 954–962. doi:10.1016/j.jsams.2020.11.010
Susindar, S., Sadeghi, M., Huntington, L., Singer, A., and Ferris, T. K. (2019). The feeling is real: Emotion elicitation in virtual reality. Proc. Hum. Factors Ergonomics Soc. Annu. Meet. 63 (1), 252–256. doi:10.1177/1071181319631509
Taylor, M. K., Markham, A. E., Reis, J. P., Padilla, G. A., Potterat, E. G., Drummond, S. P. A., et al. (2008). Physical fitness influences stress reactions to extreme military training. Mil. Med. 173 (8), 738–742. doi:10.7205/MILMED.173.8.738
Terkelsen, A. J., Mølgaard, H., Hansen, J., Andersen, O. K., and Jensen, T. S. (2005). Acute pain increases heart rate: Differential mechanisms during rest and mental stress. Aut. Neurosci. 121 (1), 101–109. doi:10.1016/j.autneu.2005.07.001
Terse-Thakoor, T., Punjiya, M., Matharu, Z., Lyu, B., Ahmad, M., Giles, G. E., et al. (2020). Thread-based multiplexed sensor patch for real-time sweat monitoring. Npj Flex. Electron. 4 (1), 18. Article 1. doi:10.1038/s41528-020-00081-w
Teruhisa, U., Ryoji, H., Taisuke, I., Tatsuya, S., Fumihiro, M., and Tatsuo, S. (1981). Use of saliva for monitoring unbound free cortisol levels in serum. Clin. Chim. Acta 110 (2), 245–253. doi:10.1016/0009-8981(81)90353-3
Troxel, W. M., Shih, R. A., Pedersen, E. R., Geyer, L., Fisher, M. P., Griffin, B. A., et al. (2015). Sleep in the military: Promoting healthy sleep among U.S. Servicemembers. Rand Health Q. 5 (2), 19.
van Stegeren, A. H., Wolf, O. T., and Kindt, M. (2008). Salivary alpha amylase and cortisol responses to different stress tasks: Impact of sex. Int. J. Psychophysiol. 69 (1), 33–40. doi:10.1016/j.ijpsycho.2008.02.008
Watson, D. (1988). Intraindividual and interindividual analyses of positive and negative affect: Their relation to health complaints, perceived stress, and daily activities. J. Personality Soc. Psychol. 54 (6), 1020–1030. doi:10.1037//0022-3514.54.6.1020
Werkhoven, P., van Erp, J. B. F., and Philippi, T. G. (2014). Navigating virtual mazes: The benefits of audiovisual landmarks. Displays 35 (3), 110–117. doi:10.1016/j.displa.2014.04.001
Zelinsky, G., and Sheinberg, D. (1995). Why some search tasks take longer than others: Using eye movements to redefine reaction times. Stud. Vis. Inf. Process. 6 (C), 325–336. doi:10.1016/S0926-907X(05)80028-5
Keywords: virtual reality, acute stress, decision making, eye tracking, marksmanship, memory, spatial orientation, methods
Citation: Brunyé TT and Giles GE (2023) Methods for eliciting and measuring behavioral and physiological consequences of stress and uncertainty in virtual reality. Front. Virtual Real. 4:951435. doi: 10.3389/frvir.2023.951435
Received: 24 May 2022; Accepted: 03 January 2023;
Published: 17 January 2023.
Edited by:
Richard So, Hong Kong University of Science and Technology, Hong Kong SAR, ChinaReviewed by:
Prabha Sundaravadivel, University of Texas at Tyler, United StatesBenjamin Schöne, Osnabrück University, Germany
Copyright © 2023 Brunyé and Giles. This is an open-access article distributed under the terms of the Creative Commons Attribution License (CC BY). The use, distribution or reproduction in other forums is permitted, provided the original author(s) and the copyright owner(s) are credited and that the original publication in this journal is cited, in accordance with accepted academic practice. No use, distribution or reproduction is permitted which does not comply with these terms.
*Correspondence: Tad T. Brunyé, dGJydW55MDFAdHVmdHMuZWR1