 Judith Josupeit
- Engineering Psychology and Applied Cognitive Research, Institute of Work, Organisational and Social Psychology, Technical University Dresden, Dresden, Germany
Background: Virtual Reality (VR) does not only include the use of stereoscopic images, but also possibilities for an interaction with and participation in a computer-generated environment. However, laboratory studies primarily focus on the first part of the definition only. In this context, comparing results from different VR applications with diverging goals becomes difficult. This is especially true in the field of cybersickness research (visually induced motion sickness in VR), as self-report symptom questionnaires are used. The prominent Simulator Sickness Questionnaire (SSQ) is criticized for the lack of specificity, the double factorial loadings, the outdatedness, and the unrepresentative sample. VR-specific revisions like the Virtual Reality Sickness Questionnaire (VRSQ) address these criticisms but lack generalizability.
Methods: The current paper uses a Confirmatory Factor Analysis of the VRSQ with data from three different VR environments and a sample size of N = 244. The environments had different setups, visual complexities, and interaction possibilities. These characteristics influenced the factorial structure of the VRSQ as a moderator. Furthermore, to control for VR-unrelated effects Baseline ratings were taken into account.
Results: The Confirmatory Factor Analysis indicated a moderate fit for the global model, but a misspecification for two of the three environments. Only the environment similar to the original VRSQ paper converged with the model.
Conclusions: In conclusion, a detailed description of the VR environment is required in scientific method reports. Focusing on VR accessibility for physically impaired in addition to healthy subjects, an added Baseline measurement can address the discriminant validity. Until generalizable VR-specific revisions of the SSQ are validated, the paper suggests using the Δ-SSQ in aggregated raw format.
1 Introduction
Although the concept of virtual reality (VR) is not very new—it was introduced into literature almost a century ago by science fiction novelist Weinbaum (2012) (repubilshed; first published in 1935)—unequivocal definitions are lacking. It is generally agreed that VR requires an interactive, participatory environment enabled by virtuality. Virtuality means that a virtual system, such as a computer, creates a new sense of “reality” for an individual, not necessarily related to “the reality as we know it” (Turoff, 1997), i.e., the physical world. A necessary but not sufficient feature of virtuality is three-dimensional imagery, which is provided by shutter glasses in CAVEs or stereoscopic displays in HMDs. However, laboratory studies applying VR hardware often focus on 3D perception only while deemphasizing features like interaction and participation (e.g., Liao et al., 2020). That is not surprising since interactive environments lead to movement artifacts of sampled process indicators, increased complexity, which can reduce the rendering performance, and limited controllability, which decreases the comparability between different subjects or trials. Therefore, studies of user experience differ depending on the interpretation of the definition. While some try to achieve naturalistic use cases, others are only focusing on selected aspects of VR, resulting in diverging simulation-specific effects (Palmisano and Constable, 2022). There are no clear minimum requirements for designating a particular simulation as “VR”. Hence, a detailed methods section is highly important for the comparison of results from different studies.
Whereas VR already lacks a clear definition, which complicates a straightforward comparison between studies, the user experience with VR varies even more on an individual level. Depending on various factors (e.g., previous experience, balance disorders, and others yet unknown) the same VR application might be evaluated as exciting and fascinating or uncomfortable and nauseating. The latter case can be subsumed under the term cybersickness and ranges from general discomfort to nausea and vertigo (LaViola, 2000; Rebenitsch and Owen, 2016). In severe cases, cybersickness can even lead to fainting (see Experiment 1). Thus, cybersickness is not only a threat to a comforting experience but also to users’ safety.
The first morpheme of the compound “cyber” derives from cybernetics and emphasizes the virtually generated artificiality and the interactivity associated with VR applications (Ning et al., 2017). The second morpheme “sickness” could be misleading as cybersickness is no illness, but rather a normal physiological reaction to the artificial environment (Bos et al., 2022). It should be stressed that these symptoms are visually induced and can be assessed in healthy individuals across all ages (Arns and Cerney, 2005; Petri et al., 2020). For implementing countermeasures for susceptible individuals the vague symptom conglomerate of cybersickness needs to be comprehensively reported.
As previously mentioned many process indicators are prone to movement artifacts. Thus, process indicators are not universally implementable as online measures in interactive VR. Furthermore, their interpretation can be ambiguous. A supplementary, efficient, and economical approach is the use of self-assessment questionnaires: For different use cases like screening or online assessment, different classes of self-rating scales are applied. Thus, multi-item questionnaires are used to gain insight into the facets of cybersickness symptoms.
The most prominent multi-item questionnaire for assessing cybersickness was derived from military simulator studies in the 1990s: the Simulator Sickness Questionnaire (SSQ, Kennedy et al., 1993). The SSQ contains 16 items on a scale from 0 to 3 (none, slight, moderate, severe). A factor analysis revealed three subscales of the SSQ: Nausea, Oculomotor symptoms, and Disorientation. These subscales are weighted differently and summarized to calculate the SSQ total score. For a detailed overview of the scoring and weighing procedures of the SSQ the reader is referred to the grey highlighted part of Table 1.
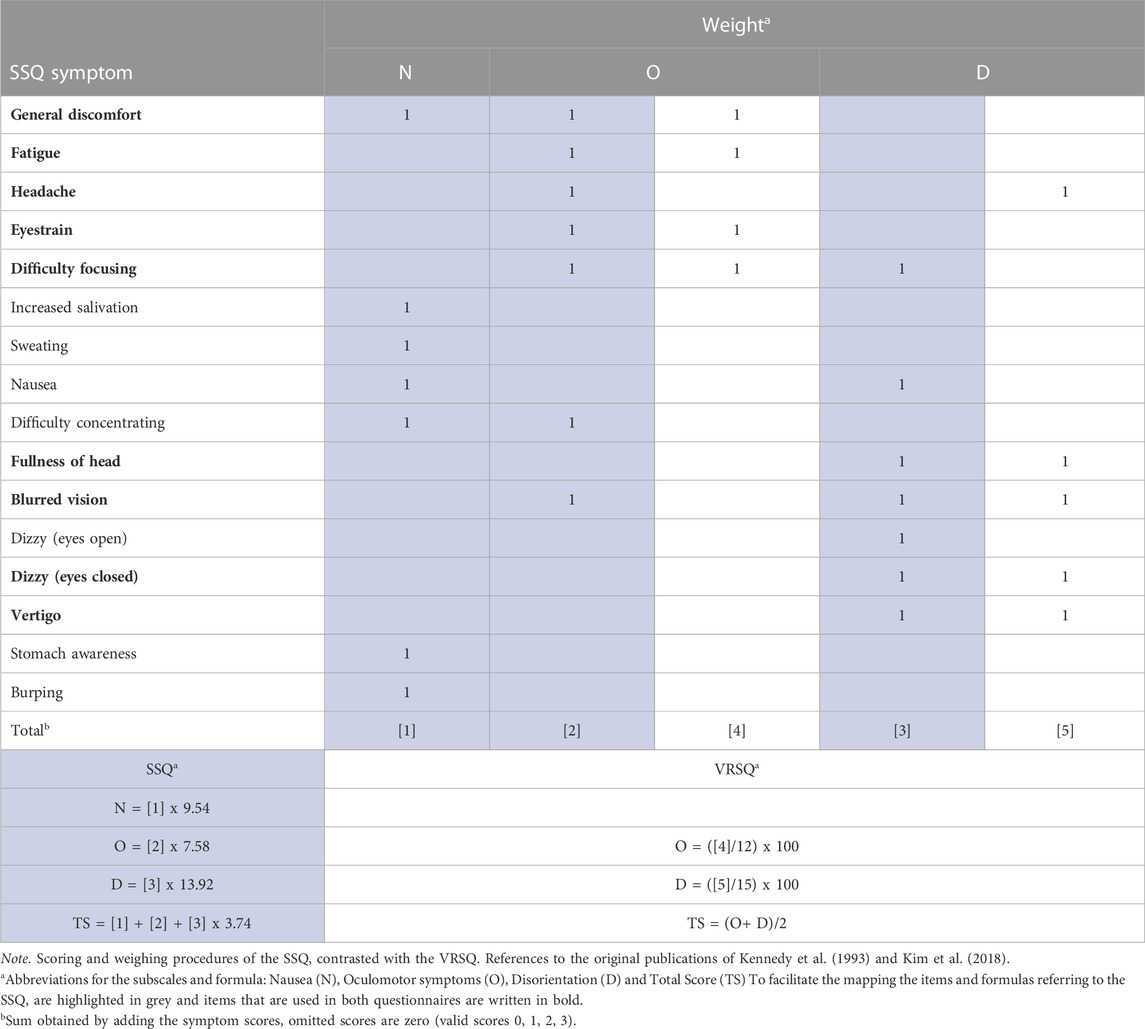
TABLE 1. Comparison of SSQ and VRSQ in scoring and weighing procedures.
Despite its popularity, the SSQ has some shortcomings. Originally, the SSQ was validated by testing military personnel, which may limit its applicability to the general population. Nevertheless, as a symptom questionnaire, the SSQ is still widely used because it is unlikely to miss symptoms. On the other hand, it may be inflated with irrelevant items, e.g., burping, which might be denied due to social desirability. Furthermore, hard- and software have evolved which might decrease the appropriateness of the items and underlying factorial loadings for today’s VR applications.
As the name suggests the SSQ was initially designed for assessing simulator sickness, a related construct to cybersickness, as both “sicknesses” are subsumed under visually induced motion sickness (VIMS). However, there is an ongoing discussion about the extent to which cybersickness and simulator sickness are related (Stanney et al., 1997; Bos et al., 2022). This argument gains plausibility when the distinctive degrees of freedom are considered. While VR applications vary in posture, interaction possibilities, and immersive components, a simulator typically imposes more constraints, such as a seated posture, non-stereoscopic images, and no head tracking. In addition, the factorial double loadings of the SSQ subscales are suboptimal from a test theory perspective (see Table 1). This means that two items are loading on the factors Nausea and Oculomotor symptoms, while two other items are loading on Oculomotor symptoms and Disorientation as well as the item Nausea that is not only loading on Nausea but also on Disorientation. When calculating the total score therefore some items contribute more than others, not only by applying different weights to the subscales but also by the doubled influence on the total score. This is especially problematic as there is an ongoing discussion about the contrary symptom profiles of cybersickness and simulator sickness. Opposed to simulators, in VR, Disorientation was found to be the predominant symptom and Oculomotor the least, additionally, the severity was estimated inflationary high when standard weights were applied (Stanney et al., 1997). To conclude the SSQ with its weighting procedures for the subscales and the total score is not adequate to represent the symptom profiles experienced in today’s VR applications (Sevinc and Berkman, 2020).
Revisions of the SSQ in Bouchard et al. (2007) and Balk et al. (2017) attempted to eliminate the factorial double loadings and outdatedness but gained less recognition compared to the SSQ. Another revision of the SSQ is the Virtual Reality Sickness Questionnaire (VRSQ, Kim et al., 2018). Like the SSQ, the VRSQ uses a scale from 0 to 3 and the same wording for the 9 remaining items that were extracted via an exploratory factor analysis from the SSQ. As the name suggests, it was conceptualized for VR applications. In line with the definition, virtuality was enabled through VR hardware (Samsung Gear VR), and the interaction and participation were addressed by a target selection task. Additionally, the representation of the general population is addressed in two ways: First, the gender was equally distributed among males and females and second, the study sample consisted of participants with little previous experience with VR. Compared to the SSQ the VRSQ comes with a simpler underlying factorial structure and only two remaining factors Oculomotor and Disorientation without any specific weighting and no shared loadings. A detailed comparison of SSQ and VRSQ can be found in Table 1.
As the authors of the VRSQ stated the “generalization is limited […] and the tasks performed in the experiment were constrained” (Kim et al., 2018, p.72). To date, the VRSQ has not been validated with different VR environments or a larger sample—the original study had only 24 participants. To overcome these shortcomings VR-specific revisions of the SSQ should not only be postulated but also need to be applied and validated. Therefore, the objective of this paper is to confirm the factorial structure of the VRSQ postulated by Kim et al. (2018) with a larger sample size (N = 244) with three different VR environments, an extension in generalizability compared to the original paper. These environments firstly differed in the degree of interaction possibilities with VR and secondly varied in the degrees of freedom of the posture of the participant from seated to standing and room-scale VR. In contrast to the original paper, a Baseline and Post-VR comparison was added to distinguish between VR-related and other aspects (e.g., an uneasy feeling induced by nervousness) in the ratings. To attribute the symptoms as VR-related Δ-VRSQ-scores were used instead of the Post-VR scores. This procedure is in line with the suggestion of Young et al. (2007), who argue that demand characteristics lead to inflated ratings in motion sickness questionnaires when deployed repeatedly.
2 Methods
The data were collected in three consecutive studies1 with three setups (seated, standing, and room-scale VR) and three interaction possibilities (none, use of a controller to manipulate a virtual object or for the “magic carpet” locomotion of the virtual camera, i.e., constant linear acceleration via controller input). The studies are numbered chronologically (the first study in January 2020, the second from October to November 2020, and the third from December 2020 to January 2021). For the second and the third study, the COVID-19 pandemic made it necessary to follow the university’s hygiene restrictions. Following the hygiene restrictions, participants and experimenters had to wear an FFP2 (K95) face mask when the safety distance was too small, i.e., before and after VR exposure while the HMD was adjusted, and participants were given disposable gloves before touching any of the experimental equipment. Information common to all studies is presented in an aggregated form, with only the specifics highlighted where necessary. To facilitate the mapping of the participants per study and application-specific experimental tasks this information is provided separately.
2.1 Participants
2.1.1 Environment 1: rod and frame test
In total 87 participants volunteered to take part in this study. Reaching the previously set termination condition eight participants had to be excluded from the final analysis (more information on the termination condition in the procedures section). Additionally, one participant did not comply with the experimental task. Thus, the experimenter terminated the VR application after an exposition of 45 min. In addition, the procedure for two participants did not comply with the protocol due to the experimenter’s inattention. Furthermore, one participant fainted during the experiment, which was an unanticipated occupational health concern. As a result, the study was terminated prematurely after this accident. The remaining 75 participants’ gender diversified into 49 males, 24 females, and two diverse individuals. Their age ranged from 19 to 63 years (M = 25.2 years, SD = 6.4).
2.1.2 Environment 2: the optokinetic drum
For this study, a total of 70 volunteering participants were recruited. Seven participants had to be excluded from the final analysis because they reached the termination condition. Moreover, due to experimenters’ errors in coding two datasets were missing and another data set was incomplete because of technical malfunction of the hardware. Thus, 59 participants were analyzed from the second environment for this paper. Of these participants, 25 reported their gender as male, 33 as female, and one as diverse. Their age ranged from 18 to 38 years (M = 23.8 years, SD = 4.4).
2.1.3 Environment 3: the city
A total 119 of participants came to the laboratory. One participant had to be excluded because they participated in Study 2. As Study 3 followed immediately after Study 2, participation in Study 2 was added as an exclusion criterion for Study 3. In addition, five participants reached the termination condition during the VR exposure. Moreover, due to experimenters’ errors, two datasets were missing and another dataset was missing because of technical malfunctions of the hardware. Therefore, 110 participants were eligible for the final analysis. Of these participants, 51 identified as male and 59 as female. The age distribution was broad, ranging from 18 to 64 years (M = 24.1 years, SD = 5.7).
2.2 Procedures
The participants were recruited through notices and available flyers on campus and through the participants’ data bank central experimental server of the Technical University Dresden (ORSEE3). For safety reasons, participants were excluded if they were underage (≤17 years), had epilepsy, had a history of migraines, were pregnant, and/or had uncorrected visual impairments.
Participants were instructed to refrain from eating 2 h before their session. The participants’ demographic and experimental data were analyzed in anonymized and aggregated form. The studies conformed to the ethical guidelines of the Declaration of Helsinki and received prior ethical approval from the local ethics committee of the Technical University Dresden (EK530122019, SR-EK-315072020, and SR-EK-316072020). The ethic proposal defined in line with the literature a termination condition of 6 or higher on an online single-item scale indicating nausea (MISC, Misery Scale, see Bos et al., 2005; Kuiper et al., 2020).
After reception and signing the informed consent, the participants completed a demographic questionnaire and were familiarized with the VRSQ and the MISC that were used to assess cybersickness before, (during) and after the VR exposure. Moreover, for the interactive environments, the handling and the terminology of the controller components (i.e., trackpad and trigger) were explained. Because the topic is so sensitive, participants were assured that they could withdraw from the study at any time without any negative consequences. The experimenter told the participants to stand at or sit in the designated place in the laboratory and adjusted the flexible strips of the HMD. Participants were instructed to adjust the IPD and eye relief of the HMD lenses if they experienced blurred vision. The participants’ baseline state of the VRSQ and the MISC was assessed verbally. During VR exposure in Environments 2 and 3, the MISC was asked every 2 min. This is in contrast to the procedure in Environment 1 as the likelihood of getting cybersickness was estimated low relying on pilot tests. Furthermore, participants should not have felt any time pressure during experimental task 1. The different experimental tasks are explained in more detail in the designated section.
After the VR exposure, the VRSQ and the MISC were assessed again. Then, the experimenter removed the HMD and made sure the participant was capable of leaving. Participants were debriefed and compensated with either course credit or 5€ per 0.5 h of participation.
2.3 Materials
Studies 2 and 3 used the Pupil Labs Eye-Tracking Add-On lenses (Pupil Labs Technical Spcifications on https://pupil-labs.com/products/vr-ar/tech-specs, Berlin 2019) and distinctive Plugins and Calibration Procedures. For brevity, the following section focuses on materials that are relevant to all environments. Characteristic software features that are distinct for each environment will be mentioned in the upcoming section. The rendering computer was custom-built with an Intel Core i7-9700K processor and an NVIDIA GeForce RTX 2070 graphic controller. For the VR exposure, the HTC Vive was deployed (HTC, with technology by Valve, 2016). All VR environments were created using Unity (v2018.3.9f1/v2019.1.11f1). The main camera came from the Steam VR asset, which also allowed for custom controller input when interaction was desired. Moreover, to create some of the custom game objects for all environments Blender (2.90) was used. All keys on the experimenter’s keyboard that had a specific function were labeled accordingly. The demographic questions were collected with SoSciSurvey or LimeSurvey and displayed on a Tablet with a touchscreen (Samsung Galaxy Tab A10.1). Statistical analyses were performed in R 4.2.1 (R Core Team, 2022).; noteworthy R-Packages used were MANOVA.RM (Friedrich et al., 2019), lavaan (Rosseel, 2012), and for visualization the free software Ωnyx (von Oertzen et al., 2015).
2.4 Experimental tasks
2.4.1 Environment 1: the rod and frame test
For this environment, the participants were instructed to stand as still as possible to reduce any artifacts in perspective by head rotation. The VR environment consisted of a simple illuminated frame and an imaginary rod represented by two dots in a dark room (see Figure 1). Therefore, visual complexity was low and interaction was only possible with the two objects. The participant could start each trial of the Rod and Frame Test (RFT) self-paced by pressing the trigger of the controller. If the trigger was pressed accidently, the experimenter could reset the trial by pressing the escape key on the keyboard. The participant’s task was to adjust the imaginary rod vertically. The rod rotated with 0.001° per input signal either in positive or negative z-direction in Unity coordinates (Left-handed and Y-up coordinates) depending on the trackpad’s side that was pressed by the participant.
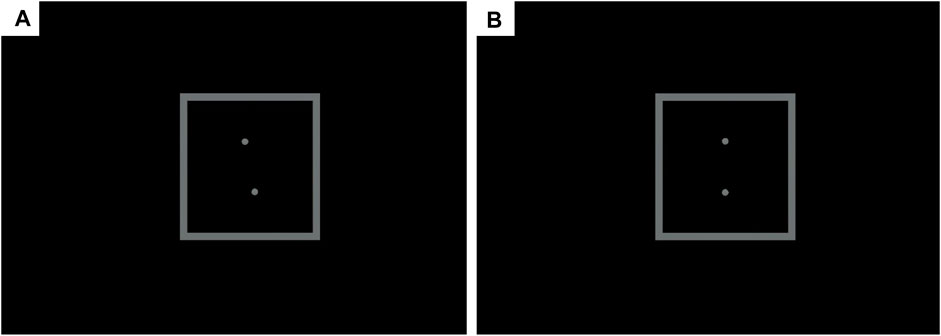
FIGURE 1. Unity in-game screenshots (left-eye only) of an RFT trial with (A) the starting position of 0° frame and −11° rod rotation along the z-axis; (B) the desired position at the end of each trial, i.e. 0° rod rotation along the z-axis. Created with Unity Editor®. Unity is a trademark or registered trademark of Unity Technologies.
The RFT consisted of 36 randomized trials and two test trials to ensure that the handling of the trackpad and trigger was understood by the participant. The frame was tilted along the rotational z-axis of the Unity coordinate system either −33° or 0° or 33°, likewise the rotation of the rod was either −22° or −11° or 11° or 22°. This resulted in 12 different constellations which were tested three times to ensure reliable results (Fiori et al., 2014). After the last trial, the rod did not respond to any trackpad presses. The VR exposure lasted approximately 20 min (including instructions). Though the clicking through the application was self-paced, hence, the task’s duration varied between participants from 3.8 to 39.4 min (M = 15.9; SD = 7.7).
2.4.2 Environment 2: the optokinetic drum
The participants were instructed to look straight ahead while sitting on a chair with no armrests to prevent the risk of falling during the VR exposure. In contrast to the other two environments, the participants were passive observers with no control over the virtual objects. The study applied eye tracking in VR which required calibration of the eye tracker before exposure to the rotating optokinetic drum. The displayed optokinetic drum was a custom-made cylinder with black and white stripes along the sagittal axes (Giannopulu, 2018, see Figure 2). During the VR exposure, the Drum rotated with 1° per frame in the sagittal axis leading to a constant movement by a refreshment rate of 90 Hz. The experimenter monitored the current state of wellbeing via the MISC every 2 min. As this environment had been rated in pilot studies as exhausting and cybersickness-inducing, the exposure to the Drum was limited to 7 min.
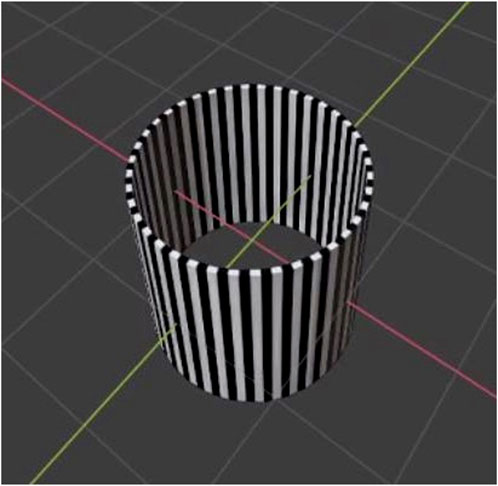
FIGURE 2. Blender screenshot of the optokinetic Drum tube prefab with the black and white custom material (see Giannopulu, 2018).
2.4.3 Environment 3: the city
In this virtual environment, the participants were instructed to freely explore a City. Prefabs from the Winridge City asset were used for a visually complex and naturalistic scene allowing room-scale VR. Compared to the other two the city was the most stimulating and interactive environment. The cover story for this application — which was designed to be cybersickness-inducing—was that visuospatial orientation would be tested by navigating through a virtual city, and operationalized by collecting virtual checkpoints that were distributed across the city. These checkpoints were represented as green rings with a green glowing semi-circle in the center (see Figure 3). After the participant virtually walked through a checkpoint, it disappeared and was logged in the meta-data file. The custom-built locomotion system was similar to the “magic carpet” locomotion, which gives the impression of hovering through a continuous locomotion (Paris et al., 2019). For longitudinal acceleration, the participant used the trackpad. They could indicate the direction by pressing either on the top of the trackpad to move forward or on the bottom of the trackpad to move backward. The direction of the virtual walking was based on the head rotation, which meant that they walked in the direction, they were looking at. Every 2 min, the participant’s current wellbeing was monitored with the MISC. After 10 min the experimenter terminated the free exploration of the city and changed the VR environment to a dark room for measuring potential aftereffects on postural stability without any visual anchors.
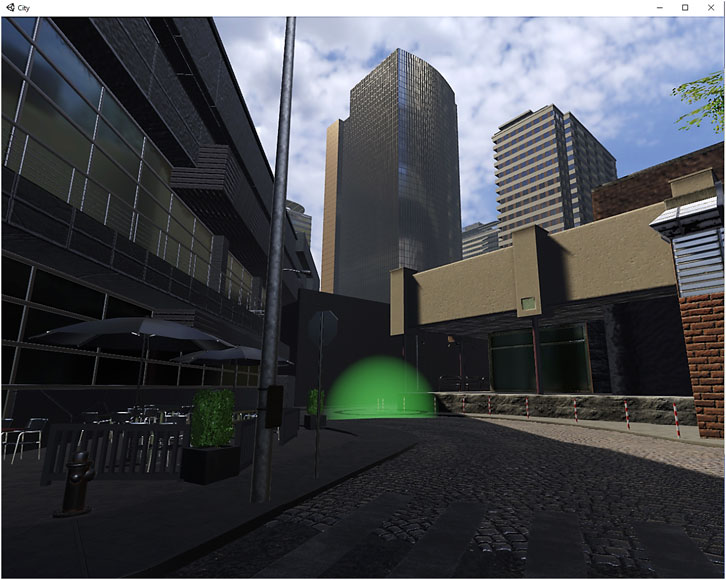
FIGURE 3. Unity in-game screenshot (left-eye only) of the City with a virtual checkpoint in front. Created with Unity Editor®. Unity is a trademark or registered trademark of Unity Technologies.
3 Results
3.1 Data preprocessing
Before calculating any statistics, some data preprocessing was done. The VRSQ scales were anchored at 0 (=none). Moreover, only complete cases were included in the analysis. Unfortunately, imputation was not applicable because the dropout was not missing at random, but was bound to previous ratings. The Δ-VRSQ was calculated for each VRSQ item by subtracting the participants’ Baseline VRSQ ratings from the Post-VR ratings.
3.2 Descriptive statistics
For a detailed descriptive Baseline and Post-VR comparison − which is beyond the scope of this paper–the reader is referred to Supplementary Figure S1. To gain some insight into possible differences in the underlying factorial structure depending on the VR environment, the nine Δ-VRSQ items were plotted on a radar chart (see Figure 4). For the exact numerical values for mean and standard deviation, the reader is referred to Table 2. For the environment RFT all nine Δ-VRSQ items display an evenly distributed “ring”. In contrast to the RFT, the Drum and City environments do differ in their pattern. The most extreme values are found in the Drum environment, but the large standard deviation, large right skewness, and kurtosis make it difficult to draw generalizable conclusions. In the Drum, the Δ-VRSQ ratings for items belonging to Oculomotor symptoms were particularly high. In contrast for the City the item Δ-Fatigue was relatively low, which might give a hint to the low discriminant validity (from task-related aspects) of this item.
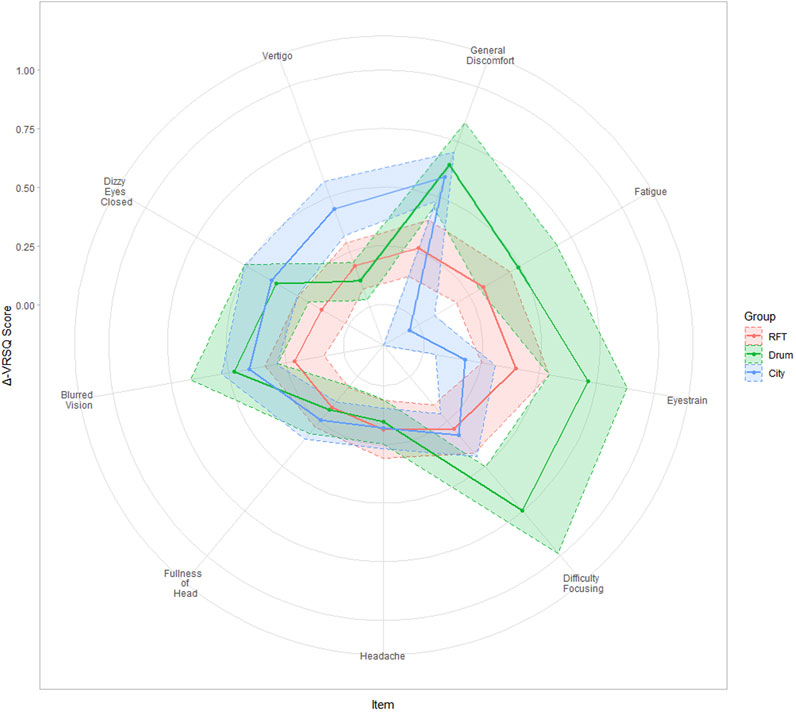
FIGURE 4. The Δ-VRSQ Scores for each item compared between the VR environments. The points represent the mean, the ribbons the upper and lower 95% confidence interval.
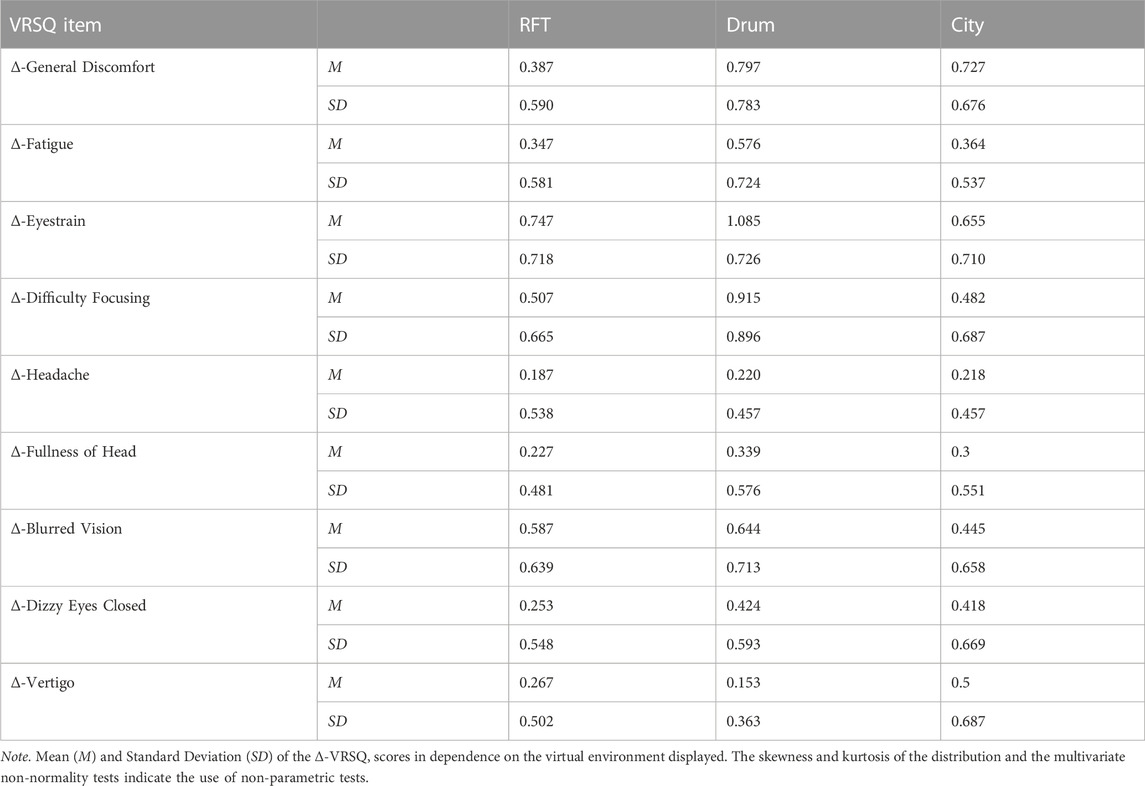
TABLE 2. Descriptive Statistics of the VRSQ items by environment.
3.3 Inference statistics
Although the use of the Δ-VRSQ items follows the recommendation of Young et al. (2007) to control for demand characteristics, I will start with testing the assumption that the VR environments had a significant impact on the self-reports of cybersickness. Therefore, a repeated measures analysis was calculated. A significant main effect of measurement time (Baseline vs. Post-VR comparison) is as a necessary and sufficient condition for performing the factorial analysis with the Δ-VRSQ.
Given the skewness and kurtosis of the data, a Mardia’s test was applied to check for multivariate normality (Mardia, 1970). The test statistic of Mardia skewness: 1187.09 (p < .001) and Mardia kurtosis: 24.96 (p < .001) indicated that multivariate normality could not be confirmed. An univariate Anderson-Darling-Test confirmed this result for all items separately (p < .001). To counteract biased estimators semi-parametric tests were applied for all inferential statistics.
First, a semi-parametric multivariate repeated measures analysis with the between-subject factor VR environment (3 levels) and 2 within-subject factors, firstly the VRSQ-Item (9 levels) and secondly the Baseline/Post-VR (2 levels), was performed. No significant main effect of the between-subjects factor VR environment was found (χ2 (2) = 4.284, p = .117). Nevertheless, both within-subject factors showed significant main effects for the VRSQ Item (χ2 (8) = 237.142, p < .001) and for the Baseline/Post-VR comparison (χ2 (1) = 232.195, p < .001). Moreover, the VR environment x VRSQ item interaction reached significance (χ2 (16) = 69.427, p < .001), as did the VR environment x Baseline/Post-VR interaction (χ2 (2) = 11.549, p = .003). Additionally, the three-way interaction VR environment x VRSQ item x Baseline/Post-VR comparison was significant (χ2 (16) = 103.963, p < .001). Furthermore, the within-subjects factors interaction VRSQ item x Baseline/Post-VR (χ2 (8) = 73.249, p < .001) was also significant. The p-values were confirmed by the results of the parametric bootstrap approach with 1000 iterations used to calculate the resampled statistic.
For the following analyses, the Δ-VRSQ scores were used. Once again Mardia’s test tested for multivariate normality. The test statistic of Mardia skewness: 1142.419 (p < .001) and Mardia kurtosis: 29.425 (p < .001) showed that multivariate normality could not be confirmed. An univariate Anderson-Darling-Test confirmed this result for all items separately (p < .001). Therefore, semi-parametric tests were used again. As before, a semi-parametric multivariate repeated measures analysis was calculated with the between-subject factor VR-environment (3 levels) and the within-subject factor Δ-VRSQ Item (9 levels). A significant main effect of the between-subjects factor VR environment was found (χ2 (2) = 11.549, p = .003). The within-subject main effect for the Δ-VRSQ item was also significant (χ2 (8) = 73.249, p < .001). Additionally, the VR-environment x Δ-VRSQ item interaction gained significance (χ2 (16) = 103.963, p < .001). All p-values were confirmed by the results of the parametric bootstrap approach with 1000 iterations used for calculating the resampled statistic. As post hoc tests the univariate comparison of each Δ-VRSQ item with the factor VR-environment was calculated. In order to adjust for multiple comparisons the Bonferroni-Holm method was used (Holm, 1979). Of these univariate comparisons, six Δ-VRSQ items showed significant differences in dependence on the VR environment (p ≤ .044). The remaining three Δ-VRSQ items all assigned to the factor of Disorientation were Headache, Fullness of Head, and Blurred Vision.
Pairwise Tukey’s-HSD contrasts were run for significant univariate comparisons. Δ-General Discomfort was significantly lower for the RFT compared to the other two (Drum p = .034, City p = .011). Moreover, the Δ-Fatigue score for the City item was significantly lower compared to the other VR environments (RFT p = .007, Drum p = .001). Additionally, a significant difference in Δ-Eyestrain between City and Drum was found (p < .001). Furthermore, in the Drum environment the Δ-Difficulty focusing score was higher than in both other environments (RFT p = .033, City p = .046). Finally, the Δ-Vertigo score in the City was significantly higher than in the other two (RFT p = .042, Drum p = .002).
3.4 Confirmatory factor analysis
For the Confirmatory Factor Analysis, the model proposed by Kim et al. (2018) was tested (see Table 1). It contains two latent factors Disorientation (eyestrain, difficulty focusing, general discomfort, fatigue) and Oculomotor (headache, fullness of head, blurred vision, dizzy eyes closed, vertigo). Instead of truncating the extreme values to use MLE the asymptotical distribution-free (ADF/DWLS) estimator was applied. To account for the different VR environments a categorical moderator variable was added to the model. The global χ2/df indicated a moderate fit as it was above the cut-off (χ2/78 = 0.956, p = .590, n.s.). In addition, both goodness of fit indices did suggest good fit (CFI = 1.000; TLI = 1.025). The same was true for the badness of fit indices (RMSEA: 0.000 90%CI [0.000, 0.057], p = .0910; SRMR = .098). The results are provided in more detail in the path model in Figure 5. In order to compare the values of the latent means across the three VR environments measurement invariance was tested. Thus, configural invariance, weak invariance, and strong invariance models were fitted and compared. The difference tests were significant (configural vs. weak χ2 (14) = 26.782, p = .021, weak vs. strong χ2 (14) = 65.339, p < .001).
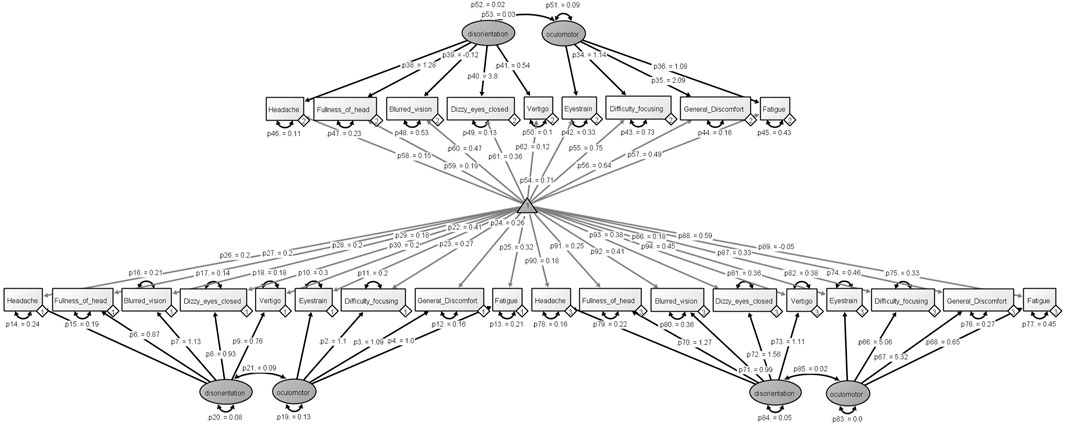
FIGURE 5. The path model of the moderated confirmatory factor analysis with the estimated p-values for each component and factor are included.
Considering the moderating effect of the VR environments the Confirmatory Factor Analysis revealed a moderate fit for the RFT (χ2/26 = 0.376, p = .998, n.s.). The goodness of fit indicators (CFI = 1.000; TLI = 1.359) and the badness of fit indicators (RMSEA: 0.000 90%CI [0.000, 0.000], p = .1; SRMR = .096) indicated the model had a suitable fit. However, the fit for the Drum environment was poor (χ2/26 = 1.313, p = .132, n.s.; CFI = 0.847; TLI = 0.788; RMSEA: 0.073 90%CI [0.000, 0.135], p = .275; SRMR = .107). Moreover, an implausible correlation greater than 1 (r = 1.498) between the latent factors Oculomotor and Disorientation was found for the City environment. Therefore to conclude, although the fit measures indicated a moderate fit for the global model, the latent variable model was misspecified.
4 Discussion
This study aimed to compare and confirm the factorial structure of the VRSQ in VR environments differing in visual complexity with different setups (seated, standing, and room-scale VR) and interaction opportunities (none, only with two virtual objects, self-paced locomotion). The results indicate a moderator effect for the variable VR environment that does not confirm the postulated factorial structure. For two VR environments, the factorial structure postulated by the original study did not fit decently or indicated a misspecified model. The third environment, RFT, was most similar to the VR environment of the original study in terms of interaction — a simple choice task with different button sizes—and converged in the Confirmatory Factor Analysis.
More specifically, the most naturalistic VR environment produced a Heywood case (Cooperman and Waller, 2022), probably because the task was more challenging and exciting compared to the other two environments. This argument is supported by the fact that the Δ-Fatigue score was significantly lower compared to the other environments. Thus, the discriminate validity to task-specific characteristics might be low. Nevertheless, this argument is only speculative because no qualitative or quantitative assessment of the user experience in the VR environments has been used. On the other end of the continuum, the seated and passive Drum environment converges but does not meet the goodness and badness of fit criteria. It could be argued that the Drum is a very passive simulation resembling IMAX theatres or 3D movies, which seem to have slightly different characteristics (Keshavarz et al., 2023). This is in line with the higher ratings in the Oculomotor symptoms dimension that is associated with simulator sickness (Stanney et al., 1997). This is also consistent with the findings of Cobb et al. (1999) who argue to distinguish between VR-induced and other forms of motion sickness. However, as long as VR-specific differences are ignored by using generic motion sickness questionnaires to assess cybersickness (Gavgani et al., 2017), potential differences in symptom profiles cannot be investigated (Tian et al., 2022).
In contrast to the original VRSQ study, a baseline measure was added to control for factors that are not directly related to the VR environment. While the baseline measure may have influenced the Post-VR ratings due to demand characteristics (Young et al., 2007), it ensures that no VR-unrelated situational characteristics are measured. As suggested by the significant interaction effect of the VR environment and the Baseline/Post VR comparison as well as indicated by the measurement invariance, different concepts are likely to be measured (Schmitt and Kuljanin, 2008). Because the VR environment was a between-subjects factor, which was temporally sequential and not randomized, and the sample size was relatively small, compared to other structural equation models, a confounding temporal or individual variation that accounts for the interaction effect cannot be ruled out. Nevertheless, a larger sample with a fully randomized within-subjects design may be difficult to achieve and may lead to confounded cybersickness ratings due to additional expectancy effects.
A strong criticism of the original study was the extremely small sample size (N = 24), especially for structural equation modeling. In addition, parametric statistics were used without testing for multivariate normality. As it is known for cybersickness data multivariate normality should not be assumed (Rebenitsch and Owen, 2021), especially in the absence of screening to include only susceptible participants, resulting in a floor effect. Furthermore, demand characteristics were likely induced by fully informing the participants of the purpose of the experiment: “[…] is to measure motion sickness” (Kim et al., 2018), which suggests an additional Baseline rating. Therefore, it might not seem that surprising that the Confirmatory Factor Analysis did not find a reasonable model fit or configural invariance.
Nevertheless, the current paper also has some limitations. First, because the cybersickness ratings increase with prolonged time spent in VR (Martirosov et al., 2022), future studies should monitor the cybersickness with a fixed query interval, rather than using different VR exposure times based on pretests. Moreover, the self-paced RFT task may have additionally measured thoroughness, which prolonged the VR exposure. Because the multi-item cybersickness questionnaires are intrusive and lengthy it was decided to administer them before and after the exposure in a dark environment in each experimental task. Thus, possible time-dependent differences cannot be ruled out.
The comparability between the three environments is further limited by the different sample sizes (N = 59 vs. 110). With a larger sample size, the means gets closer to the “true” (population) mean and therefore the error decreases. This mathematical relationship between sample size and standard error is evidenced by the descriptive statistics in the current sample comparing the Drum and the City (see Table 1; Figure 4) and has applications for the inference. Furthermore, the termination condition led to the exclusion of 20 participants who reported severe symptoms during the VR exposure. Although this procedure was necessary for ethical reasons, it could bias the result regarding the representativeness of symptom profiles for the population.
Future studies could take a closer look at the characteristics of VR environments applying the VRSQ/SSQ to confirm the results of this study with a larger sample size. While two of the VR environments only used simple black-and-white elements and restrictions in posture, the City environment tried to achieve a visually naturalistic environment with room-scale VR, which is not common for laboratory studies that strive for controllability. Two additional approaches could be combined to solve the sample size problem while striving for naturalistic VR. First, consulting data journals for studies that applied these questionnaires in VR. These journals publish articles that rigorously describe research data (FAIR principles) without any interpretation, for example, the CODATA Data Science Journal (Ubiquity Press, 2023), Data in Brief (Science Direct, 2023), or Scientific Data (Springer Nature Limited, 2023). Second, data from field “studies” can be collected, e.g., VR gaming at home, or companies that use VR for training or illustration purposes. For the latter procedures, one needs to be mindful of potential infringements of privacy rights.
Similar to the original study the participants recruited were mostly young adults. As it has been discussed that cybersickness is age-dependent, it may be interesting to consider other groups. Like the environment-dependent factorial structure found in the current sample, age-dependent characteristics are often out of focus (Saredakis et al., 2020). From motion sickness research susceptibility is reported to be greatest between ages two and twelve and almost nonexistent over 50 (Reason and Brand, 1975); this factor was introduced to the field of simulator sickness (Kolasinski, 1995) and has been applied indiscriminately as a fact to cybersickness later on (Davis et al., 2014; Almeida et al., 2018), but scientific evidence is lacking. Even if there is no age-dependent effect when standing or room-scale VR is applied, especially for elderly people, the use of the Δ-VRSQ scores instead of the raw Post-VR scores is recommended. As the visually dependent postural stability may be an inherent participant characteristic (e.g., balance impairments that induce dizziness with eyes closed and vertigo) instead of a symptom induced by the VR environment.
It was decided not to present any post hoc Exploratory Factor Analysis for these data, as this would not be a hypothesis-driven practice. Moreover, Confirmatory Factor Analysis and Exploratory Factor Analysis do differ in their goals (Flora and Flake, 2017), hypothesis testing vs. data reduction. As the VRSQ seems to be too environment-specific and might miss some symptom facets, it might be advisable to look at other VR-centered revisions of the SSQ. Exploratory, I applied a Confirmatory Factor Analysis for the postulated structure of Bouchard’s et al. revision of the SSQ (2007) with the remaining items, which resulted in a convergent model, but is of course not representative as many items are missing. Following the suggestion of Sevinc and Berkman (2020), the Cybersickness Questionnaire (CSQ) could be an alternative to the original SSQ (Stone, 2017). This questionnaire was developed by sharing some of the introductory critiques on using the SSQ to assess cybersickness. Furthermore, the CSQ was developed with a sample of N = 194 and three differing VR environments. Hence, it is an alternative revision of the SSQ (see also Bouchard et al., 2007; Balk et al., 2017). It is noteworthy the author suggests using the SSQ a lieu until the CSQ is validated, but to calculate and report the total score of the CSQ as a compromise, which might influence the results by using a (unnecessary) lengthy questionnaire (Herzog and Bachman, 1981).
However, the alternatives mentioned do not additionally administer the questionnaire at Baseline as a standard operating procedure. Therefore, VR-unrelated influences are not ruled out. That is why Kim et al. (2004) state these questionnaires are only applicable to (young) healthy subjects. Following this makes cybersickness research that should at least implicitly aim at accessibility contradictory exclusive. Often the demand characteristics are tried to be avoided by relinquishing a Baseline questionnaire, but the informed consents for cybersickness studies are required to mention the study purpose for ethical disclosure (Kim et al., 2018, e.g;, Stone, 2017). Thus, it is argued that demand characteristics are induced either way. Additionally, the influence of individual response styles can be mitigated by using a Baseline. Even the authors of the prominent paper on demand characteristics do not argue against applying a Baseline rating as long as it is considered in the analysis (Young et al., 2007). Thus, the use of the aggregated raw Δ-SSQ scores may be the simplest and best solution so far, although the alternatives mentioned earlier also have their raison d'être if generalizability is achievable.
In reference to Boring (1961) cybersickness assessment can be defined as “the questionnaire measures it,” but should regard generalizability and discriminant validity. The hasty application of the SSQ or a revised version for VR would lead to a biased assessment of cybersickness when environment-specific and sample characteristics are overlooked. In conclusion, the VRSQ is not universally applicable to VR experiences, which complicates comparisons between subjects and setups. As the best ad hoc solution available, the SSQ is favored. Nevertheless, to address the above criticisms, until the factorial structure of the CSQ or SSQ-revised is confirmed with larger VR environment-independent samples, it is suggested using the Δ-SSQ in the aggregated raw format to ensure that each item contributing to cybersickness is weighted equally, while all potential VR-attributable symptoms are covered.
Data availability statement
The original contributions presented in the study are publicly available. This data can be found here: Experiment 1 the rod and frame test: http://dx.doi.org/10.25532/OPARA-243 Experiment 2 the optokinetic drum: http://dx.doi.org/10.25532/OPARA-245 Experiment 3 the city: http://dx.doi.org/10.25532/OPARA-244.
Ethics statement
The studies involving humans were approved by the local ethics committee of the Technical University Dresden. The studies were conducted in accordance with the local legislation and institutional requirements. The participants provided their written informed consent to participate in this study.
Author contributions
JJ: Conceptualization, Data curation, Formal Analysis, Methodology, Project administration, Supervision, Visualization, Writing–original draft, Writing–review and editing.
Funding
The author(s) declare financial support was received for the research, authorship, and/or publication of this article. The Article Processing Charges (APC) were funded by the joint publication funds of the TU Dresden, including Carl Gustav Carus Faculty of Medicine, and the SLUB Dresden as well as the Open Access Publication Funding of the DFG.
Acknowledgments
I want to acknowledge J. K. Kopp, A. Klingenfuss, I. M. Bundil, J. Schöppe, and K. Holzmeyer for carrying out either of the experiments.
Conflict of interest
The author declares that the research was conducted in the absence of any commercial or financial relationships that could be construed as a potential conflict of interest.
Publisher’s note
All claims expressed in this article are solely those of the authors and do not necessarily represent those of their affiliated organizations, or those of the publisher, the editors and the reviewers. Any product that may be evaluated in this article, or claim that may be made by its manufacturer, is not guaranteed or endorsed by the publisher.
Supplementary material
The Supplementary Material for this article can be found online at: https://www.frontiersin.org/articles/10.3389/frvir.2023.1291078/full#supplementary-material
Supplementary Figure 1 | Box-and-whiskers plot for each VRSQ item comparing Baseline vs. Post-VR grouped by the three VR environments. Jitter is added to account for the right-skewed VRSQ values.
Footnotes
1Publications that are referring to (physiological) data from studies 2 and/or 3 are Josupeit (2023) and Josupeit and Andrees (2023).
References
Almeida, A., Rebelo, F., Noriega, P., and Vilar, E. (2018). Virtual reality self induced cybersickness: an exploratory study. Cham: Springer International Publishing, 26–33.
Arns, L. L., and Cerney, M. M. (2005). “The relationship between age and incidence of cybersickness among immersive environment users,” in IEEE Proceedings. VR 2005. Virtual Reality, Bonn, Germany, 12-16 March 2005.
Balk, S., Bertola, M., and Inman, V. (2017). “Simulator sickness questionnaire: twenty years later,” in PROCEEDINGS of the Seventh International Driving Symposium on Human Factors in Driver Assessment, Training, and Vehicle Design, Manchester Village, Vermont, June 26-29, 2017.
Boring, E. G. (1961). “Intelligence as the tests test it,” in Studies in individual differences: the search for intelligence (East Norwalk, CT, US: Appleton-Century-Crofts).
Bos, J. E., Diels, C., and Souman, J. L. (2022). Beyond seasickness: a motivated call for a new motion sickness standard across motion environments. Vibration 5, 755–769. doi:10.3390/vibration5040044
Bos, J. E., Mackinnon, S. N., and Patterson, A. (2005). Motion sickness symptoms in a ship motion simulator: effects of inside, outside, and no view. Aviat. space, Environ. Med. 76, 1111–1118.
Bouchard, S., Robillard, G., and Renaud, P. (2007). Revising the factor structure of the simulator sickness questionnaire. Annu. Rev. cybertherapy telemedicine 5, 128–137.
Cobb, S. V. G., Nichols, S., Ramsey, A., and Wilson, J. R. (1999). Virtual reality-induced symptoms and effects (vrise). Presence Teleoperators Virtual Environ. 8, 169–186. doi:10.1162/105474699566152
Cooperman, A. W., and Waller, N. G. (2022). Heywood you go away! Examining causes, effects, and treatments for heywood cases in exploratory factor analysis. Psychol. Methods 27, 156–176. doi:10.1037/met0000384
Davis, S., Nesbitt, K., and Nalivaiko, E. (2014). “A systematic review of cybersickness,” in Proceedings of the 2014 Conference on Interactive Entertainment, Newcastle, NSW, Australia, December 2-3, 2014.
Fiori, F., David, N., and Aglioti, S. M. (2014). Processing of proprioceptive and vestibular body signals and self-transcendence in ashtanga yoga practitioners. Front. Hum. Neurosci. 8, 734–739. doi:10.3389/fnhum.2014.00734
Flora, D. B., and Flake, J. K. (2017). The purpose and practice of exploratory and confirmatory factor analysis in psychological research: decisions for scale development and validation. Can. J. Behav. Science/Revue Can. des Sci. du comportement 49, 78–88. doi:10.1037/cbs0000069
Friedrich, S., Konietschke, F., and Pauly, M. (2019). Resampling-based analysis of multivariate data and repeated measures designs with the r package manova.Rm. R J. 11, 380–400. doi:10.32614/rj-2019-051
Gavgani, A. M., Hodgson, D. M., and Nalivaiko, E. (2017). Effects of visual flow direction on signs and symptoms of cybersickness. PLOS ONE 12, e0182790. doi:10.1371/journal.pone.0182790
Giannopulu, I. (2018). “Externalised mind 2,” in Neuroscience, robotics and virtual reality: internalised vs externalised mind/brain (Cham: Springer International Publishing).
Herzog, A. R., and Bachman, J. G. (1981). Effects of questionnaire length on response quality. Public Opin. Q. 45, 549–559. doi:10.1086/268687
Holm, S. (1979). A simple sequentially rejective multiple test procedure. Scand. J. Statistics 6, 65–70.
Josupeit, J. (2023). “Does pinocchio get cybersickness? - the mitigating effect of a virtual nose on cybersickness,” in AHFE International Conference, Honolulu, Hawaii, 20 Jul 2023 – 24 Jul 2023. (in press).
Josupeit, J., and Andrees, F. (2023). “Inside the black box: modeling a cybersickness dose value through built-in sensors of head-mounted displays,” in Proceedings of 7th International Conference on Artificial Intelligence and Virtual Reality (AIVR 2023), Kumamoto, Japan, 21st to 23rd July 2023. (in press).
Kennedy, R. S., Lane, N. E., Berbaum, K. S., and Lilienthal, M. G. (1993). Simulator sickness questionnaire: an enhanced method for quantifying simulator sickness. Int. J. Aviat. Psychol. 3, 203–220. doi:10.1207/s15327108ijap0303_3
Keshavarz, B., Murovec, B., Mohanathas, N., and Golding, J. F. (2023). The visually induced motion sickness susceptibility questionnaire (vimssq): estimating individual susceptibility to motion sickness-like symptoms when using visual devices. Hum. factors 65, 107–124. doi:10.1177/00187208211008687
Kim, D., Parker, D., and Park, M. (2004). A new procedure for measuring simulator sickness–the rssq. Seattle, WA: Human Interface Technology Laboratory, University of Washington.
Kim, H. K., Park, J., Choi, Y., and Choe, M. (2018). Virtual reality sickness questionnaire (vrsq): motion sickness measurement index in a virtual reality environment. Appl. Ergon. 69, 66–73. doi:10.1016/j.apergo.2017.12.016
Kolasinski, E. M. (1995). Simulator sickness in virtual environments. Alexandria, Virginia: US Army Research Institute for the Behavioral and Social Sciences.
Kuiper, O. X., Bos, J. E., Schmidt, E. A., Diels, C., and Wolter, S. (2020). Knowing what’s coming: unpredictable motion causes more motion sickness. Hum. Factors 62, 1339–1348. doi:10.1177/0018720819876139
Laviola, J. J. (2000). A discussion of cybersickness in virtual environments. Sigchi Bull. ACM 32, 47–56. doi:10.1145/333329.333344
Liao, C.-Y., Tai, S.-K., Chen, R.-C., and Hendry, H. (2020). Using eeg and deep learning to predict motion sickness under wearing a virtual reality device. Ieee Access 8, 126784–126796. doi:10.1109/access.2020.3008165
Mardia, K. V. (1970). Measures of multivariate skewness and kurtosis with applications. Biometrika 57, 519–530. doi:10.1093/biomet/57.3.519
Martirosov, S., Bureš, M., and Zítka, T. (2022). Cyber sickness in low-immersive, semi-immersive, and fully immersive virtual reality. Virtual Real. 26, 15–32. doi:10.1007/s10055-021-00507-4
Ning, H., Li, Q., Wei, D., Liu, H., and Zhu, T. (2017). Cyberlogic paves the way from cyber philosophy to cyber science. IEEE Internet Things J. 4, 783–790. doi:10.1109/jiot.2017.2666798
Palmisano, S., and Constable, R. (2022). Reductions in sickness with repeated exposure to hmd-based virtual reality appear to be game-specific. Virtual Real. 26, 1373–1389. doi:10.1007/s10055-022-00634-6
Paris, R., Klag, J., Rajan, P., Buck, L., Mcnamara, T. P., and Bodenheimer, B. (2019). “How video game locomotion methods affect navigation in virtual environments,” in ACM Symposium on Applied Perception, Barcelona, Spain, September 2019, 1–7.
Petri, K., Feuerstein, K., Folster, S., Bariszlovich, F., and Witte, K. (2020). Effects of age, gender, familiarity with the content, and exposure time on cybersickness in immersive head-mounted display based virtual reality. Am. J. Biomed. Sci. 12, 107–121. doi:10.5099/aj200200107
R Core Team (2022). R: a language and environment for statistical computing. Vienna, Austria: R foundation for statistical computing. [Online].
Rebenitsch, L., and Owen, C. (2016). Review on cybersickness in applications and visual displays. Virtual Real. 20, 101–125. doi:10.1007/s10055-016-0285-9
Rebenitsch, L., and Owen, C. (2021). Estimating cybersickness from virtual reality applications. Virtual Real. 25, 165–174. doi:10.1007/s10055-020-00446-6
Rosseel, Y. (2012). Lavaan: an r package for structural equation modeling. J. Stat. Softw. 48 (2), 1–36. doi:10.18637/jss.v048.i02
Saredakis, D., Szpak, A., Birckhead, B., Keage, H. a. D., Rizzo, A., and Loetscher, T. (2020). Factors associated with virtual reality sickness in head-mounted displays: a systematic review and meta-analysis. Front. Hum. Neurosci. 14, 96–17. doi:10.3389/fnhum.2020.00096
Schmitt, N., and Kuljanin, G. (2008). Measurement invariance: review of practice and implications. Hum. Resour. Manag. Rev. 18, 210–222. doi:10.1016/j.hrmr.2008.03.003
Science Direct (2023). Data in brief [online]. Available: https://www.sciencedirect.com/journal/data-in-brief (Accessed October 23, 2023).
Sevinc, V., and Berkman, M. I. (2020). Psychometric evaluation of simulator sickness questionnaire and its variants as a measure of cybersickness in consumer virtual environments. Appl. Ergon. 82, 102958. doi:10.1016/j.apergo.2019.102958
Springer Nature Limited (2023). Scientific data [online]. Available: https://www.nature.com/sdata/ (Accessed October 23, 2023).
Stanney, K. M., Kennedy, R. S., and Drexler, J. M. (1997). Cybersickness is not simulator sickness. Proc. Hum. Factors Ergonomics Soc. Annu. Meet. 41, 1138–1142. doi:10.1177/107118139704100292
Stone, W. B. (2017). Psychometric evaluation of the simulator sickness questionnaire as a measure of cybersickness. Ames, Iowa: Dissertation, Iowa State University.
Tian, N., Lopes, P., and Boulic, R. (2022). A review of cybersickness in head-mounted displays: raising attention to individual susceptibility. Virtual Real. 26, 1409–1441. doi:10.1007/s10055-022-00638-2
Ubiquity Press (2023). Codata data science journal. Available: https://codata.org/publications/data-science-journal/ (Accessed October 23, 2023).
Von Oertzen, T., Brandmaier, A. M., and Tsang, S. (2015). Structural equation modeling with ωnyx. Struct. Equ. Model. A Multidiscip. J. 22, 148–161. doi:10.1080/10705511.2014.935842
Keywords: simulator sickness questionnaire, virtual reality sickness questionnaire, cybersickness, confirmatory factor analysis, structural equation modelling, moderator effect
Citation: Josupeit J (2023) Cybersickness as the virtual reality sickness questionnaire (VRSQ) measures it!? –an environment-specific revision of the VRSQ. Front. Virtual Real. 4:1291078. doi: 10.3389/frvir.2023.1291078
Received: 08 September 2023; Accepted: 22 November 2023;
Published: 06 December 2023.
Edited by:
Akrivi Katifori, Athena Research Center, GreeceReviewed by:
Justin Maximilian Mittelstädt, Institute of Aerospace Medicine, GermanyMichael Vallance, Future University Hakodate, Japan
Copyright © 2023 Josupeit. This is an open-access article distributed under the terms of the Creative Commons Attribution License (CC BY). The use, distribution or reproduction in other forums is permitted, provided the original author(s) and the copyright owner(s) are credited and that the original publication in this journal is cited, in accordance with accepted academic practice. No use, distribution or reproduction is permitted which does not comply with these terms.
*Correspondence: Judith Josupeit, anVkaXRoLmpvc3VwZWl0QHR1LWRyZXNkZW4uZGU=