 Lee Lisle
 Kylie Davidson
 Edward J. K. Gitre2
 Doug A. Bowman
- 1Center for Human-Computer Interaction, Department of Computer Science, Virginia Tech, Blacksburg, VA, United States
- 2Center for Human-Computer Interaction, Department of History, Virginia Tech, Blacksburg, VA, United States
- 3Sanghani Center, Department of Computer Science, Virginia Tech, Blacksburg, VA, United States
Analysts perform sensemaking on large complex multimedia datasets in order to extract concepts, themes, and other kinds of insights from them. Immersive analytics, in particular, puts users in virtual environments that allow them to explore data in a unique way where they can interact and move through the data. Previous research using virtual reality immersive analytics tools found users wanting to refer to real-world objects or understand the physical world around them while continuing to perform their analysis. Therefore, we designed and ran a comparative study looking at the tradeoffs between virtual and augmented reality for our immersive analytics approach: Immersive Space to Think. Through two mixed-methods studies we found that virtual reality affords users a space where users can focus more on their task, but augmented reality allows them to use various real-world tools that can increase user satisfaction. In future immersive analytics tools, we recommend a blend of the two—augmented virtuality—with pass-through portals which allow users to see various real-world tools, such as whiteboards or desks and keyboards, while still giving themselves a space to focus.
1 Introduction
Recently, immersive analytics has been used to create effective tools to help analysts perform the sensemaking process with non-abstracted non-quantitative data sources Olaosebikan et al. (2022); Luo et al. (2022). However, in previous work, like Immersive Space to Think (IST), participants commented that traditional tools or methods were not supported in the digital realm, such as whiteboards to create impromptu charts or other physical tools Lisle et al. (2020, 2021). While these could be recreated in the virtual environment, they would likely have a lower-quality user experience compared to their real-world counterparts. Furthermore, in virtual reality (VR) sensemaking tools participants stated that hearing other people move around in the same physical office space but being unable to see them reduced comfort levels. While there are ways of mitigating this through visualization techniques, reduces immersion in the VR content Kudo et al. (2021). This experiential data suggests that augmented reality (AR) would be a better fit for this type of immersive analytics application or approach, as it affords a view of the real world and use of real-world objects and tools while still providing the same interaction methods with virtual data artifacts.
As Milgram and Kishino stated in their Reality-Virtuality continuum, designers can vary the level of mixed reality of an application by changing the ratio of real to virtual imagery Milgram et al. (1995). Designers could choose a purely virtual environment, include more real-world elements to make it an augmented virtuality experience, or sprinkle in virtual objects to the real world to create a more traditional AR experience. The designer must then consider what tradeoffs each style gives their application. For example, in VR users are secluded from the real world; they can only attain visual information the designer wants them to know. This could help them focus and not be distracted by objects in the real world. However, this removes some benefits of the traditional AR affordances, such as the ability to use non-digital objects like a pen and paper or understand physical obstacles around them. Another question that arises when considering immersive analytics research is where on the contiuum would best support understanding large complex datasets Skarbez et al. (2019). To improve IST and other sensemaking approaches, we should directly compare and explore how AR and VR affect the sensemaking process with non-quantitative datasets.
To look into this, we re-implemented IST in AR and an augmented virtuality form to gauge the impact on the user experience and performance. While AR allows users to freely interact with all real-world objects, it can create a more visually cluttered workspace that can distract users from their given tasks. Augmented virtuality can give users a space that is cleaner and can keep their focus on the task, but each physical tool (such as pen and paper, whiteboards and other furniture, or input devices) that users may want to interact with has to be registered by the system in some way. In AR, those tools could simply be used without having to be integrated into the system. As IST affords users the ability to move data artifacts around in virtual space, we designed and performed a preliminary and a main study with historical analysis tasks and a text-based dataset to evaluate how each adjusted approach can leverage the real world while still providing a place for users to connect with and focus on their work.
We found various user experience challenges in both studies. For the preliminary study (N = 21), we found users vastly preferring the AR implementation (20 of 21 participants), but every user found issue with the text-input methods in the VR experience. After adjustments, where we added more augmented virtuality in the form of a “Desk Portal” that allowed participants to see a real-world tracked desk with accompanying keyboard for text-entry, user perception nearly flipped in the second study (N = 16) to prefer the VR implementation (9 of 16 participants). However, in contrast, users felt physically safer in the AR implementation. They also found AR more attractive and dependable than the VR implementation as well, despite the increased focus.
Our data would suggest, then, that the IST approach as well as other immersive analytics applications would benefit from a middle-ground augmented virtuality approach with more elements of the real-world augmenting the virtual reality that assists with focus. That way, users can specify which tools they want to track and/or use while performing sensemaking tasks, occasionally referencing the real world when needed, and remain focused on their dataset and goals.
2 Related work
2.1 Sensemaking
Sensemaking is a difficult and cognitively intensive task where people “structure the unknown” through the organization of data in ways that enable them to better extrapolate from those sources Ancona (2012). Through the creation of these frameworks of thought, analysts form a more complex understanding of the relationships between data points Weick et al. (2005). Analysts utilize each piece of evidence to strengthen their understanding and weave them together to create a story that explains the overall dataset.
Pirolli and Card (2005) generated a model to understand the sensemaking process that defines how people continually loop through the stages and form meaning. Their model involves two main loops: the foraging loop, where analysts gather relevant data sources and meaning, and the sensemaking loop, where the analyst understands how the data sources fit together collectively to tell a story.
Data sources are often inaccurate or incomplete representations of the world, and the analyst has to fill in the gaps of knowledge with strategies such as storytelling Elm et al. (2005). When the analyst comes across contradictions that challenge their understanding, they have to reframe their knowledge and include the new evidence to form a more complex understanding of the situation Klein et al. (2006). Lisle et al. (2021) has shown that users in performing sensemaking tasks form data artifact clusters in multiple ways with assigned meaning. Davidson et al. (2022) continued that work, showing that users adapt their strategies over multiple sessions that conform to Pirolli and Card’s stages of the sensemaking process Pirolli and Card (2005). Both of these studies show that the IST approach affords the ability to process data artifacts and extract meaning from them as a group.
Like IST, many tools and approaches have been created to assist analysts with the sensemaking process. Endert et al. (2017) made the observation that most sensemaking approaches and implementations focus on either the foraging loop or the sensemaking loop. For example, Andrews et al. found that large high-resolution monitors could be used to sort data artifacts in a 2D desktop environment which assists with the sensemaking loop Andrews et al. (2010). With the introduction of 3D immersive environments, analysts can use the abundance of space to not only form clusters of meaning in the sensemaking loop, but also display large complex datasets that the analyst would have to search through for the foraging loop. In particular, we intend IST to support almost the entire sensemaking process, from stage 2’s search and filter to the presentation stage.
2.2 Immersive analytics
Immersive analytics is an extension and combination of data visualizations, visual analytics, mixed reality, and human-computer interaction where users perform sensemaking in immersive space with abstract data visualizations Marriott et al. (2018); Chandler et al. (2015); Skarbez et al. (2019). For example, Gold et al. (2021) combined Martian rover and satellite data to visualize terrain geometry with the accompanying mineral composition. They found that users had a clearer understanding of the layout of geological data with their visualization. In another work, Gold et al. (2021) designed ImAxes, which were embodied interactions for embedded multivariate data axes Cordeil et al. (2017). Batch et al. followed this work up by performing user studies with domain experts Batch et al. (2019). In two studies they found that participants generally laid out graphs egocentrically in “gallery” or semicircular arrangements, and the majority reported a high level of engagement with their datasets. Satriadi et al. looked at how users leverage 3D immersive space and multiview map layouts to perform geospatial tasks Satriadi et al. (2020). Similar to findings from other immersive analytics studies, they found that users prefer to make spherical layouts with the maps, but further rearrange them to better understand the data presented.
Many studies looked at how groups of users will work together in order to perform analysis tasks. Lee et al. explored collaborative immersive analytics with their FIESTA system and evaluated it through having participants collaboratively solve analysis tasks with a multivariate dataset Lee et al. (2020). They found that different types of visualizations resulted in different organization patterns to facilitate communication and understanding. In another study, Yang et al. (2022) sought to understand how collaborative sensemaking differed between collaborative immersive analytics environments and collaborative desktop environments. They found that participants spent significantly more time interacting with data artifacts and conversing about them than in the desktop conditions. For this IST study, however, we focus on single-user use cases.
While much of the previous immersive analytics work focuses on how to view and manipulate quantitative datasets, more recent research has also explored using immersive space to explore and organize non-quantitative data such as multimedia documents Skarbez et al. (2019). Initially with IST, Lisle et al. explored how novice users utilize 3D space in order to extract meaning from large complex datasets Lisle et al. (2021). In other work, Lee et al. (2021) created a system called “Post-Post-it,” which is an ideation space where users create Post-It notes using a stylus and smartphone. While similar to IST, their design is centered on ideation whereas IST is focused on understanding existing documents and synthesizing findings. Kobayashi et al. (2021) explored using HMDs and virtual workspaces for users to perform tasks with multimedia documents to replace large high-resolution display and physical workspaces. They found that participants tended to create spherical workspaces and that their implementation could provide a similar or superior experience to traditional workspaces. Similarly, Luo et al. (2022) explored AR sensemaking implementations where they varied collaboration and office furnishings and backgrounds to see the effect on user placement and understanding of non-quantitative multimedia datasets while performing a card-sorting task. Similar to Lisle et al.’s findings in VR with IST, they found that users leveraged environmental landmarks, such as tables or blank walls, to provide a scaffolding to organize their artifacts and create additional meaning.
User experience design approaches are being explored to create better immersive analytics systems, with a particular focus on AR. Galati et al. (2021) studied how the layout of an interface and the challenge level of a task affected users’ sensemaking process in AR and propose ways to design future immersive analytics systems. Luboschik et al. (2016) argue in their work that AR implementations of immersive analytics applications should leverage real-world spatial references to assist with spatial perception of the virtual objects. They further present common techniques used to convey spatial representation and problems with those techniques that need to be adapted for immersive analytics. Furthermore, Skarbez et al. (2019) argue that the research agenda for immersive analytics should include an exploration of what style of mixed reality is best suited for immersive analytics. We plan on addressing this point through our studies and better understanding tradeoffs of the two styles.
2.3 Comparing levels of mixed reality
Our study aims to compare how changing the style of mixed reality affects user strategies in immersive analytics. Steffen et al. (2019) compare the affordances between AR, VR and the physical reality in order to provide guidelines for user experience design when designing for AR or VR. For example, while both AR and VR afford the ability to enhance the physical world, AR retains the affordance of understanding the physical context of the user. However, another affordance that VR has is to approximate AR, and some studies use VR to approximate AR HMDs and evaluate interaction methods for proposed tools Lee et al. (2010); Lages et al. (2019); Lee et al. (2013).
Cross-virtuality analytics is one concept that looks at how to collaborate between users in different modalitys of the reality-virtuality continuum or transition between the various levels of mixed reality Riegler et al. (2020); Fröhler et al. (2022). One transition type is the concept of a portal that allows the user to see their surroundings and increase their bodily awareness George et al. (2020); Bruder et al. (2009). Our Desk Portal concept achieves similar goals but additionally aims to assist with the use of tools, both digital and analog, to boost the sensemaking process.
Other studies more directly evaluate the effect of mixed reality style on performance metrics. Ping et al. (2019) designed a depth perception task for both VR and AR and compared users’ performance in the two modalities. They found that users performed depth estimations better in AR. Suso-Ribera et al. compared different therapy techniques for people with phobias of small animals, including an AR implementation, a VR implementation, and using in-person small animals to help people combat their fear Suso-Ribera et al. (2019). They found that all three implementations proved to be similarly effective, but their qualitative comparisons between the AR and VR implementations only discussed cost issues. In another comparison, Park and Kim looked at motivations while varying AR and VR for users who were shopping for clothes Park and Kim (2021). They found that motivations impacted the effectiveness of the style of mixed reality, with users who were only browsing for clothes more likely to buy with the VR deployment, but people actively searching for clothes preferring the AR. Voit et al. (2019) performed an empirical evaluation study of smart artifacts using five different methods including in-situ, lab studies, AR simulation, virtual reality simulation, and online surveys. While AR scored lower on several usability scales than VR in their findings, it should be noted that they were comparing deployments to a Microsoft HoloLens and an HTC Vive, which have several confounding factors in the comparison such as the tether, weight, field of view, and other variables. Our studies attempt to remove as many confounds as we can, to better evaluate the two styles of mixed reality as fairly as possible. Similarly, our study attempts to recreate the same interactions with the same devices such that we are limiting the differences to the ability to see the real world. Furthermore, to the best of our knowledge our study is the first to look at the differences between the modalities and the effect on performance for sensemaking tasks.
3 The immersive space to think approach
IST allows users to interact with large complex multimedia datasets by moving data artifacts around the environment, forming clusters of meaning, and annotating the artifacts to externalize their thought process. Previous work on IST has shown that user experience has been improved by increasing display fidelity and using tether-free head-worn displays (HWD) Lisle et al. (2020), Lisle et al. (2021). However, to reduce confounding variables in our comparative studies, we used hardware that could perform both VR and video-pass-through AR on a single HWD. We elaborate on this in Section 4.2.
3.1 Interaction methods
We started with the implementation of IST designed and defined by Lisle et al., but we adjusted the implementation based on the results of their studies and advice from historical analysis experts Lisle et al. (2020), Lisle et al. (2021). The following interaction methods were implemented as part of the IST approach.
3.1.1 Movement of artifacts
Participants could grab documents by ray-casting to a document and pressing the trigger button on the controller. Earlier studies indicated that participants wanted greater control over the pitch, yaw, and roll of data artifacts. Therefore, we changed the 3DUI manipulation from a ray-casting with reeling technique to the HOMER technique as described by Bowman and Hodges Bowman and Hodges (1997). This gave users control over the speed that documents moved egocentrically as well as greater flexibility for artifact rotation.
3.1.2 Text scrolling
Some text documents are larger than the standard artifact size, so we implemented a scrolling technique to view additional text. To scroll a document, the user points the controller at the document and drags their finger on the controller’s trackpad to scroll up or down, which is similar to text scrolling on a smartphone.
3.1.3 Text highlighting
An important part of analyzing non-quantitative datasets is the ability to identify key themes or concepts. For text documents, this can be performed through text highlights. Users can point a document and press an “action” button (in our case with the VALVE Index Controller, this is the “A” button). The word or words that intersect with the controller’s ray are then selected. The user can then hold down the menu button to select entire phrases or sentences. Once satisfied with their selection, the user can then press a software button on the UI panel to the left of a document as seen in Figure 1. This button makes the selection permanently highlighted in yellow.

FIGURE 1. An IST data artifact created from a text file. The interface buttons on the left allows the user to highlight, copy text, copy text with a citation, and add a note to the artifact.
3.1.4 Text entry
We implemented user-controlled text entry through putting a keyboard on a tracked, wheeled desk. The representation of this desk underwent several revisions, as seen in Figure 2. For the pilot study, the stand was represented by a desk with a model of a keyboard on top of it in the same position and rotation as the physical keyboard. This was revised for the main study, and we implemented a “Desk Portal” for the VR condition that affords the ability to put down and pick up 3DUI controllers and type on the keyboard quickly. The portal further affords the ability to reference real-world data artifacts and tools that can be seen on the desk. This is similar to the “Pass-Through” condition as described by Giovannelli et al. (2022) that found that users could quickly find the keyboard’s home row and type.
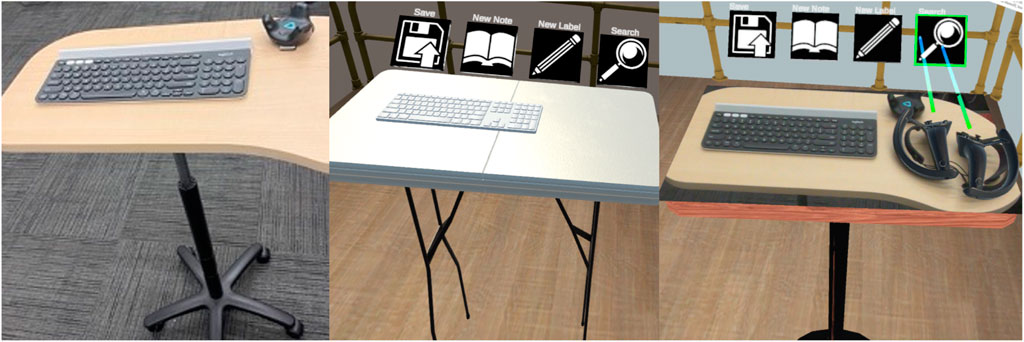
FIGURE 2. The keyboard that participants used to enter test in IST was on a tracked wheeled desk, as seen in the image on the left. In the pilot study’s VR condition, this was represented by a deskwith a white keyboard in the same position as the physical keyboard, as seen in the center image. Feedback from pilots evolved our design, leading to a pass-through “Desk Portal” design as seen in the image on the right.
3.1.5 Notes and labels
Lisle et al. (2021) used Wizard-of-Oz implementations for all three of these interactions, where the experimenter would handle the creation and text entry. Now that the keyboard input is enabled, notes can be edited using a virtual button on the UI panel next to them with an edit field appearing above the keyboard. Furthermore, free-form note (notes not attached to artifacts) creation and label creation are performed by the user via virtual buttons attached to the keyboard. Upon activation of any of these virtual buttons, the edit field opens and takes input. When the user presses the text confirmation key, the text is applied to the note or label.
3.1.6 Search
Similar to note and label creation, a keyword search is available through a virtual button above the tracked desk. Once pressed, the edit field appears, allowing the user to type in a key word or phrase. This highlights the given string in all documents. Furthermore, the title bar of documents that have the given text is given a red background to indicate they contain the given string. This is to give visual confirmation and ease of understanding to the user to recognize where the string they are searching for is contained.
4 Experimental design
4.1 Research questions and goals
4.1.1 RQ1: Between AR and VR, which level of mixed reality sensemaking offers a higher quality user experience?
Previous studies’ qualitative feedback suggested that affording users the ability to see the real world would increase user experience and satisfaction Lisle et al. (2021), but this effect has not yet been verified empirically. We hypothesize that seeing the real world will increase user satisfaction, but also distract the user from performing their tasks. We further hypothesize that users will prefer the AR implementation over the VR for sensemaking tasks, as they will feel physically safer and can use various tools that could assist them in their analysis.
4.1.2 RQ2: How do the different styles of mixed reality affect user strategies?
As Lisle et al. found in previous studies Lisle et al. (2020), Lisle et al. (2021), VR users created different structures using various methods of annotation with some being anchored on landmarks seen in the environment and others in semicircular or planar patterns. Luo et al. (2022) further found strategies employed in AR for similar tasks. However, we want to directly compare these for the same task. For example, do users leverage real-world landmarks for the placement of documents, or perhaps do they continue to use semicircular patterns in free space? Will users branch out and use everything they can see at their disposal to understand the datasets? This will impact how the approach can integrate the environment into assisting the user. We hypothesize that users will use tools in the AR implementation, as well as use more varied landmarks to sort their data in AR.
4.1.3 RQ3: Between AR and VR, which level of mixed reality affords higher performance?
We want to understand how varying the style of MR affects how well participants can perform sensemaking analysis tasks. Since users can see and interact with physical real-world tools, they have more ability to use methods that are familiar to them, which may increase performance. However, we understand that there are many confounding factors that can affect performance, such as a lack of sleep or even hunger levels and due to these factors technology choice may have little impact on performance or have low effect sizes Schwandt (2005); Andrews and North (2013); Zhang et al. (2019). Therefore, we will take the null hypothesis that we will not find any significance in overall performance.
4.2 Apparatus and experimental setting
While IST has undergone several iterations, the current design has evolved further in order to include an AR version. In order to accommodate this, we shifted from an untethered HWD to a tethered setup that can display both AR and VR. This allows us to further control for confounding variables such as a lower field of view on a typical AR HWD like the Microsoft HoloLens than most VR HMDs. We used the Varjo XR-3, which is a high resolution HWD that can activate its forward facing cameras in order to present the user with a pass-through AR experience. It includes a 5 m tether that affords the user reasonable area that they can use to interact with objects.
The physical environment was a computer lab office space with a large four by 8 m central area devoted to MR tracking. This area had a SteamVR Lighthouse 2.0 tracking system. For the AR condition, a whiteboard with dry erase markers was placed within the tracked area along one of the 4 m edges. The physical environment can be seen in Figure 3. We chose to use an active office setting because, while we wanted to keep confounding variables low, we also wanted to balance this with performing an ecologically valid experiment. Analysts, while performing sensemaking tasks, would continue to use tools they were already familiar with, such as pen and paper or a whiteboard. We therefore supplied those. The XR-3 was running on a desktop PC with an Intel Core i9-9800 processor and an NVIDIA GTX 2080 graphics card. The participants also used a single Valve Index controller to move artifacts around the virtual environment. Lastly, participants had a Logitech G780 wireless keyboard with numpad on a wheeled standing desk that was tracked with an HTC Vive Tracker 2.0, as seen in Figure 2.
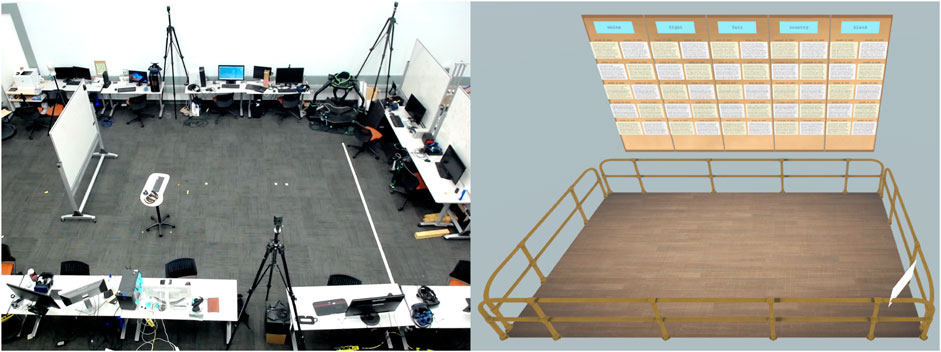
FIGURE 3. On the left is the physical space that users work in. When performing tasks in VR, they see the virtual environment to the right. The environment has a floor-with-railings setup so users know where they can travel safely when considering physical obstacles and the tether to the XR-3.
In VR, the environment had a 3 by 6 m floor and railing model as seen in Figure 3. This represented the area that the participant could freely move in and was kept clear of all physical obstacles with the exception of the tracked keyboard desk. The railings represented the general limits of the tether. Outside one of the long edges was a bulletin board where all artifacts initially appear. In AR, the floor and railing model and the bulletin board are not represented, though the artifacts appear in the same location in the space as in the VR condition.
4.3 Experimental tasks
Our goal with this study was to better understand the tradeoffs between the independent variables of AR and VR for sensemaking tasks. To that end, we designed two separate prompts for a historical analysis essay of roughly equal difficulty. These prompts were designed to be answered when paired with open-ended responses to Survey 32, which was a survey conducted by the US Military in 1942 during World War II. Survey 32 covered the topic of racial integration within the military, and had service members answer 77 multiple-choice questions and an open ended short answer. In particular, the responses shown to participants were the short answer question “Do you have any additional comments?” The survey responses are available through The American Soldier Project Gitre and Luther (2018). The prompts were:
1. According to the soldiers who responded, what ought to be the overriding consideration in the Allied war effort, pragmatism or principle? Should America be fighting for the principles of democracy wherever those principles are threatened or violated, even in America itself; or should the country focus solely on winning the war to end it as soon as possible? How do these views differ based on the respondent’s racial identification? What do they indicate about the state of racial relations across the armed forces?
2. How closely did the experience of this cross-section of soldiers reflect Marshall’s view of the army as a democratic institution? If it did not, how do the soldiers you read try to make peace with military regimentation? How, if at all, did the race of the soldiers who wrote these remarks influence their views of the military as an institution and of their wartime experience?
Since we wanted to simulate the sensemaking process with these tasks, these prompts required close reading of the artifacts to connect themes between responses. We consulted with historical analysis expert to choose five keywords that would be searched for to answer each prompt, which allowed us to simulate and expedite the early stages of the sensemaking process. For each keyword, we chose five responses from white soldiers and five responses from black soldiers. Responses to the survey were displayed as data artifacts like one seen in Figure 1 and presented under their given keyword. The racial identification of the respondent was encoded on the artifact through its coloration: responses from white soldiers were on white artifacts and responses from black soldiers were on yellow artifacts. This was done so the participants could quickly understand a key attribute of each response. The first prompt was given in the first session and the second prompt in the second session regardless of mixed reality condition to each participant.
This study was approved by the institution’s institutional review board.
4.4 Procedure
This study had four phases: a pre-study phase, two main session phases (performed in separately scheduled sessions a minimum of an hour apart but no more than a week apart), and a post-experiment phase. The two main session phases were further divided into a training phase, a study phase, and a post-study phase. These are described in detail below.
For the pre-study phase participants were welcomed and provided with a physical copy of the informed consent form to sign. We had the participants answer a brief background questionnaire in order to gain some insight into their demographics as well as their past experience with VR/AR devices. Lastly, we introduced the concepts behind IST to them. This phase took approximately 5–10 min.
In each main session phase participants were first given a tutorial for the version of IST they were using that session, as we alternated which version each participant saw first to counterbalance the study. First, the tutorial introduced the area, whether it was the virtual environment or the physical space, to the participants and had them move along the boundaries to get comfortable. Additionally, the tutorial taught them how to move artifacts, scroll text, select text, highlight text, copy text, and annotate the artifacts. It further taught them how to save their layout, create new labels and free-form notes, and search the document set for keywords. In particular, for the both the AR and VR conditions, they were told they could use any tools they could see. For VR this included pen and paper that were placed on the tracked desk, and for AR this included pen and paper, a whiteboard and markers, and desks and chairs. This phase used an example set of artifacts that were CNN articles taken from their website. This subphase took 10–15 min.
In the main session study phase the participants were given a description of the dataset and the prompt they were going to answer, and they were asked if they had any questions. They were then put into the same version of IST as the tutorial with the prompt’s dataset and informed that, while there were 50 documents displayed, they only needed to use as many as they thought were needed to answer the prompt fully. As soon as they were ready, the experimenter started the recordings and observed their actions, giving the participants time updates every 15 minutes. Participants were asked to read, sort, and analyze the documents and write the answer to the prompt in a free-form note to the best of their ability. This subphase had 60 min allotted to it, but participants were allowed up to 90 min.
The post-study subphase had participants answer a short semi-structured interview. Since these questions focused on what they did during the session participants were still wearing the HWD so they could refer to their layouts and the data artifacts. They were asked the following questions:
• What was your overall strategy for analyzing the document set? Did this change over the course of the session?
• Please describe the spatial layout you formed this session, and how it changed over the course of the session.
• What was the transition from your IST artifact spatial layout to the essay, if any?
In the second main session, participants were also asked to describe how their strategies changed from the first session. These were designed to understand how the users utilized space to make sense of these large document sets, answering RQ1and2. After participants finished the interview, they were then asked to fill out the User Experience Questionnaire (UEQ). This phase took approximately 10 min.
The post-experiment phase involved a semi-structured interview asking them various questions to compare and contrast their experiences with the two versions of IST. They were asked the following questions:
• What was your overall impression of each version of the system and their ability to support analysis tasks?
• If you were writing a real paper or essay, would you want to use a system like this? Why or why not?
• What were the most useful features of the system and why?
• Were there features that you wanted that were missing from the system?
• Was there anything confusing, annoying, or difficult about completing the tasks?
• Which level of mixed reality did you feel better supported your focus?
• Which level of mixed reality did you feel more grounded in reality?
• Did you refer to or use any real-world tools in either level of mixed reality?
• Do you have any other comments?
These questions were aimed at extracting qualitative user experience feedback in order to answer RQ1 and 2. This interview took 10–15 min. All participants were compensated $50 for an expected 3–4 h of work.
4.5 Data collection and measures
Data for this mixed methods study was collected in a number of ways. Each participant took a pre-study questionnaire on Google forms to gather background data, including how familiar they were with AR and VR. Log files were generated from the sessions that captured every listed action above or in the previous study Lisle et al. (2021) the users made as well as camera, controller, and keyboard location data up to ten times a second. We made video recordings using the built-in Varjo software of exactly what the participants saw during the experiment, and during the interviews an iPhone was used to record the audio. Each participant took the User Experience Questionnaire (UEQ) after each main session using a Google form Laugwitz et al. (2008). Lastly, each participants’ final layouts were saved for each session with artifact position, rotation, highlights, and annotations as well as any free-standing notes or labels. All the semi-structured interviews were recorded using Apple’s Voice Memos App running on an Apple iPhone. All data was backed up on a Google Drive.
4.6 Preliminary study
We ran a preliminary study (N = 21) to look into answering our research questions. In this study, we used a 3D model of a keyboard so users could find the keyboard and type after they found the keyboard’s home row, as seen in Figure 2.
Participant feedback revealed that the poor typing experience in VR overwhelmed other user experience feedback. All 21 participants discussed the issues with the keyboard in VR in both the post-session and post-experiment interviews, describing it as “unlikable” or “annoying.” 20 of the 21 participants stated that AR was the better condition due in part to the ability to see the keyboard. Furthermore, the impact the typing experience had on the essays was drastic, with many essays written in VR consisting of bullet point reactions (with multiple grammatical and spelling errors) rather than complete sentences or paragraphs. This feedback from the interviews caused us to redesign this interaction method. This led to the “Desk Portal” idea as described in 3.1, and we ran the study again with this change. Beyond using the Desk Portal, the main study’s procedure and design was unchanged from the preliminary study.
4.7 Participants
For the main study, we decided to restrict participation to US Citizens. This limited the pool to people who had some background knowledge in US history, as it is required for secondary education. Furthermore, it ensured participants would have a higher chance of understanding the racial tensions in US society, which was relevant to the dataset and prompts we were using. Therefore we recruited undergraduate and graduate students who were US Citizens and were currently taking a history or human-computer interaction course. Seventeen participants were recruited, but one did not attend the second session. The remaining sixteen (3 female) had a mean age of 21.1 with a standard deviation of 2.02.
5 Results and discussion
To assess user experience (RQ1), we analyzed the results of the UEQ as well as responses to the post-experiment semi-structured interview, as seen in Section 5.2. We identified user strategies (RQ2) by analyzing what participants did in both AR and VR and their responses to the post-session semi-structured interviews, which can be seen in Section 5.3. For measuring performance (RQ3), we hired four experts in historical analysis to grade each essay and performed statistical analysis, which can be seen in Section 5.1.
5.1 Historical analysis performance
To address RQ3’s goal of measuring performance on the historical analysis essay-writing task, we hired four history and social studies graduate students who had experience grading college-level history papers. Each of them graded all the essays from both the AR and VR sessions based on a rubric with five ratings on a 0–10 scale. These ratings were:
• R1: How evident is it that they have read individual documents?
• R2: How evident is it that they have read groups of documents?
• R3: Is there a clear organizational scheme?
• R4: Have they identified ambiguities and contradictions where they show nuance and understanding of the topic? Do they have an argument or thesis?
• R5: What is the overall quality of their answer?
To ensure that grading was consistent, we met with these graders and a historical analysis expert for a training exercise. We gave them sample essays and asked them to grade them independently, then discussed how and why they graded them as a group. Once we were in full agreement on how to perform the grading, they were given the essays and asked to grade them independently. They had no knowledge of what condition (AR or VR) each essay was written in.
We performed an intraclass correlation (ICC) test to determine if the expert ratings were consistent. Using a one-way mixed effects model, our ICC value for the sum of the ratings was ICC(C, 1) = 0.647 which indicated moderate agreement between the experts. We also checked individual ratings, and found moderate agreement for R1 (ICC(C, 1) = 0.591), R2 (ICC(C, 1) = 0.569), R3 (ICC(C, 1) = 0.583), and R5 (ICC(C, 1) = 0.629). R4 was rated as poor agreement (ICC(C, 1) = 0.449).
Using these grades, we ran repeated measure paired t-tests to determine if style of mixed reality had an effect on the scores. We found a significant effect of MR style on R1 score (t(15) = 2.39, p = 0.0306) and R2 score (t(15) = 2.48, p = 0.0257). In both R1 and R2, participants scored higher when using AR. These indicate that it was more evident participants carefully read documents when they analyzed and wrote in the AR condition. We investigated the relationship between the use of writing tools and the scores to see if the writing tools were responsible, but our Kruskal–Wallis tests comparing tool use to R1 (χ2(1) = 2.37, p = .124) and R2 (χ2(1) = 1.68, p = .196) did not show significance. We further calculated the Cohen’s D to find the effect size of RSum (the sum of all ratings) as well as a post hoc power analysis to determine the number of participants required to find significance. We found an effect size of.167 for RSum and calculated that it would take a study with N = 284 to find significant levels of difference between the two levels of mixed reality, which is not feasible when considering the 4 h it takes to run a single participant. No significance was found with respect to the other ratings. All ratings and RSum boxplots can be seen in Figure 4.
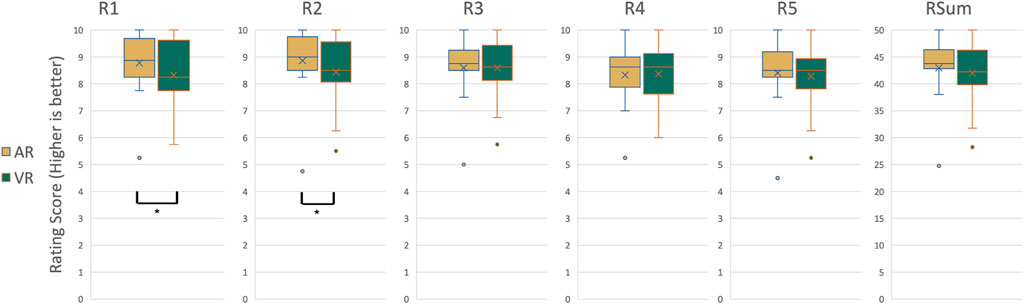
FIGURE 4. Boxplots for the rating scores for AR and VR conditions. R1 grade performance (Left boxplot, How evident is it that the participant has read individual documents?) and R2 grade performance (second to the left, How evident is it that they have read groups of documents?) were significantly different between AR and VR conditions.
We further performed correlation tests on many different variables that were related to the level of mixed reality or their strategy using IST. These included what style of mixed reality that was used, number of artifacts moved, mean distance each artifact moved, how far each participant moved during the session, how far the keyboard moved during the session, how many highlights, labels, or notes they used, how many times they copied text to the clipboard, if they used non-digital tools (such as the whiteboard or physical paper prompt), the layout scheme they used, whether they preferred AR or VR, whether they found AR or VR more focusing, and whether they found AR or VR grounded them in reality. For correlations between categorical variables and scores, we used Kruskal–Wallis tests, while for correlations between continuous variables and scores used Spearman’s tests. There were no significant findings. We further looked at the amount of time it took for them to answer the prompt in both AR and VR. In AR, participants took a mean time of 3,845 s with a standard deviation of 1,423, while in VR, participants took a mean time of 3,494 s with a standard deviation of 843. A Spearman’s test revealed no significant correlation between time taken and condition.
5.2 User experience
To address RQ1, we analyzed the UEQ data as well as qualitative feedback from the interviews. We analyzed the effect of MR style on responses for each question in the UEQ and each compiled scale. We found participants found AR more secure (physically safe, χ2(1) = 6.4, p = .0114 AR: mean = 1.5, SD = 0.894, VR: mean = 2.5, SD = 1.03), as well as more attractive (χ2(1) = 5.4, p = .0201 AR: mean = 1.72, SD = 0.894, VR: mean = 1.4, SD = 1.06) and Dependable (χ2(1) = 7.14, p = .00753 AR:mean = 2.08, SD = 0.472, VR: mean = 1.375, SD = 0.742). Boxplots of these can be seen in Figure 5.
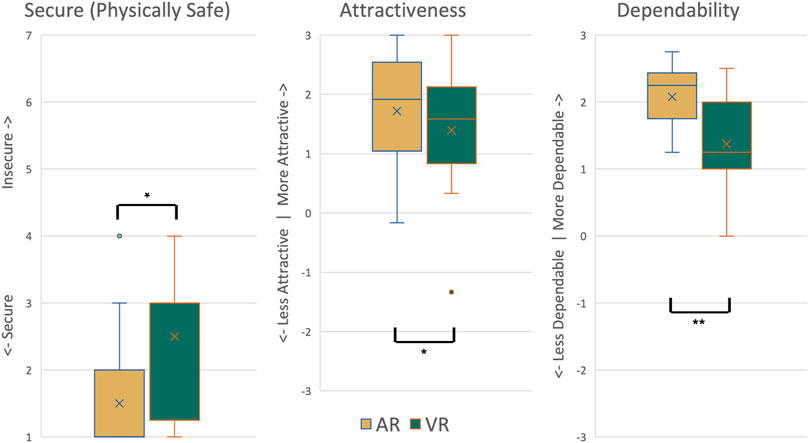
FIGURE 5. The significant UEQ results from experiment II showed that participants found AR more physically safe (Secure vs. Insecure), Dependable, and Attractive than VR.
These results suggest that users are more comfortable in situations where they can see their surroundings and feel safe knowing that there is not anything that they might hit accidently. The dependability scale, in particular, suggests that they felt like they knew how their environment would react to their input, meaning the physical reactions of the objects they could see and interact with. Combined with the significantly higher scores in R1 and R2 while in AR, as seen in Section 5.1, could mean that their comfort and expectations in the system afforded them the ability to more closely read the documents and identify key passages and themes.
Qualitative feedback revealed further user experience findings. The tether of the HWD presented an issue, with three participants explicitly mentioning it. B5 stated “I did not want to step on the tether. I was aware of it all the time.” but noted that “I thought about the tether a lot less [in the AR condition]. I kind of just forgot about it … Being able to see the tether makes a huge difference.” This backs up the finding for question 17 of the UEQ that participants felt safer knowing where the tether was. Other participants continued the security theme in a more general way. B3 stated that AR “was not like I felt in the VR yesterday, where I felt I was in danger walking around, like, when you cannot see your environment you do not feel the inclination to walk around.”
Furthermore, two participants grabbed chairs to sit down during the session while still performing the task in AR, increasing their physical comfort. B5 also stated that “I considered grabbing a chair [in AR]. I would never have considered it in VR.”
The post-experiment interview also revealed user preferences between the 2 MR styles. Nine of the sixteen participants preferred VR over AR. “AR did not add much besides making you a little more comfortable that you’re not going to trip over something, whereas the VR had all the same features and just seemed more real,” stated B5, while B8 said “VR felt more natural and you could move around and use your whole space better.” Similarly, B4 stated that VR afforded “more blank space where I had a greater opportunity of where I could lay stuff out.”
As we hypothesized, the majority of participants found VR better for focus than AR, with thirteen of sixteen stating that there were too many distractions in AR. “Stuff in the environment … I was not consciously getting distracted by it, but it was not helping my focus,“, stated B3, while B12 said “I feel VR was better for trying to block everything out and focus on the task at hand instead of thinking ‘oh there’s a computer over there, I wonder what that guy is doing.’ ” In addition, observational data showed that participants would get distracted by notifications on personal devices while in AR. Participants B1 and B13 kept referencing their phone during the session in AR, but in VR B1 removed their watch to prevent further notifications as “taking off the headset was time consuming.” This is in contrast to previous work by Satkowski and Dachselt where their participants were unhindered doing visualization tasks in AR Satkowski and Dachselt (2021). We believe this is due to their study using a 2D task whereas ours is inherently 3D. Additionally, we should note that this contradicts the performance findings with respect to R1 and R2 seen in Section 5.1, where those ratings were intended to measure the amount of focus participants placed on reading documents. The contradiction between qualitative feedback and quantitative measurement, while typical in UX research, is evidence that there’s not always a correlation between performance and perception for UX.
Twelve of sixteen thought that AR did ground users better in reality, as we hypothesized. This affected B9’s preference towards AR, saying “I can see what’s going on around me and get a sense of time … in VR you cannot really get a sense of time … You can be in there for hours and it’s suddenly nighttime.” Similarly, B1 enjoyed being able to use tools: I was able to use the [whiteboard], for example, … but VR was like wandering around in the dark.”
Overall, the user experience data suggests moving towards the center of the reality-virtuality continuum. This would entail more portals to the real world, like the Desk Portal, allowing users’ to access traditional tools such as whiteboards, or a portal to see the floor of the tracked area to ensure it is free of obstacles while balancing the users’ desire to block out distractions through a virtual environment. Some physical tools could be represented by tracked objects with virtual representation, such as chairs or other furniture that does not need to be seen to be used. Similarly, the UEQ metrics show that AR delivers on attractive and dependable metrics, while participants found focus and more space to organize in VR.
5.3 User Strategies
We observed participants employing many different strategies between the AR and VR conditions. As Lisle et al. found in previous work on IST, users laid out documents in three identifiable ways: semicircular, environmental, and planar. In the AR condition, five participants used environmental layouts, eight used semicircular layouts, two used planar layouts, and one participant had a “none” layout where they put documents back to their original spot after reading them. All of the environmental layouts used the whiteboard as the environmental feature around which documents were arranged. In VR, there were seven environmental layouts, five semicircular layouts, 2 planar layouts, and 2 “none.” In VR, however, the environmental layouts used the floor edges with railings and the bulletin board as the key environmental features, which led to artifacts being more spread out. As a result, we believe there were more environmental layouts used in the VR condition because there were more landmarks with blank area to do so than in AR. Luo et al. (2022) noticed a similar pattern for data artifact layout in their study, in that users in AR needed furniture and other landmarks as scaffolding for their organization. It’s possible that this applies in both AR and VR, and our virtual environment simply gave participants more opportunity to do so. Examples of environmental layouts for B1, who used the whiteboard as scaffolding, and B8, who used the floor edges and railings as scaffolding, can be seen in Figure 6. Some participants changed their strategies from one session to the next. B8, for example, went from using a semicircular layout in the AR session to using an environmental layout in the VR session, using three of the floor edges to organize documents. This can be seen in Figure 7.
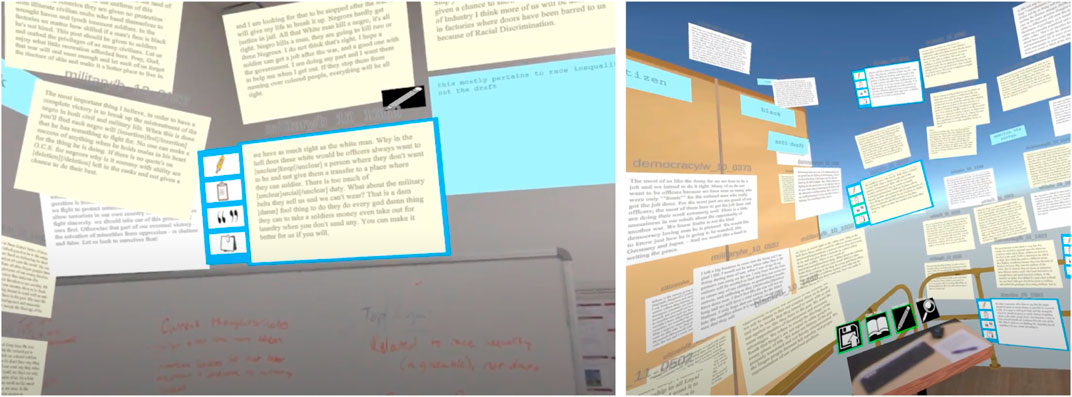
FIGURE 6. Left: First person view of B1’s environmental layout in AR. B1 utilized the whiteboard as scaffolding, placing documents above and around it while also using the whiteboard to take notes on the documents. Right: First person view of B8’s environmental layout in VR. B8 utilized the floor edges and railings to organize documents.
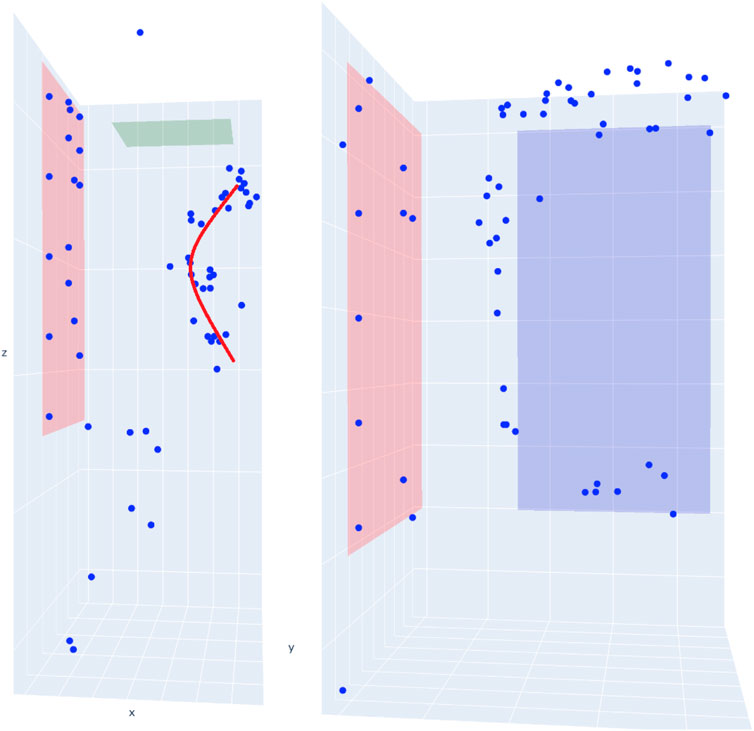
FIGURE 7. Left: 3D scatterplot of where B8 organized documents in AR. The red line emphasizes the semicircular layout, with the observation point being at the center of the arc. Right: B8’s layout in VR. The blue rectangle is the floor; documents are organized around three sides of the floor in an environmental layout.
In the interviews, participants explained their environmental layouts by describing them as staging areas or places with assigned meaning. “The final six documents, I placed them by the whiteboard area. When I was finally about to construct my response, I put the ones I did not want back on the wall,” B4 stated, with B15 more strongly saying “I grabbed [artifacts] off the wall and placed them around the whiteboard because that was my writing space.” B17 continued this idea, and said “Being able to move documents to the [whiteboard] buffer space allowed me to process them more efficiently. I had a space with meaning, and that helped me.” We term this space the “Shoebox,” based on Pirolli and Card’s sensemaking phase where data is stored for processing Pirolli and Card (2005). Furthermore, this is similar to the “personal” territory seen in Scott et al. (2004)’s work on collaborative tabletop spaces in that the document is actively being processed and at the edge of their work area where it is ergonomically accessible. None of the participants reported or were observed using this strategy in VR.
Another way participants assigned roles to space was through having trash piles. Interestingly, this strategy was observed more in VR (four participants) than in AR (two participants). This may be because occlusion worked in VR and not as well in AR, as B13’s trash pile strategy was to hide the artifacts: “If I thought a document was not useful I pushed it behind the bulletin board.” B8 had trash piles in both, stating “thought a document was irrelevant I stuck it in a corner.”
In addition to utilizing space, participants would use tools such as the whiteboard in AR or the physical document on which the prompts were written in both AR and VR (it was possible to see the physical document in VR by placing it on the desk and viewing through the portal). While nine participants used the whiteboard in AR as either their shoebox area or as scaffolding for their layouts, only six participants used the whiteboard to jot down notes or ideas. B11, for example, used the whiteboard to offload cognition and organize their thoughts: “I used the whiteboard to write out and separate the main ideas,” continuing “I used different color markers so I could separate the opinions of the black soldiers from the white soldiers.” This can be seen in Figure 8. Similarly, six participants used the provided physical paper prompt and pen to write down thoughts or underline key parts of the question. This was slightly more observed in AR at three participants versus two in VR with B9 using it in both but stating that “it was a lot easier to write [on the paper] in AR, so I used a pen to jot some things down … to get me started on what to write for my essay.” Even though the participant did not offload their cognition onto the virtual environment, the process of writing helped them with their sensemaking.
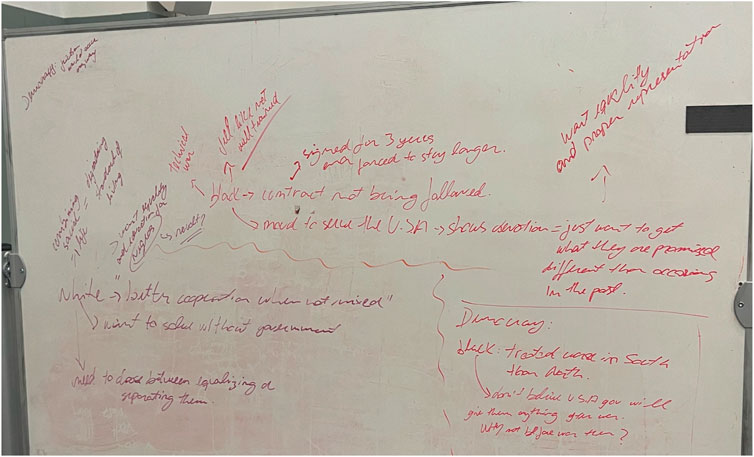
FIGURE 8. Participant B11 wrote down quotes and thoughts for their analysis on the whiteboard, separating thoughts from white and black soldiers by using different color markers.
B15 had their own strategy in the AR condition, where they read artifacts like other participants, but extracted their thoughts from artifacts and wrote those directly on the whiteboard before returning the artifact to near its original position. This resulted in a layout that had only the prompt and their essay near the whiteboard, and all of the remaining artifacts along the original plane they started on, as seen in Figure 9, right. We defined this as having no-layout, as even though the artifacts form a rough plane it was incidental because B15 put them back as they extracted what they wanted from them. It is evident from the movement line that B15 spent a lot of time working on the whiteboard, where they created a T-chart of their thoughts and observations. A T-chart is an organizational tool used to separate information into two categories to more easily compare and contrast them. They stated that using the white board “felt quicker, I was not bogged down by pressing the buttons, I could go straight into writing on the board which I’m accustomed to.” B15 repeated this strategy in the VR session, but had to adapt several notes to create the same structure. These T-Charts can be seen in Figure 10. B15 expressed displeasure with their VR T-chart, saying “I wanted to do the [chart], but it was not supported in VR, it was not streamlined.” These observations show that familiar methods and tools are desirable, and should be supported in an approach for the sensemaking process.

FIGURE 9. User movement and document layout for B15’s VR (on the left) and AR (on the right) sessions. The original plane that documents appeared on is shown in red, while the whiteboard is shown as a green line. Movement is visualized with the blue line.
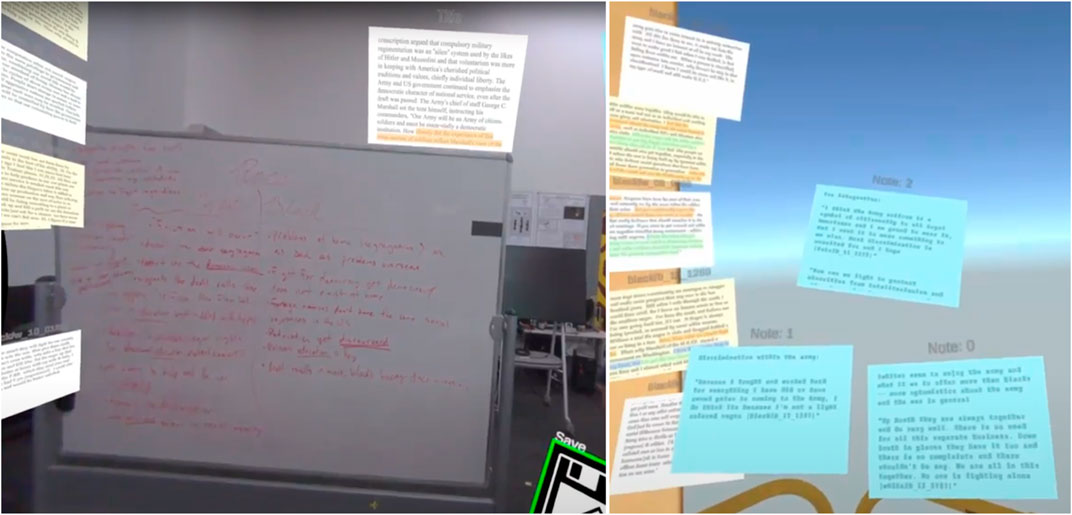
FIGURE 10. Participant B15 utilized a strategy for analysis called a T-Chart. Using the whiteboard in the AR condition, they wrote about the varying experiences of white and black soldiers, filling the board with quotes, themes, and ideas, as seen on the left. They attempted to recreate a T-Chart in the VR condition, using the note feature, as seen on the right.
6 Limitations
While we performed several iterations on the design of this experiment, there are several limitations that need to be discussed. First, while the Varjo XR-3 is certainly a state-of-the-art HWD capable of both VR and AR, the use of video-pass-through AR presents difficulties, such as incorrect ocular placement (about two inches ahead of normal eye placement). This can affect user depth perception, as seen in other studies Adams et al. (2022). Furthermore, as several participants noted, despite the XR-3’s high pixel density it still renders real-world objects at a lower fidelity than their eyes, causing them to be blurry. An optical see-through display, such as the Microsoft Hololens, would be more appropriate for real-world tool usage, but its relatively low field-of-view and lack of VR capabilities made it unsuitable for this study. Limiting the confounding variables allowed for a more fair comparison between the two versions of mixed reality.
The study also used novice analysts to complete the sensemaking tasks, where the pool of participants lacked expertise in performing historical analysis. However, for the study we did select US citizens to have a background in both essay writing and US history. While this allowed us to gauge the effectiveness of AR and VR, recruitment of domain expert analysts would provide a better look at the overall performance.
We also should note that our study was performed in a lab that had other people actively working as well as their desks visible in the AR condition. This may have had an impact on the performance of the AR condition as people moving about the space and/or the cluttered environment could have distracted the participants or affected their document layouts. A well-organized and secluded environment could better control these variables.
One benefit of VR we did not address was the ability to create specialized interactions methods to assist with the sensemaking process that have real-life counterparts, such as the ability to make handwritten notes in VR such as in Lee et al.’s Post-Post-it Lee et al. (2021). However, each individual real-world tool would need to be an individual design interaction in VR of varying user experience levels, and user preferences can vary along a number of different real-world tools. We decided to keep these to a certain subset of designed interactions in order to keep these variables low, but it may have negatively impacted the VR condition.
Lastly, we should acknowledge that this study focused on the singular experience. There are likely differences when performing sensemaking in a collaborative setting, such as Luo et al.’s research or many other collaborative studies Luo et al. (2022); Ens et al. (2019); Sereno et al. (2020). However, we chose to focus on the individual experience as a good starting point as many sensemaking tasks are performed in-part or entirely as solo activities, such as literature reviews or historical analysis.
7 Conclusion and future work
In our studies, we examined how the use of different approaches to immersive sensemaking, drawn from different points on the mixed reality continuum, affect user experience, strategy, and performance. We found tradeoffs between VR (enhances focus and limits distraction) and AR (enhances comfort and affords the use of physical tools).
Small but meaningful changes in user experience design can result in different outcomes when comparing AR to VR. The enhancements we made to improve keyboard usability in VR through an augmented virtuality portal proved to be effective, but we propose that future immersive analytics approaches expand this approach further. Furthermore, as evidenced by our preliminary study, text entry and offloading cognition onto the environment is a vital part of the sensemaking process, and improvements such as our Desk Portal concept can improve the user experience greatly. Environments should retain most of the virtual setting to keep the focus on the data but open more portals to the real world to enable the use of more traditional tools or viewing the tracked area for obstacles. We believe this is preferential to the alternative of incorporating walls to block distractions in an AR setting as it includes only the objects of interest to the user. The process of using these non-digital tools can enhance the sensemaking process such that the user’s understanding grows and they can write reports more easily. Furthermore, the virtual environment can provide scaffolding easily for organization of documents, a phenomenon we observed in our study and in a past study in VR Lisle et al. (2021). This is more difficult in an AR setting, as Luo et al. (2022) discussed how different furniture had different patterns of usage. In an augmented virtuality setting, varied workspaces can be created easily by adding object-structures that provide the same affordances, such as a big cabinet, whiteboard, or office chair.
In future work we intend to further explore the idea of augmented virtuality portals. We hypothesize that both pre-defined and user-defined portals will have different use cases, and a validation study could reveal more user intent. In addition, a validation study with multiple sensemaking tasks exploring augmented virtuality as a design choice could reveal further insights. Furthermore, we intend to add more context-aware functionality to IST, by adding semantic interaction and natural language processing to enhance the user’s sensemaking process. As mentioned in Section 6, clutter may have an impact on performance in augmented reality. We can study this aspect more deeply by varying the level of clutter in an environment and its impact on the sensemaking process. Lastly, we want to compare IST to more traditional digital scenarios, such as a desktop with a single monitor or an array of monitors to understand how varying the amount of space a user has affects their understanding of multimedia datasets.
Data availability statement
The raw data supporting the conclusion of this article will be made available by the authors, without undue reservation. The raw anonymized data can be provided by emailing the primary author. This publication uses data generated via the Zooniverse.org platform.
Ethics statement
The studies involving human participants were reviewed and approved by Virginia Tech Institutional Review Board. The patients/participants provided their written informed consent to participate in this study.
Author contributions
LL, KD, EG, CN, and DB contriubted to the ideation and development of this article. LL and KD developed the software used in the research study. LL performed the resesarch study and conducted the interviews. LL and KD performed the statistical analysis. LL, KD, CN, and DB interpreted the data and statistical analysis. LL developed the initial draft, which was edited and polished by KD, EG, CN, and DB. All authors contributed to the article and approved the submitted version.
Funding
This work was supported in part by a grant from the Office of Naval Research and NSF grant #CSSI-2003387. This publication uses data generated via the Zooniverse.org platform, development of which is funded by generous support, including a Global Impact Award from Google, and by a grant from the Alfred P. Sloan Foundation. The funders had no role in the study design, data collection, analysis, interpretation of data, the writing of this article, or the decision to submit it for publication.
Conflict of interest
The authors declare that the research was conducted in the absence of any commercial or financial relationships that could be construed as a potential conflict of interest.
Publisher’s note
All claims expressed in this article are solely those of the authors and do not necessarily represent those of their affiliated organizations, or those of the publisher, the editors and the reviewers. Any product that may be evaluated in this article, or claim that may be made by its manufacturer, is not guaranteed or endorsed by the publisher.
References
Adams, H., Stefanucci, J., Creem-Regehr, S., and Bodenheimer, B. (2022). “Depth perception in augmented reality: the effects of display, shadow, and position,” in 2022 IEEE conference on virtual reality and 3D user interfaces (VR) (IEEE), 792–801.
Ancona, D. (2012). “Framing and acting in the unknown,” in The handbook for teaching leadership. Editors S. Snook, N. Nohria, and R. Khurana, 3–19.
Andrews, C., Endert, A., and North, C. (2010). “Space to think: large high-resolution displays for sensemaking,” in Proceedings of the SIGCHI conference on human factors in computing systems (ACM), 55–64.
Andrews, C., and North, C. (2013). The impact of physical navigation on spatial organization for sensemaking. IEEE Trans. Vis. Comput. Graph. 19, 2207–2216. doi:10.1109/tvcg.2013.205
Batch, A., Cunningham, A., Cordeil, M., Elmqvist, N., Dwyer, T., Thomas, B. H., et al. (2019). There is no spoon: evaluating performance, space use, and presence with expert domain users in immersive analytics. IEEE Trans. Vis. Comput. Graph. 26, 536–546. doi:10.1109/tvcg.2019.2934803
Bowman, D. A., and Hodges, L. F. (1997). “An evaluation of techniques for grabbing and manipulating remote objects in immersive virtual environments,” in Proceedings of the 1997 symposium on Interactive 3D graphics, 35.
Bruder, G., Steinicke, F., and Hinrichs, K. H. (2009). “Arch-explore: A natural user interface for immersive architectural walkthroughs,” in 2009 IEEE symposium on 3D user interfaces (IEEE), 75–82.
Chandler, T., Cordeil, M., Czauderna, T., Dwyer, T., Glowacki, J., Goncu, C., et al. (2015). “Immersive analytics,” in 2015 big data visual analytics (BDVA) (IEEE), 1–8.
Cordeil, M., Cunningham, A., Dwyer, T., Thomas, B. H., and Marriott, K. (2017). “Imaxes: immersive axes as embodied affordances for interactive multivariate data visualisation,” in Proceedings of the 30th annual ACM symposium on user interface software and technology (ACM), 71–83.
Davidson, K., Lisle, L., Whitley, K., Bowman, D. A., and North, C. (2022). “Exploring the evolution of sensemaking strategies in immersive space to think,” in IEEE transactions on visualization and computer graphics.
Elm, W., Potter, S., Tittle, J., Woods, D., Grossman, J., and Patterson, E. (2005). “Finding decision support requirements for effective intelligence analysis tools,” in Proceedings of the human factors and ergonomics society annual meeting (Los Angeles, CA): SAGE Publications Sage CA), 49, 297–301.
Endert, A., Ribarsky, W., Turkay, C., Wong, B. W., Nabney, I., Blanco, I. D., et al. (2017). “The state of the art in integrating machine learning into visual analytics,” in Computer graphics forum (Wiley Online Library), 36, 458–486.
Ens, B., Lanir, J., Tang, A., Bateman, S., Lee, G., Piumsomboon, T., et al. (2019). Revisiting collaboration through mixed reality: the evolution of groupware. Int. J. Human-Computer Stud. 131, 81–98. doi:10.1016/j.ijhcs.2019.05.011
Fröhler, B., Anthes, C., Pointecker, F., Friedl, J., Schwajda, D., Riegler, A., et al. (2022). “A survey on cross-virtuality analytics,” in Computer graphics forum (Wiley Online Library), 41, 465–494.
Galati, A., Schoppa, R., and Lu, A. (2021). Exploring the sensemaking process through interactions and fnirs in immersive visualization. IEEE Trans. Vis. Comput. Graph. 27, 2714–2724. doi:10.1109/tvcg.2021.3067693
George, C., Tien, A. N., and Hussmann, H. (2020). “Seamless, bi-directional transitions along the reality-virtuality continuum: A conceptualization and prototype exploration,” in 2020 IEEE international symposium on mixed and augmented reality (ISMAR) (IEEE), 412–424.
Giovannelli, A., Lisle, L., and Bowman, D. A. (2022). “Exploring the impact of visual information on intermittent typing in vr,” in 2022 IEEE international Symposium on Mixed and augmented reality (ISMAR) (IEEE).
Gold, L., Bahremand, A., Richards, C., Hertzberg, J., Sese, K., Gonzalez, A., et al. (2021). “Visualizing planetary spectroscopy through immersive on-site rendering,” in 2021 IEEE virtual reality and 3D user interfaces (VR) (IEEE), 428–437.
Klein, G., Moon, B., and Hoffman, R. R. (2006). Making sense of sensemaking 2: A macrocognitive model. IEEE Intell. Syst. 21, 88–92. doi:10.1109/mis.2006.100
Kobayashi, D., Kirshenbaum, N., Tabalba, R. S., Theriot, R., and Leigh, J. (2021). “Translating the benefits of wide-band display environments into an xr space,” in Symposium on spatial user interaction, 1–11.
Kudo, Y., Tang, A., Fujita, K., Endo, I., Takashima, K., and Kitamura, Y. (2021). “Towards balancing vr immersion and bystander awareness,” in Proceedings of the ACM on human-computer interaction, 5, 1–22.
Lages, W., Li, Y., Lisle, L., Höllerer, T., and Bowman, D. (2019). “Enhanced geometric techniques for point marking in model-free augmented reality,” in 2019 IEEE international symposium on mixed and augmented reality (ISMAR) (IEEE), 301–309.
Laugwitz, B., Held, T., and Schrepp, M. (2008). “Construction and evaluation of a user experience questionnaire,” in Symposium of the Austrian HCI and usability engineering group (Springer), 63–76.
Lee, B., Hu, X., Cordeil, M., Prouzeau, A., Jenny, B., and Dwyer, T. (2020). Shared surfaces and spaces: collaborative data visualisation in a co-located immersive environment. IEEE Trans. Vis. Comput. Graph. 27, 1171–1181. doi:10.1109/tvcg.2020.3030450
Lee, C., Bonebrake, S., Bowman, D. A., and Höllerer, T. (2010). “The role of latency in the validity of ar simulation,” in 2010 IEEE virtual reality conference (VR) (IEEE), 11–18.
Lee, C., Rincon, G. A., Meyer, G., Höllerer, T., and Bowman, D. A. (2013). The effects of visual realism on search tasks in mixed reality simulation. IEEE Trans. Vis. Comput. Graph. 19, 547–556. doi:10.1109/tvcg.2013.41
Lee, J. H., Ma, D., Cho, H., and Bae, S.-H. (2021). “Post-post-it: A spatial ideation system in vr for overcoming limitations of physical post-it notes,” in Extended abstracts of the 2021 CHI conference on human factors in computing systems, 1–7.
Lisle, L., Chen, X., Gitre, E. J. K., North, C., and Bowman, D. A. (2020). “Evaluating the benefits of the immersive space to think,” in 2020 IEEE 6th workshop on everyday virtual reality (WEVR) (IEEE), 331–337.
Lisle, L., Davidson, K., Gitre, E. J., North, C., and Bowman, D. A. (2021). “Sensemaking strategies with immersive space to think,” in 2021 IEEE virtual reality and 3D user interfaces (VR) (IEEE), 529–537.
Luboschik, M., Berger, P., and Staadt, O. (2016). “On spatial perception issues in augmented reality based immersive analytics,” in Proceedings of the 2016 ACM companion on interactive surfaces and spaces (ACM), 47–53.
Luo, W., Lehmann, A., Widengren, H., and Dachselt, R. (2022). “Where should we put it? Layout and placement strategies of documents in augmented reality for collaborative sensemaking,” in CHI conference on human factors in computing systems, 1–16.
Marriott, K., Schreiber, F., Dwyer, T., Klein, K., Riche, N. H., Itoh, T., et al. (2018). Immersive analytics, 11190. Springer.
Milgram, P., Takemura, H., Utsumi, A., and Kishino, F. (1995). “Augmented reality: A class of displays on the reality-virtuality continuum,” in Telemanipulator and telepresence technologies (International Society for Optics and Photonics), 2351, 282–292.
Olaosebikan, M., Aranda Barrios, C., Cowen, L., and Shaer, O. (2022). “Embodied notes: A cognitive support tool for remote scientific collaboration in vr,” in CHI conference on human factors in computing systems extended abstracts, 1–6.
Park, H., and Kim, S. (2021). Do augmented and virtual reality technologies increase consumers’ purchase intentions? The role of cognitive elaboration and shopping goals. Cloth. Text. Res. J. 41, 91–106. doi:10.1177/0887302x21994287
Ping, J., Liu, Y., and Weng, D. (2019). “Comparison in depth perception between virtual reality and augmented reality systems,” in 2019 ieee conference on virtual reality and 3d user interfaces (vr) (IEEE), 1124–1125.
Pirolli, P., and Card, S. (2005). “The sensemaking process and leverage points for analyst technology as identified through cognitive task analysis,” in Proceedings of international conference on intelligence analysis (McLean, VA, USA), 5, 2–4.
Riegler, A., Anthes, C., Jetter, H.-C., Heinzl, C., Holzmann, C., Jodlbauer, H., et al. (2020). “Cross-virtuality visualization, interaction and collaboration,” in XR@ ISS, 11.
Satkowski, M., and Dachselt, R. (2021). “Investigating the impact of real-world environments on the perception of 2d visualizations in augmented reality,” in Proceedings of the 2021 CHI conference on human factors in computing systems, 1–15.
Satriadi, K. A., Ens, B., Cordeil, M., Czauderna, T., and Jenny, B. (2020). Maps around me: 3d multiview layouts in immersive spaces. Proc. ACM Human-Computer Interact. 4, 1–20. doi:10.1145/3427329
Schwandt, D. R. (2005). When managers become philosophers: integrating learning with sensemaking. Acad. Manag. Learn. Educ. 4, 176–192. doi:10.5465/amle.2005.17268565
Scott, S. D., Carpendale, M. S. T., and Inkpen, K. (2004). “Territoriality in collaborative tabletop workspaces,” in Proceedings of the 2004 ACM conference on Computer supported cooperative work, 294–303.
Sereno, M., Wang, X., Besançon, L., Mcguffin, M. J., and Isenberg, T. (2020). “Collaborative work in augmented reality: A survey,” in IEEE transactions on visualization and computer graphics.
Skarbez, R., Polys, N. F., Ogle, J. T., North, C., and Bowman, D. A. (2019). Immersive analytics: theory and research agenda. Front. Robotics AI 6, 82. doi:10.3389/frobt.2019.00082
Steffen, J. H., Gaskin, J. E., Meservy, T. O., Jenkins, J. L., and Wolman, I. (2019). Framework of affordances for virtual reality and augmented reality. J. Manag. Inf. Syst. 36, 683–729. doi:10.1080/07421222.2019.1628877
Suso-Ribera, C., Fernández-Álvarez, J., García-Palacios, A., Hoffman, H. G., Bretón-López, J., Banos, R. M., et al. (2019). Virtual reality, augmented reality, and in vivo exposure therapy: A preliminary comparison of treatment efficacy in small animal phobia. Cyberpsychology, Behav. Soc. Netw. 22, 31–38. doi:10.1089/cyber.2017.0672
Voit, A., Mayer, S., Schwind, V., and Henze, N. (2019). “Online, vr, ar, lab, and in-situ: comparison of research methods to evaluate smart artifacts,” in Proceedings of the 2019 chi conference on human factors in computing systems, 1–12.
Weick, K. E., Sutcliffe, K. M., and Obstfeld, D. (2005). Organizing and the process of sensemaking. Organ. Sci. 16, 409–421. doi:10.1287/orsc.1050.0133
Yang, Y., Dwyer, T., Wybrow, M., Lee, B., Cordeil, M., Billinghurst, M., et al. (2022). Towards immersive collaborative sensemaking. Proc. ACM Human-Computer Interact. 6, 722–746. doi:10.1145/3567741
Keywords: augmented reality, virtual reality, immersive analytics, visualization techniques, human-centered interaction, sensemaking
Citation: Lisle L, Davidson K, Gitre EJK, North C and Bowman DA (2023) Different realities: a comparison of augmented and virtual reality for the sensemaking process. Front. Virtual Real. 4:1177855. doi: 10.3389/frvir.2023.1177855
Received: 02 March 2023; Accepted: 19 July 2023;
Published: 09 August 2023.
Edited by:
Maxime Cordeil, The University of Queensland, AustraliaReviewed by:
Torsten Kuhlen, RWTH Aachen University, GermanyWeiya Chen, Huazhong University of Science and Technology, China
Benjamin Lee, University of Stuttgart, Germany
Copyright © 2023 Lisle, Davidson, Gitre, North and Bowman. This is an open-access article distributed under the terms of the Creative Commons Attribution License (CC BY). The use, distribution or reproduction in other forums is permitted, provided the original author(s) and the copyright owner(s) are credited and that the original publication in this journal is cited, in accordance with accepted academic practice. No use, distribution or reproduction is permitted which does not comply with these terms.
*Correspondence: Lee Lisle, bGxpc2xlQHZ0LmVkdQ==