 Yuchen Wang
 Yin-Shan Lin
95% of researchers rate our articles as excellent or good
Learn more about the work of our research integrity team to safeguard the quality of each article we publish.
Find out more
ORIGINAL RESEARCH article
Front. Virtual Real. , 06 April 2023
Sec. Virtual Reality and Human Behaviour
Volume 4 - 2023 | https://doi.org/10.3389/frvir.2023.1071355
This article is part of the Research Topic Metaverse in Co-Virtual City Design View all 7 articles
Decision-making processes in traditional urban design approaches are mainly top-down. Such processes have defects including not only taking a long time to examine design results but also leading to irreversible impacts after design implementation. Policymakers and researchers stress the importance of collaborating with different stakeholders in the process of urban design policy and guideline making in order to minimize these negative impacts. However, introducing public participation into urban design from the bottom up is challenging, especially when the process involves abstract urban design concepts such as indicators. This paper explores a new workflow aimed at enhancing public participation to cooperate in urban design work with the help of a newly designed platform tool powered by mobile augmented-reality technologies. The platform is intuitive to use and displays scenes of potential urban design results by superimposing the virtual models onto real-world environments on mobile devices. The public stakeholders are provided with this platform on-site to evaluate the initial values of urban design indicators by interacting with the prototype design along with an immersive experience. They can also grow familiar with the concepts of the given indicators during this process, which helps them better understand the implications of guidelines in future published urban design drafts and estimate the potential results. Their feedback is collected, which can help urban designers further optimize the indicators in urban design guideline making in order to improve their rationality. This process of urban design involving public participation is repeatable, which makes it possible to continuously adjust the design results. A user study was conducted to examine the platform’s usability and its ability to enhance public familiarity with the concepts of given indicators and their willingness to participate in urban design evaluation. The study also attests to the possibility of a workflow that integrates public feedback with the urban design process.
Urban design is a comprehensive discipline since cities are complex systems (Batty, 2009). The mechanisms of top-down planning and individuals’ bottom-up activities work together to shape the urban interface, making urban design practices complicated. Urban designers and managers make policy decisions or guidelines to control urban development based on their expertise, while each citizen also imperceptibly affects the shape of the city through their daily behaviors. Good urban design requires collaboration and the participation of multiple stakeholders to balance the interests of diverse groups so that the created communities or urban spaces can be better shared by most citizens, and eventually facilitate a more healthy and sustainable urban development (Semeraro et al., 2020). Recent policies in different regions also proposed relative policies to include citizens in the urban planning process with a bottom-up approach to enhance urban resilience (ICLEI, 2016). However, the current urban design process is normally from the top down while the community and the public often have less engagement (Dias et al., 2018). During most traditional urban design processes, due to the lack of intuitive display and communication tools, it is difficult for designers and public individuals or communities to work collaboratively. The public is unable to provide feedback immediately and effectively for several reasons. Firstly, they cannot estimate the possible results of urban forms after the design is implemented when they cannot comprehend abstract concepts in the urban design drafts they are viewing, for example, various urban design indicators such as floor area ratio and building coverage ratio. Secondly, they can neither perceive the design results intuitively on-site nor give opinions based on first-hand experience. Such urban design processes can potentially lead to unpredictable results, such as conflicts between urban design implementation and public interests or preferences. Moreover, it normally takes considerable time after the implementation of an urban design to examine or evaluate whether the design is successful; that is, whether it is beneficial to or accepted by the general public. As a result, it is desirable to create a platform that allows the public and designers to easily communicate during the urban design process by providing real-time dynamic visualization of the tangible design results based on abstract concepts.
Emerging technologies such as virtual reality (VR), augmented reality (AR), and mixed reality (MR) make it possible for the elements simulated in virtual world to be replicated physically in the real world. (Farshid et al., 2018). To some extent, these technologies have changed the connotations of geographical space and will also change the thinking paradigm and space-time relationship based on geographical spaces. The recent emergence of metaverses also provides new patterns of spatial cognition and social communication, as it is a persistent multi-user environment that merges physical reality with digital virtuality based on the convergence of technologies that enable multi-sensory interactions with people, VR, and AR (Mystakidis, 2022). Among these technologies, AR offers possibilities to solve the problem of lacking public participation in the urban design process by emphasizing interaction and immersion. By introducing AR technology, a mobile virtual platform can be created to promote stakeholders’ collaboration by combining the public perception of design content in virtual worlds and the physical real world.
With a mobile virtual platform and the corresponding devices, design concepts from drafted urban designs or urban planning policies and guidelines which are not normally of concern to the public due to their incomprehension, especially abstract indicators related to morphological control of urban forms, can be converted into tangible elements with specific forms in a virtual world. These elements are superimposed precisely on a real urban environment by AR devices.
One advantage of the application of AR technology is immersion (Shin, 2019). With the AR devices provided by the design or research institutes or citizens’ own available equipment, users can get firsthand visual, auditory, or other kinds of experience of the integrated urban design results as they are placed in real on-site urban environments. The advantage of showcasing abstract urban design indicators by using micro-scale and human-scale models, with details such as the depth of ground-floor setback and the material of the building’s lower levels from an eye-level perspective instead of a large mass of buildings with few details from an aerial view, is that users’ perceptions of the designs are much closer to the perceptions of the final completed appearances after implementation of the urban design. The reason is that all the subtle factors in real urban environments, such as the sky, light, and the wind, which are normally ignored in traditional urban design processes, can now contribute to the design process. As a result, public feedback becomes a meaningful and essential part of the design process. In addition, the intuitive interface on the AR devices can in turn encourage public participation.
Another advantage of an AR application is its replaceability and repeatability. In terms of replaceability, AR platforms can provide a virtual world parallel to the real world. In the design process, with the assistance of such platforms, urban design strategies can be easily adjusted to comparatively optimal options via continuous trials without disturbing the real world. In terms of repeatability, AR allows the design to be evaluated by the public and iterated by designers and managers many times over before implementation, therefore greatly reducing the risks and possibilities of failure after construction. In addition, because many conflicts with public interests are solved at the beginning, and the interests of different stakeholders can be integrated and reflected more easily, the time, effort, and expense of modifying the designs during their implementation can be saved.
This article proposes an “input-evaluation-feedback” workflow to involve public participation in the urban design process by using a newly designed platform to evaluate the indicators in urban design guidelines. It provides a cognitive and experiential approach that couples the concept and form for the public, along with the perspective of urban designers to manage abstract urban design concepts. With this immersive experience, the public can easily understand the effects these indicators have on urban environment-shaping as urban designers do, and evaluate these indicators as users. Local cultural or climatic characteristics all also contribute to the users’ behaviors and preferences, making their feedback valuable in optimizing the existing designs.
The topic of this research has been discussed in previous studies regarding the related aspects of public participation in urban design, the potentials of augmented reality application, and augmented reality application in urban design.
The notions of viewing the process of urban design and urban planning have evolved greatly in recent decades. Urban design as a discipline can now be described not only as an interface but also as the “common ground” between a wide range of disciplines and activities (Carmona, 2021), such as geography and psychology. Aside from physical and aesthetic entities, urban design tends to focus more on behavioral settings such as so-called “soft cities”. The factors of humans and human behaviors are more emphasized during this process.
One of the reasons for this change is that people’s understanding of urban public space has changed dramatically (Schmidt and Németh, 2010). Some ideas discuss the relationship between urban public space and the public or individuals. Philosophers like Henri Lefebvre claim that space cannot be thought of only as a physical place or a neutral container, but also as an entity actively produced by society. Urban public space, as the specific physical production of the operation mechanism of a society, reflects how much and how diverse public demands can be respected. The behavior, knowledge, and disposition of citizens can also be shaped by the urban environment. Lynch (1960) demonstrated that people’s understanding and image of cities are realized through their observations of the city’s environmental form. By closely observing human behaviors, Jacobs (1961) emphasized the role of urban spaces as sites of human activity and places for social interaction. Therefore, it is important to consider how urban space is produced and experienced, and by whom. Habermas’s theories of communicative rationality in the public sphere argued that unmediated interaction is vital to promoting social justice (Calhoun, 1992), emphasizing the effect of communication reaching a consensus between public individuals with rational criticism on the generation of public space. To some extent, different from this notion that hypothesizes a homogeneous, universal ‘public’, other researchers have emphasized the approach of providing inclusive public space to support diverse public needs. Iris Young (1990) proposed creating universally inclusive spaces to promote social justice by encouraging social interaction between individuals with diverse interests and perspectives. Some researchers have argued that public space can only be meaningful when it becomes a place where each individual’s petitions can be heard (Ford, 2001). Overall, whether the urban public space is the result of or the means to support public rights, the generation of good public space needs to respect the public’s general opinions and each individual’s demands.
The necessity of involving public participants in urban design or urban planning is discussed in some previous research. Nasser (2003) pointed out that integrating land-use planning with local aspirations is vital to holistic community development. Loures and Crawford (2008) claimed that the foundation for sustainable practices in urban planning and management of the physical environment can be laid by public participation.
Additionally, Roy and Ganguly (2009) argued that the bottom-up urban design approach is more meaningful than a top-down approach because the communities involved intuitively understand what they actually need. Community participation helps residents establish a sense of belonging that can lead the community to maintaining the space. By contrast, the practices of space design or planning done by urban planners and landscape architects without community participation can result in many shortages including the incompatibility of space with the community, abandoning or underutilizing space, or even vandalizing the properties of the space (Ismail and Said 2015).
Furthermore, the community has the right to understand and participate in decision-making, particularly when it could potentially affect their living space or workplaces. Public participation in the planning process helps schedules to be widely accepted by future users (Brody et al., 2003; Burby, 2003; Miraftab, 2003). Also, unpopular decisions made by the government about discordant issues among different groups can be reduced by citizens’ involvement during the planning process (Wang, 2001). Creighton (2005) and Sanoff (2000) stated that the idea of public involvement builds stakeholder consensus in the government and advances administrative decision-making. According to Omar and Leh (2009), public participation is not only an alternative for better planning but also a requirement in local planning law.
Traditional urban planning and urban design method tends to control urban forms in an almost completely top-down way, making it difficult to integrate public opinions from the bottom up after the implementation. To avoid the criticisms of such traditional approaches and avoid the occurrence of such results, new urban design processes should consider more public feedback. Since the 1990s, studies have been conducted regarding the inclusion of multiple voices from the bottom-up in urban planning as an alternative to top-down planning, and have argued for multiple stakeholders’ participation through consensus-based dialogue (Healey, 2007; Innes & Booher, 2015). Planning based on communicative rationality has sought to introduce “intersubjective communication” (Healey, 1992). Batty and Marshall (2012) emphasized the importance of such communication be claiming that “planning practice has evolved as a form of negotiating, brokering, and facilitating”. Skrimizea et al. (2019) concluded such negotiation and communication can make urban planning more adaptive to solve the new challenges of complexity and uncertainty.
However, conventional forms of public participation in urban design, such as public hearings and community outreaches, are still limited regarding their popularity among citizens and the frequency of related activities owing to the involved time and energy costs. New tools, methods, or forms are now possible with the emergence of new ideas or technologies. Amado et al. (2010) discussed an innovative process of evaluation/validation to encourage public participation in sustainable urban planning, in particular concerning protected landscape areas. In some countries like Malaysia, current citizen participation is achieved via various mechanisms including not only conventional forms, like citizen advisory groups or individual citizen representation, but also forms based on new technology like the internet and e-mail (Ismail and Said 2015). Even so, innovative methods are still required to better integrate public participation into urban design. With recently emerging technologies such as augmented reality, greatly advancing public participation is now a possibility, not only in terms of the citizen’s willingness to participate but also in terms of the efficiency of the process.
The term “Augmented Reality (AR)” can be defined as technology that augments a users’ visual field with information necessary to perform a task (Thomas and David 1992). Different from the concept of Virtual Reality (VR) which creates a totally virtual environment to replace the real world, AR amplifies the real world with virtual information (Wang, 2009). To be specific, AR allows the integration of real objects with information from virtual objects (Azuma et al., 2001). Compared to VR technology, the application of AR emphasizes creating a more interactive user experience within the real world.
There are growing AR technologies applied to advancing public experiences for multiple purposes. Public experiences may include all kinds of interactions between an individual’s body and the provided platform. The forms of interactions may include public evaluation, public learning, or public navigation. The augmented information is not limited to the sense of vision, but is also possibly applied to the sense of touch and hearing (Azuma et al., 2001). Quintero et al. (2019) summarized all of the applications in educational inclusion which have taken advantage of AR technologies in the past few years. Bekele and Champion (2019) discussed the potential to enhance public cultural learning in Virtual Heritage (VH) applications including AR with a collaborative interaction interface and multi-modal interaction interface.
The applications of AR technologies to guide operations and transformations of the real world are also being increasingly conducted. Two AR systems developed by Webster et al. (1996) used a see-through head-worn display to provide visual information for constructing, inspecting, or renovating architectural structures. Park and Kim (2013) developed a system integrating AR, building information modeling (BIM), location tracking, and gaming technologies to improve the identification of field safety risks in construction practices and increase the risk recognition capacity of workers.
Additionally, mobile augmented reality (MAR) makes it possible to approach outdoor information tasks. The Tinmith-Metro MAR platform was developed to study how a building design could be visualized relative to its physical surroundings by providing users with a see-through optical head-mounted display for interaction with the environment (Thomas et al., 1999; Piekarski and Thomas, 2001). A MAR system, called Vident, was developed by Schall et al. (2009) to provide the virtualization of underground infrastructure for fieldwork. Oduor and Perälä (2021) explored how people could be encouraged to be actively mobile, such as via walking and cycling, through urban play which applied web-based AR to provide interactive experiences. MAR may have great potential to encourage public participation in urban design by increasing their experiences and providing more interaction.
Public participatory geographic information systems have been used to enhance public participation in the urban planning process in the past years. However, some evidence has shown its inefficiency due to the fact that the cost of learning associated with using this new system is much higher than the perceived benefit gained from participation (Krek, 2005). By contrast, as one of new information technologies, AR can overcome this weakness by providing visual information during public participation in urban design and suppressing the non-professional barrier (Hanzl, 2007). It is noteworthy that sometimes it is difficult to distinguish between the architectural level and the urban design level, so actually some studies at an architectural level can also provide ideas for the urban design research.
Recent research was undertaken to enhance the cooperation between implicated participants in urban planning or urban design. The application named Urban Sketcher was developed by Sareika and Schmalstieg (2007) to encourage communication between different stakeholders. It allowed designers inside an on-site tent to draw 2D images on the screen with the real-time scene transferred from a camera outside the tent. It has been verified that the AR technology is suitable for public participation; however, it still requires substantial professional equipment. A system designed by St-Aubin et al. (2010) integrated innovative geospatial AR with tools for 3D modeling and spatial analysis, aiming to facilitate collaborative decision-making in urban planning and urban design projects. Wang (2007) proposed an intelligent agent-based AR system, called the augmented reality-based Urban Designer, with a visualization and simulation framework. Urban designers were allowed to assess virtual designs in the real world to avoid errors and oversights of time and budget. Chen and Wang (2008) presented a Tangible Augmented Reality (TAR) system to improve the urban design pedagogical effectiveness of the collaborative learning process. Seichter (2007) gauged the differences between two AR interfaces regarding their impact on the design process, especially the communication structures, and suggested that, in order to maintain rather than restrict creativity during the design process, the interfaces needed to provide freedom while minimizing pre-programmed logic to the designer. Broschart et al. (2013) also tested the possibility of using AR as a communication tool in urban design. It was found that the perception of inhabitants was indeed assisted by this tool, but the process could be made more interesting by attractive and playful handling. Penn et al. (2004) claimed that augmenting the sense of a scene with simulations of pedestrian movement seemed to assist scale recognition, which might show the importance of other city elements aside from the design itself. Phan and Choo (2010) explored how to use AR in cooperation with Google Earth to enable users to manage and create inputted digital urban models. Lock et al. (2019) used Microsoft HoloLens to assess the performance of networks of different cities with open data sets, and argued that it helped to improve understanding of the data and reduce cognitive and visual load. This research also mentioned that the development requires further intelligent aggregation and styling.
Besides AR applications in interior spaces, such as design workshops, which simulate urban designs on boards or workbenches, mobile augmented reality (MAR) makes it possible to interact with the urban environment on-site, providing more opportunities for public participation. Research has been undertaken to develop outdoor AR urban planning or urban design systems. Allbach et al. (2011) focused on the benefits of AR and mobile geoweb applications to urban planning, citizens’ participation, and delivering meaningful data using smartphones. It showed that the applications offered lots of possibilities for communication between citizens and the government. Zheng (2019) discussed new possibilities of AR applications in new outdoor space designs, such as collecting public preferences and coloring the skins of buildings. Calabrese & Baresi (2017) exploited a new way to help design and simulate large urban spaces using AR, and suggested that the positioning of the virtual things on top of reality was ameliorated when users were able to look at significant portions of the environment and beacons. Schubert et al. (2015) explored how to combine volumetric models and hand-drawn sketches in the early design phases with the context of real sites, which provides a new way for the public to view architectural and urban designs. Imottesjo and Kain (2022) used the urban CoCreation Lab MVP, a desktop web-based 3D modeling platform, to build models which could be placed on real sites by users for observation, and which permitted multiple participants to work on the same model at the same time by frequently uploading the AR model to a cloud server. This study also suggested that the evaluation of the minimum level of detail in 3D modeling is necessary for environmental impact simulation. Allen et al. (2011) et al. developed a smart-phone prototype system using AR technology that allows the visualized architectural designs to be superimposed on top of existing architecture in the real world, and found that public willingness to participate in urban planning events with the use of this system was increased, even if there were some differences in the results regarding people of different ages. Saßmannshausen et al. (2021) developed a new AR application and engaged low-tech users by using haptic 3D-tools like Lego or clay before using the application, aiming to solve the problem of poor incentives in most participation processes in urban planning. With such an application, users could put new digital objects into real environments. They received positive feedback during users’ evaluation and suggested the integration of such tools into traditional urban planning formats, such as citizens’ meetings or walking tours through the city. Some research has examined the benefits of using MAR technologies to acquire urban design knowledge. Redondo Domínguez et al. (2017) proved that architectural students in a group using AR learned better and gained higher grades in their design course compared to those who did not use AR.
From these prior works, it can be seen that AR platforms that provide interactable operations for evaluating or optimizing urban design have mostly been implemented in interior spaces, which requires special devices and may have limitations for public participation regarding their convenience and the time and cost of skill training. Additionally, even though some outdoor on-site applications for urban design were conducted, they still required the augmentation of the degree of interaction and immersion when applied to large scenes in a real environment. Moreover, more concepts related to urban design need to be involved in the outdoor real-time experiences rather than the factors limited to individual buildings. Therefore, it is still worth exploring how to help the public understand abstract urban design concepts, how to improve generality and extendibility, and how to make processes more adaptive to public decision-making as feedback for design optimization.
Indicators are the abstract representatives for complex information that cannot be measured directly (Alibegovic and De Villa, 2006). Urban planning or urban design morphological indicators can help control the form of urban spaces. Therefore, acquainting the public with the knowledge of urban design indicators can encourage them to participate more in urban design guideline making and optimization before implementation.
The overall concept was to create a collaborative workflow based on the use of a mobile augmented reality (MAR) application. This virtual tool could be installed on mobile devices provided by the researchers or owned by the users. Guideline creation, the updating of components in the application, operation by the public, and feedback for future design optimization could all be integrated into this system. It aims to promote public engagement in the process of urban design by evaluating the morphological results of urban design guidelines. It can also help familiarize the public with urban design indicators by enabling them to experience specific and tangible urban design forms at their actual size.
After the platform was installed on mobile devices such as smartphones on-site, the public could view the scenes mixing the real urban environment, the digital models generated by the platform, and the information of each morphological indicator related to the current design. By modifying the value of each indicator, the users could observe the morphological changes of urban elements and evaluate whether they were satisfying.
Different urban design strategies are applicable in different urban environments because the surrounding environmental factors vary from place to place. As the evaluation can be conducted on-site, many unanticipated urban environmental factors (including environmental factors, such as the surrounding vegetation, buildings, and light; climatic factors, such as temperature and wind velocity; and cultural factors) can all contribute to the appearance of the design as well as local citizens’ preferences.
After the model is changed to the most satisfying according to each evaluation, the preference data of the indicator values can also be uploaded online with the users’ approval as feedback to provide guidance for the designers. As examination processes with virtual tools cost much less than implementing real urban designs, they can be conducted many times to continuously optimize the current urban design.
The virtual model embedded in the system can also be modified by the urban designer and organizers before the MAR application is generated. After the feedback from public evaluation or at the beginning of a new test, the models and indicators can be updated on the desktop environment. Additionally, more variables and interactive modes can be developed to provide more options. After these indicators have been adjusted to a relatively satisfying value based on many tests, they can be formulated into urban design policies or guidelines.
To sum up, the overall workflow consists of three parts: 1) platform updating; 2) public on-site evaluation; and 3) urban design guideline making. The general process of each test can be concluded as: 1) model modifications by designers according to specific sites and urban design guidelines specific sites and urban design guidelines; 2) on-site placement; 3) public evaluation; 4) optimization of urban design guidelines based on feedback; and 5) repetition of the above process. Figure 1 shows the complete process of public evaluation based on the AR platform.
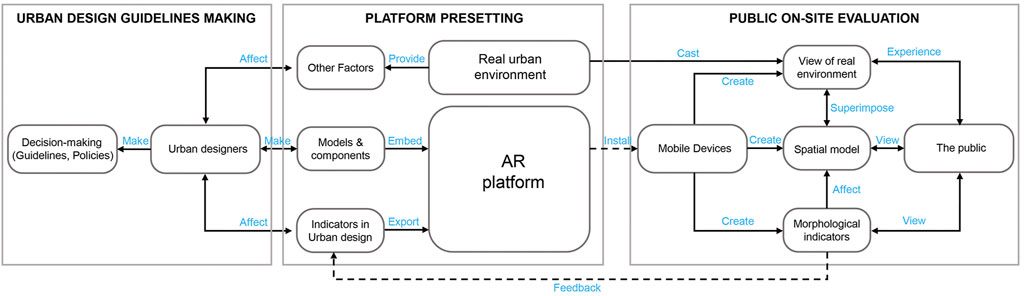
Figure 1. Workflow of public evaluation based on the AR platform.
Urban space can be seen as a complex collection of neighborhoods, parcels, streets, blocks, and buildings (Vanegas et al., 2009). It is difficult to model both the appearance and the behavior (transformation) of urban space because the underlying structure is determined by many variables that are hard to quantify (Vanegas et al., 2010). From urban master planning to zoning, every urban design indicator has a potential impact on the final morphological results. Ewing and Cervero (2010) proposed the concept of the “5 Ds” to measure the built environment, which are density, diversity, design, destination, and distance. After the digitized spatial model was introduced in urban design, the refinement of some concepts became strict. For example, the concept of urban density consists of land cover density, building density, and population density (Guan, 2018). In urban design, there is also a classification of controlling indicators, such as function matching or setback distance, and directional indicators, such as building materials and styles of facade.
The design of this platform mainly focuses on citizens’ perception of urban public space. Therefore, from the aspect of the morphological dimension (Carmona, 2021), factors that contribute to forms of perceptible micro-level elements, urban blocks, and streets, are important. To simplify the processes of the platform used by the public and easily create the linkages between indicators and models by the designers, several major spatial morphological indicators were picked that could be relatively and directly reflected by the generated forms and more associated with public walking experiences.
Research in fields such as architecture, landscape, and especially urban design, maintains that numerous perceptual qualities can affect walking quality (Handy, 1993; Ewing, 1996). Ewing et al. (2013) picked eight from a total of 51 perceptual qualities from literature reviews based on their importance. Five of them were operationalized to be measured, including imageability, enclosure, human scale, transparency, and complexity. After examining 48 commercial street models, 38 physical features were found to be significant to each of the five qualities. Above these features, we focused on proportion plazas, street walls, the proportion of the first floor with windows, building height, small planters, and some other qualities that reflect common urban design indicators. Finally, six main indicators based on these features were selected as the main parameters for this platform: FAR, CVG, height control, GR, porosity, and near-rate ratio. They can affect the spatial configuration of blocks and street sections, providing different perceptual experiences such as vision, touch, and walking experience to the public.
1) FAR refers to floor area ratio. This is the main measurement of building density and equals to area of the plot divided by gross floor area. It sets the ratio of the building mass to the size of the building lot and directly measures the intensity of land development. It is also a tool to control building volume in urban development. For example, the FARs of most commercial streets are set to around 3.5. Although FAR affects volume and shape, it does not determine a particular form but allows choices (Noble et al., 1993). Research has proved the correlation between walking comfort and urban density.
2) CVG is also known as building coverage ratio (BCR). It is the percentage of a site covered by buildings, equal to the ratio between the total base area of the buildings and the area of occupied land within a certain range. It can also reflect building density as well as the proportion of void space which were discussed to have correlation with public walking experience (Campoli, 2012).
3) Height control: is normally set in urban design in certain areas with special characteristics such as historical blocks, landscape areas, or areas with landmarks. It is crucial to conserve the features inside these areas (Tong and Ding, 2010). Guidelines in some regions may control the city skyline by regulating the height of new buildings to provide the best landscape view for the public, such as in waterfront areas.
4) GR is the greening rate. It is the proportion of green space in a certain range of urban space. Its specific definition and calculation methods vary from region to region but can be roughly estimated by the total ground green area and partial roof green area divided by the plot area. It is different from the green coverage rate (GCR) which is the ratio of vegetation’s vertical projected area, including the crown of trees, to a total urban area; GR is a more legal and mandatory indicator. The amount of greenery was also examined to have correlation with the quality of public space (Ye et al., 2019).
5) Transparency refers to the proportion of street opening areas on ground floors, such as doors, windows, and fences, to the total area of the street interface on ground floors. High porosity has been a concern and discussed in recent years as a key element of human-scale urban design quality by creating attractive walking environments and providing safety (Gehl et al., 2006; Ewing and Handy, 2009).
6) Near-line rate refers to the proportion of the total length of street walls for several buildings to the length of the block side (property line), and is determined by the continuity of street buildings and the setback degree of the ground floor of buildings. It is the evolution of the “Street Wall” in American urban planning proposed by architect William Atkinson (1912). Apart from research by Ewing et al. (2013), other research (Li et al., 2022) has also examined the correlation between street quality and near-line rate.
This AR platform was designed to be run on different types of devices. There were three design requirements that we aimed to fulfill in order to ensure a satisfactory experience for users.
1) It was easy for public users to get familiar with urban design indicators, enabling them to review current data and detailed information. Flexibility and simplicity in toggling the indicators and changing their values were also necessary to help create a continuous experience for users.
2) The model of designs could be positioned on the real site precisely. Additionally, they needed to be integrated into the real environment considering further real factors such as light and shadow to improve the sense of immersion.
3) The prefabricated model could be adjusted or replaced by designers easily for the next test.
To achieve these goals, we chose to use Unity software (version 2021.3.9f1) on Windows 11 to generate and develop this platform. The main framework we used in Unity was the new XR Tech Stack. The AR Foundation and XR Interaction Toolkit were loaded onto the XR subsystems as developer tools for AR object placing or tracking and interaction with models, respectively. The embedded Unity XR SDK allowed us to switch our developed platform into different provider implementations by adding the corresponding plugins, such as the Android system with the ARCore XR plugin, the IOS system with the ARkit XR plugin, Hololens with the Windows XR plugin, and Meta Quest with the Oculus XR plugin. We decided to operate and display our AR application on smartphones for the tests, which could be accessed by the public more easily at this current stage.
We created the “indicator-form” operation mode which meant controlling the urban design indicators to generate the corresponding form. This operation was different from most other AR platforms, which collect the indicator data from the models modified by users. The advantage of this reverse design method was to maximize the possibility of changing a single variable solely when the spatial form was changed. Therefore, the process was more straightforward for the public to understand and quickly established perceptual connections between indicators and forms. For example, it allowed users to change the “Height Control” indicator to increase the height of a building while narrowing its width automatically to stabilize the “FAR” indicator. Conversely, in the reverse approach, changing the “height” dimension of a building separately led to the increase of both the “Height Control” indicator and the “FAR” indicator, which could somehow mislead users.
To enable the continuity in modifying the model and indicators, a slider was created at the bottom of the screen. The maximum and minimum values at each side of the slider were set at the beginning as the permitted range of each indicator. The range could also be modified in the hidden “Rating” panel if users intended to try a value exceeding its range. The initial model generated at the beginning when placed was the prototype created based on the current value of each indicator. The current value was preset based on the drafted urban design guidelines for evaluation. It was generated depending on the draggable slider handle’s position inside the range. When the handle stopped moving, the value was changed, triggered the corresponding changes to the model, and was saved in the “Rating” panel. The calculation rules of each indicator were based on simplified formulas to avoid conflict in variable calls. Since there were multiple ways to allow the urban form to change in response to a change of an indicator, a “Switch” button near the slider was set to help change the result form based on the same indicator values. Users were allowed to review all the resultant values of each indicator on the Rating panel after clicking on the button. The image of the virtual model was superimposed onto the real environment, and users were encouraged to walk around to observe the design from different views, no matter the eye-level perspective or even from an aerial view. The “Rotate” button on a large gear in the bottom-right corner made it easy to switch the current indicators. By clicking the button of each indicator, users were provided with a detailed explanation of their concepts. Figure 2 shows the interface of the Rating panel on the screen of the smartphone during operation. Figure 3 demonstrates how users experienced the AR platform with smartphones on-site.
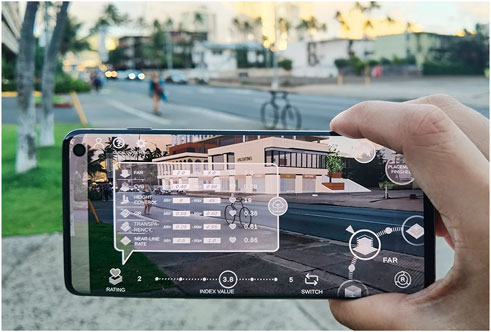
Figure 2. Interface of the rating panel. Created with Unity Personal version and AR Foundation package.
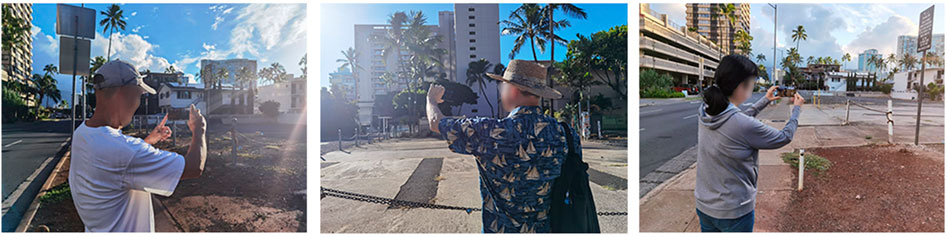
Figure 3. Experiencing the AR platform with smartphones on site.
In the pre-setting stage, the prefabricated segments of the model component could be adjusted or replaced in Unity software. Based on the site map, designers could adjust existing model parts or replace them with new models from the platform library. The creation of new models could be realized in third-party modeling software such as Sketchup, Rhino, and Revit, and the completed files could be imported into Unity, so the existing interaction was automatically relinked. The dimensions of the model superimposed onto the real world was exactly the same as that in modeling software provided the units were kept the same. If the interactions were intended to be achieved in more complicated ways, the connection between different variables needed to be modified accordingly. The code in Unity was created in the form of a script machine (visual programming), making it easier to be modified.
Realistic and detailed models could help increase the credibility (Grassi and Klein, 2016). To accurately render the outdoor AR at the real site and at an urban scale, it was necessary to track the position of digital objects on the real site. However, the localization of the object has been the most challenging task in previous research (Carozza et al., 2014). Two tracking methods were used in prior works to set the reference point for geometric registration: the geo-localized technique and the marker-based technique (Broschart and Hohl, 2015). The former uses the position of sensors (such as GPS or 3D sensors) to correspond to reference points (Fukuda et al., 2014), but a shortcoming is that sensing errors can significantly influence the error of the registration of the 3D object (Fukuda et al., 2017). The latter method uses the position of an artificial marker to correspond to reference points (Yabuki et al., 2011). For example, Saßmannshausen et al. (2021) used Vuforia SDK to overlay a new designed building on an existing building. But a limitation is that it relies on the installation and the capture of large markers in the real world, so the range of movability for the user is limited. (Fukuda et al., 2017). With the progress of AR technologies, marker-less AR systems that do not need sensors and artificial markers are being developed in some studies (Ventura and Hollerer, 2012; Schubert et al., 2015). For example, Miyake et al. (2016) developed a geometric registration method that matches point cloud data to natural features of the real world based on local feature image registration and Structure from Motion (SfM) technologies. However, these technologies that match live views to existing reconstructed buildings in the system have limitations such as position errors and dependence on features in the live view. Since our research required a stabler positioning of virtual models, mark-less tracking could be realized in the AR foundation developer tool which was integrated into the new XR subsystem. It provided the possibility of accurate placement of digital models on the site.
To fulfill the precise placement of virtual models, the AR Plane Manager components were attached to the XR Origin. The Unity XR SDK in the system provided the algorithms for fast tracking. After the platform was opened, the AR Plane Manager component was activated. The virtual ground plane defined by the point cloud was generated when the system had detected the surrounding physical ground in the real world. As users moved, more point clouds were created based on more physical grounds that were captured when entering the view of the camera of the device, and they generated more ground planes in the virtual world at the same time. As long as these plane segments were at the same height in the virtual world, they could connect with the adjacent parts to compose a larger complete plane. This mechanism allowed us to place objects not only along a complete surface plane, but also across surface planes at different heights. As the system did not need to keep tracking a fixed mark in real world, there was also little limitation on users’ movability. The scale and dimensions of the virtual world were the same as the real world, so the coordinates in the virtual world were anchored to the real world once the platform was opened, as long as the camera was not covered so the system kept perceiving the surrounding environment. Any movement of the camera in the real world triggered the corresponding changes of the view in the virtual world, which ensured the two views overlapped exactly at any time.
When the “Place” button on the interface of this platform was pressed, a cube named “Align”, which aligned the whole model, was created in front of users. It could be selected since an AR Selection Interactable component was attached to it. The whole model could then be interacted with by users’ fingers, such as being moved or rotated, driven by the “Align” cube as an original control point. In the prior pre-setting stage, the direction and position of the “Align” cube inside the whole model was adjusted to overlap exactly with the corner of the site model in Unity software. Therefore, in the onsite placing stage, after the “Align” cube was placed into the preset position of the site in the real world, all parts of the whole model were positioned successfully and automatically (Figure 4). After finishing the placement of the digital model, a “Finish Placement” button could be clicked to destroy the attached AR Selection Interactable component to stop the interaction with the digital model. A “Reset” button could be clicked to restart this placement process if another test was started. The model placement process could be completed by the researchers or assistants before the devices were handed over to the public users. The users could also download the application of this platform with their own devices. A “Guide” panel shown from the navigation bar could also be activated to help users complete this placement process. After that, the users were allowed to observe the integrated scenes on the screen of the device when moving around.
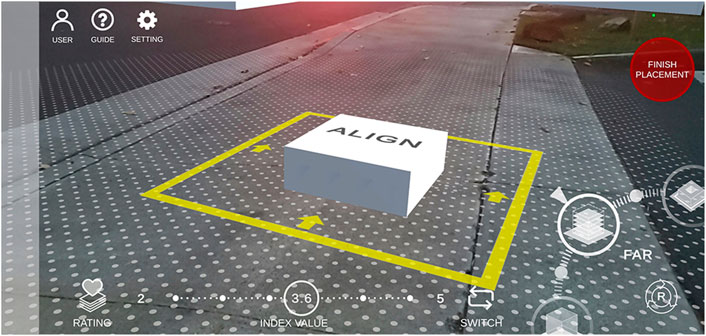
Figure 4. Virtual model placement on the site. Created with Unity Personal version and AR Foundation package.
Additionally, to promote immersion during the user’s experience, the component of AR Environment Probe Manager and scripts like HDR Light Estimation were added to the project so that the parameters of ambient light such as color temperature, intensity, and direction could simulate the detected real environment to affect the virtual model. In this way, the model could be perceived as more realistic in the real environment.
To provide feedback to designers and related guideline makers in the following steps, after reviewing the final generated value of each indicator on the Rating panel, users were encouraged to submit their preference data by clicking the “Submit” button. Other comments could also be typed in the “Input Field” as supplementary feedback. After receiving the data from users, some infographics such as radar charts could then be generated to help designers quickly understand local people’s preferences and review the current designs or design guidelines. Figure 5 shows an exemplary radar chart to illustrate feedback based on public preference data. All results were created using the mean value of each indicator. They were put into one chart by being set into a relative value inside the original range from 0 to 1.0.

Figure 5. Example of radar chart.
Evaluation of the users’ experience and their understanding of the concepts of indicators were the main parts of the workflow regarding public participation in urban design. In the user study, we evaluated the usability of this AR platform by allowing users to experience the platform on-site and provide feedback.
We conducted the study over several continuous days in Honolulu, Hawaii. To provide a better immersive experience, the designed model was a detailed building complex placed in one urban block instead of a higher volume of buildings across several blocks which may hide most of the background environment. An empty space on the corner of a street in a typical urban environment was selected as the site. Public participants were passers-by who were approached randomly. To reduce the stress on the participants, all operations and follow-up surveys were anonymous as participants’ personal information could not be recorded into the system. To simplify this process and make users focus on the main goal of this study, each individual was provided with an Android smartphone in which the platform application had been pre-installed. The preference data of the indicators were also not saved after each survey. The virtual model fitting the empty site was set into the platform and placed into the right position by the researchers before each operation.
The participants were asked to complete the initial questionnaire (Questionnaire A) before using the application. The questionnaire had six items and was embedded into the platform system on the smartphone, which enabled fast recognition of images and the simplicity of completion. Each item was a question about which urban design indicator could lead to the differences between the two urban forms shown in two images. The familiarity of urban design indicators was represented by the perception of visualized images instead of formulas because such memory is more usable and easier to recall when touching abstract indicators in the future. Figure 6 shows the contents of these items. Participants could respond verbally or by clicking the button of each answer based on their intuition or background knowledge. Their responses were recorded after completing the questionnaire.

Figure 6. Items on the questionnaire.
The participants were then told about a simulated urban design scenario that aimed to plan a commercial building complex on the site, which was explained by the researcher as a fake event for research purposes. Participants were also told that the site was just an example of applicable sites tested for the platform app. Participants could operate the application to view the scene with the designed models superimposed onto the surrounding urban environment on the smartphone’s screen. They were asked to drag the handle on the slider to change the forms of the model until they felt totally satisfied. Each indicator’s permitted range defaulted to a large value for more change options, which could be updated later. Meanwhile, the participants could switch the indicators by toggling the model controls.
Detailed information about how the urban forms were affected by the corresponding indicators were achieved through checking the information panel. Figure 7 illustrates how the virtual model in this assessment could be changed on the site by modifying the indicators. Participants were also allowed to walk around to view the scene from different perspectives. Figure 8 presents the views from other positions. Among these indicators, the changes of FAR, CVG, height control, and near-line rate could directly affect the shapes of the building complex (Figure 7A; Figure 7B; Figure 7C; Figure 7F; Figure 8A; Figure 8B; Figure 8C, and Figure 8F). For the GR, the changes to the model included changing the area of green space on the roof of buildings due to the site’s spatial limitations (Figure 7D; Figure 8D). For transparency, options for the first-floor street walls with different proportions of transparent materials were provided. The compositions of these street wall elements were abstracted from elevations of local commercial streets (Figure 7E; Figure 8E). Review of the rating panel was encouraged to see all the values that have already been set and their relationships with the generated urban form from an overall view. In the end, each participant finished the operational process by generating a final result with the model they found the most satisfying.

Figure 7. Changes in the designed models with the indicators’ modification. Created with Unity Personal version and AR Foundation package.
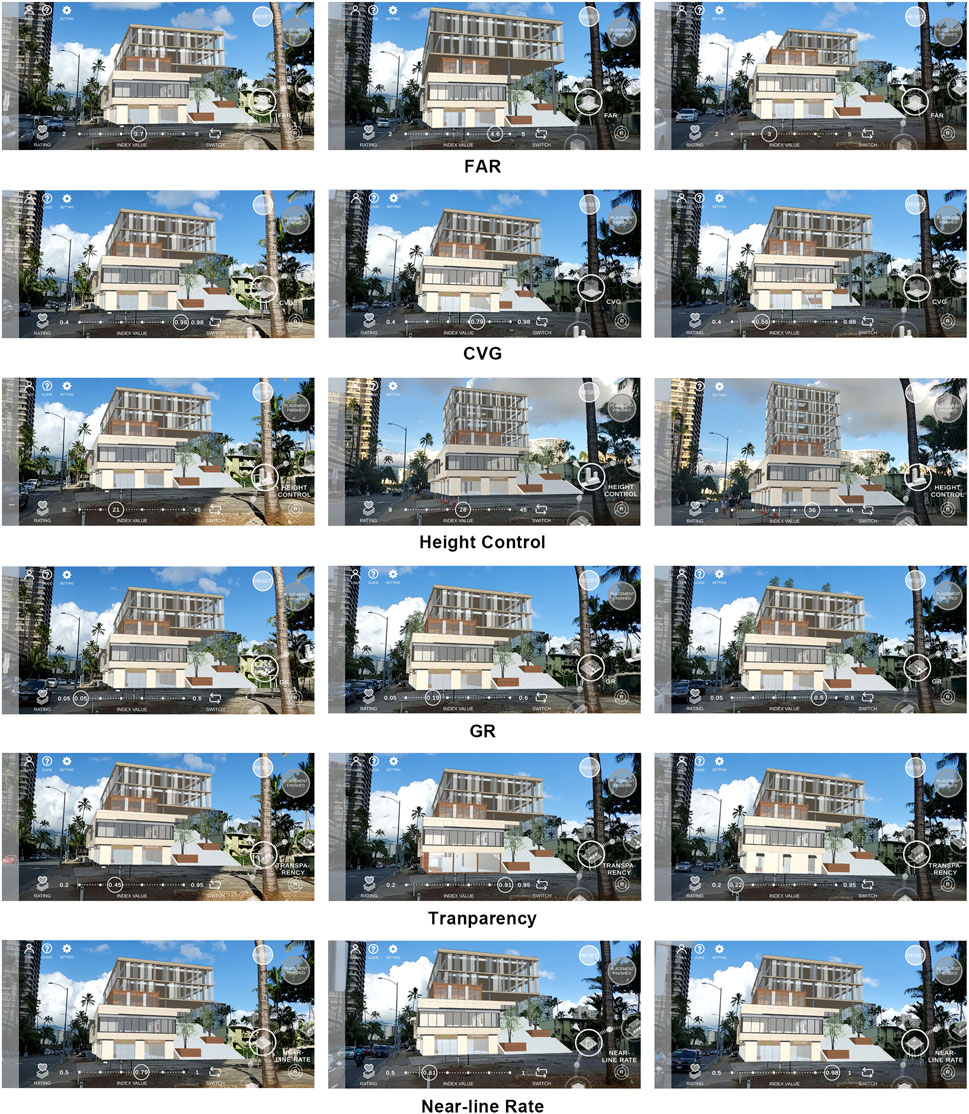
Figure 8. Views from another position. Created with Unity Personal version and AR Foundation package.
After that, Questionnaire A was provided again onscreen with the same items as previously. The participants were asked to answer the questions again based on their experience acquired during the operation. These answers were also recorded for comparison to the previous list. Upon completing the study, the participants were offered the correct item answers.
To collect feedback about the improvement of public familiarity with urban design indicators, we carried out a follow-up study to further explore the participants’ attitudes towards their experience after using the platform and their willingness to participant in urban design. The other factors were the same as the first investigation with the exception of the contents on the questionnaire. Participants were not asked to complete any questionnaire at the beginning, but to complete a new questionnaire (Questionnaire B) that was provided onscreen after they had finished the operational steps. The questionnaire contained 12 statements that are listed in Table 1. The series of statements were designed with Likert-type ratings from one to seven points, which represented strong disagreement to strong agreement. The content of the questionnaire involved three dimensions: 1) the feelings regarding using this platform (Q2, Q3, Q4, Q5, and Q6); 2) the feelings regarding evaluating urban design indicators with this platform (Q1, Q7, and Q8); and 3) the willingness to participate in urban design in the future (Q9, Q10, Q11, and Q12).
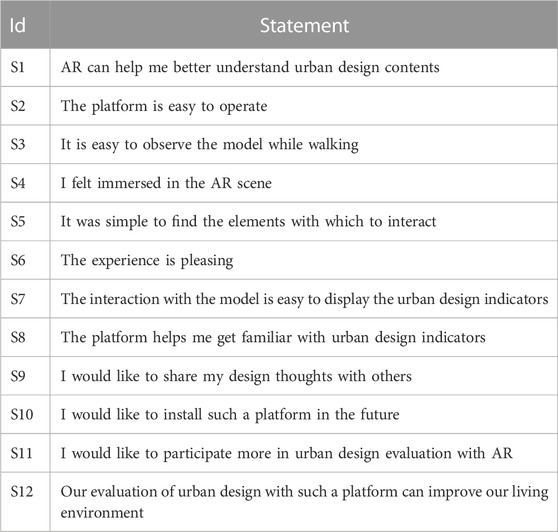
Table 1. The twelve statements on Questionnaire B.
For Questionnaire A, when an item of the questionnaire was finished by a participant, the corresponding score was recorded as “0” or “1” in the system based on the Boolean value (true/false) of the responding answer compared to the correct answer. After all items in both the initial and final questionnaires were finished by a participant, the recorded results were seen as valid. We collected 50 questionnaires with valid data submitted by participants. The sum of all the responding answers that were correct in one valid group were counted along with its corresponding user’s age group.
For the first investigation, among these users, 11 were aged 18–25, 12 were aged 26–60, and 27 were aged 61 or above. The results were divided into each age group of users as well as the group of participants as a whole. Since the variances in the results were not large (equal to 1.36 and 0.60, 2.27 and 0.57, 1.69 and 0.65, 1.80 and 0.91, corresponding to groups 18–25, 26–60, 61+, and the overall before and after the experience, respectively), both the mean and median values could be used to compare the users’ familiarity with urban design indicators before and after the experience. Table 2 shows the descriptive statistics of data before and after operation of the platform in each group and the overall situation.

Table 2. Descriptive statistics of correct answers in Questionnaire A results.
For the number of correct answers in overall situation before experience, the mean was 2.6 and the median was 2.5 which are relatively low, indicating the public general unfamiliarity of these urban design indicators. Combining the detailed data of each item on the questionnaire, it could be anticipated that the two questions about greening area and building height were relatively easy for users to respond to, since the explanation for each option was provided after each abbreviation of the indicator, and thus the correct answers could be recognized easily. For other items, correctly answering questions about the changes in urban forms depicted in diagrams was difficult, since users' familiarity with the concepts of most indicators was low. As a result, the questions were challenging and users could have chosen to submit random choices. This was consistent with our onsite observations. After operating the system, the data showed that the mean rose to 4.5 and median rose to 5.0, meaning there was an increase in familiarity with urban design indicators. Additionally, the data illustrated a more concentrated result. The decrease of the range (from 6.0 to 3.0), the interquartile range (from 2.3 to 1.0), and the SD (from 1.34 to 0.95) illustrated a more concentrated result after using this platform, which indicated users' common knowledge and familiarity gained from their new acquisitions by this experience.
As for the results of each group, the 18–25 group presented a relatively higher concentration of data before using the platform than other groups. Their performance after the experience showed an improvement of familiarity with a rise of the mean from 3.2 to 5.0 and median from 3.0 to 5.0, respectively. The 26–60 group demonstrated that the dispersion of data was large, with a range from 1.0 to 6.0 before experience. The data resulting from their experience showed that the number of correct answers was concentrated within a narrower range, from 4.0 to 6.0. The increase in the mean from 2.5 to 5.3 and in the median from 2.5 to 5.5 demonstrated that familiarity had the largest improvement for this group. The 61+ group also showed that the dispersion of data was large before use and more concentrated after use. The mean and median increased by 1.7 and 2.0, respectively. The relatively low maximum, mean, and median after use showed a limited improvement. This could imply that users under 61 were more familiar with mobile devices. It may also suggest there is potential to improve the accessibility of the platform interface for senior people. It could also be seen by the mean values that resulted in all groups increased from around 2 to 3. The significantly greater increase in the mean value (an increase of 2.8) among the 26–60 age group, compared to other groups, demonstrates that the platform was more effective at enhancing familiarity with the material for individuals in this age range.
For questionnaire B, when all statements were finished by a user, the recorded results were seen as valid. We collected 50 valid questionnaires. The reliability analysis of the questionnaire was run with these valid data (Table 3). The value of Cronbach’s alpha was calculated based on number of items, sum of the items’ variances, and variance of total scores, and was 0.858, showing that the data had high reliability and statistical significance.

Table 3. Reliability analysis of Questionnaire B results.
The descriptive statistics of the ratings are shown in Table 4. A rating of one meant “strongly disagree” and seven meant “strongly agree”. The higher the rating value, the stronger the users agreed with the statements. Since the variance was not large (from 1.51 to 2.35), the mean value could effectively reflect the users’ general opinions regarding these statements. In general, nearly all statements received a good rating, meaning most users supported them. Among these statements, S3 received the highest rating, indicating that users agreed the virtual model in the platform was easy to observe while walking. S10 received a relatively low rating, indicating that the users’ willingness to install this platform in the future was not so high; here, the users might be considering the necessity and safety of installing a new platform in their own devices, which also showed the importance of the attraction of the platform design. It is worth noting the range between maximum and minimum values of each statement was relatively high, indicating that not all people were attracted by using this platform, and thus could not be encouraged to participate in urban design.
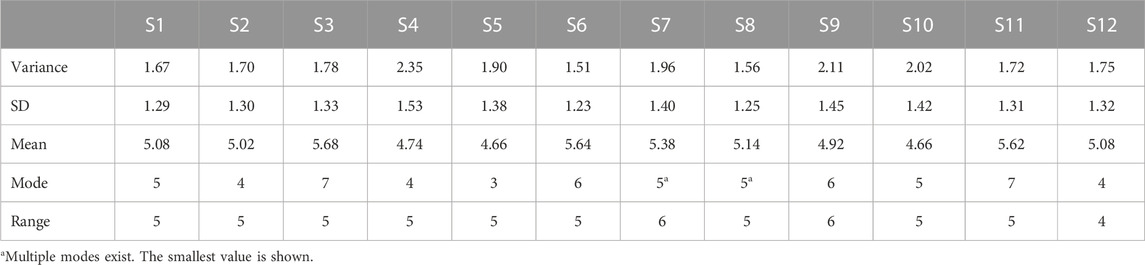
Table 4. Descriptive statistics of the ratings.
Correlation analysis was also run in the form of Pearson correlation analysis (Table 5). The correlation between S1 and S12 was one of the highest (r = 0.708), which implied that when a user believed AR technologies could help him or her better understand urban design contents, he or she tended to trust that, with their participation in urban design using such platform, their living environment could be improved. S12 also had high correlation with S8. Users may have been concerned that the different forms of buildings triggered by the indicators could have different impacts on their living environment, so with their collaboration, a more harmonious relationship could be established.
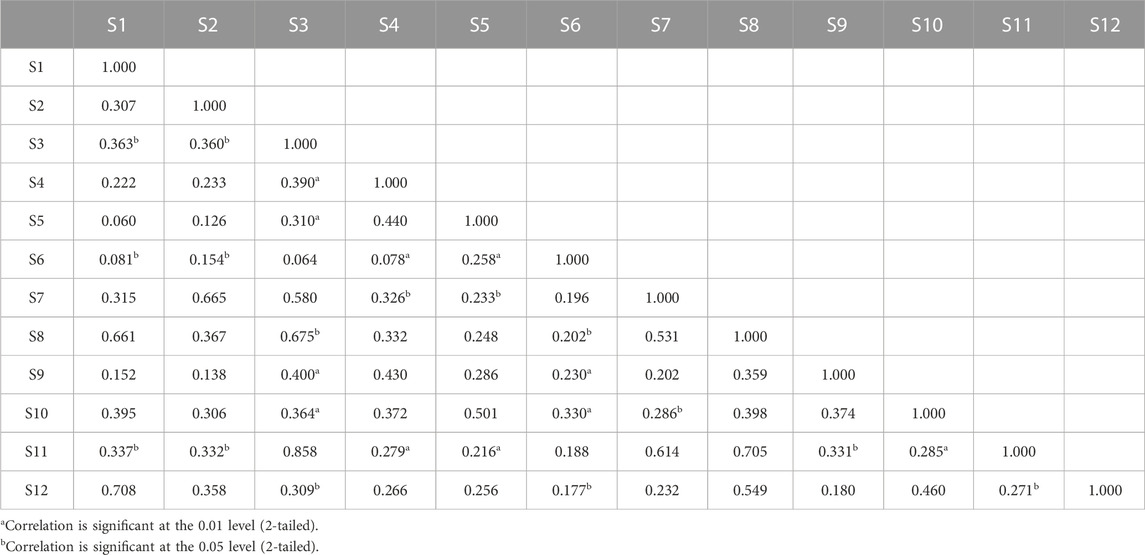
Table 5. Correlation matrix of the questionnaire results.
S2 was strongly correlated with S7 (r = 0.665), showing that the interaction with the model was easy in order to display the urban design indicators, made sense, and the platform was easy to operate. The correlation between S3 and S7 was also found to be positive (r = 0.580) implying that interaction with the model may have a mutual effect on the observing of the models.
S8 had strong correlation with S1 (r = 0.661) and S3 (r = 0.675, p < 0.05), indicating that the users became more familiar with the urban design indicators that could help them better understand urban design contents. Additionally, the ease of observation regarding the design could also have contributed to the improvement of such familiarity. The relatively high correlation between S5 and S10 (r = 0.501) showed that the simplicity of finding the elements to interact with may have helped enhance people’s willingness to install AR platforms, which may indicate the importance of the optimization of such a platform’s interface.
S11 explored the effect of using this platform on users’ willingness to participate in urban design in the future, which was the main goal this research aimed to achieve. It had a strong correlation with S3 (r = 0.858), S7 (r = 0.614), and S8 (0.705), reflecting that good design of the platform operations, including ensuring good observational capability, satisfying overall interaction, and the possibility to familiarize users with indicators, can help enhance users’ willingness to participate more in urban design evaluation.
Overall, the designed AR platform tool had a positive effect on promoting public participation in the process of urban design in the form of evaluating urban design indicators. Our smartphone AR platform was developed as a prototype to intuitively display urban design results by superimposing virtual designed content onto existing real urban environments and to allow the public to provide feedback by changing indicator values based on their personal preferences. The user study was conducted to examine and verify the effectiveness of enhancing the public’s familiarity with abstract urban design indicators with an AR platform operated on movable devices on-site. The result showed the possibility of popularizing the entire workflow of involving public participation in urban design guideline making.
This platform can be seen as a starting point and core part of the entire workflow. Some of its merits can be summarized as the following:
1) It was an attempt to visualize models with large scales in real environments and allowed for users to walk around them, which had seldom been covered in most previous research. It allowed for better interaction between the devices’ interface and the real world, introducing some unpredictable factors from the real environment that may have helped strengthen the authenticity of the background environment of the design. Additionally, effects on the digital models simulating the real environment, such as light and shadow, helped enhance the immersion of the experience. Furthermore, diversified forms of information of the same urban design concept could be accessed through clicking different buttons and opening different panels, which allowed for interaction in different ways. Moreover, the intuitive changes to the models driven by the changes of indicators made it easier for the public to understand the concepts of indicators. With these measures taken into this platform design, the public can give more accurate evaluation of the generated urban form results, which leads to the feedback more accurate, and consequently results in the implementation of urban design closer to the public original intention. Thus, these design ideas can take much less time of testing whether the project can successfully meet public desire than traditional urban design methods, although other factors such as follow-up architectural design can lead to some differences. Skips the examination of urban design by the public after its implementation, which can take several years, although other factors such as follow-up architectural design can lead to some differences.
2) Unity Software and its developer tool enabled modification of the contents of the prefabricated models, which allowed researchers and designers to test multiple rounds with continuous feedback from the public. Also, the XR system allows for the possibility of cross-platform application of this AR platform, which provides more choices of device for the public and thus increases the convenience, frequency, and interest of their participation.
However, there are still some limitations to this platform and the related research, which can be summarized as follows and should be optimized in the future:
1) The variables in this platform for controlling the changes of the model are specially designed to avoid conflicts while changing their values, such as narrowing the width of the building volume while increasing its height in order to maintain FAR. However, the platform cannot guarantee that when more indicators are involved, the same conflicts can still be avoided successfully. Additionally, too much response regarding the model’s different dimensions can weaken the intuitive effect and make it difficult for users to establish the connection between a single indicator and its visualized result.
2) Some AR technologies are still not well implemented into such large-scale applications regarding both software and terminal device factors. In our on-site test, AR Occlusion Manager loaded to the project could not work well on smartphones when the distance between the device and the target model became larger, which had a negative impact on the immersion of the experience. This may be because the device failed to support the long-distance ray cast that meant the model inside the system could not be built accurately. Thus, the shading connection could not be established between foreground objects and the backgrounded models successfully, which led to the invisibility of the back models even when they were not shaded. Kikuchi et al. (2022) discussed the limitation of the depth information that a 3D sensing camera can obtain, and developed a new method to realize the accurate occlusion from an aerial view by using a remote internet-based server PC to assist an AR-drone system. In their pre-processing step, the server used a 3D city model to create a 3D virtual model with occlusion and set up a navigational route to synchronize the views for the onsite AR display. Even though this method has some limitations regarding the goals of our test, such as requiring a real-time connection with an online server and fixed route, it could provide ideas for future studies together with the technical advancement of development tools and terminal devices.
3) Another factor that can weaken the immersion is when too many large-scale virtual models occupy the screen. In our study, we tried to avoid this tricky problem by selecting the site near a street corner, but this may not be avoidable in other onsite applications, especially when users have to stand close to the models. For future work to optimize the application, as Haahr (2017) and Korhonen et al. (2017) have claimed, the balance between the virtual and the physical world should also be addressed.
4) Attempting to involve the public to continuously use the platform in different environments may also be difficult. In our study, due to the hospitality of local people, it was relatively easy to get responses from them. Despite this, the workflow and the platform still need to be improved to be adaptive in other places. Additionally, it needs to consider how to attract users to make real choices since they already know it is a simulation of a fake urban design event. The UI needs to be more user-friendly to help reduce the public’s rational ignorance towards participating in urban planning projects (Krek, 2005), especially for old people. In our user study, a few passers-by who were not participating in the operation were also curious about what the research was. However, a few participants commented that the process was a little complicated to use. This suggests the possibility to switch the interfaces based on users’ ages or other characteristics via diversified designs. Furthermore, the means to attract users to make real choices, since they already know it is a simulation of a fake urban design event, need to be considered.
5) The space for walking around in the real world to view a model may have limitations due to safety or accessibility, suggesting observation-related route planning or site planning can be collaboratively designed.
6) The modeling of the background site of the design in modeling software requires a manual depiction of the map obtained online with the correct scale. This process ensures the relative accuracy of the model position but can be optimized to make the workflow smoother. In future research, collaborative modelling methods (Moeslund et al., 2004; St-Aubin et al., 2010) could be introduced in the workflow to generate the model of a city in Unity software automatically. Additionally, the replacement of models still requires some programming skills for urban designers, especially when the methods of interaction between the indicators and the models need to be changed. This requires urban planners, urban designers, and architects to spend more time acquiring the skills of scripting, although the scripts of this designed platform have been presented in the form of visual script machines. If some other built-in plugins can be designed and embedded in this platform, it can be anticipated that any updating work will become more effortless and efficient.
This research focuses on how to encourage the public to participate in urban design guideline making. It presents the whole workflow and discusses the improvements to public evaluation of urban design indicators by using a new platform. The user study verified the possibilities to enhance public familiarity with urban design indicators and the effectiveness to promote public willingness to participate in urban design evaluation by using such platforms. Considering the positive feedback gathered from the research, future work could be focused mainly on: 1) adding more methods of interactions between more indicators and the models; and 2) optimizing the operation interface to make it more attractive. Additionally, more information from the public, such as community information and groups who need special care, could also be collected to provide feedback. Furthermore, the design work could be extended from the platform itself to the whole workflow to realize an entire closed loop of public collaborative design.
The raw data supporting the conclusions of this article will be made available by the authors, without undue reservation.
YL and YW contributed to the conception, framework and design of the study. YL completed the indicator selection. YW performed the platform development and urban design models making. All authors attended the user study and data analysis. YW wrote the first draft of the manuscript and YL wrote sections of the manuscript. All authors contributed to manuscript revision, polishing, reading, and approved the submitted version.
The authors declare that the research was conducted in the absence of any commercial or financial relationships that could be construed as a potential conflict of interest.
All claims expressed in this article are solely those of the authors and do not necessarily represent those of their affiliated organizations, or those of the publisher, the editors and the reviewers. Any product that may be evaluated in this article, or claim that may be made by its manufacturer, is not guaranteed or endorsed by the publisher.
Alibegovic, D. J., and De Villa, Z. K. (2006). The challenge of building proper urban indicator system: A proposal for Croatian cities.
Allbach, B., Memmel, M., Zeile, P., and Streich, B. (2011). Mobile Augmented City–New Methods for urban analysis and urban design processes by using mobile augmented reality services. na.
Allen, M., Regenbrecht, H., and Abbott, M. (2011). “Smart-phone augmented reality for public participation in urban planning,” in Proceedings of the 23rd Australian computer-human interaction conference, 11–20. doi:10.1145/2071536.2071538
Amado, M. P., Santos, C. V., Moura, E. B., and Silva, V. G. (2010). Public participation in sustainable urban planning. Int. J. Hum. Soc. Sci. 5 (2), 102–108. doi:10.5281/zenodo.1085046
Azuma, R., Baillot, Y., Behringer, R., Feiner, S., Julier, S., and MacIntyre, B. (2001). Recent advances in augmented reality. IEEE Comput. Graph. Appl. 21 (6), 34–47. doi:10.1109/38.963459
Batty, M. (2009). Cities as complex systems: Scaling, interaction, networks, dynamics and urban morphologies. doi:10.1007/978-0-387-30440-3_69
Batty, M., and Marshall, S. (2012). “The origins of complexity theory in cities and planning,” in Complexity theories of cities have come of age (Berlin, Heidelberg: Springer), 21–45. doi:10.1007/978-3-642-24544-2_3
Bekele, M. K., and Champion, E. (2019). A comparison of immersive realities and interaction methods: Cultural learning in virtual heritage. Front. Robotics AI 6, 91. doi:10.3389/frobt.2019.00091
Brody, S. D., Godschalk, D. R., and Burby, R. J. (2003). Mandating citizen participation in plan making: Six strategic planning choices. J. Am. Plan. Assoc. 69 (3), 245–264. doi:10.1080/01944360308978018
Broschart, D., and Höhl, W. (2015). Augmented Reality in Architektur und Stadtplanung. GIS Science-Die Z. für Geoinformatik 1 (1). doi:10.5282/ubm/epub.35802
Broschart, D., Zeile, P., and Streich, B. (2013). “Augmented reality as a communication tool in urban design processes,” in Proceedings REAL CORP, 119–126.
Burby, R. J. (2003). Making plans that matter: Citizen involvement and government action. J. Am. Plan. Assoc. 69 (1), 33–49. doi:10.1080/01944360308976292
Calabrese, C., and Baresi, L. (2017). “Outdoor augmented reality for urban design and simulation,” in Urban design and representation (Cham: Springer), 181–190.
Carmona, M. (2021). Public places urban spaces: The dimensions of urban design. New York, NY, United States: Routledge. doi:10.4324/9781315158457
Carozza, L., Tingdahl, D., Bosché, F., and Van Gool, L. (2014). Markerless vision-based augmented reality for urban planning. Computer-Aided Civ. Infrastructure Eng. 29 (1), 2–17. doi:10.1111/j.1467-8667.2012.00798.x
Chen, R., and Wang, X. (2008). An empirical study on tangible augmented reality learning space for design skill transfer. Tsinghua Sci. Technol. 13 (S1), 13–18. doi:10.1016/S1007-0214(08)70120-2
Creighton, J. L. (2005). The public participation handbook: Making better decisions through citizen involvement. John Wiley & Sons.
Dias, N., Keraminiyage, K., Amaratunga, D., and Curwell, S. (2018). Critical success factors of a bottom up urban design process to deliver sustainable urban designs. Int. J. Strategic Prop. Manag. 22 (4), 265–277. doi:10.3846/ijspm.2018.3683
Ewing, R., and Cervero, R. (2010). Travel and the built environment: A meta-analysis. J. Am. Plan. Assoc. 76 (3), 265–294. doi:10.1080/01944361003766766
Ewing, R., Clemente, O., Neckerman, K. M., Purciel-Hill, M., Quinn, J. W., and Rundle, A. (2013). Measuring urban design: Metrics for livable places, 200. Washington, DC: Island Press.
Ewing, R., and Handy, S. (2009). Measuring the unmeasurable: Urban design qualities related to walkability. J. Urban Des. 14 (1), 65–84. doi:10.1080/13574800802451155
Farshid, M., Paschen, J., Eriksson, T., and Kietzmann, J. (2018). Go boldly!: Explore augmented reality (AR), virtual reality (VR), and mixed reality (MR) for business. Bus. Horizons 61 (5), 657–663. doi:10.1016/j.bushor.2018.05.009
Ford, R. T. (2001). in Legal geographies reader. Editors N. Blomley, and D. Delaney (Oxford: Blackwell), 118.
Fukuda, T., Nada, H., Adachi, H., Shimizu, S., Takei, C., Sato, Y., et al. (2017). “Integration of a structure from motion into virtual and augmented reality for architectural and urban simulation,” in International conference on computer-aided architectural design futures (Singapore: Springer), 60–77. doi:10.1007/978-981-10-5197-5_4
Fukuda, T., Zhang, T., and Yabuki, N. (2014). Improvement of registration accuracy of a handheld augmented reality system for urban landscape simulation. Front. Archit. Res. 3 (4), 386–397. doi:10.1016/j.foar.2014.08.003
Gehl, J., Kaefer, L. J., and Reigstad, S. (2006). Close encounters with buildings. Urban Des. Int. 11 (1), 29–47. doi:10.1057/PALGRAVE.UDI.9000162
Grassi, S., and Klein, T. M. (2016). “3D augmented reality for improving social acceptance and public participation in wind farms planning,” in Journal of physics: Conference series (Hamburg, Germany: IOP Publishing), 749, 012020. doi:10.1088/1742-6596/749/1/012020
Guan, C. (2018). Urban form and digitalization of urban design. Urban Plan. Int. 33, 22–27. doi:10.22217/upi.2017.540
Haahr, M. (2017). “Creating location-based augmented-reality games for cultural heritage,” in Joint international conference on serious games (Cham: Springer), 313–318. doi:10.1007/978-3-319-70111-0_29
Hanzl, M. (2007). Information technology as a tool for public participation in urban planning: A review of experiments and potentials. Des. Stud. 28 (3), 289–307. doi:10.1016/j.destud.2007.02.003
Healey, P. (1992). Planning through debate: The communicative turn in planning theory. Town Plan. Rev. 63, 143–162. doi:10.3828/tpr.63.2.422x602303814821
Healey, P. (2007). Urban complexity and spatial strategies: Towards a relational planning for our times. 1st ed. London New York: Routledge.
ICLEI (2016). “Resilient cities report 2016,” in Global developments in urban adaptation and resilience, proceedings of the 7th global forum on urban resilience and adaptation (Bonn, GermanyBonn, Germany: ICLEI). 6–8 July 2016.
Imottesjo, H., and Kain, J. H. (2022). The urban CoCreation lab—an integrated platform for remote and simultaneous collaborative urban planning and design through web-based desktop 3D modeling, head-mounted virtual reality and mobile augmented reality: Prototyping a minimum viable product and developing specifications for a minimum marketable product. Appl. Sci. 12 (2), 797. doi:10.3390/app12020797
Innes, J. E., and Booher, D. E. (2015). A turning point for planning theory? Overcoming dividing discourses. Plan. theory 14 (2), 195–213. doi:10.1177/1473095213519356
Ismail, W. A. W., and Said, I. (2015). Integrating the community in urban design and planning of public spaces: A review in Malaysian cities. Procedia-Social Behav. Sci. 168, 357–364. doi:10.1016/j.sbspro.2014.10.241
Kikuchi, N., Fukuda, T., and Yabuki, N. (2022). Future landscape visualization using a city digital twin: Integration of augmented reality and drones with implementation of 3D model-based occlusion handling. J. Comput. Des. Eng. 9 (2), 837–856. doi:10.1093/jcde/qwac032
Korhonen, O., Oduor, M., and Isomursu, M. (2017). “Personalizing Narratives to Support Motivation for Physical Activity,” in Proceedings of the 30th Bled EConference: Digital Transformation: From Connecting Things to Transforming Our Lives. doi:10.18690/978-961-286-043-1.24
Krek, A. (2005). “Rational ignorance of the citizens in public participatory planning,” in 10th symposium on Information-and communication technologies (ICT) in urban planning and spatial development and impacts of ICT on physical space (Vienna, Austria: CORP), 5, 420.
Li, S., Ma, S., Tong, D., Jia, Z., Li, P., and Long, Y. (2022). Associations between the quality of street space and the attributes of the built environment using large volumes of street view pictures. Environ. Plan. B Urban Anal. City Sci. 49 (4), 1197–1211. doi:10.1177/23998083211056341
Lock, O., Bednarz, T., and Pettit, C. (2019). “HoloCity–exploring the use of augmented reality cityscapes for collaborative understanding of high-volume urban sensor data,” in The 17th international conference on virtual-reality Continuum and its Applications in industry, 1–2. doi:10.1145/3359997.3365734
Loures, L., and Crawford, P. (2008). Democracy in progress: Using public participation in post-industrial landscape (re)-development. WSEAS Trans. Environ. Dev. 4 (9), 794–803.
Miraftab, F. (2003). The perils of participatory discourse: Housing policy in postapartheid South Africa. J. Plan. Educ. Res. 22 (3), 226–239. doi:10.1177/0739456x02250305
Miyake, M., Fukuda, T., Yabuki, N., Motamedi, A., and Michikawa, T. (2016). “Outdoor augmented reality using optical see-through HMD system for visualizing building information,” in 16th international conference on computing in civil and building engineering, 1644–1651.
Moeslund, T. B., Störring, M., Liu, Y., Broll, W., Lindt, I., Yuan, C., et al. (2004). “Towards natural, intuitive and non-intrusive hci devices for roundtable meetings,” in Workshop on multi-user and ubiquitous user interfaces 2004 (Saarbrücken, Germany: MU3I), 25.
Nasser, N. (2003). Planning for urban heritage places: Reconciling conservation, tourism, and sustainable development. J. Plan. literature 17 (4), 467–479. doi:10.1177/0885412203017004001
Noble, M. A., Noble, A. G., and Costa, F. J. (1993). Floor area ratio as an urban development tool: The case of West Palm Beach. Land Use Policy 10 (2), 127–139. doi:10.1016/0264-8377(93)90004-t
Oduor, M., and Perälä, T. (2021). Interactive urban play to encourage active mobility: Usability study of a web-based augmented reality application. Front. Comput. Sci. 67. doi:10.3389/fcomp.2021.706162
Omar, D., and Leh, O. L. H. (2009). Malaysian development planning system: Kuala Lumpur structure plan and public participation. Asian Soc. Sci. 5 (3), 30–36. doi:10.5539/ass.v5n3p30
Park, C. S., and Kim, H. J. (2013). A framework for construction safety management and visualization system. Automation Constr. 33, 95–103. doi:10.1016/j.autcon.2012.09.012
Penn, A., Mottram, C., Wittkämper, M., Störring, M., Romell, O., Strothmann, A., et al. (2004). “Augmented reality meeting table: A novel multi-user interface for architectural design,” in Recent advances in design and decision support systems in architecture and urban planning (Dordrecht: Springer), 213–231. doi:10.1007/1-4020-2409-6_14
Phan, V. T., and Choo, S. Y. (2010). A Combination of Augmented Reality and Google Earth’s facilities for urban planning in idea stage. Int. J. Comput. Appl. 4 (3), 35–42. doi:10.5120/809-1149
Piekarski, W., and Thomas, B. H. (2001). “Tinmith-metro: New outdoor techniques for creating city models with an augmented reality wearable computer,” in Proceedings fifth international symposium on wearable computers (IEEE), 31–38.
Quintero, J., Baldiris, S., Rubira, R., Cerón, J., and Velez, G. (2019). Augmented reality in educational inclusion. A systematic review on the last decade. Front. Psychol. 10, 1835. doi:10.3389/fpsyg.2019.01835
Redondo Domínguez, E., Fonseca Escudero, D., Sánchez Riera, A., and Navarro Delgado, I. (2017). Educating urban designers using augmented reality and mobile learning technologies/formación de Urbanistas usando realidad aumentada y tecnologías de Aprendizaje móvil. Rev. Iberoam. Educ. distancia 20 (2), 141–165. doi:10.5944/ried.20.2.17675
Roy, U., and Ganguly, M. (2009). “Integration of top down & bottom up approach in urban and regional planning: West Bengal experience of draft development plans (DDP) and beyond,” in 57th national town and country planners congress.
Sareika, M., and Schmalstieg, D. (2007). “Urban sketcher: Mixed reality on site for urban planning and architecture,” in 2007 6th IEEE and ACM international symposium on mixed and augmented reality (IEEE), 27–30.
Saßmannshausen, S. M., Radtke, J., Bohn, N., Hussein, H., Randall, D., and Pipek, V. (2021). “Citizen-centered design in urban planning: How augmented reality can be used in citizen participation processes,” in Designing interactive systems conference 2021, 250–265.
Schall, G., Mendez, E., Kruijff, E., Veas, E., Junghanns, S., Reitinger, B., et al. (2009). Handheld augmented reality for underground infrastructure visualization. Personal ubiquitous Comput. 13 (4), 281–291. doi:10.1007/s00779-008-0204-5
Schmidt, S., and Németh, J. (2010). Space, place and the city: Emerging research on public space design and planning. J. Urban Des. 15 (4), 453–457. doi:10.1080/13574809.2010.502331
Schubert, G., Schattel, D., Tönnis, M., Klinker, G., and Petzold, F. (2015). “Tangible mixed reality on-site: Interactive augmented visualisations from architectural working models in urban design,” in International conference on computer-aided architectural design futures (Berlin, Heidelberg: Springer), 55–74. doi:10.1007/978-3-662-47386-3_4
Seichter, H. (2007). “Augmented reality and tangible interfaces in collaborative urban design,” in Computer-aided architectural design futures (CAADFutures) 2007 (Dordrecht: Springer), 3–16. doi:10.1007/978-1-4020-6528-6_1
Semeraro, T., Zaccarelli, N., Lara, A., Sergi Cucinelli, F., and Aretano, R. (2020). A bottom-up and top-down participatory approach to planning and designing local urban development: Evidence from an urban University center. Land 9 (4), 98. doi:10.3390/land9040098
Shin, D. (2019). How does immersion work in augmented reality games? A user-centric view of immersion and engagement. Inf. Commun. Soc. 22 (9), 1212–1229. doi:10.1080/1369118X.2017.1411519
Skrimizea, E., Haniotou, H., and Parra, C. (2019). On the ‘complexity turn’ in planning: An adaptive rationale to navigate spaces and times of uncertainty. Planning Theory 18 (1), 122–142. doi:10.1177/1473095218780515
St-Aubin, B., Mostafavi, M., Roche, S., and Dedual, N. (2010). “A 3d collaborative geospatial augmented reality system for urban design and planning purposes,” in Proceedings of the Canadian geomatics conference (Calgary, AB: Canada), 13–15.
Thomas, B., Piekarski, W., and Gunther, B. (1999). “Using augmented reality to visualise architecture designs in an outdoor environment,” in International journal of design computing special issue on design computing on the net (DCNet), 1.42
Thomas, P. C., and David, W. M. (1992). “Augmented reality: An application of heads-up display technology to manual manufacturing processes,” in Hawaii international conference on system sciences (New York, NY, USA: ACM SIGCHI Bulletin), Vol. 2. doi:10.1109/HICSS.1992.183317
Tong, Z., and Ding, W. (2010). “Sightline-based GIS model for building height control,” in 2010 18th international conference on geoinformatics (IEEE), 1–5.
Vanegas, C. A., Aliaga, D. G., Benes, B., and Waddell, P. (2009). Visualization of simulated urban spaces: Inferring parameterized generation of streets, parcels, and aerial imagery. IEEE Trans. Vis. Comput. Graph. 15 (3), 424–435. doi:10.1109/TVCG.2008.193
Vanegas, C. A., Aliaga, D. G., Wonka, P., Müller, P., Waddell, P., and Watson, B. (2010). “Modelling the appearance and behaviour of urban spaces,” in Computer graphics forum (Oxford, UK: Blackwell Publishing Ltd), 29, 25–42. doi:10.1111/j.1467-8659.2009.01535.x
Ventura, J., and Höllerer, T. (2012). “Wide-area scene mapping for mobile visual tracking,” in In 2012 IEEE international symposium on mixed and augmented reality (ISMAR) (IEEE), 3–12. doi:10.1109/ISMAR.2012.6402531
Wang, X. (2007). Agent-based augmented reality system for urban design: Framework and experimentation.
Wang, X. (2001). Assessing public participation in US cities. Public Perform. Manag. Rev. 24 (4), 322–336. doi:10.2307/3381222
Wang, X. (2009). Augmented reality in architecture and design: Potentials and challenges for application. Int. J. Archit. Comput. 7 (2), 309–326. doi:10.1260/147807709788921985
Webster, A., Feiner, S., MacIntyre, B., Massie, W., and Krueger, T. (1996). “Augmented reality in architectural construction, inspection and renovation,” in Proc. ASCE third congress on computing in civil engineering, 1, 996.
Yabuki, N., Miyashita, K., and Fukuda, T. (2011). An invisible height evaluation system for building height regulation to preserve good landscapes using augmented reality. Automation Constr. 20 (3), 228–235. doi:10.1016/j.autcon.2010.08.003
Ye, Y., Zeng, W., Shen, Q., Zhang, X., and Lu, Y. (2019). The visual quality of streets: A human-centred continuous measurement based on machine learning algorithms and street view images. Environ. Plan. B Urban Anal. City Sci. 46 (8), 1439–1457. doi:10.1177/2399808319828734
Keywords: urban design, mobile augmented reality, public participation and evaluation, urban design indicator, interactive operation
Citation: Wang Y and Lin Y-S (2023) Public participation in urban design with augmented reality technology based on indicator evaluation. Front. Virtual Real. 4:1071355. doi: 10.3389/frvir.2023.1071355
Received: 16 October 2022; Accepted: 31 January 2023;
Published: 06 April 2023.
Edited by:
Marc Aurel Schnabel, Victoria University of Wellington, New ZealandReviewed by:
Tomohiro Fukuda, Osaka University, JapanCopyright © 2023 Wang and Lin. This is an open-access article distributed under the terms of the Creative Commons Attribution License (CC BY). The use, distribution or reproduction in other forums is permitted, provided the original author(s) and the copyright owner(s) are credited and that the original publication in this journal is cited, in accordance with accepted academic practice. No use, distribution or reproduction is permitted which does not comply with these terms.
*Correspondence: Yin-Shan Lin, bGlsaWFubGluMDAzQDE2My5jb20=
Disclaimer: All claims expressed in this article are solely those of the authors and do not necessarily represent those of their affiliated organizations, or those of the publisher, the editors and the reviewers. Any product that may be evaluated in this article or claim that may be made by its manufacturer is not guaranteed or endorsed by the publisher.
Research integrity at Frontiers
Learn more about the work of our research integrity team to safeguard the quality of each article we publish.