 Samory Houzangbe1,2*
 Dimitri Masson2
 Sylvain Fleury1
 David Antonio Gómez Jáuregui2
 Jeremy Legardeur2
 Simon Richir1
 Nadine Couture2
- 1Arts et Metiers Institute of Technology, Laboratoire Angevin de Mécanique, Procédés et innovAtion, HESAM Université, Change, France
- 2Univ. Bordeaux, ESTIA Institute of Technology, Bidart, France
Creativity is key in the early phases of innovation processes. With the rapid evolution of technologies, designers now have access to various tools to support this activity. Virtual reality (VR) takes over multiple domains, especially during conception. However, is VR really facilitating creativity in the initial ideation phases? We compare two sketching modalities through dedicated creativity support tools (CSTs): one in VR and one on a 2D interactive whiteboard. We propose a two-part creativity task (divergent and convergent thinking) for two groups of 30 participants each. We record user experience, creative experience, and creative performance. Our results show that VR is more stimulating, attractive, and engaging. We also observe a better level of creativity for the participants using the VR CST. Our results indicate that VR is an effective and relevant tool to boost creativity and that this effect might carry over to following creative tasks.
1 Introduction
The ability to innovate is crucial for a company’s development and need to stay competitive. The user-centered design cycle is one of the ways to proceed through innovation. It is defined as a four-phase cycle: understand, design, prototype, and evaluate (Wilson, 1999; Hartson and Pyla, 2012). We are especially interested in the design phase, which encompasses the ideation parts of the design cycle and relies on the activities of creativity. Creativity is generally defined as the ability to propose new concepts adapted to the context in which they are developed (Lubart et al., 2015).
Guilford (1967) theorized the construct of creativity into two measurable cognitive ingredients that everyone experiences daily: divergent and convergent thinking. Divergent thinking is a style of thinking that allows idea generation in a context where the selection criteria are relatively vague and more than one solution is correct. It involves the flexibility of the mind. In contrast, convergent thinking represents a style of thinking that allows finding single solutions to a well-defined problem, which requires more persistence and focus. A typical design process goes through three phases:
• Conceptual: an exploration of ideas without constraints (divergent thinking). The ideas are generally simple and not really detailed;
• Embodiment: an investigation of the ideas to make them realistic and a study of the intricacies and modalities (convergent thinking);
• Detail: formalization and finalization of the concept.
In this study, we want to focus particularly on the first two phases.
Sketching during the design phase allows for creation of user experiences and rapid proposing, elaborating, and testing many different ideas (Buxton, 2007). It is an effective technique to support ideation across various industries (Gallagher, 2017). The pragmatic characteristics of the tools used for sketching, and their impact in terms of user experience, are important factors in the creative performance of individuals (Fleury et al., 2021b). For example, movement affects fluency and novelty, whereas emotions affect flexibility and originality. The rapid evolution and accessibility of technology have enabled the diversification of sketching tools. It is necessary to evaluate the different opportunities offered by such tools to improve the innovation process.
A considerable amount of research has been done on 2D sketching tools, and, recently, the focus has shifted toward more 3D and ubiquitous solutions: From using immersive virtual reality (VR) combined with constrained instruction to improve precision (Arora et al., 2017), turning 2D sketches into 3D complex and linked shapes (Lee et al., 2020), designing with AI powered robots aid (Lin et al., 2020), all the way to designing entire interactive spaces in VR (Jetter et al., 2020). If each tool (2D or 3D) seems to have its own advantages and drawbacks, it is unclear which one is the best depending on the task performed and why.
The present study aims to compare, in terms of creative output and user experience, two idiomatic concepts of sketching for creativity: a 3D modality with an immersive VR sketching tool and a 2D modality with an interactive whiteboard. Both creativity support tools (CSTs) offer mostly the same interactions (free drawing, rich color palette, erasing, etc.). The experiment is composed of two successive creative thinking tasks: one divergent thinking task based on the Alternative Uses Test (AUT) proposed by Guilford (1967) with a bike’s crankset, followed by a convergent thinking task (refining and studying an established concept). These two phases are the basis of most creative methods [brainstorming, double diamond, and design thinking (UK Design Council, 2005)]. We recruited 60 participants divided into two different groups, each group performing on one modality (2D or VR). The novelty of this work resides in the comparison between two radically different CSTs over two naturally successive phases of creativity and the highlight of the link between user experience, creative experience, and creative output. This comparison is done with a creativity scoring system inspired by previous literature on sketching tasks. We share the methodology we used to design our scoring system.
2 Related work
2.1 Creativity tasks and measurement
Guilford (1967) developed the Alternative Uses Test (AUT), which is a method used to measure divergent thinking. Participants are presented with a particular object, such as a brick, and they must generate as many different uses for this object as possible. Four indicators are used to evaluate the AUT performance: fluency (the total number of ideas generated); flexibility (the number of categories or themes used by the participants); elaboration (the amount of detail provided); and originality (the extent to which responses are unique compared to the rest of the sample, or population). If the AUT is generally done orally, other evaluation methods will be developed for sketching creativity. Marsh et al. (1996) and Kulkarni et al. (2014) explored the effect of example exposure on creativity in a sketching task. The participants have to draw aliens they would encounter on a foreign planet. The different features present in the sketches are labeled to measure the level of divergent thinking of their participants. They then measure an average of the number of critical, common, uncommon, and novel features per drawing. This method shows similarities with the indicators defined by Guilford.
Since then, multiple methods have been developed to measure creative thinking, whether divergent or convergent. For example, the Torrance Tests of Creative Thinking (Torrance, 1974) consist of two divergent thinking tasks: the unusual uses task and the consequences task. We can also cite the realistic presented problem (RPP) (Okuda et al., 1991), during which the participant has to solve a real problem with creative ideas and the association-chain task (Benedek et al., 2012) designed to assess associative flexibility. Kelley and Kelley (2013) developed a sketching divergent thinking test where the participants are shown a picture of 30 blank circles. They have 3 min to transform as many circles as possible into different concepts or objects.
Regarding convergent thinking, MacGregor and Cunningham (2009) proposed a large set of rebus puzzles based on verbal or visual cues hidden within a presented material. Another famous convergent thinking test is the Remote Associate Test (RAT), developed by Taft and Rossiter (1966). This test consists of a series of three common stimulus words that appear to be unrelated. The person being tested must think of a fourth word that is somehow related to each of the first three words. Scores are calculated based on the number of correct questions.
If the possibility to measure creative performance has been demonstrated, Cherry and Latulipe (2014) developed a model to quantify the impact on creativity provided by digital tools, indicating the importance of personal experience during a creative activity. They create the Creativity Support Index (CSI), a questionnaire comprising six dimensions: results worth effort, exploration, collaboration, immersion, expressiveness, and enjoyment.
2.2 Virtual reality for creativity
With the advance of technology, sketching is no longer a pen-and-paper activity; it can be supported by computer tools. Tool comparisons for drawing have been the subject of much research in recent years. In their literature review based on 143 articles, Frich et al. (2019) showed an increasing diversity of the CST and a tendency toward developing simpler tools for casual users. From their review, only 4% of articles (six publications) contained highly complex CSTs, such as tele-immersive devices.
In Feeman et al.’s (2018) study, participants were asked to design a chair, either in VR or with computer-based CAD software with a keyboard and mouse. In computer conditions, the modeled chairs are very simple. Most of them resemble a minimalist representation of a chair: four legs and a straight backrest. It seems that the participants considered that the task was finished as soon as their model resembled a chair because they were faced with an unsatisfactory use of the tool. In comparison, the chairs modeled in the condition of “virtual reality” are more original and more complex. The authors hypothesized that this was caused by the participants being more engaged in the task. Even when the models looked like a chair, they continued to add additional elements.
VR enables specific levers to be activated to promote creativity. For instance, users can be immersed in a natural virtual environment, which is beneficial to their creativity because of the attention restoration effect (Fleury et al., 2021a). It is also possible to increase users’ creativity by using visual movements, giving them the impression that they are moving (Fleury et al., 2020; Fillingim et al., 2021). Jetter et al. (2020) explained that VR supports sketching user experiences, which are crucial in the early phases (Buxton, 2007). In their Jetter et al. 2020 study, they explored how professional designers experience sketching and simulate complete spatially aware interactive spaces in VR. They discussed the different benefits and limitations of their approach. With a user study, they highlighted that the experience of space (participants on their toes or even jumping to reach higher) and playful design explorations are key aspects. Their results are in accordance with the work of Buxton (2007), who stated that stories, storytelling, and play are critical parts of the design.
Furthermore, Hu et al. (2021) explained that creativity is often limited by our own mental barriers. They argued that mixed reality (XR) platforms (from augmented reality to VR) help remove those barriers and promote creativity. They explained that the rich and multi-sensory stimuli, embodied cognition, and 3D spatial cognition provided by XR technologies can extend people’s vision and idea-generation capabilities.
2.3 Three-dimensional immersive sketching versus two-dimensional sketching
In the study by Calderon-Hernandez et al. (2019), participants were asked to perform operations that required viewing models in 2D drawing or immersive 3D modeling in VR. The results indicated that the VR version allowed for more accuracy in the activity and the perception of the models and better memorization of the visualized models. Yang et al. (2018) performed an experiment in which the participants were asked to sketch a technological object with the properties of a smartphone that is wearable and not a connected watch. Half of the participants performed this ideation task in an immersive 3D sketching environment; the other half did it on paper. The results revealed that the participants were more creative in the VR condition than with paper. The authors interpreted this result as a consequence of VR being more conducive to inducing a state of flow to the participants (Csikszentmihalyi, 1975), and flow is conducive to creativity (Yang et al., 2018). Yang and Lee (2020) performed an experiment that identified the cognitive impact of sketching in VR compared to paper and pencil. According to the authors, sketching in VR stimulates visual-spatial cognition that transforms and reconstructs initial ideas to generate new concepts.
Lee et al. (2021) compared a VR sketching tool to 2D sketching but with a 2D electronic sketching tool with a digital pen on a tablet. The participants were 10 fashion designers who were asked to draw a woman’s dress in 20 s and another one in 30 s with a VR 3D sketching tool or tablet and digital pen. Creativity performance was superior with the VR tool. According to the authors, changing the point of view in VR led the participants to evaluate their initial idea and changed their minds. With the tablet, designers tended to iterate to elaborate their initial ideas rather than generating new ones. Changing the point of view by moving around the object to observe it in a general or specific way is considered a key behavior of design in VR named “spatial inspection.” The users performed spatial inspections very frequently during the sketching process. VR facilitates spatial inspections, which should be a major reason for the improved performance because it benefits a more holistic approach (Drey et al., 2020).
Most of the studies we presented seem to highlight the interest in VR CSTs as ways to improve creativity. However, there is limited information as to why it may be a better solution. Moreover, very few studies utilized a classical sequence of creativity (divergence and then convergence) as described, for example, in the double diamond protocol (UK Design Council, 2005). In our study, we want to explore the relationships between creative performance and participants’ perceived experience to understand how VR might be a superior tool. We want to find the main differences between two CSTs, one in 3D and one in 2D, and the consequences these differences can have on creative performance.
3 Hypotheses
Several studies revealed that VR is more conducive to creativity than other media, such as tablets (Lee et al., 2021), pen, and paper (Yang et al., 2018), and computer-based CAD software (Feeman et al., 2018). Mille et al. (2020) compared paper and pencil, VR sketching, VR modeling, and computer CAD with a keyboard and mouse in the same experiment. In this last research, a VR sketching tool appears to be effective and is considered the most stimulating. In the present study, we want to compare a VR sketching tool with an interactive whiteboard in terms of creativity. We want to better understand the reason for the conductivity of VR for creativity by verifying the role of the “stimulation” component of user experience, “the ability of the system to stimulate the user, to give him a sense of control” (Lallemand et al., 2015). We reason that if the stimulation makes one more creative in the VR condition, then participants should be more creative during the VR task than the interactive whiteboard task.
We have the following three hypotheses:
• H1: creative performance is higher with VR than with the interactive whiteboard, characterized by greater fluidity (number of ideas or features generated);
• H2: user experience is better in VR than when using the interactive whiteboard;
• H3: creative experience is better with VR than with the interactive whiteboard.
4 Materials and methods
4.1 Participants
We recruited 60 participants for this experiment (15 women and 45 men) aged 19–36 years (M = 22.73, SD = 3.522). The participants we recruited were mostly engineering students (37), bachelor students (12), and some Ph.D. students, researchers, and ergonomists (11). We had to remove participant 61 from our panel due to multiple non-visible handicaps that we discussed after the experiment that made the participant unable to perform 2D sketching tasks. We decided not to recruit only designers to have the largest panel possible. Moreover, our 3D tool is not professional, and proposing such tools to professionals could lead to underwhelming experiences. The participants are fairly young and represent a population that could, in the future, use VR tools in their professional environment. If some might not be the main population using CST, this experience might not be too far remote from potential creativity tasks they could do in their engineering careers or as ergonomists.
To ensure that our groups were comparable, we measured, using questionnaires, the level of interest of participants for conception, upcycling, and societal responsibility on a scale from 1 to 5 to measure their intrinsic motivation for the subject. The Mann–Whitney U test on the results showed no significant differences between our two groups for conception (p = 0.218, U = 371.00, Z = −1.231; Md3D = 4.00; Md2D = 4.00), upcycling (p = 0.536, U = 410.50, Z = −0.619; Md3D = 4.00; Md2D = 4.00), or societal responsibility (p = 0.864, U = 439.50, Z = −0.172; Md3D = 4.50; Md2D = 4.50). We asked our participants how experienced they were in VR on a scale from 1 to 5, and they rated themselves slightly below average in terms of experience, with no significant differences between the two groups (p = 0.871, U = 439.50, Z = −0.163; Md3D = 2.00; Md2D = 2.00).
4.2 Apparatus
For the VR creativity task, we used an HTC Vive Pro Eye VR System and a DELL G5 VR-ready portable PC (composed of an Intel Core I7-8750H @ 2.20 GHz processor and a Nvidia Geforce RTX 2070 Max-Q graphics card). We used a customized 3D sketching application developed in our lab. This application allows the user to draw freely in a 3D virtual environment. The user has access to a color palette, different sizes of brushes, and tone palettes. The user can erase part of the sketch, save the current sketch, and load a sketch.
For the 2D sketching task, we used the same computer coupled with a Samsung Advanced Digital Whiteboard1, which allows touch screen interactions, sketching, color selection, erasing, saving sketches, and loading sketches. The user has access to a color palette and can draw in different sizes depending on the surface of contact with the screen (hands or pen). Examples of users in the different conditions are represented in Figure 1.
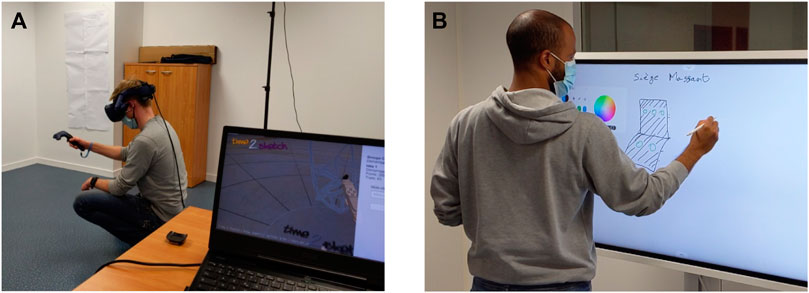
FIGURE 1. Examples of users interacting with the sketching CSTs: (A) in the virtual reality condition and (B) in the interactive whiteboard condition.
Sketching applications, whether 2D or 3D, contain common features that can be found in most of them (color palette, brush size control, and erasing). Those features do not need special advanced interaction techniques or specific controls. Both tools we use for this experiment are centered around those common standard features. Moreover, our 3D application was customized to match the features of the 2D whiteboard and to be as close to the interaction and sketching modalities as possible.
For the pre-test sketching task, the participants used Wacom One creative pen display2 to draw using Gimp. The participants were also equipped with the Empatica E4 smart wristband3 before the experiment started to measure physiological data, which is not addressed in this article.
4.3 Variables and measures
We decided to conduct our study using a between-subject experimental design. Our 60 participants are divided into two distinct groups of 30. The first group will perform the tasks in 3D using the VR setup, whereas the second group will perform the tasks in 2D using the interactive whiteboard. We took that decision because both groups will do the same creativity tasks.
The user experience associated with using the two CSTs is evaluated using the French version of the AttrakDiff (Lallemand et al., 2015). This questionnaire consists of 28 items to which participants respond on a seven-point Likert scale. These items measure the following dimensions:
• Pragmatic qualities: usefulness and usability, which will support the achievement of the objectives;
• Hedonic qualities: the capacity of the product to give pleasure to the user;
• Identification: ability to provide the user popularity, to connect them to others;
• Stimulation: the ability of the system to stimulate the user, to give them a sense of control;
• Attractiveness: a combination of pragmatic and hedonic qualities to arrive at an overall appreciation derived from perceived quality.
The perceived adequacy of CST to support creativity is evaluated using the CSI (Cherry and Latulipe, 2014). We removed the questions regarding collaboration from the questionnaire, as the task was a single-user experience.
To measure the creativity level of our participants and their capacity to sketch before the experiment, we decided to use the divergent test developed by Kelley and Kelley (2013) using the Wacom One creative display. The same test is done after the experiment to measure divergent thinking again but with 30 blank squares instead of 30 blank circles. The scores of these tests are measured by multiplying the number of unique concepts proposed by the number of circles (or squares) used. To measure convergent thinking before the experiment, we used a RAT (Taft and Rossiter, 1966) with 16 words to find. The score of the RAT is simply the number of right associations found.
The creativity task we proposed is highly inspired by the work of Guilford (1966) on alternate uses. As described by Fleury et al. (2020), the ideas produced are rated on a collection of scores: originality (which evaluates whether the participant’s ideas were unique compared to other participants); fluency (the number of ideas generated); flexibility (the number of ideas belonging to different domains or categories); and elaboration (the amount of added detail given for each idea). Because our experiment is based on sketching, we also took inspiration from Kulkarni et al. (2014). Indeed, for their method, they record the different features proposed per sketch by their participants and not only the number of ideas proposed.
In our approach, two authors, separately and independently, analyzed all the sketches produced by the participants. They identified and listed every major feature they found. The two lists were confronted to construct an ontology of the different features. This allowed us to divide the features into four main categories (the final list can be seen in the Supplementary Material):
• Details: composed of details not necessary for the idea but which helped understanding or provided context (e.g., user, environment, symbols, and text).
• In/Out: what comes in and out of the system proposed [e.g., power source (human, water, wind, etc.), the object transformed or displaced by the system, and the power output].
• System function: the transformation that occurs due to the system, energy, or mechanics (e.g., rotation, linear to rotation, energy transmission, and storage).
• System structure: the physical structure of the system (e.g., rope, chain, seat, wheel, and crankset).
The ideas were then divided equally into three samples, each assigned to one of the authors. They were tasked with annotating the features represented for each sketch in their sample, using the list of features built previously. Lastly, one author reviewed all the sketches’ feature annotations to ensure that all features were appropriately annotated and the similarity in annotation between each author. Our features annotation system was designed to have a somewhat numerical characterization of creativity (rather than a subjective score for each idea produced). Thus, we computed the rarity of each feature and categorized them into three groups: unique (representing less than 2% of all features4), uncommon (representing less than 10% of all features), and common. We also recorded the number of colors used for each sketch, the number of ideas produced (only for the divergent thinking phase), the domain or category for each idea proposed, and the number of different categories proposed by participants (only for the divergent thinking phase).
4.4 Experimental procedure
First, the participants were asked to read and sign, if they accepted, a consent form informing them that they would be filmed, their answers to the questionnaires would be used only in this research, and they could back out anytime if they wanted or felt uncomfortable. They also certified that they did not present with heart problems or suffered from stereoscopic vision troubles.
Once they signed the consent form, they were asked to answer a demographic questionnaire to gather information about their age, sex, educational background, and their intrinsic motivation regarding the subject (interest in conception, upcycling, and societal responsibility on a scale from 1 to 5). We also record their level of valence and arousal using a self-assessment manikin questionnaire (Bradley and Lang, 1994).
The participants were then asked to complete a divergent thinking test (Kelley and Kelley, 2013). For this test, they were shown a picture of 30 blank circles. Using an interactive display, they had 3 min to transform as many circles as possible into different concepts or objects. Once they completed this task, they answered a RAT (Taft and Rossiter, 1966) to measure their convergent thinking.
The participants were introduced to the setup they would use and were subsequently equipped if necessary. For the VR experience, the participants first completed a tutorial session during which they were shown the different tools they would have access to. They could draw freely, and once they felt comfortable, they could proceed to the next phase. For the 2D sketching tool, the participants were introduced to the different ways of interacting with the screen (how to draw, change color, erase, and save) and asked if they had any questions regarding the usage of the screen.
The participants were then introduced to the divergent thinking scenario.
A collapse had happened. There was no more electricity or fossil energy to power the systems that surrounded them. Your colony managed to settle near an old cycling spare parts warehouse. The different parts (wheels, saddle, chain, etc.) have already been used to facilitate the colony’s life. There is a huge number of cranksets that have not been used yet. You have to find ways to divert the usage of these cranksets to simplify the colony’s life. Do not limit yourself to feasibility or realism. There are no good or bad ideas.They were asked to produce one sketch for each idea they had and give it a short description or name. This is based on the Guilford alternate uses task (Guilford, 1966). We let the participants produce as many ideas as possible (Figure 2). They could stop whenever they feel like they are done. If they produced ideas for more than 15 min, we informed them that they could log in one last idea and proceed to the next phase.

FIGURE 2. Example of ideas produced by two different participants: (A) in the virtual reality condition and (B) in the interactive whiteboard condition. In this case, both represent electricity-generating machines.
The VR scene took place in an old warehouse with some furniture. A 3D model of the crankset was placed at the center of the scene (see Figure 3). The participants could draw and move freely around it. This design choice was made to exploit the potential of VR in its most natural usage. For the interactive whiteboard condition, a real crankset was placed next to the screen so that the participants could have a visual representation of the object to be as similar to the VR experimental conditions as possible.
The second phase of creativity proposed comprised a convergent thinking task.
After the collapse, there was a rise in physical work and, thus, in injuries and muscular problems. In this context it is necessary to propose a solution to relieve people of the different pain they experience. Therefore, your colony brainstormed and came to a common idea that seemed feasible. They designed a simplistic prototype of a massaging seat using the cranksets. They did not care about the realization and how it was supposed to work. Your goal is to improve the concept, make it functional, and study the limitations and its realization.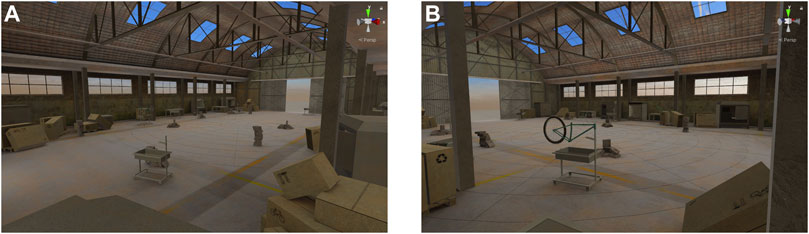
FIGURE 3. Views of the virtual warehouse the participants are placed in.
For this phase, the participants loaded a drawn sketch of the massaging seat prototype (Figure 4). The participants were informed that they could erase parts of the drawing, draw around, or change the concept while still proposing a massaging solution using the crankset as a fundamental part of the system. They had to propose one sketch and explain the main modifications and additions to their final idea. Once they were done, they simply saved the sketch, and the creativity experiment ended (see Figure 5, for an example of saved massaging concepts).
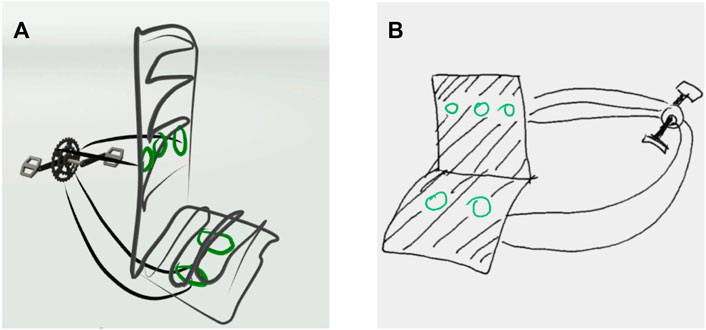
FIGURE 4. Massaging seat models presented to the participants: (A) in the virtual reality condition and (B) in the interactive whiteboard condition.
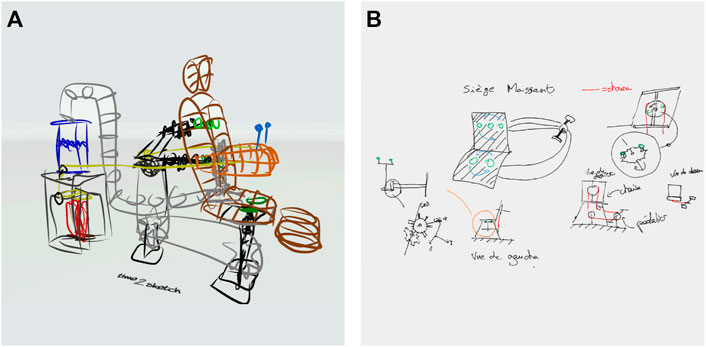
FIGURE 5. Example of finished massaging seat concept produced by two different participants: (A) in the virtual reality condition and (B) in the interactive whiteboard condition.
The participants were then asked to take another divergent thinking test (Kelley and Kelley, 2013). It was the same as the one they took before the experiment, but this time with 30 blank squares instead of 30 circles. This was done to measure their level of divergent thinking after the experiment.
Finally, they completed the last questionnaire, composed of another SAM to measure their level of arousal and valence, as well as an AttrakDiff (Lallemand et al., 2015) questionnaire for user experience and the CSI (Cherry and Latulipe, 2014) for the creative experience. We then asked them if they had questions or wanted to discuss the experiment more informally. If they had no more questions, the experiment ended. The complete procedure lasted from approximately 45 min to 1 h (see Figure 6 for an overview).

FIGURE 6. Main steps of the protocol (the extra steps present only for the VR part are included on the right).
5 Results
For all the group comparisons described here, we performed a normality Shapiro–Wilk test (the results can be seen in the Supplementary Material). Whenever the normality condition was not met, the comparison was done with non-parametric analysis.
5.1 Pre- and post-tests for divergent and convergent creativity
The Shapiro–Wilk tests revealed non-normal distributions for the divergence score before the sketching activity [W (60) = 0.815, p < 0.001], the divergence score after the sketching activity [W (60) = 0.924, p = 0.001], and convergence before the sketching activity [W (60) = 0.959, p = 0.041].
The RAT test scores before the sketching activity were compared with a Mann–Whitney U test, which revealed no significant differences between the two groups (U = 356.5, Z = −1.407, p = 0.160) with an average score of 3.13 (SD = 1.871) in the VR condition and 3.62 (SD = 1.613) in the whiteboard condition. Likewise, the scores of the divergent thinking test before the sketching activity (drawing with circles) were compared with a Mann–Whitney U test, which revealed no significant differences between the two groups (U = 429, Z = −0.311, p = 0.756) with an average score of 2.685 (SD = 2.417) in the VR condition and 2.126 (SD = 1.239) in the whiteboard condition. Conversely, the comparison of the two conditions for the divergent thinking after the experiment (drawing with squares) revealed a significant superiority of the scores (U = 263, Z = −2.771, p = 0.006) for the participants that used the VR CST (M = 3.426, SD = 1.969) compared to those who used the interactive whiteboard (M = 2.266, SD = 1.657).
5.2 Valence and arousal
Table 1 shows all the means and standard deviations for valence and arousal in the two experimental conditions. Evolution of valence and arousal have been conducted by comparing measures before the experiment and right after the experiment. The Wilcoxon test revealed no significant evolution of valence (Z = −0.404, p = 0.686) and arousal (Z = −1.232, p = 0.218) for the interactive whiteboard condition. Conversely, the Wilcoxon test revealed a significant increase in valence (Z = −2.765, p = 0.006) concerning the VR condition.
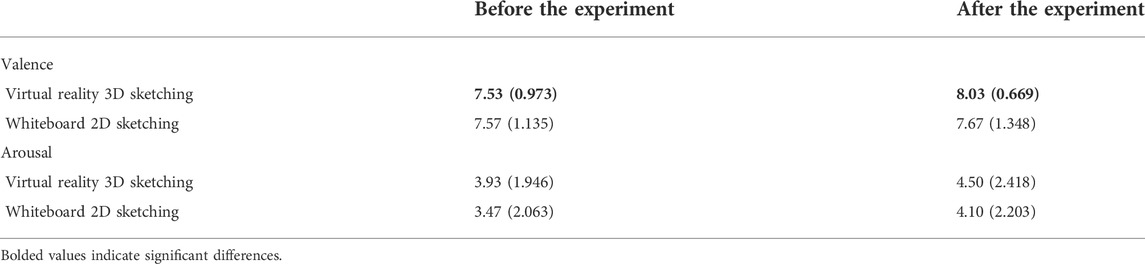
TABLE 1. Means and standard deviations (between brackets) for the reported level of arousal and valence (before and after the experiment) concerning the two conditions.
5.3 User experience: AttrakDiff
Table 2 shows all the means and standard deviations for the four dimensions of AttrakDiff in the two experimental conditions. The non-parametric Mann–Whitney U test revealed a significant superiority of VR condition compared to the interactive whiteboard for stimulation and attractiveness. Student’s t-tests revealed a significant superiority of interactive whiteboard condition for identity and no significant difference in pragmatic quality between the two CSTs.

TABLE 2. Means and standard deviations (between brackets) for the four dimensions of user experience (AttrakDiff) concerning the two conditions.
5.4 Creative experience: Creativity support index
Table 3 shows all the means and standard deviations for the five dimensions of the CSI in the two experimental conditions. The non-parametric Mann–Whitney U test revealed no significant difference between the two conditions for exploration, gratification, transparency, and expressiveness. However, it revealed a significant superiority of the VR condition for engagement.
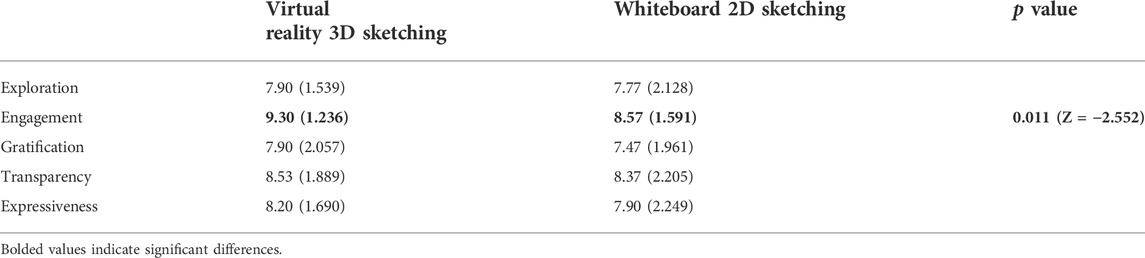
TABLE 3. Means and standard deviations (between brackets) for the five dimensions of the creativity support index concerning the two conditions.
5.5 Creative performance: Sketched features
5.5.1 First phase: Divergent thinking (crankset)
In total, 339 ideas were proposed by the participants, representing 2,668 features identified. In VR, the participants proposed, on average, 5.07 (SD = 3.59) ideas for 152 ideas and 1,385 features. The participants using the 2D sketching tool proposed, on average, 6.23 ideas (SD = 3.57) for 187 ideas and 1,283 features. We found no statistical differences in the number of ideas proposed between the two groups.
Table 4 shows the means and standard deviations for the average number of features per idea in the two experimental conditions for the first phase (divergent thinking). Parametric t-tests revealed significant differences between the two conditions for the average number of features per idea, with more features drawn in VR than with the whiteboard. The non-parametric Mann–Whitney U test revealed that a significantly higher number of function features, structure features, and crankset parts per idea were sketched in VR compared to the whiteboard condition.
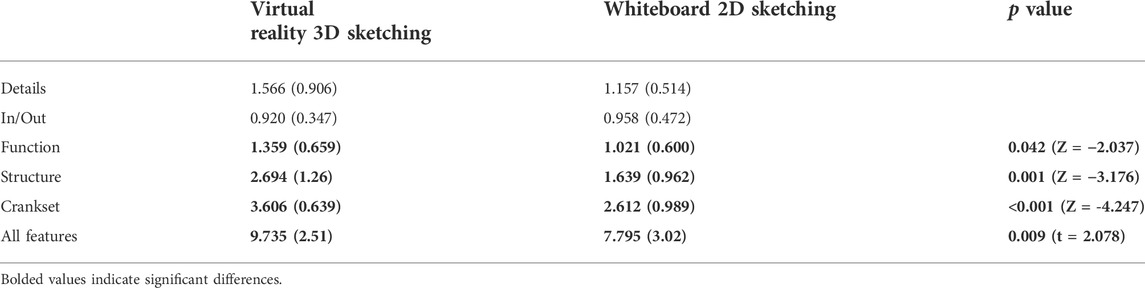
TABLE 4. Means and standard deviations (between brackets) for the average number of features per idea for the first phase of the creativity task, concerning the two conditions.
The non-parametric Mann–Whitney U tests revealed an almost significant differences between the two conditions for the average number of colors used per idea (Z = −1.264, p = 0.063), participants using more color in VR compared to those using the 2D sketching tool (M3D = 2.333, SD3D = 1.21; M2D = 1.904, SD2D = 1.15).
For this phase of the experience, Mann–Whitney U tests revealed significant differences in the average number of unique features (Z = −2.376, p = 0.018). The participants using the interactive whiteboard proposed, on average, a higher number of unique features per idea compared to the ones using VR (M3D = 0.291, SD3D = 0.197; M2D = 0.482, SD2D = 0.286). On the contrary, the participants in the VR condition produced a significantly higher (t = 3.167, p = 0.02) average number of common features per idea compared to the participants using the interactive whiteboard (M3D = 8.503, SD3D = 2.262; M2D = 6.445, SD2D = 2.933).
The parametric t-test revealed no significant differences (t = −0.428, p = 0.670) between the two conditions in the total duration of the divergent thinking phase (M3D = 733.03 s, SD3D = 252.561; M2D = 765.30 s, SD2D = 326.459).
5.5.2 Second phase: Convergent thinking (massaging seat)
Each participant saved one sketch of their final concept, which amounted to 805 features identified: 423 features sketched for the participants in VR and 382 features sketched for the participants with the interactive whiteboard.
Table 5 shows the means and standard deviations for the number of features in the two experimental conditions for the second phase (convergent thinking). The non-parametric Mann–Whitney U test revealed significant differences between the two conditions for the number of function features and crankset parts (gears, crank, and pedals). The participants in VR sketched more of the required type of features than the ones using the whiteboard.
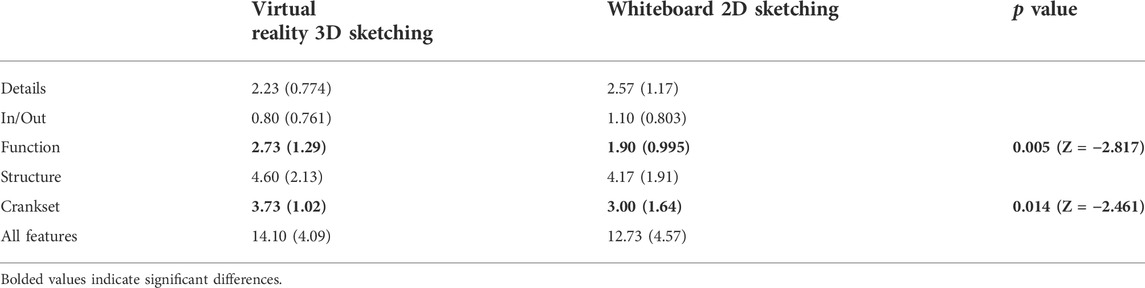
TABLE 5. Means and standard deviations (between brackets) for the number of features for the second phase of the creativity task, concerning the two conditions.
The Mann–Whitney U test revealed significant differences between the two conditions for the number of colors used during the second phase (Z = −2.121, p = 0.034). The participants used more color in the VR tool compared to the 2D sketching tool (M3D = 3.70, SD3D = 2.14; M2D = 2.60, SD2D = 1.75).
The non-parametric Mann–Whitney U test revealed significant differences (Z = −3.031, p = 0.002) between the two conditions for the total duration of the convergent thinking phase. The participants in VR spent more time completing this task than the ones using the interactive whiteboard (M3D = 629.43 s, SD3D = 275.559; M2D = 441.50 s, SD2D = 189.173).
5.6 Correlations
To better understand the relationship between creative proficiency and reported experience (user experience and creative experience), we decided to explore potential correlations between those different values.
Using the Spearman test, we found a positive correlation for both conditions between the reported level of engagement from the CSI and the average number of structure features per idea for the divergent thinking phase (r = 0.291, n = 60, p = 0.024). A positive correlation was also found for both conditions between the reported level of engagement and the number of function features realized during the convergent thinking phase (r = 0.305, n = 60, p = 0.018). With a higher level of engagement, participants tended to sketch, on average, more structure features per idea during the divergent thinking phase and more function features during the convergent thinking phase. Finally, two negative correlations were found, for both conditions, between the reported level of stimulation (AttrakDiff) and the level of details during the convergent thinking phase (r = −0.310, n = 60, p = 0.016) and the level of In/Out features during the convergent thinking phase (r = −0.332, n = 60, p = 0.009). With a higher stimulation level, the participants tended to sketch a lower number of details and In/Out features during the convergent thinking phase.
Using the Spearman test, we found positive correlations for both conditions between the duration of the divergent thinking phase and the number of ideas produced (r = 0.443, n = 60, p < 0.001) as well as the number of features (r = 0.530, n = 60, p < 0.001). We also found a positive correlation for both conditions between the duration of the convergent thinking phase and the number of features sketched (r = 0.428, n = 60, p = 0.001).
6 Discussion
CSTs have been studied multiple times to determine their benefits and drawbacks (Frich et al., 2019). The goal of our study is to provide more depth to these evaluations. Indeed, not only do we explore the difference in terms of creative output but also in terms of user experience and creative experience. The two sketching CSTs we use for our study offer almost the same modalities (large color palette, erasing, changing the brush size, etc.) such that the observed differences are more due to the medium than the interactions provided by each.
As VR has been shown to promote creativity (Feeman et al., 2018; Fleury et al., 2021a) during ideation tasks, we hypothesized that the participants in VR would display a higher level of creativity (H1), especially regarding the level of fluidity (number of features generated). Our analysis of the features produced during the divergent thinking exercise shows that the participants in VR generated, on average, more features per idea than the participants using the interactive whiteboard (in total, for the function, structure, and crankset features as well). If the participants in VR generated more features than the ones in the whiteboard condition during this phase, the second group did produce, on average, more unique features (M3D = 0.291, SD3D = 0.197; M2D = 0.482, SD2D = 0.286), whereas the VR ones were more common (M3D = 8.50, SD3D = 2.26; M2D = 6.44, SD2D = 2.93). Moreover, during the second phase in VR, participants used, on average, more colors per sketch than when using the whiteboard, although both had simple access to a color palette (M3D = 3.70, SD3D = 2.14; M2D = 2.60, SD2D = 1.75). From those data, we can say that VR promotes a higher level of fluency. If we found no significant results regarding the number of domains explored by the participants (flexibility), the participants using VR seemed to provide a higher elaboration level to their sketches, as observed by the usage of more colors on average. This is in accordance with previous results (Drey et al., 2020; Lee et al., 2021). Some participants in VR confirmed that “having a magic wand that allows to materialize [sic] what I have in mind,” said participant N°5 (VR). However, there is not such a strict consensus among the participants. Indeed, participant N°27 (VR) reported that while “one has the idea in its [sic] head, it is hard to sketch it realistically in 3D.” This resonates with the fact that the interactive whiteboard seems to enable a higher level of originality for the participants, as they proposed significantly more unique features for their ideas on average. This might be explained by the difficulty of representing more complex or specific features in VR. One participant reported that “simple strict shapes are hard to do cleanly (circles, spheres, cubes, etc.).” This might have deterred the participants from engaging in very intricate concepts. Such limitations are explored in the work of Arora et al. (2017) on the usage of fixed surfaces in VR to improve the precision of sketching in VR. It points toward the limitations of freehand drawing in VR at the moment.
Differences between the two CSTs are also observable in the reported experience of our participants. Mille et al. (2020) demonstrated that VR is a strongly stimulating tool. That is why we hypothesized that the reported levels of user experience would be better for VR (H2). Statistical analyses validated our hypothesis. Stimulation and attractiveness are significantly higher for the participants in the VR group compared to the interactive whiteboard users. As described by Hassenzahl et al. (2003), stimulation is affected by the originality of a product and its creative and captivating aspects. These results may have led to a higher level of creativity by our participants due to a higher willingness to exploit the tool fully. Some of the participants declared that “the virtual environment was stimulating” and “I was finding ideas as I was drawing. It makes you want to draw, to create objects.” This effect was reported by (Jetter et al., 2020, p 9), supporting the “spirit of design” (Buxton, 2007): to invite, to suggest and to question,” leading to ever-evolving creativity. On the contrary, the participants using the interactive whiteboard reported a significantly higher level of identity than those using VR. Identity refers to the professional qualities of the tool, if it is of good taste, demonstrable, if it brings closer to others. These results are expected, as the VR CST we used is still a prototype mostly developed for research purposes. Normally, a highly technological product designed by a state-of-the-art company in the technological world, such as Samsung, would present better results for this category.
Our last hypothesis stated that the participants using VR would report higher levels of creative experience than those using the interactive whiteboard (H3). Even if all the reported scores are higher for the VR condition compared to the 2D condition, only the level of engagement was significantly different. Cherry and Latulipe (2014) explained that engagement is crucial for an ideation task as it relates to many of the flow elements described by Csikszentmihalyi (1975). They stated that engagement could be responsible for distractions being excluded from consciousness, from self-consciousness disappearing, and from the sense of time being distorted. Multiple participants in the VR condition reported the following feelings: “I had the feeling that the sketches were physically real,” “Super interesting, we quickly forget that we have the headset on. I had the feeling that it was real, I was scared that I would collide with the crankset,” and “The experiment made me forget my real body.” These results were expected, as more recent immersive VR devices can now easily lead to high senses of presence and immersion (Cummings and Bailenson, 2016). Our last hypothesis is only partially validated, as we expected more differences for the different dimensions of the CSI. However, the results confirm the very interesting promises of using VR as a sketching CST. Indeed, statistical analysis showed a positive correlation between engagement and some of the metrics of creative fluidity. However, we also observed a drawback to the immersiveness of VR, as stimulation is negatively correlated to some metrics of creative fluidity. A subtle balance needs to be found to stimulate the users enough but not distract them from the task they are performing.
Logically, we found strong positive correlations between the time spent doing the task and the number of features and ideas produced by the participants. If we found no differences between the two conditions during the divergent thinking phase, the participants in VR spent significantly more time than the ones using the interactive whiteboard performing the convergent thinking phase (M3D = 629.43 s, SD3D = 275.559 s; M2D = 441.50 s, SD2D = 189.173 s). With strong immersiveness and engaging aspect, the participants could have willingly spent more time thinking and sketching in VR than in 2D. This could explain the differences we observe in the number of overall features produced during this second phase.
As presented previously, Cherry and Latulipe (2014) discussed the importance of engagement and flow in the creative process. Flow in positive psychology is the mental state in which a person performing some activity is fully immersed in a feeling of energized focus, full involvement, and enjoyment in the process of the activity. In essence, flow is characterized by the complete absorption of what one does and a resulting transformation in one’s sense of time. This state is strongly linked with emotions and, thus, arousal and valence. Interestingly, our results demonstrate that our participants reported a significant rise in their level of valence in the VR condition. It is interesting and might explain some of the creativity results as well, as multiple studies have linked emotions and arousal to the success of an ideation process (De Dreu et al., 2008; Hao et al., 2017). However, we would argue that the state of flow is not the only effect achieved through the VR medium in our experiment. Flow is closely tied with the activity being performed and thus should not generate lasting effects on a different task. In our case, we observed that the participants in the VR group were significantly more successful in the post-experiment divergent thinking task than those in the interactive whiteboard group. Those lasting effects on creativity might not result from the induction of flow during the VR experiment. Realizing an ideation task in VR could potentially stimulate creativity as a whole for the participants with lingering effects after exposure. Hu et al. (2021) suggested that mixed reality systems have the power to remove mental blocks and stimulate creativity on multiple levels. The removal of said self-limitations could lead to a lasting improvement in creative thinking. Moreover, multiple studies have already highlighted that VR exposure could have remnant effects on users’ behavior and perception (Yee and Bailenson, 2006; Herrera et al., 2018).
Derived from our different observations, we want to propose tentative recommendations. VR is indeed a strong tool to promote creativity in early design phases and could be utilized in combination with a contextualized virtual environment. However, it is not a tool without fault. It can pose some limitations, such as the inability to sketch on different scales in our case. Moreover, it sometimes lacks precision, which can limit the designer’s output if their idea needs details. Our recommendation would be to use VR as a starting point when generating ideas; free the designers of certain mental blocks; promote immersion, exploration, and creativity; and then combine it with a more traditional 2D approach for more precision.
Usually, a creativity session is divided into three distinct phases: divergence, selection of ideas, and convergence. That is why, in our study, we decided to propose a similar schema. To ensure that the conditions for each participant are comparable, we decided to exclude the selection phase and have the convergence phase on a pre-selected subject. Because the convergence phase is much more technical and precise than the divergence phase, we expected the participants to produce better results using the interactive whiteboard compared to those in VR. Indeed, the VR medium is not as precise as the whiteboard, and an adaptation phase is necessary to master it fully. However, our results show that the participants in VR sketched a significantly higher number of function features and crankset parts than the ones using the interactive whiteboard. If some participants reported that the lack of precise drawing and technical tools in VR limited their tasks, the final results were not as different as expected.
7 Limitations
As stated in the Variables and measures, we conducted a between-subject design for our study. To compare the level of creativity, we wanted to have the participants perform the same scenario. However, a counter-balanced within-subject design would have been better in comparing subjective reports by the participants (AttrakDiff and CSI). However, it is complex to propose two comparable ideation tasks and mix them with two different CSTs. The experiment would have to be conducted on separate occasions as creative fatigue would have severely hampered the participants during the second run of ideation. We tried to recruit a large enough number of participants for our statistical comparisons to have weight and be exploitable by the community for later research.
Measuring creativity is a complex task. The method we used was based on previous work (Guilford, 1966; Kulkarni et al., 2014), but there might be different ways to measure it and find different results. We took an informed decision and thoroughly discussed how we planned to measure creativity before starting our experiment. It might be interesting to give the sketches to different researchers with different methods for grading creativity and observe if the results are repeatable.
For each modality (2D and 3D), we selected a representative that possesses most of the common characteristics, and we tried to have them matched as evenly as possible. Even if we tried to have the experimental conditions as close as possible, both mediums offer very different experiences. Indeed, using VR in a deprecated state, without a contextualized 3D environment, defeats the purpose of the technology and does not represent how it will be used in real conditions. It is questionable for the participants in VR to have virtual representations of the warehouse and the crankset compared to the participants using the interactive whiteboard, who are in a regular room but have a real crankset next to them to take inspiration from. The other main difference is the scale factor. In VR, the crankset was represented at a scale of 1:1, and thus participants tended to sketch at the same scale. In contrast, the participants using the interactive whiteboard could represent the crankset at a different scale and thus sketch more naturally bigger structures. This is observable in the approach the participants took with their sketches. The VR participants represented a user (or part of the user) only seven times in the 152 sketches produced, whereas the participants using the interactive whiteboard represented a user 43 times for 187 sketches. In VR, with a 1:1 scale and the 3D environment, the participants could simply put themselves as the user of the device and thus not represent another entity. This is an interesting fact to consider depending on the type of task proposed to the participants in the future.
8 Conclusion and future work
In this article, we presented an experiment comparing two CSTs: one in 3D VR and one in the 2D interactive whiteboard. Our focus was on exploring the differences between the two in terms of user experience, creative experience, and creative production. We hypothesized that VR would lead to a better user experience and creative experience. We also hypothesized that participants would perform better in terms of creativity in VR than those using the interactive whiteboard.
Our results confirmed our assumptions as the VR sketching tool led to a more stimulating, attractive, and engaging experience. However, the interactive whiteboard was deemed more polished and professional by our participants. Discussions with the participants showed that they felt a very strong sense of immersion in VR. We also observed a better level of creative performance displayed by the participants in VR compared to those with the interactive whiteboard (in terms of fluidity and fluency), even if the participants in the second group seemed to have more originality (rare features drawn). It is important to consider the novelty factor that is still inherent to VR. Even if our participants are not totally unfamiliar with VR and are technologically knowledgeable, this factor could enhance the will to perform and might be fleeting with multiple exposures. It will be interesting to explore whether the effects we found remain as the population becomes more accustomed to virtual environments.
It could be interesting to redo the same type of experiment but with other 2D and 3D tools to measure the effects of inter-modalities specificity. In our case, due to the necessary functions and interaction mechanics, we suppose that using different 2D or 3D tools will not impact user experience and, thus, the experiment’s results.
We also made some novel contributions in highlighting links between the experience perceived by the participants and their level of creativity. We found that the more engaged the participants, the better their creative performance. We also established a link between how VR could lead the participants to spend more time in the ideation process with its highly engaging nature, generating more ideas. If this could be linked to the definition of flow, we argued that it could be another phenomenon linked with creativity in its entirety, as participants performed better on a post-experiment creativity task after having been exposed to VR. Thus, VR might be a useful tool to boost creativity as a whole and not only when immersed, which is a new finding to be explored further.
We envision two following studies, both revolving around collaboration. The first one would center around the communicability of the idea produced. If our experiment was done as a single user, ideation tasks are generally conducted to take advantage of collective intelligence. It would be interesting to explore how the sketches produced during our task are perceived by outsiders and what difference we can observe depending on the CST used. The second line of investigation would be to propose an experiment with collaboration from multiple users, as most of the creativity sessions are done in groups, sharing the same virtual space or using multiple CSTs simultaneously to generate ideas and explore the perceived experience of the participants and creative results.
Data availability statement
The raw data supporting the conclusion of this article will be made available by the authors without undue reservation.
Ethics statement
Ethical review and approval were not required for the study on human participants in accordance with the local legislation and institutional requirements. The participants provided their written informed consent to participate in this study. Written informed consent was obtained from the individuals for the publication of any potentially identifiable images or data included in this study.
Author contributions
SH, DM, and SF contributed to the conception and design of the study. SH conducted the recruitment and experimentation. SH and DM contributed to the development of the creativity performance metric based on previous literature work. SH, DM, and SF performed the analysis of the creative outputs. JL provided the scenario used for the creative task. SH performed the statistical analysis. SH wrote the first draft of the manuscript. All authors contributed to the manuscript revision and read and approved the submitted version.
Funding
This project was funded through the Institut Carnot ARTS research grant campaign of 2020.
Acknowledgments
The authors would like to thank the Carnot ARTS Institute for sponsoring this research project. They would also like to thank all the participants of that experiment and the different persons that gave early feedback during the early testing phases. They thank the AM Valor engineering team, Benjamin Poussard and Thibaut Guitter, for their help in developing and customizing the 3D VR tool.
Conflict of interest
The authors declare that the research was conducted in the absence of any commercial or financial relationships that could be construed as a potential conflict of interest.
Publisher’s note
All claims expressed in this article are solely those of the authors and do not necessarily represent those of their affiliated organizations or those of the publisher, the editors, and the reviewers. Any product that may be evaluated in this article, or claim that may be made by its manufacturer, is not guaranteed or endorsed by the publisher.
Supplementary material
The Supplementary Material for this article can be found online at: https://www.frontiersin.org/articles/10.3389/frvir.2022.958223/full#supplementary-material
Footnotes
1https://www.samsung.com/us/business/displays/interactive/wm-series/samsung-interactive-display-85-lh85wmrwlgcxza/.
2https://www.wacom.com/products/pen-displays/wacom-one.
3https://www.empatica.com/en-eu/research/e4/.
42% represent 173 features sketched over 3,473 features sketched.
References
Arora, R., Kazi, R. H., Anderson, F., Grossman, T., Singh, K., and Fitzmaurice, G. (2017). Experimental evaluation of sketching on surfaces in VR. New York, NY, USA: Association for Computing Machinery, 5643–5654.
Benedek, M., Könen, T., and Neubauer, A. C. (2012). Associative abilities underlying creativity. Psychol. Aesthet. Creativity, Arts 6, 273–281. doi:10.1037/a0027059
Bradley, M. M., and Lang, P. J. (1994). Measuring emotion: The self-assessment manikin and the semantic differential. J. Behav. Ther. Exp. Psychiatry 25, 49–59. doi:10.1016/0005-7916(94)90063-9
Buxton, B. (2007). Sketching user experiences: Getting the design right and the right design. San Francisco, CA, USA: Morgan Kaufmann Publishers Inc.
Calderon-Hernandez, C., Paes, D., Irizarry, J., and Brioso, X. (2019). Comparing virtual reality and 2-dimensional drawings for the visualization of a construction project. Library 36, 17–24. doi:10.1061/9780784482421.003
Cherry, E., and Latulipe, C. (2014). Quantifying the creativity support of digital tools through the creativity support index. ACM Trans. Comput. Hum. Interact. 21, 1–25. doi:10.1145/2617588
Csikszentmihalyi, M. (1975). Beyond boredom and anxiety. San Fransisco CA: The Jossey-Bass behavioral science series (Jossey-Bass Publishers).
Cummings, J. J., and Bailenson, J. N. (2016). How immersive is enough? A meta-analysis of the effect of immersive technology on user presence. Media Psychol. 19, 272–309. doi:10.1080/15213269.2015.1015740
De Dreu, C. K. W., Baas, M., and Nijstad, B. A. (2008). Hedonic tone and activation level in the mood-creativity link: Toward a dual pathway to creativity model. J. Personality Soc. Psychol. 94, 739–756. doi:10.1037/0022-3514.94.5.739
Drey, T., Gugenheimer, J., Karlbauer, J., Milo, M., and Rukzio, E. (2020). VRSketchIn: Exploring the design space of pen and tablet interaction for 3D sketching in virtual reality, 1–14. New York, NY, USA: Association for Computing Machinery.
Feeman, S. M., Wright, L. B., and Salmon, J. L. (2018). Exploration and evaluation of cad modeling in virtual reality. Computer-Aided Des. Appl. 15, 892–904. doi:10.1080/16864360.2018.1462570
Fillingim, K. B., Shapiro, H., Reichling, C. J., and Fu, K. (2021). Effect of physical activity through virtual reality on design creativity. Artif. Intell. Eng. Des. Anal. Manuf. 35, 99–115. doi:10.1017/S0890060420000529
Fleury, S., Agnès, A., Vanukuru, R., Goumillout, E., Delcombel, N., and Richir, S. (2020). Studying the effects of visual movement on creativity. Think. Ski. Creativity 36, 100661. doi:10.1016/j.tsc.2020.100661
Fleury, S., Blanchard, P., and Richir, S. (2021a). A study of the effects of a natural virtual environment on creativity during a product design activity. Think. Ski. Creativity 40, 100828. doi:10.1016/j.tsc.2021.100828
Fleury, S., Vanukuru, R., Mille, C., Poinsot, K., Agnès, A., and Richir, S. (2021b). Crux: A creativity and user experience model. Digit. Creat. 32, 116–123. doi:10.1080/14626268.2021.1915339
Frich, J., MacDonald Vermeulen, L., Remy, C., Biskjaer, M. M., and Dalsgaard, P. (2019). Mapping the landscape of creativity support tools in HCI. New York, NY, USA: Association for Computing Machinery, 1–18.
Gallagher, C. L. (2017).sketching for ideation: A structured approach for increasing divergent thinking, Proceedings of the 2017 CHI Conference Extended Abstracts on Human Factors in Computing Systems, ’17. New York, NY, USA: Association for Computing Machinery, 106–111. doi:10.1145/3027063.3048424
Guilford, J. P. (1966). Measurement and creativity. Theory Into Pract. 5, 185–189. doi:10.1080/00405846609542023
Hao, N., Xue, H., Yuan, H., Wang, Q., and Runco, M. A. (2017). Enhancing creativity: Proper body posture meets proper emotion. Acta Psychol. 173, 32–40. doi:10.1016/j.actpsy.2016.12.005
Hartson, R., and Pyla, P. (2012). The UX book: Process and guidelines for ensuring a quality user experience. 1st edn. San Francisco, CA, USA: Morgan Kaufmann Publishers Inc.
Hassenzahl, M., Burmester, M., and Koller, F. (2003). AttrakDiff: Ein Fragebogen zur Messung wahrgenommener hedonischer und pragmatischer Qualität, 187. Wiesbaden: Vieweg. doi:10.1007/978-3-322-80058-9_19
Herrera, F., Bailenson, J., Weisz, E., Ogle, E., and Zaki, J. (2018). Building long-term empathy: A large-scale comparison of traditional and virtual reality perspective-taking. PLOS ONE 13, 1–37. doi:10.1371/journal.pone.0204494
Hu, X., Nanjappan, V., and Georgiev, G. V. (2021). Bursting through the blocks in the human mind: Enhancing creativity with extended reality technologies. Interactions 28, 57–61. doi:10.1145/3460114
Jetter, H.-C., Rädle, R., Feuchtner, T., Anthes, C., Friedl, J., and Klokmose, C. N. (2020). VR, everything is possible!”: Sketching and simulating spatially-aware interactive spaces in virtual reality, 1–16. New York, NY, USA: Association for Computing Machinery.
Kelley, T., and Kelley, D. (2013). Creative confidence: Unleashing the creative potential within us all (currency).
Kulkarni, C., Dow, S. P., and Klemmer, S. R. (2014). Early and repeated exposure to examples improves creative work. Cham: Springer International Publishing, 49. doi:10.1007/978-3-319-01303-9_4
Lallemand, C., Koenig, V., Gronier, G., and Martin, R. (2015). Création et validation d’une version française du questionnaire attrakdiff pour l’évaluation de l’expérience utilisateur des systèmes interactifs. Eur. Rev. Appl. Psychol. 65, 239–252. doi:10.1016/j.erap.2015.08.002
Lee, J. H., Ham, H.-G., Kim, M.-S., and Bae, S.-H. (2020). “3d sketching for multi-pose products: An interactive showcase,” in ACM SIGGRAPH 2020 labs (New York, NY, USA: Association for Computing Machinery). SIGGRAPH ’20. doi:10.1145/3388763.3407759
Lee, J. H., Yang, E., and Sun, Z. Y. (2021). Using an immersive virtual reality design tool to support cognitive action and creativity: Educational insights from fashion designers. Des. J. 24, 503–524. doi:10.1080/14606925.2021.1912902
Lin, Y., Guo, J., Chen, Y., Yao, C., and Ying, F. (2020). It is your turn: Collaborative ideation with a Co-creative robot through sketch, 1–14. New York, NY, USA: Association for Computing Machinery.
Lubart, T., Mouchiroud, C., Tordjman, S., and Zenasni, F. (2015). Psychologie de la créativité-2e édition (Armand Colin)
MacGregor, J. N., and Cunningham, J. B. (2009). The effects of number and level of restructuring in insight problem solving. J. Problem Solving 2, 15. doi:10.7771/1932-6246.1062
Madary, M., and Metzinger, T. K. (2016). Real virtuality: A code of ethical conduct. Recommendations for good scientific practice and the consumers of vr-technology. Front. Robot. AI 3, 3. doi:10.3389/frobt.2016.00003
Marsh, R. L., Landau, J. D., and Hicks, J. L. (1996). How examples may (and may not) constrain creativity. Mem. Cogn. 24, 669–680. doi:10.3758/BF03201091
Mille, C., Christmann, O., Fleury, S., and Richir, S. (2020). “Effects of digital tools feature on creativity and communicability of ideas for upstream phase of conception,” in Proceedings of the 4th international conference on computer-human interaction research and applications-CHIRA. INSTICC, SciTePress.
Okuda, S. M., Runco, M. A., and Berger, D. E. (1991). Creativity and the finding and solving of real-world problems. J. Psychoeduc. Assess. 9, 45–53. doi:10.1177/073428299100900104
Taft, R., and Rossiter, J. R. (1966). The remote associates test: Divergent or convergent thinking? Psychol. Rep. 19, 1313–1314. doi:10.2466/pr0.1966.19.3f.1313
Torrance, E. P. (1974). Torrance tests of creative thinking (Lexington, Mass. Xerox): Personnel Press.
Wilson, J. R. (1999). Virtual environments applications and applied ergonomics. Appl. Ergon. 30, 3–9. doi:10.1016/S0003-6870(98)00040-4
Yang, E. K., and Lee, J. H. (2020). Cognitive impact of virtual reality sketching on designers’ concept generation. Digit. Creat. 31, 82–97. doi:10.1080/14626268.2020.1726964
Yang, X., Lin, L., Cheng, P.-Y., Yang, X., Ren, Y., and Huang, Y.-M. (2018). Examining creativity through a virtual reality support system. Educ. Technol. Res. Dev. 66, 1231–1254. doi:10.1007/s11423-018-9604-z
Keywords: creativity and design thinking, virtual reality, user experience (UX), creative experience, digital tools for creativity
Citation: Houzangbe S, Masson D, Fleury S, Gómez Jáuregui DA, Legardeur J, Richir S and Couture N (2022) Is virtual reality the solution? A comparison between 3D and 2D creative sketching tools in the early design process. Front. Virtual Real. 3:958223. doi: 10.3389/frvir.2022.958223
Received: 31 May 2022; Accepted: 10 October 2022;
Published: 31 October 2022.
Edited by:
Weiya Chen, Huazhong University of Science and Technology, ChinaReviewed by:
Kelly S. Hale, Draper Laboratory, United StatesBill Pike, United States Army, United States
Rudolph P. Darken, Naval Postgraduate School, United States
Copyright © 2022 Houzangbe, Masson, Fleury, Gómez Jáuregui, Legardeur, Richir and Couture. This is an open-access article distributed under the terms of the Creative Commons Attribution License (CC BY). The use, distribution or reproduction in other forums is permitted, provided the original author(s) and the copyright owner(s) are credited and that the original publication in this journal is cited, in accordance with accepted academic practice. No use, distribution or reproduction is permitted which does not comply with these terms.
*Correspondence: Samory Houzangbe, aG91emFuZ2JlQGdtYWlsLmNvbQ==