
94% of researchers rate our articles as excellent or good
Learn more about the work of our research integrity team to safeguard the quality of each article we publish.
Find out more
ORIGINAL RESEARCH article
Front. Virtual Real., 19 August 2022
Sec. Virtual Reality and Human Behaviour
Volume 3 - 2022 | https://doi.org/10.3389/frvir.2022.943409
This article is part of the Research TopicCybersickness in VR applicationsView all 6 articles
 Nathan C. Sepich1,2
 Angelica Jasper1Stephen Fieffer2
 Stephen B. Gilbert1,2*
 Michael C. Dorneich1,2
 Jonathan W. Kelly1,3
This study explored the impact of task workload on virtual reality (VR) cybersickness. Cybersickness is a negative side effect of using VR to which many users are susceptible. Previous research on the impact on task workload on cybersickness has yielded no consistent relationships, but given that task workload requires attentional resources, it is worth further investigation of how a demand on attention might increase or decrease cybersickness. In this study, mental workload of participants (N = 151) was modified in three different task groups within the same virtual environment (VE). The Cybersickness Corn Maze VR testbed contained cybersickness-inducing stimuli and tasks with varying workload. The 0-Back group used a controller to select an object as a visual attention task. The 2-Back group performed the 2-Back memory detection task, using a controller to collect objects that matched the object presented two objects ago. The No-Task group passively moved through the environment and was not given a controller. Workload, cybersickness, dropout rate, presence, and task accuracy were compared across groups. Workload was found to be statistically significantly different in each group: highest in the 2-Back group, medium in the 0-Back group, and lowest in the No-Task group, validating the task design. Cybersickness in the 2-Back group was significantly higher than in the No-Task (140% higher) and 0-Back (54% higher) groups measured by the change in simulator sickness questionnaire (SSQ) total severity (Post SSQ - Pre SSQ). The rate of participants’ dropout due to cybersickness was significantly higher in 2-back (33%) as compared with 0-Back (10%), but 0-Back and No-Task dropout rates were not significantly different. These results indicate that 1) task workload affects cybersickness and 2) its effect could be based on a threshold of workload. Presence increased with the addition of a task but plateaued between the 0-Back and 2-Back groups, suggesting that presence can be affected by task workload but only to a certain extent. Task accuracy was shown to negatively correlate with cybersickness within the task groups. A relationship between workload and cybersickness was found and warrants further research into these concepts. This work highlights the need for task workload and attention to be studied as components of the mechanisms underlying cybersickness.
Cybersickness is the physical discomfort that can arise from virtual reality (VR) experiences, and it presents a barrier to the wide acceptance of the technology (Stanney et al., 2020). Because VR is used in a variety of industries including training, medicine, architecture, astronomy, data handling, teleoperation and entertainment (Kolasinski, 1995; Stanney et al., 2020), addressing cybersickness is critical. Cybersickness is similar to, but not the same as, motion sickness. Cybersickness occurs in a VR headset, usually while the user is stationary, while motion sickness stems from physical motion of the person. Cybersickness symptoms include stomach discomfort (e.g., burping, stomach awareness, salivation), oculomotor issues (e.g., headache, eyestrain, difficulty focusing, blurred vision), and general disorientation (e.g., dizziness, vertigo) (Stanney and Kennedy, 1997).
Researchers studying cybersickness have sought to understand its causes (Keshavarz et al., 2014; Chang et al., 2020; Stanney et al., 2020), develop measurement instruments (Davis et al., 2014; Chang et al., 2020), and identify possible mitigations (Kim et al., 2008; Nie et al., 2019; Jasper et al., 2020). However, existing research on causes of cybersickness frequently focuses on the hardware systems, e.g., latency or field of view, or on the dynamics of the imagery, e.g., with VR games rated Comfortable, Moderate, and Intense by Oculus (Fernandes and Feiner, 2016). While these factors are important, less research has focused on the impact of the user’s task and its associated mental workload on cybersickness. If this relationship were better understood, perhaps VR experiences could be designed with tasks that would effectively prevent users from becoming sick.
Tasks within VR provide context and purpose to a virtual experience. Previous literature has denoted the potential impact of tasks on cybersickness (Barrett, 2004; Chang et al., 2020). Two major characteristics of tasks have been investigated: duration and controllability (Chang et al., 2020). Duration of tasks is related to the amount of time users spend in the virtual environment, where longer exposures were found to produce more symptoms of cybersickness (Kennedy et al., 2000). Controllability can range between the user having no control (i.e., a passive experience) or active control within the environment (Stanney and Hash, 1998; Chen et al., 2011; Mittelstaedt et al., 2018; Farmani and Teather, 2020). Passive experiences have been found to induce more cybersickness than active experiences.
However, it can be argued that duration and controllability of a task have actually little to do with the nature of the task and its workload. The research about duration of VR exposure and cybersickness is usually independent of the task. Controllability could affect cybersickness by giving the user more ability to predict the outcomes of their actions or by simply engaging the user in a task vs requiring no task, but does not offer insight into how the workload of the task would affect cybersickness. Overall, the mechanism of how a task might affect cybersickness is unclear. Is it that the task requires attention, and the user therefore has fewer attentional resources to process cybersickness-inducing perceptual cues, per a model like Wickens et al.’s (2021) human information processing model? Or perhaps having a task increases users’ motivation or presence, which somehow overrides feelings of cybersickness? An engaging task may distract the user from the symptoms of cybersickness, similar to the use of VR as a pain management tool (Pourmand et al., 2018). Also, previous research showed that video games served as a nausea-reducing distraction for chemotherapy patients (Redd et al., 1987), and a cognitive task reduced motion sickness in participants being spun off-axis (Bos, 2015). Though these studies focused on a different type of sickness, the effectiveness of the distraction approaches suggest that adding a task may reduce cybersickness. However, one study more closely aligned with the present one, trying to distract participants from cybersickness with a video-game like task (Zhou et al., 2019), found no significant results.
Alternatively, per the information processing model, one might expect that if managing cybersickness is a task that requires attention itself, perhaps filtering out sickness-triggering visual inputs to maintain health or using attention to ignore sickness symptoms, then adding an additional task may reduce attentional resources available to maintain health, leading to greater cybersickness.
One way to measure the impact of a task is through overall workload, which is the total cognitive workload associated with a task, considering all potential sources and components (Hart and Staveland, 1988). Workload has several contributing factors: the task requirements, the circumstances under which tasks are performed (e.g., time-pressure), and the skills, behaviors, and perceptions of the operator (Hart and Staveland, 1988). There are several approaches to measure workload, such as the Bedford workload scale (Roscoe and Ellis, 1990) and the Instantaneous Self-Assessment (ISA) (Tattersall and Foord, 1996). The NASA-TLX, used in this study, is a self-report survey with subscales mental demand, physical demand, frustration, performance, temporal demand, and effort (Hart and Staveland, 1988).
Some research investigating a possible link between workload and cybersickness has been done. Meusel (2014), using an earlier instantiation of the Cybersickness Corn Maze, identified a positive correlation between mental workload and cybersickness. Park Jung, 2020, working with nursing students using a 360° immersive video trainer, and Venkatakrishnan et al. (2020) using a driving simulator, corroborated this positive correlation. However, Milleville-Pennel and Charron (2015), also using a driving simulator, found conflicting results that showed mental workload had a very low impact on sickness.
Souchet et al. (2021) conducted a literature review of papers related to VR and cognitive load and suggest that cognitive load can be affected by cybersickness, but they do not suggest a specific relationship. Wei et al., 2018 showed that participants who were less susceptible to visually-induced motion sickness (VIMS, which includes cybersickness and simulator sickness) performed better at a task and posited the reallocation of attention during vection (i.e., perceived illusory self-motion) as a possible explanation. Varmaghani et al. (2021) speculated about the reduction of spatial ability and attention and those factors’ impact on cybersickness, but found no significant correlations between cognitive performance and cybersickness. Based on these mixed results, the authors recommend that task workload be measured by default in future cybersickness studies, as recommended Gilbert et al. (2021).
Presence is the experience of “being there” within the virtual environment (Slater, 2003). There has been some confusion between the ideas of presence and immersion. Slater (2003) discusses the two terms and identifies immersion as what the technology delivers from an objective hardware point of view, which is identical across users. Slater (2003) then defines presence as the human reaction to immersion, which may vary between individuals.
A strong feeling of presence may help users fully engage themselves within a VR environment, which could potentially affect cybersickness. Weech et al.’s (2019) review on presence showed a consistently negative relationship between presence and cybersickness, such that users who perceived a greater presence in virtual environments experienced less sickness. Studies have shown this relationship to exist in different VR contexts such as nursing (Servotte et al., 2020), driving simulators (Venkatakrishnan et al., 2020) or older adult research (Dilanchian et al., 2021). However, not all studies concur. Melo et al. (2021) evaluated the effect of different types of roles within a VR experience and showed that participants with the most control and ability to explore within a game-like tasks experienced the highest levels of both presence and cybersickness.
Loading VR participants with a complex task may make them more likely to drop out of an uncomfortable experience, or it may increase their presence in the virtual environment, which has been shown to negatively correlate with cybersickness (Weech et al., 2019), thus keeping them engaged for longer. This study experimentally manipulated task workload to evaluate the effect of workload on presence and cybersickness.
In early iterations of simulators, participants who experienced motion sickness symptoms without physically moving were deemed to be simulator sick. Cybersickness, a close relative of simulator sickness, is also caused by a visual experience that is typically not associated with physical movement. Simulator sickness and cybersickness slightly differ in that cybersickness focuses on symptoms caused by using a VR headset or head-mounted display (HMD) and have been characterized by a subset of simulator sickness symptoms. Simulator sickness has been shown to have relationships with the following mental factors: previous experience with a real-world version of the task being simulated, mental rotation ability, degree of control, duration, among many other non-mental factors (Kolasinski, 1995). Cybersickness’ relationship to simulator sickness indicates the importance of mental factors when considering the causes of cybersickness. Also, its close relationship has led many researchers to use the SSQ, a measure of simulator sickness, to measure cybersickness.
Chang et al. (2020) reviewed 77 experimental studies and showed that the most widely used subjective measurement was the simulator sickness questionnaire (SSQ). The SSQ was developed based on the motion sickness questionnaire (MSQ) and verified with a series of factor analyses. Kennedy et al.’s (1993) SSQ has 16 items across three subscales (nausea, oculomotor, and disorientation) with answers from 0 to 3 related to participant sickness symptoms. A higher SSQ score in VR studies indicates the participant experienced more severe cybersickness. Other measures exist, but SSQ was chosen in this study because of its widespread acceptance (Stanney et al., 2020) and ability to capture the range of sickness symptoms.
This study includes the following four hypotheses. The first hypothesis suggests that increasing task workload will increase presence. This hypothesis is related to work from Dilanchian et al., 2021 that captured involvement and presence measures but did not draw specific conclusions about the relationship between them. This work predicts that as participants are given a higher task workload, they will experience more presence due to greater engagement in the VE. H1: Increased task workload will correspond to higher perceived presence.
The second hypothesis follows from previous work (Weech et al., 2019) that showed a negative relationship between presence and cybersickness: Participants with greater perceived presence in an environment felt less sick. H2: Presence will negatively correlate with cybersickness.
The third hypothesis builds on H1 and H2. Engagement in a VR task is expected to increase workload compared with a no-task control condition. Higher workload is hypothesized to cause greater presence (H1), which would then lead to lower sickness in the higher workload condition (H2). H3: Participants given a VR task will show higher levels of workload, presence, and lower levels of cybersickness than participants without a task.
Task performance is expected to follow an analogous bell-shaped trend to the Yerkes-Dodson Law (Cohen, 2011), which notes that an increase in arousal (or in this case, workload) will lead to an increase in task performance until the arousal (workload) becomes too high and inhibits performance. Also, cybersickness is expected to be negatively correlated with task performance. In a study of the impact of cybersickness on reaction time tests (Nalivaiko et al., 2015), higher nausea was associated with longer (worse) reaction times. H4: Performance in a game-based VR task will be negatively correlated with cybersickness.
The participant sample included 153 people (54 females, 94 males, three either non-binary or transgender, two prefer not to answer). Participants were at least 18 years old (M = 25.0, SD = 9.5), fluent in English, had normal or corrected to normal vision, and had no history of photosensitive seizure disorders. Participants were compensated with a $10 e-gift card.
Participants were passively navigated through the Cybersickness Corn Maze, a maze designed to induce cybersickness and present users with tasks of varying workload (https://github.com/isuvrac/CyberSickness-Cornmaze). The maze was a re-creation of a maze that was previously used to study the effects of a hand-eye coordination task on mitigating visually induced motion sickness (Meusel, 2014; Curtis et al., 2015). The sections of the maze were created based on tasks from the Virtual Environment Performance Assessment Battery (VEPAB; Lampton et al., 1994). The main structure of the maze was based on the “Turns” task, which consisted of many left and right 90° turns. This task was used by Meusel (2014) and Curtis et al. (2015) to induce sickness in participants. Other components were included in the maze to further induce sickness such as trampolines, optokinetic drums, nondescript ramps, and a spiral slide, which provide rotational and translational scene oscillations (O’Hanlon and McCauley, 1974; So and Lo, 1998). For this study, the maze was recreated with 3D corn plants, which differed from the original corn maze that had images of corn mapped onto walls.
Participants experienced the maze by progressing through turns and movements automatically (i.e., passively). Movement speed accelerated along straightaways up to 13 m/s and abruptly decreased to 0 m/s prior to each turn. Angular velocity during turns accelerated from 0 rpm (revolutions/minute) to 1 rpm. Throughout the maze, different animals appeared at 3-s intervals. These animals were used for the workload tasks that are explained below. The maze took approximately 7 min to complete one lap, and participants completed two laps during the study, for a total of 14 min of exposure (or less if they chose to exit the maze earlier). A top-down view of the maze, which consisted of two levels in order to include a downhill slide, can be seen in Figure 1. A view from within the maze is shown in Figure 2. Videos of the experiences had by each task group can be found in Supplementary Materials. This study was carried out in accordance with the Institutional Review Board of Iowa State University (protocol 21–345). All subjects gave written informed consent in accordance with the Declaration of Helsinki.
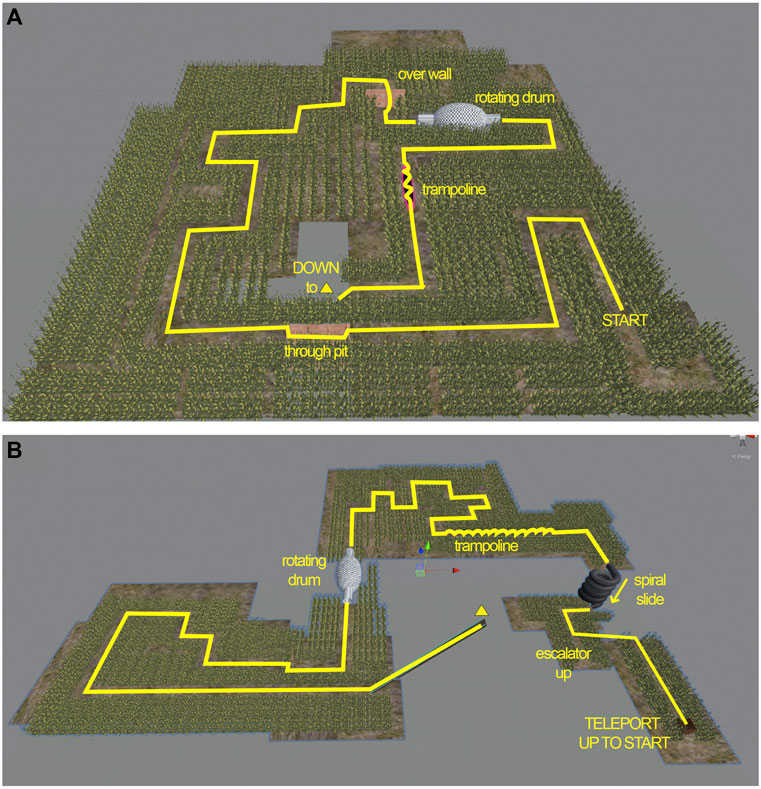
FIGURE 1. Top portion of the Cybersickness Corn Maze (A) and bottom portion of the maze (B). Participants began in the bottom right of the top portion at START and progressed through the maze until reaching DOWN to ▿, where they descended to the lower portion via the diagonal ramp. Participants travelled through the bottom portion of the maze until they experienced a dark grey spiral slide that put them briefly on a small even lower level, before ascending on an escalator ramp to the brown box, which then teleported them back to START.
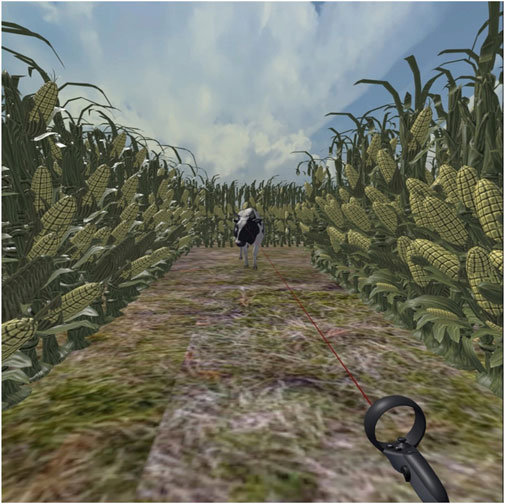
FIGURE 2. Screenshot of Cybersickness Corn Maze showing a cow that might need to be clicked.
Task load group was the IV. Participants were randomly assigned to one of three task load groups: 0-Back, 2-Back, and No-Task. In all three groups, animals appeared at 119 possible locations throughout the maze. There were three types of animals: skunks, cows, and pigs. Participants in the 0-Back group were tasked with “collecting” skunks by pointing and clicking with a controller on every skunk. Participants in the 2-Back group were required to remember the order of animals that they saw and only collect (click) an animal if it was identical to the one presented two animals back. The participants in both task groups were given a controller for their dominant hand to point and collect animals by using the back trigger (pulled with trigger finger). Immediate auditory feedback was provided to participants via a negative sound on errors and a positive sound on correct animal clicks. The No-Task group served as a control. Participants in this group passively watched the maze experience with no controller. Animals were still present to ensure they received the same visual stimulus experience in the maze as the other two groups, but participants were not able to interact with the animals. The sequence of animals was randomized separately for each participant, with each potential location having equal odds (1/3 chance) of being any of the three animals (skunk, cow, pig). The likelihood of any animal being a correct 2-back target was also 1/3, since for any given animal type two animals back, the current animal had a 1/3 change of matching it. Task load was manipulated between participants to prevent potential carryover effects of cybersickness symptoms across groups.
The primary DVs collected in this study were cybersickness, workload, immersion, and task performance (see Table 1). For cybersickness, SSQ scores were measured pre- and post-exposure to the VR environment. The SSQ survey was administered via 16 Likert scaled questions (ranging from 0 (no symptoms) to 3 (severe symptoms)) on a computer to determine how sick a participant was feeling (Kennedy et al., 1993). The SSQ total severity (TS) score was used in further analysis and was calculated per the original survey authors’ calculations. SSQ TS Δ (change from Post–Pre) was used as the final dependent variable. The pre-exposure SSQ (pre-SSQ) was administered early in the pre-survey to reduce potential priming (Tversky and Kahneman, 1973). The SSQ was administered again after the Maze Exposure phase (post-SSQ). In addition to SSQ, attrition rate (dropouts) of participants was also used as a measure of cybersickness.

TABLE 1. Dependent variables.
The NASA-TLX (Hart and Staveland, 1988) was administered to participants upon completion of the maze. The six questions consider mental demand, physical demand, temporal demand, effort, performance, and frustration. The questions assess workload on a 21-point scale varying from very low (1) to very high (21) or perfect (1) to failure (21) for performance. Total workload was calculated by adding the subscale scores. No weighting procedure was used to aggregate TLX scores (Moroney et al., 1992).
Additionally, an immersion questionnaire (Jennett et al., 2008) was collected to have a quantitative measure of participants’ immersion in the VE, with four-point Likert scaled questions. A final score was calculated by summing up the Likert responses, with questions 6, 8, 10, and 18 being reverse coded, with a min-max scoring range of 31–155.
The pre-survey included a question gauging participants’ amount of experience in VR in case that served as a moderating variable for the DVs: How often do you typically use a VR headset? (Daily, Several times a week, Once or twice a week, Once or twice a month, Once every few months, Never).
Task performance was calculated for the 0-Back and 2-Back groups, where errors included incorrect animals clicked (Type I error) and failing to click animals that were supposed to be clicked (Type II error). Overall accuracy in the task was calculated as the number of correct responses divided by the total possible responses ((total trials - total errors)/total trials), with a minimum of zero and maximum of one, where “trial” means the appearance of an animal. There were 238 possible trials across two laps of the maze (119 per lap), or fewer if participants dropped out, and thus performance was not penalized for stopping early. Misclicks were also tallied if a participant clicked in the scene but not on an animal. The Cybersickness Corn Maze software automatically calculated the performance of each participant and outputted data to a.csv file for later analysis.
Experimenters observed participants from a nearby desk to ensure participants attended to the maze. The study had four main phases: pre-exposure, training, maze exposure, and post-exposure, as shown in Figure 3.
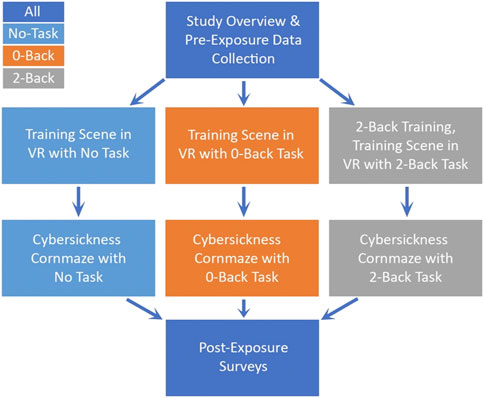
FIGURE 3. The between-subjects study procedure.
Upon arrival at the lab, participants first completed the informed consent form, followed by the pre-exposure surveys. After completing the pre-surveys, the participants were set up in the VR HMD, an Oculus Quest 1. This model was selected due to the greater stability provided by the head mounts than the Quest 2. The Quest 1 was linked to a PC running Windows 10 with a NVIDIA GeForce RTX 2060 SUPER graphics card. The experimenter measured the participant’s IPD with a ruler or the EyeMeasure phone app (https://apps.apple.com/us/app/eyemeasure/id1417435049). After getting the participant’s measurements, the experimenter calibrated the headset IPD setting to match the participant’s IPD. The headset was then given to the participant for them to put on while seated. The experimenter helped fit the HMD to the participant’s head properly to ensure no wobbling or undesired HMD movement during the study.
The participants were then shown instructions within the VR headset and were read instructions aloud to ensure they understood the task. After verifying the participant understood the instructions, the VR training started. This training involved no locomotion through the environment, though the participant did turn their head. While the participant remained in one place within the VE, animals appeared at 20 different locations in front of the player and allowed the player to target them with a laser pointer coming out of the controller and collect them by pulling the trigger on the controller if in the 0-Back or 2-Back groups. The No Task participants also experienced the appearance of animals but just observed. This VR training took less than 2 min. Participants were then asked if they had any questions before advancing to the maze. Note that participants in the 2-Back group, before their VR training began, experienced a 3–5 min non-VR training session on the concept of the 2-Back task using the website: https://www.psytoolkit.org/experiment-library/experiment_touch_nback2.html.
After completion of the training, the maze was started for the participants. The participants were moved through the maze experience with a pig, cow, or skunk appearing at a new location in front of them every 3 seconds. Periodically an animal appeared just around a corner, so exposure time was slightly reduced but still greater than 2 s. This variation of corner appearance, however, was identical for all participants, since all participants experienced the same animal appearance locations. Depending on the group, the participants had to point and collect animals throughout the maze, with the exception of the “No Task” group. Locomotion through the maze consisted of an uncontrolled roller coaster-like experience for up to 15 min. Participants were reminded prior to the experience that they could stop any time by removing the HMD, but that once the participant removed the HMD, they could not return to the maze.
After the participant removed themselves or completed the entire maze, they were then asked if they needed water or time to recover with an option to lie down on a nearby couch. After maze completion or recovery, participants returned to the same survey computer they used during Pre-Exposure. The participants filled out post-surveys including: a post-SSQ, an immersion questionnaire, and the NASA-TLX. Upon completion of the surveys, the participants were cleared to leave if they were feeling comfortable. Their $10 e-gift card was then emailed to them.
Per H1, increased task workload is expected to correlate with higher perceived presence. Previous work (Weech et al., 2019; Servotte et al., 2020) showed that increases in presence can reduce cybersickness experienced. Thus, an inverse relationship between presence and cybersickness is expected as stated in H2. Per H3, the No-Task group is expected to have the lowest perceived mental demand, temporal demand, effort and frustration, with the 0-Back group having more, and the 2-Back group having the most. The group that is predicted to have the most sickness is the No-Task group, with the other task groups showing less sickness. Previous work offers mixed results on the effect of mental workload on cybersickness, but in this study the complexity of the task is expected to distract participants from cybersickness-inducing virtual effects. Per H4, performance among participants is expected to be negatively correlated with sickness, such that higher performing individuals in the task group are expected to have a lesser experience of sickness symptoms. This expectation is due to the potential increased difficulty of the task if a participant is experiencing sickness symptoms. It is also expected that participants who are performing better are more immersed into the environment and the task, which has previously been shown to reduce cybersickness (Servotte et al., 2020).
A one-way ANOVA exploring the effect of task group was performed on the measures for cybersickness, workload, presence, and performance. Post hoc analyses using the Scheffé post hoc criterion for significance was used to determine the significance between task groups. Effect sizes for each comparison were measured using η2, for which 0.02 is considered a small effect, 0.13 is a medium effect, and 0.26 is a large effect (Cohen, 1988). Levene’s test of equality of variances was used to determine homogeneity of variance. Shapiro-Wilk test for normality was also used.
All assumptions of the ANOVA were met (continuous variables, categorical groups, independence of observations, outliers, normality (except for the SSQ TS Δ), and homogeneity of variance (except for the presence score and the SSQ TS Δ). It was noted that these violations were not a concern in the current study because the sample size in each group is similar (Laerd Statistics, 2017). Statistics for main effects and pairwise comparisons are described below.
The relationships between workload, presence, and cybersickness were evaluated using Pearson’s correlations. Some statistical analyses below have fewer participants than the total N = 153 due to participants not answering all survey questions.
Because the procedure allowed participants to recover before completing the post-SSQ, it is worth noting that the average recovery time was 0.53 min, with only 11 participants requiring more than 2.0 min of recovery. This recovery time could have affected results by lowering the post-SSQ score for some participants, but the authors felt this effect would not be large given the larger sample size.
Boxplots showing the data from each group are shown in Figure 4. The SSQ TS Δ was significantly different between the three groups F(2,147) = 9.41, p < 0.001, η2 = 0.11. The No-Task group (M = 24.7, SD = 27.5, n = 49) and the 0-Back group (M = 38.3, SD = 42.5, n = 51) were not significantly different (a mean difference of 13.6, 95% CI [−6.1, 33.3]). The 2-Back group (M = 59.1, SD = 46.6, n = 50) had significantly higher cybersickness than the No-Task group, with a mean difference of 34.4, 95% CI [14.7, 54.2] that was significant at p = 0.001. The 2-Back group also reported significantly higher cybersickness than the 0-Back group, with a mean difference of 20.8, 95% CI [1.2, 40.4] at p = 0.034.
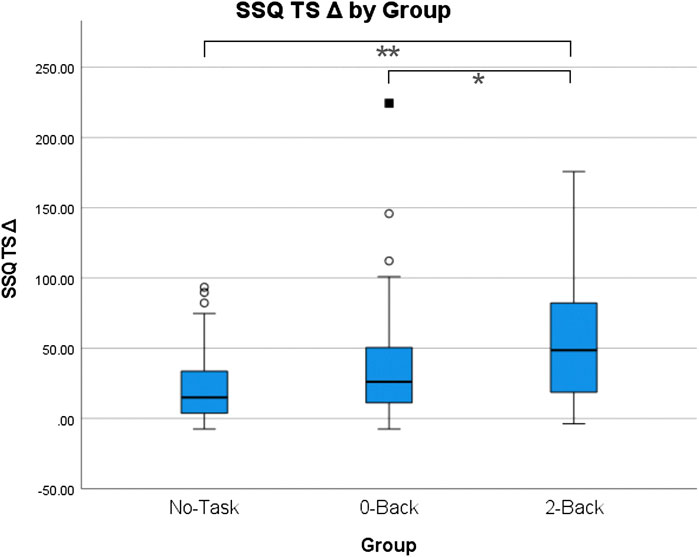
FIGURE 4. Boxplots of SSQ TS Δ by Group. * = significant difference at a p < 0.05 level; ** = significant difference at a p < 0.01 level.
During the study, participants were informed that if they felt too sick or uncomfortable to continue, they could permanently stop at any time. The percentage of dropouts (# of early stoppages/# of participants) are reported in Figure 5 for the No-Task (19%, 9/47), 0-Back (10%, 5/49), and 2-Back (33%, 17/51) groups. A chi-square test of homogeneity was conducted between group and early dropout (true/false) and found a statistically significant difference in proportions across the three groups, p = 0.017. Post hoc analysis involved pairwise comparisons using the z-test of two proportions with a Bonferroni correction. The percentage of dropouts in the 2-Back group was statistically significantly higher than the percentage of dropouts in the 0-Back group, p < 0.05. The differences between the No-Task group dropout percentage and the other groups were not statistically significantly different, p > 0.05.
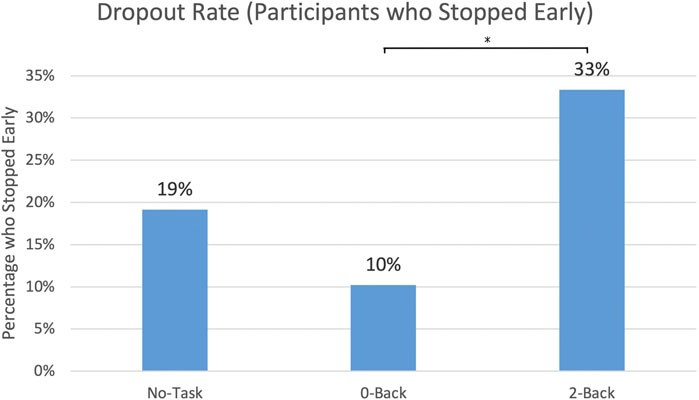
FIGURE 5. Dropout Rate by Group: the percent of participants who did not finish both laps of the Corn Maze. * = significant difference at a p < 0.05 level.
Boxplots comparing presence scores by group are shown in Figure 6. The presence measure was statistically significantly different for the different groups evaluated in this study, F(2,146) = 29.25, p < 0.001, η2 = 0.33. The 0-Back group (M = 67.2, SD = 12.7, n = 51) reported significantly higher levels of presence compared to the No-Task group (M = 46.3, SD = 18.6, n = 49) with a mean difference of 20.9, 95% CI [12.9, 28.9] at p = 0.001. The 2-Back group (M = 68.3, SD = 16.6, n = 49) then had higher presence than the No-Task group with a mean difference of 22.1, 95% CI [14.0, 30.1] at p = 0.001. The 0-Back and 2-Back groups were not significantly different (a mean difference of 1.2, 95% CI [−6.8, 9.1]).
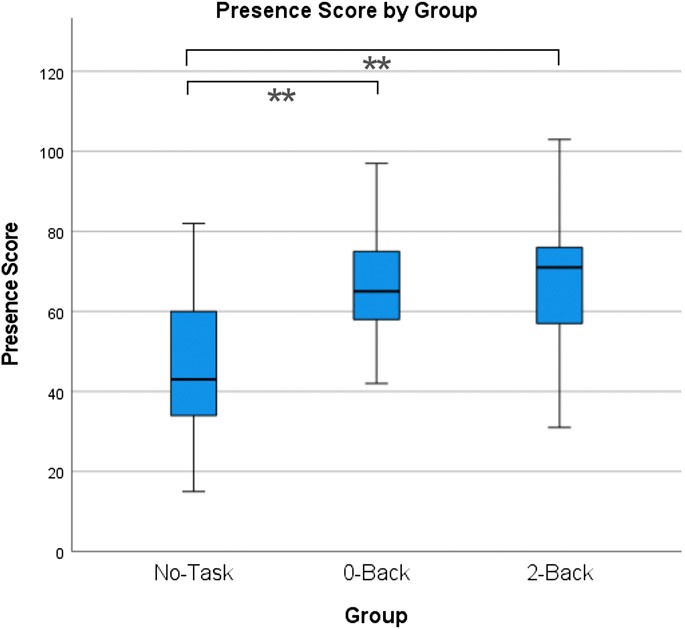
FIGURE 6. Boxplots of Presence scores by Group; ** = significant difference at a p < 0.01 level.
Workload by group is shown in Figure 7. Workload was statistically different for the groups F(2,136) = 67.25, p < 0.001, η2 = 0.50. The 0-Back group (M = 6.9, SD = 2.6, n = 50) indicated significantly higher workload than the No-Task group (M = 3.4, SD = 3.0, n = 42) with a mean difference of 3.5, 95% CI [2.0, 5.0], significant at p = 0.001. The 2-Back group (M = 10.7, SD = 3.3, n = 47) indicated significantly higher workload than the 0-Back group, with a mean difference of 3.8, 95% CI [2.3, 5.3] significant at p = 0.001. The 2-Back group also indicated significantly higher workload than the No-Task group with a mean difference of 7.3, 95% CI [5.7, 8.8] significant at p = 0.001.
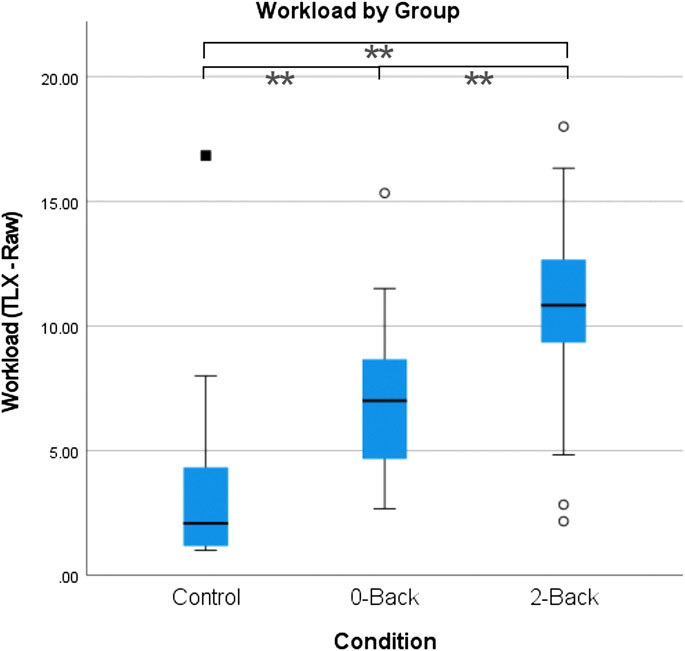
FIGURE 7. Workload by Group boxplots. ** = significant difference at a p < 0.01 level.
Analysis of task performance for the two task groups consisted of three different elements: task accuracy, misclicks, and response time. An ANOVA was performed to evaluate differences between the 0-Back and 2-Back groups. Regarding task accuracy, the 0-Back group (M = 1.0, SD = 0.022) demonstrated higher task accuracy than the 2-Back group (M = 0.8, SD = 0.1), F(1,97) = 66.93, p < 0.001, η2 = 0.41. Regarding misclicks, the 0-Back group (M = 46.3, SD = 29.4) performed a higher number of misclicks than the 2-Back group (M = 16.7, SD = 15.9), F(1,97) = 38.99, p < 0.001, η2 = 0.33. No significant difference was found between response times by group. Figure 8 compares the two task groups’ performance.
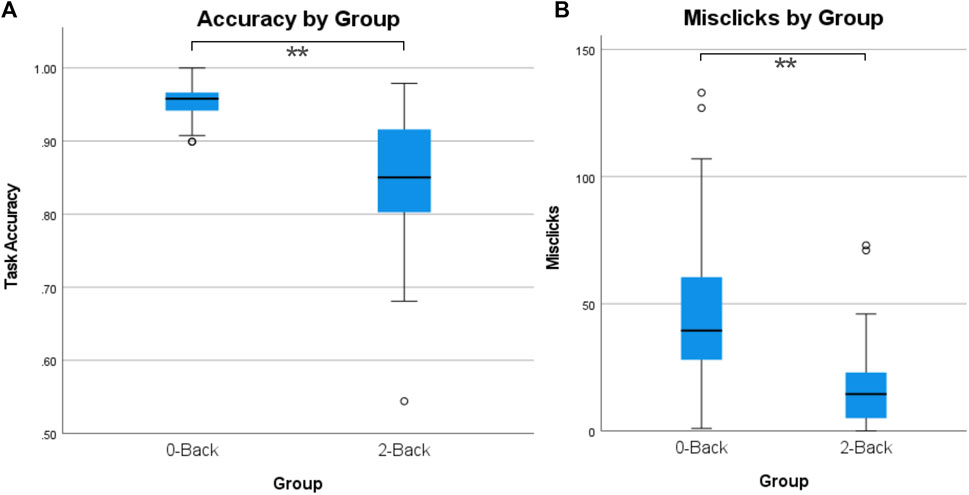
FIGURE 8. Maze task performance: (A) Accuracy by group; (B) misclicks by group.
Table 2 illustrates the Pearson’s correlation between workload, presence, and cybersickness for each or the three groups.
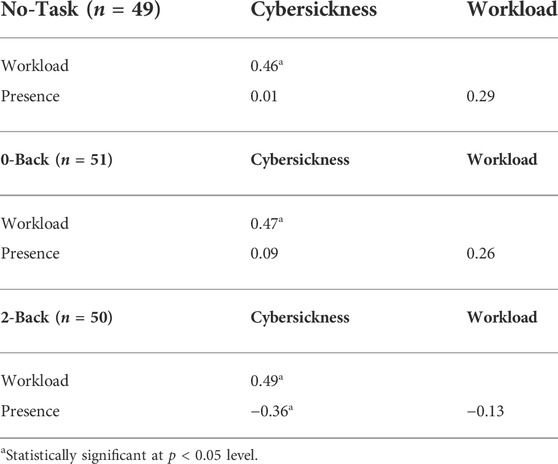
TABLE 2. Pearson’s product-moment correlations between cybersickness, workload, and presence by Group.
For the No-Task group, there was a statistically significant, positive correlation between cybersickness and workload, r(42) = 0.46, p < 0.002, with workload explaining 21% of the variation in cybersickness. The relationship between cybersickness and presence was also evaluated. There was a non-statistically significant correlation between cybersickness and presence, r(49) = 0.01, p = 0.936, with presence explaining less than 1% of the variation in cybersickness. Similarly, there was a non-statistically significant correlation between workload and presence, r(50) = 0.29, p = 0.066, with presence explaining 8% of the variation in workload.
For the 0-Back group, there was a statistically significant, positive correlation between cybersickness and workload, r(50) = 0.47, p < 0.001, with workload explaining 22% of the variation in cybersickness. The relationship between cybersickness and presence was also evaluated. There was a non-statistically significant correlation between cybersickness and presence, r(51) = 0.09, p = 0.542, with presence explaining less than 1% of the variation in cybersickness. Additionally, there was a non-statistically significant correlation between workload and presence, r(42) = 0.26, p = 0.073, with presence explaining 7% of the variation in workload.
For the 2-Back group, there was a statistically significant, positive correlation between cybersickness and workload, r(47) = 0.49, p < 0.001, with workload explaining 24% of the variation in cybersickness. Additionally, there was a statistically significant, moderate negative correlation between cybersickness and presence, r(49) = −0.36, p < 0.01, with presence explaining 13% of the variation in cybersickness. There was a non-statistically significant correlation between workload and presence, r(47) = −0.13, p = 0.384, with presence explaining 2% of the variation in workload.
Pearson’s correlations, shown in Table 3, were calculated to identify any relationships between the metrics of accuracy, misclicks, response time, presence, cybersickness, and workload. Analysis was completed on 3 subsets of the data: 0-Back group, 2-Back group, and both task groups combined (0-Back and 2-Back).
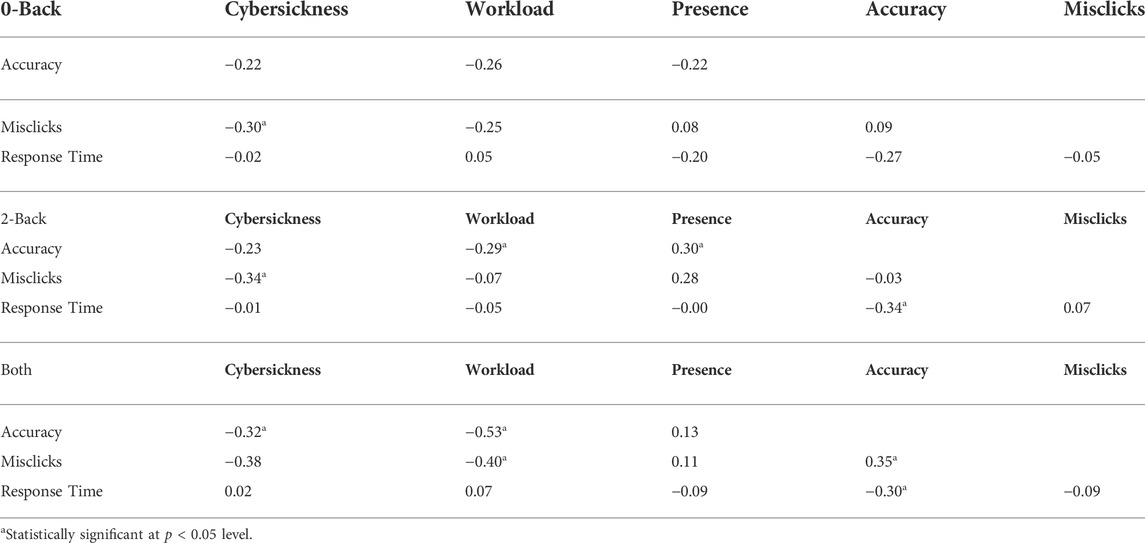
TABLE 3. Pearson’s correlations of performance metrics for 0-Back and 2-Back groups individually and combined.
Within the 0-Back group, there was a statistically significant negative correlation between cybersickness and misclicks, r(48) = −0.30, p = 0.041, with misclicks explaining 9% of the variation in cybersickness. No correlation between accuracy or response time was found to be significant for other variables of interest for 0-Back.
For the 2-Back group, there was a statistically significant negative correlation between cybersickness and misclicks, r(49) = −0.34, p = 0.016, with misclicks explaining 12% of the variation in cybersickness. There was a statistically significant correlation between accuracy and presence, r(48) = 0.30, p = 0.037, with presence explaining 9% of the variation in accuracy. A statistically significant negative correlation between workload and accuracy, r(46) = −0.29, p = 0.048, with workload explaining 9% of the variation in accuracy was found. Another statistically significant, negative correlation between accuracy and average response time, r(49) = −0.34, p = 0.017, with response time explaining 16% of the variation in accuracy was found. No additional statistically significant relationships were found for 2-Back participants.
For the combined dataset (0-Back and 2-Back), there were significant relationships. First, there was a negative correlation between sickness and accuracy, r(97) = −0.32, p = 0.002, with accuracy explaining 10% of the variation in cybersickness. Cybersickness also negatively correlated with misclicks, r(97) = −0.38, p < 0.001, with misclicks explaining 15% of the variation in cybersickness. Accuracy, r(93) = −0.52, p < 0.001) and misclicks, r(93) = −0.40, p < 0.001, also showed a significantly negative correlation with workload with accuracy accounting for 28% and misclicks accounting for 16% of the variance in workload. There was a statistically significant, correlation between accuracy and misclicks, r(98) = 0.35, p < 0.001 with misclicks explaining 12% of the variation in accuracy. There was a statistically significant, negative correlation between average response time and accuracy, r(97) = −0.30, p = 0.003, with response time explaining 9% of the variation in accuracy. No additional significant correlations were found for this group.
Based on data collected on the pre-survey about participants’ previous VR experience, sickness scores were collapsed into first time VR users (M = 38.6, SD = 39.3, n = 69) vs previous VR users, which included a range of categories from daily use to once every few months (M = 42.6, SD = 44.3, n = 81). A one-way ANOVA comparing sickness scores for these two groups found no significant difference, F(1,148) = 0.32, p = 0.570, η2 = 0.002.
An additional analysis of task accuracy was performed to explore whether there was a practice effect between the two maze laps for participants in the two task groups who completed both laps. Maze accuracy was calculated as the ratio of errors to the number of trials experienced; this method did not penalize participants who dropped out early. Lap Accuracy Δ (Lap 2 Accuracy – Lap 1 Accuracy) was calculated to determine differences between laps. Across both 0-Back and 2-Back groups, 62% of participants had higher accuracy on Lap 2, 8% of participants had the same accuracy on both laps, and 30% of participants had lower accuracy on Lap 2. An ANOVA was performed to determine if there were differences between the 0-Back group (M = 0.01, SD = 0.03) and the 2-Back group (M = 0.007, SD = 0.06), for the Lap Accuracy Δ. No significant difference was found F(1,86) = 0.14, p = 0.410, η2 = 0.002. Using Pearson’s correlation to assess the relationship between Lap Accuracy Δ and cybersickness, a significant small positive correlation was found, r(96) = 0.25, p < 0.019, with Lap Accuracy Δ explaining 21% of the variation in cybersickness. This finding means that sicker participants tended to perform better on the second lap, and vice versa: less sick participants performed worse on the second lap.
The hypothesized relationship between workload and presence was partially supported in this study. Manipulating task workload caused significant differences in presence, with both task groups (0-Back, 2-Back) experiencing higher presence than the No-Task group. However, presence did not differ significantly between 0-Back and 2-Back. Also, the correlations between workload and presence within the groups were not statistically significant. In future research, it may be worth exploring whether the relationship between presence and workload is affected by the difficulty of the task. Adding a task increased presence (moving from No-Task to 0-Back), but this effect plateaued rather than presence continuously increasing as the difficulty of the task increased.
It is worth considering the impact of the ongoing nature of the 0-Back and 2-Back tasks. Participants had to attend to them continuously throughout the Corn Maze experience. If these tasks had been more sporadic, perhaps with animals appearing only at certain times during the maze or once per minute, could the lower level of workload still have increased presence in comparison with the No-Task condition? The authors suggest that the answer is likely no: fewer animals would present less workload, less engagement, and less presence, leading the results for 0-Back and 2-Back to be closer to those of No-Task.
This relationship was partially supported. There was a significant negative correlation between presence and cybersickness in the 2-Back group. However, there was no significant correlation between presence and cybersickness in either the 0-Back or the No-Task group. Based on previous work (Dilanchian et al., 2021; Melo et al., 2021; Servotte et al., 2020; Weech et al., 2019, 2020), a negative correlation between presence and cybersickness was expected. The negative correlation between presence and cybersickness sickness symptoms in the 2-Back group suggests that presence has a greater benefit as task complexity increases. Since no correlation between presence and cybersickness was found for the 0-Back group, which did also include a task, this finding suggests that the impact of presence impact on cybersickness may depend on the type of task being conducted in VR. Also, because the existence of a presence/cybersickness correlation differed between the 0-Back and 2-Back groups, it suggests that presence alone is not enough to mediate sickness symptoms; the task is likely involved. However, the nature of that involvement remains unclear. This finding also suggests that for experiences where high workload and high sickness are possible, increasing the presence of the user may be important for keeping sickness low. It may also imply that in contexts with a risk of cybersickness, it may not be possible to design a high workload task that does not increase cybersickness.
This hypothesis H3 was partially supported. Sickness was significantly higher in the 2-back group compared to the No-Task group but did not differ between No-Task group and the 0-Back group. This implies that the 2-Back group had something different about their experience that made them sicker. That difference is likely the notable increase in workload of the 2-Back task, which required greater attentional resources and use of working memory than the 0-Back task, as shown by the lower performance scores in the 2-Back task. Workload, originally assumed to reduce sickness from H1, was shown to be a key differentiator for the 2-Back task from the 0-Back task. From these results, one may infer that increasing workload beyond a certain point definitively increases cybersickness experienced. This result aligns with results by Venkatakrishnan et al. (2020), in which their structured equation model noted a correlation between higher workload in a VR driving task and higher cybersickness. In that study, participants drove around a virtual city seeking a series of landmarks, a visual search task that included some memory aspects, combined with a driving task, which used both visual and psychomotor resources. That driving task placed an arguably high demand on attentional resources, similar to the 2-Back task. The current authors suggest that if the driving task had been simpler, the results might have mirrored those of the present study, with the 0-Back task’s workload reducing discomfort. There may be a task workload threshold, past which cybersickness begins to increase. It may be that after that threshold, a portion of attentional capacity or workload capacity becomes allocated to the task and is no longer available to manage cybersickness. These results suggest that a mechanism exists such that adding a simple task reduces discomfort in VR experiences, but a more complex task increases the discomfort. Although the threshold cannot be identified from the current work, these results may help constrain the possible solution space for the mechanism. Future work should seek to explain 1) where that threshold is, 2) what types of tasks exist below that threshold, and 3) how the threshold differs between individual users.
Increased presence was hypothesized to reduce sickness per previous work (Weech et al., 2019). It was thought that increases in workload would further immerse participants, and thus increased workload, leading to higher presence, would decrease sickness. The results demonstrated that adding a lower-demand task alone did increase presence without increasing sickness, but adding a higher-demand task did have adverse effects on both sickness and dropout rates, confirming previous work by Meusel (2014). Also, adding a task (comparing No-Task to 0-Back) significantly changed neither the sickness experienced, nor the dropout rate. For the participants in the 0-Back group, it is possible that as users became more engaged and involved with the experience, the task may have helped them mitigate or cope with cybersickness symptoms they were experiencing. Anecdotally, one No-Task participant supported this idea with the quote, “I feel like if I had had something else to think about, I would’ve been fine.” This investment and engagement also coincided with tracking of misclicks, which correlated negatively with cybersickness. These results, showing that a low demand task (0-Back) had lower sickness and dropouts, while the higher demand task (2-Back) made people sicker, are worth comparing with those of Bos (2015), in which participants experiencing off-vertical axis rotation and performing a moderately demanding auditory memory task, closer to the 2-Back task, grew less motion sick. This difference could arise from the different sources of sickness and their demand on attentional resources. In the rotation context, the motion sickness arises without visual attention, while in VR, cybersickness is visually induced (VIMS). Perhaps with the rotation, participants had more available attentional resources to focus on the task, and could thus be more distracted from motion sickness, while in the Corn Maze VE, participants had fewer attentional resources available for the task due to the effort of processing the visual input of the VE. Thus, when the higher-demand 2-Back task was added, participants were overwhelmed. It could also be that the Bos (2015) task was lower demand than the 2-Back task, and thus didn’t surpass a demand threshold after which participants begin to grow sicker. Instead, the Bos (2015) task could have worked more like the 0-Back task, offering distraction without overload.
One additional consideration is that presence might have been heightened by a participant having active control of movement through the Corn Maze, rather than moving passively. Active movement would likely have increased both presence and workload, as demonstrated by Venkatakrishnan et al. (2020), so results in the current study could have been quite different. For example, the 0-Back task, at which participants demonstrated good performance with passive control, might have become less achievable with some attentional resources dedicated to controlling movement. The 2-Back task, which challenged some participants greatly, would become even more difficult with active control. For example, the nature of this task with 3-s animal appearances would require nearly expert navigation to even see the animals in a timely fashion. On the other hand, these tasks might have become better distractions from cybersickness due to the increased difficulty.
H4 was partially supported by the results. For each task group individually, no direct relationship between sickness and task accuracy was found, but for both active task groups combined (0-Back and 2-Back), a negative correlation was found. This correlation does not imply a causal relationship, however, as it is not obvious if performing well at the task made participants less sick, or if being less sick made participants perform better.
Participants’ levels of cybersickness also showed a significant negative correlation with misclicks for the 0-Back and 2-Back groups. This performance measure captured how many times participants clicked but it was not on an animal. As a result, misclicks may give some insight into how curious or invested they were in the game. More engaged players may have clicked multiple times as they attempted to click animals, resulting in a lot of extra clicking to ensure they hit the target. This sort of investment may be considered to be a proxy measure of presence and thus coincide with the negative correlation between cybersickness and presence found for the 2-Back participants. Being more invested or involved in the gameplay helped players reduce sickness experienced.
The analysis of performance differences on Lap 1 vs Lap 2 revealed a positive correlation between cybersickness and performance improvement on Lap 2. This finding means that sicker participants tended to perform better on the second lap, and vice versa (less sick participants performed worse on Lap 2). This finding seems counterintuitive. One explanation may be that some participants used cybersickness mitigation strategies (such as holding the head still rather than visually following the turns) which successfully reduced their sickness but also reduced their task performance, since they no longer saw animals sitting just around the corner of a turn until too late. Another explanation is that managing and preventing cybersickness is an attention-demanding task, and with limited attention resources, participants had to choose between higher task performance or attenuating cybersickness, and they couldn’t do both. A third explanation could be that some participants were highly committed to performing well on the task, despite the sickness, and simply endured it, growing sicker while scoring well. Just as with the misclicks, this explanation points to the possible impact of participant motivation on cybersickness, suggesting that a technique for increasing participation engagement or motivation for a task might make cybersickness more tolerable.
When Kahneman (2017) popularized the labels for two ways of thinking: System 1 and System 2, he noted that System 1 thoughts, like “That person is angry,” just happen to you—you don’t typically consciously decide to evaluate the feelings of someone nearby. System 2 thinking, on the other hand, allocates attention to mental activities that require more effort, e.g., multiplying two three-digit numbers, and typically involves a conscious decision to focus on that task. Presence has more recently been conceptualized as a feeling that happens to you, or as the place illusion that you experience (Slater, 2009), like System 1 thinking. However, it is worth considering the overlap between presence and the motivated engagement described above. For example, early descriptions of presence by Witmer and Singer (1998) included the concept of “involvement,” a state of focused attention on a set of activities, somewhat similar to flow (Csikszentmihalyi and Rathunde, 1993). Witmer and Singer noted that the involvement could relate to the concept of selective attention (Treisman, 1964), in which attention is focused on information that is most meaningful to the individual. They posited that involvement could occur any setting (not just VR), but that in the context of VR, both involvement and immersion were necessary for the feeling of presence to arise. Finally, they noted that individual differences play a large role in the experience of presence, and offered the Immersive Tendencies Questionnaire (ITQ) as a scale for measuring the capability of an individual to become involved. The ITQ includes items that indicate a more active conscious approach to involvement rather than it simply happening to a person, e.g., “How good are you at blocking out external distractions when you are involved in something?” and “How well do you concentrate on enjoyable activities?” The authors suggest that consideration of both user motivation for the task and ability to choose to become “involved” (the active choice of experiencing presence) be included as variables in future cybersickness studies.
Previous research (Norman, 2013) has suggested that using more System 1 processing reduces mental workload. Additionally, that research suggested that when subjected to distractions that occupy working memory, individuals benefit from being able to rely more on System 1 if they can (automaticity). This reliance on System 1 during high workload may be why gamers experience less cybersickness. If users are highly present, and their System 1 is handling interactions with the VE (including the possible cybersickness-inducing cues), they will have more attentional resources available to process the task (System 2) and could handle higher workload. Dinet and Kitajima, 2018 previously noted the possible connection between perception of virtual environments with Systems 1/2 thinking. Hofer et al. (2020) identified presence as the output of the subconscious processing of System 1, which is tightly connected to perceptual information. Hartmann et al. (2015) suggested potential for System 1 information processing to be modified by overarching System 2 processes, implying that a top-down attitude, motivation, or mindset could affect perceptual information processing (potentially reducing cybersickness). In the context of this study, the incorporation of a task may shift individuals from a System 1 focus (passively riding a through the corn maze and taking in the surroundings) to a System 2 focus (performing a working memory task). This shift from the subconscious mind (System 1), which is potentially more susceptible to sensory mismatches and coherence about the inconsistencies that exist with VR, to System 2, where deeper thought and focus is occurring, might reduce cybersickness.
The usage of working memory offers another lens for considering these different levels of processing. Through a series of studies, Beilock and others (e.g., Beilock and Carr, 2001; Beilock et al., 2002) noted that professional athletes’ focused attention in athletic tasks was sometimes counterproductive, leading to over-analysis and preventing the person from using well-practiced behaviors. The athletes performed better when not focusing conscious attention to their tasks, which allowed their highly practiced behaviors to emerge. Similarly, in the current study, it may be possible that attention to a task in VR could reduce cybersickness by reducing the conscious attention focused on the sickness-inducing visual cues.
Previous research has shown that a past history of video game play can predict lower cybersickness (Rebenitsch and Owen, 2014). Additionally, work from (Weech et al., 2020) showed that the effect of a narrative on cybersickness is impacted by previous gaming experience. Those results could also be possibly explained by System 1/System 2 or working memory theories, in that users’ previous gaming experience could, in effect, reduce the cognitive load of engaging with the VE due to their automaticity of engaging with game-like VEs. In future cybersickness research, it will be useful to consider how the task in the study relates to tasks with which VR gamers are experienced, which may predict whether they will adopt a System 1 approach (more automatic, using less working memory) or a System 2 approach (intentionally focused, using more working memory).
Returning to the question of whether presence happens to you or can be intentionally evoked, it is worth considering concepts related to intentional engagement. An example of such a concept is “willing suspension of disbelief” (Coleridge, 1952) in which people know that something is not real (such as in fiction novels or movies) but suspend that disbelief in order to become more immersed in an experience or fictional narrative (Schaper, 1978). Willing suspension of disbelief allows for readers, or in our case VR users, to interpret experiences as closer to reality than they are. More recent work has discussed the concept of “media awareness” (awareness that the experience is media and not real) and suggested that media awareness and presence work together to define a simulated experience (Hartmann and Hofer, 2021). This idea may give insight into why users’ previous experience with VR or previous video game experience has been shown to negatively correlate with reported cybersickness (e.g., Freitag et al., 2016). It could be that users who must focus on familiarizing themselves with novel controllers and new locomotion paradigms, etc., have less ability to suspend disbelief or lower media awareness since they must actively attend to the logistics of simply existing in the VE, rather than experiencing it more naturally. Turner (2016) identifies “make-believe” tendencies, akin to the immersive tendencies described by Witmer and Singer (1998), as a plausible psychological mechanism that may indicate higher level cognitive processes impacting presence. If willing suspension of disbelief is a higher-level cognitive process, and not an attentional task that demands workload, then a person with a greater capability to suspend disbelief and greater sense of presence could be in some sense shielded from cybersickness-inducing cues, and additional task workload would not affect sickness.
Key limitations of the research include subjective measures and lack of head tracking data. One of the largest limitations of this research is the use of subjective measures to track the three main constructs of interest which were cybersickness, workload, and presence. While there is not yet a wide consensus on a reliable objective measure of cybersickness, there are several recent contenders, such as using eye gaze and head movement within the HMD (Islam et al., 2021), eye gaze and game character movement (Wang et al., 2022), and VE smoothness of movement (Monteiro et al., 2021) to predict cybersickness successfully. Measures such as these, or even an additional self-report measure such as the fast motion sickness scale (FMS) (Keshavarz and Hecht, 2011) could have been useful to triangulate with SSQ. In addition to subjective measures, this study did not utilize any HMD head tracking logging to identify different trends in postural sway. Finally, priming the participants to be aware of cybersickness symptoms is a problem unique to studies in this area. Due to IRB obligations, the consent form included language indicating potentially negative symptoms being experienced in during the study. However, in this study, Pre-SSQ scores were consistently low, so while this was not a substantial concern for this study, the priming effect still may have been present.
The overall conclusion from this research is that changes in workload impact cybersickness and presence experienced in VR environments. Results showed that the addition of a simple task increased the presence experienced in VR significantly and did not significantly increase sickness or dropout rates, while a more complex task made individuals sicker at consistently higher rates. Overall performance of the task was also negatively correlated with cybersickness, increasing the importance of reducing cybersickness if high task performance is required. These results should be considered moving forward in cybersickness research. Put simply: the task required in virtual experiences matters.
Future work should evaluate task workload across different VR experiences, such as games or other immersive applications, to identify exactly what form of task (e.g., visual, auditory, cognitive, psychomotor) affects cybersickness the most, and whether there is an ideal task to raise a sense of presence without overwhelming users. The exact mechanism that caused the impact of the task workload could be further studied, to identify whether managing cybersickness is an attention-demanding task in itself.
Head tracking data within tasks could provide interesting results between task groups and show how differing tasks result in different amounts of postural sway and thus the causes of varying sickness levels between tasks. Future work should also aim to strategically capture previous gaming experience as a factor related to cybersickness. Cybersickness research in general should consider the importance of replicating commercial VR usage habits (such as playing a game). Additionally, researchers should use VR specific control mechanisms (e.g., head tracking, controllers that accompany the HMD) to ensure generalizability of results.
Future studies might also replicate the approach of this study to examine the impact of first-person perspective (1 PP) vs third-person perspective (3 PP) on presence and cybersickness. Several studies have examined the impact of perspective on presence and found differing results (e.g., Denisova and Cairns, 2015; Gorisse et al., 2017), but that issue could perhaps be clarified using the procedure of this study. One preliminary study (Monteiro et al., 2018) suggested 3 PP with an avatar to focus on led to less sickness based on the same principle as reducing sickness by providing steady object in the view frame such as a virtual nose (Wienrich et al., 2018), but the preliminary study had a small sample size with no statistical significance. A larger study could be conducted to explore that hypothesis.
The relationship between attention, workload, presence, and cybersickness discussed in this work identifies an opportunity for new research. A structural equation modeling (SEM) approach might be useful for predicting outcomes based on the simultaneous relationships between all of these factors, for example. Also, the results in this work indicate that a mechanism exists that makes adding a task reduce discomfort in VR experiences. Future work should further explore this mechanism to identify if people can be trained or experiences can be designed to take advantage of this reduction. From the results in this work, it may be that a portion of attentional or workload capacity is used by the body to manage cybersickness symptoms.
The datasets presented in this study can be found in the repository at https://osf.io/29ufh/.
The studies involving human participants were reviewed and approved by Iowa State University Institutional Review Board. The patients/participants provided their written informed consent to participate in this study.
NS, AJ, MD, JK, and SG contributed to conception and design of the study. NS and AJ led the data collection and data analysis, assisted by SF. NS wrote the first draft of the manuscript. SG wrote sections of the manuscript and led the revision process. All authors contributed to manuscript revision, read, and approved the submitted version.
This research was supported by faculty authors and the Iowa State University Virtual Reality Applications Center.
Thanks to Abigail Bolt and Kelli Williams for data collection, and to the original virtual Corn Maze creators, Michael Curtis, Kayla Dawson, Kelli Jackson, and Liat Litwin.
The authors declare that the research was conducted in the absence of any commercial or financial relationships that could be construed as a potential conflict of interest.
All claims expressed in this article are solely those of the authors and do not necessarily represent those of their affiliated organizations, or those of the publisher, the editors and the reviewers. Any product that may be evaluated in this article, or claim that may be made by its manufacturer, is not guaranteed or endorsed by the publisher.
Beilock, S. L., Carr, T. H., MacMahon, C., and Starkes, J. L. (2002). When paying attention becomes counterproductive: Impact of divided versus skill-focused attention on novice and experienced performance of sensorimotor skills. J. Exp. Psychol. Appl. 8 (1), 6–16. doi:10.1037/1076-898x.8.1.6
Beilock, S. L., and Carr, T. H. (2001). On the fragility of skilled performance: What governs choking under pressure? J. Exp. Psychol. General 130 (4), 701–725. doi:10.1037/0096-3445.130.4.701
Bos, J. E. (2015). Less sickness with more motion and/or mental distraction. J. Vestib. Res. 25 (1), 23–33. doi:10.3233/ves-150541
Chang, E., Kim, H. T., and Yoo, B. (2020). Virtual reality sickness: A review of causes and measurements. Int. J. Human–Computer. Interact. 36, 1658–1682. doi:10.1080/10447318.2020.1778351
Chen, Y.-C., Dong, X., Hagstrom, J., and Stoffregen, T. A. (2011). Control of a virtual ambulation influences body movement and motion sickness. BIO Web Conf. 1, 00016. doi:10.1051/bioconf/20110100016
Cohen, J. (1988). Statistical power analysis for the behavioral sciences. Lawrence Erlbaum Associates.
Cohen, R. A. (2011). “Yerkes–dodson Law,” in Encyclopedia of clinical neuropsychology. Editors J. S. Kreutzer, J. DeLuca, and B. Caplan (New York, NY: Springer), 2737–2738.
Csikszentmihalyi, M., and Rathunde, K. (1993). “The measurement of flow in everyday life: Toward a theory of emergent motivation,” in Nebraska symposium on motivation, 1992: Developmental perspectives on motivation (Lincoln, NE, US: University of Nebraska Press), 57–97.
Curtis, M. K., Dawson, K., Jackson, K., Litwin, L., Meusel, C., Dorneich, M. C., et al. (2015). Mitigating visually induced motion sickness A virtual hand-eye coordination task. Proc. Hum. Factors Ergonomics Soc. Annu. Meet. 59 (1), 1839–1843. doi:10.1177/1541931215591397
Davis, S., Nesbitt, K., and Nalivaiko, E. (2014). “A systematic review of cybersickness,” in Proceedings of the 2014 conference on interactive entertainment (Newcastle, NSW, Australia: Association for Computing Machinery).
Denisova, A., and Cairns, P. (2015). “First person vs. third person perspective in digital games: do player preferences affect immersion?,” in Proceedings of the 33rd annual ACM conference on human factors in computing systems, 145–148.
Dilanchian, A. T., Andringa, R., and Boot, W. R. (2021). A pilot study exploring age differences in presence, workload, and cybersickness in the experience of immersive virtual reality environments. Front. Virtual Real. 2. doi:10.3389/frvir.2021.736793
Dinet, J., and Kitajima, M. (2018). “Immersive interfaces for engagement and learning: Cognitive implications,” in Proceedings of the virtual reality international conference-laval virtual), 1–8.
Farmani, Y., and Teather, R. J. (2020). Evaluating discrete viewpoint control to reduce cybersickness in virtual reality. Virtual Real. 24 (4), 645–664. doi:10.1007/s10055-020-00425-x
Fernandes, A. S., and Feiner, S. K. (2016). “Combating VR sickness through subtle dynamic field-of-view modification,” in 2016 IEEE symposium on 3D user interfaces (3DUI)), 201–210.
Freitag, S., Weyers, B., and Kuhlen, T. W. (2016). Examining rotation gain in CAVE-like virtual environments. IEEE Trans. Vis. Comput. Graph. 22 (4), 1462–1471. doi:10.1109/TVCG.2016.2518298
Gilbert, S. B., Jasper, A., Sepich, N. C., Doty, T. A., Kelly, J. W., and Dorneich, M. C. (2021). “Individual differences & task attention in cybersickness: A call for a standardized approach to data sharing,” in 2021 IEEE conference on virtual reality and 3D user interfaces abstracts and workshops (VRW) (IEEE), 161–164.
Gorisse, G., Christmann, O., Amato, E. A., and Richir, S. (2017). First-and third-person perspectives in immersive virtual environments: Presence and performance analysis of embodied users. Front. Robot. AI 4, 33. doi:10.3389/frobt.2017.00033
Hart, S. G., and Staveland, L. E. (1988). Development of NASA-TLX (task load index): Results of empirical and theoretical research. Hum. Ment. workload 1, 139–183.
Hartmann, T., and Hofer, M. (2021). I know it is not real (and that matters) media awareness vs. Presence in a parallel processing account of the VR experience. PsyArXiv. doi:10.31234/osf.io/a2ykd
Hartmann, T., Wirth, W., Vorderer, P., Klimmt, C., Schramm, H., and Böcking, S. (2015). in Spatial presence theory: State of the art and challenges AheadImmersed in media. Editors M. Lombard, F. Biocca, J. Freeman, W. IJsselsteijn, and R. Schaevitz (Mahwah, NJ: Lawrence Erlbaum Associates).
Hofer, M., Hartmann, T., Eden, A., Ratan, R., and Hahn, L. (2020). The role of plausibility in the experience of spatial presence in virtual environments. Front. virtual real. 1. doi:10.3389/frvir.2020.00002
Islam, R., Desai, K., and Quarles, J. (2021). “Cybersickness prediction from integrated HMD’s sensors: A multimodal deep fusion approach using eye-tracking and head-tracking data,” in 2021 IEEE international symposium on mixed and augmented reality (ISMAR) (IEEE), 31–40.
Jasper, A., Cone, N., Meusel, C., Curtis, M., Dorneich, M. C., and Gilbert, S. B. (2020). Visually induced motion sickness susceptibility and recovery based on four mitigation techniques. Front. Virtual Real. 1, 22. doi:10.3389/frvir.2020.582108
Jennett, C., Cox, A. L., Cairns, P., Dhoparee, S., Epps, A., Tijs, T., et al. (2008). Measuring and defining the experience of immersion in games. Int. J. Hum. Comput. Stud. 66 (9), 641–661. doi:10.1016/j.ijhcs.2008.04.004
Kennedy, R. S., Lane, N. E., Berbaum, K. S., and Lilienthal, M. G. (1993). Simulator sickness questionnaire: An enhanced method for quantifying simulator sickness. Int. J. Aviat. Psychol. 3 (3), 203–220. doi:10.1207/s15327108ijap0303_3
Kennedy, R. S., Stanney, K. M., and Dunlap, W. P. (2000). Duration and exposure to virtual environments: Sickness curves during and across sessions. Presence. (Camb). 9 (5), 463–472. doi:10.1162/105474600566952
Keshavarz, B., Hecht, H., and Lawson, B. D. (2014). “Visually induced motion sickness: Characteristics, causes, and countermeasures,” in Handbook of virtual environments. Editors K. S. Hale, and K. M. Stanney (Boca Raton: CRC Press), 551–560.
Keshavarz, B., and Hecht, H. (2011). Validating an efficient method to quantify motion sickness. Hum. Factors 53 (4), 415–426. doi:10.1177/0018720811403736
Kim, Y. Y., Kim, E. N., Park, M. J., Park, K. S., Ko, H. D., and Kim, H. T. (2008). The application of biosignal feedback for reducing cybersickness from exposure to a virtual environment. Presence Teleoperators Virtual Environ. 17 (1), 1–16. doi:10.1162/pres.17.1.1
Laerd Statistics (2017). “One-way ANOVA using SPSS Statistics,” in Statistical tutorials and software guides.
Lampton, D. R., Knerr, B. W., Goldberg, S. L., Bliss, J. P., Moshell, J. M., and Blau, B. S. (1994). The virtual environment performance assessment Battery (VEPAB):Development and evaluation. Presence. (Camb). 3 (2), 145–157. doi:10.1162/pres.1994.3.2.145
Melo, M., Gonçalves, G., Narciso, D., and Bessa, M. (2021). “Impact of different role types and gender on presence and cybersickness in immersive virtual reality setups,” in 2021 international conference on graphics and interaction (ICGI)), 1–8.
Meusel, C. (2014). Exploring mental effort and nausea via electrodermal activity within scenario-based tasks.
Milleville-Pennel, I., and Charron, C. (2015). Do mental workload and presence experienced when driving a real car predispose drivers to simulator sickness? An exploratory study. Accid. Analysis Prev. 74, 192–202. doi:10.1016/j.aap.2014.10.021
Mittelstaedt, J., Wacker, J., and Stelling, D. (2018). Effects of display type and motion control on cybersickness in a virtual bike simulator. Displays 51, 43–50. doi:10.1016/J.DISPLA.2018.01.002
Monteiro, D., Liang, H.-N., Tang, X., and Irani, P. (2021). “Using trajectory compression rate to predict changes in cybersickness in virtual reality games,” in 2021 IEEE international symposium on mixed and augmented reality (ISMAR) (IEEE), 138–146.
Monteiro, D., Liang, H. N., Xu, W., Brucker, M., Nanjappan, V., and Yue, Y. (2018). Evaluating enjoyment, presence, and emulator sickness in VR games based on first-and third-person viewing perspectives. Comput. Animat. Virtual Worlds 29 (3-4), e1830. doi:10.1002/cav.1830
Moroney, W. F., Biers, D. W., Eggemeier, F. T., and Mitchell, J. A. (1992). “A comparison of two scoring procedures with the NASA task load index in a simulated flight task,” in IEEE 1992 national aerospace and electronics conference), 734–740.
Nalivaiko, E., Davis, S. L., Blackmore, K. L., Vakulin, A., and Nesbitt, K. V. (2015). Cybersickness provoked by head-mounted display affects cutaneous vascular tone, heart rate and reaction time. Physiology Behav. 151, 583–590. doi:10.1016/j.physbeh.2015.08.043
Nie, G.-Y., Duh, H. B.-L., Liu, Y., and Wang, Y. (2019). Analysis on mitigation of visually induced motion sickness by applying dynamical blurring on a user's retina. IEEE Trans. Vis. Comput. Graph. 26, 2535–2545. doi:10.1109/TVCG.2019.2893668
Norman, G. (2013). Working memory and mental workload. Adv. Health Sci. Educ. Theory. Pract. 18, 163–165. doi:10.1007/s10459-013-9451-y
O’Hanlon, J. F., and McCauley, M. E. (1974). Motion sickness incidence as a function of the frequency and acceleration of vertical sinusoidal motion. Aerosp. Med. 45, 366–369.
Park Jung, H. (2020). Correlation between cognitive load, vividness and cyber sickness for 360-degree education video. Int. J. Adv. Cult. Technol. 8 (4), 89–94. doi:10.17703/IJACT.2020.8.4.89
Pourmand, A., Davis, S., Marchak, A., Whiteside, T., and Sikka, N. (2018). Virtual reality as a clinical tool for pain management. Curr. Pain Headache Rep. 22 (8), 53. doi:10.1007/s11916-018-0708-2
Rebenitsch, L., and Owen, C. (2014). “Individual variation in susceptibility to cybersickness,” in Proceedings of the 27th annual ACM symposium on user interface software and technology: Association for computing machinery), 309–317.
Redd, W. H., Jacobsen, P. B., Die-Trill, M., Dermatis, H., McEvoy, M., and Holland, J. C. (1987). Cognitive/attentional distraction in the control of conditioned nausea in pediatric cancer patients receiving chemotherapy. J. Consult. Clin. Psychol. 55 (3), 391–395. doi:10.1037/0022-006x.55.3.391
Roscoe, A. H., and Ellis, G. A. (1990). A subjective rating scale for assessing pilot workload in flight: A decade of practical use. United Kingdom: Royal Aerospace Establishment Farnborough.
Schaper, E. (1978). Fiction and the suspension of disbelief. Brit. J. Aesthet. 18 (1), 31–44. doi:10.1093/bjaesthetics/18.1.31
Servotte, J. C., Goosse, M., Campbell, S. H., Dardenne, N., Pilote, B., Simoneau, I. L., et al. (2020). Virtual reality experience: Immersion, sense of presence, and cybersickness. Clin. Simul. Nurs. 38, 35–43. doi:10.1016/J.ECNS.2019.09.006
Slater, M. (2009). Place illusion and plausibility can lead to realistic behaviour in immersive virtual environments. Phil. Trans. R. Soc. B 364 (1535), 3549–3557. doi:10.1098/rstb.2009.0138
So, R. H. Y., and Lo, W. T. (1998). “Cybersickness with virtual reality training applications: A claustrophobia phenomenon with headmounted displays?,” in First world congress on ergonomics for global quality and productivity.
Souchet, A. D., Philippe, S., Lourdeaux, D., and Leroy, L. (2021). Measuring visual fatigue and cognitive load via eye tracking while learning with virtual reality head-mounted displays: A review. Int. J. Human–Computer. Interact. 38, 801–824. doi:10.1080/10447318.2021.1976509
Stanney, K., and Hash, P. (1998). Locus of user-initiated control in virtual environments: Influences on cybersickness. Presence. (Camb). 7 (5), 447–459. doi:10.1162/105474698565848
Stanney, K., and Kennedy, R. (1997). The psychometrics of cybersickness. Commun. ACM 40 (8), 66–68. doi:10.1145/257874.257889
Stanney, K., Lawson, B. D., Rokers, B., Dennison, M., Fidopiastis, C., Stoffregen, T., et al. (2020). Identifying causes of and solutions for cybersickness in immersive technology: Reformulation of a research and development agenda. Int. J. Human–Computer. Interact. 36 (19), 1783–1803. doi:10.1080/10447318.2020.1828535
Tattersall, A. J., and Foord, P. S. (1996). An experimental evaluation of instantaneous self-assessment as a measure of workload. Ergonomics 39 (5), 740–748. doi:10.1080/00140139608964495
Treisman, A. M. (1964). Selective attention in man. Br. Med. Bull. 20 (1), 12–16. doi:10.1093/oxfordjournals.bmb.a070274
Turner, P. (2016). Presence: Is it just pretending? AI Soc. 31 (2), 147–156. doi:10.1007/s00146-014-0579-y
Tversky, A., and Kahneman, D. (1973). Availability: A heuristic for judging frequency and probability. Cogn. Psychol. 5, 207–232. doi:10.1016/0010-0285(73)90033-9
Varmaghani, S., Abbasi, Z., Weech, S., and Rasti, J. (2021). Spatial and attentional aftereffects of virtual reality and relations to cybersickness. Virtual Real. 26, 659–668. doi:10.1007/s10055-021-00535-0
Venkatakrishnan, R., Venkatakrishnan, R., Anaraky, R. G., Volonte, M., Knijnenburg, B., and Babu, S. V. (2020). “A structural equation modeling approach to understand the relationship between control, cybersickness and presence in virtual reality,” in 2020 IEEE conference on virtual reality and 3D user interfaces (VR) (IEEE), 682–691.
Wang, J., Liang, H.-N., Monteiro, D., Xu, W., and Xiao, J. (2022). Real-time prediction of simulator sickness in virtual reality games. IEEE Trans. Games 14 (8), doi:10.1109/tg.2022.3178539
Weech, S., Kenny, S., Lenizky, M., and Barnett-Cowan, M. (2020). Narrative and gaming experience interact to affect presence and cybersickness in virtual reality. Int. J. Human-Computer Stud. 138, 102398. doi:10.1016/j.ijhcs.2020.102398
Weech, S., Kenny, S., and Barnett-Cowan, M. (2019). Presence and cybersickness in virtual reality are negatively related: A review. Front. Psychol. 10 (158). doi:10.3389/fpsyg.2019.00158
Wei, Y., Zheng, J., and So, R. H. (2018). Allocating less attention to central vision during vection is correlated with less motion sickness. Ergonomics 61 (7), 933–946. doi:10.1080/00140139.2018.1427805
Wickens, C. D., Helton, W. S., Hollands, J. G., and Banbury, S. (2021). Engineering psychology and human performance. New York, NY: Taylor & Francis.
Wienrich, C., Weidner, C. K., Schatto, C., Obremski, D., and Israel, J. H. (2018). “A virtual nose as a rest-frame-the impact on simulator sickness and game experience,” in 2018 10th international conference on virtual worlds and games for serious applications (VS-Games) (IEEE), 1–8.
Witmer, B. G., and Singer, M. J. (1998). Measuring presence in virtual environments: A presence questionnaire. Presence. (Camb). 7 (3), 225–240. doi:10.1162/105474698565686
Keywords: virtual reality, cybersickness, task, workload, attention, presence, performance
Citation: Sepich NC, Jasper A, Fieffer S, Gilbert SB, Dorneich MC and Kelly JW (2022) The impact of task workload on cybersickness. Front. Virtual Real. 3:943409. doi: 10.3389/frvir.2022.943409
Received: 13 May 2022; Accepted: 18 July 2022;
Published: 19 August 2022.
Edited by:
Hai-Ning Liang, Xi’an Jiaotong-Liverpool University, ChinaReviewed by:
Rohith Venkatakrishnan, Clemson University, United StatesCopyright © 2022 Sepich, Jasper, Fieffer, Gilbert, Dorneich and Kelly. This is an open-access article distributed under the terms of the Creative Commons Attribution License (CC BY). The use, distribution or reproduction in other forums is permitted, provided the original author(s) and the copyright owner(s) are credited and that the original publication in this journal is cited, in accordance with accepted academic practice. No use, distribution or reproduction is permitted which does not comply with these terms.
*Correspondence: Stephen B. Gilbert, Z2lsYmVydEBpYXN0YXRlLmVkdQ==
Disclaimer: All claims expressed in this article are solely those of the authors and do not necessarily represent those of their affiliated organizations, or those of the publisher, the editors and the reviewers. Any product that may be evaluated in this article or claim that may be made by its manufacturer is not guaranteed or endorsed by the publisher.
Research integrity at Frontiers
Learn more about the work of our research integrity team to safeguard the quality of each article we publish.