 Felix J. Thiel
 Anthony Steed
- Virtual Environments and Computer Graphics, Department of Computer Science, University College London, London, United Kingdom
Virtual Reality (VR) games are not as accessible as conventional video games because they heavily rely on the motion of the body as the main means of input. This causes large accessibility issues because it prevents some physically impaired players from using them. It also makes it more difficult to develop accessibility tools to address the issues. Given these challenges, it is of particular importance that an impaired player can determine whether they will be able to play a game before they buy it. We propose the first prototype of a metric that aims at visually presenting the important aspects of the body motion that a game requires. Instead of manual classification, the metric is based on data captured from able-bodied players that play the game as designed. In this work, we introduce the metric itself, demonstrate how it differentiates six popular VR games based on data we collected in a user study, and discuss limitations and routes for further development.
1 Introduction
With cheaper devices and more polished experiences, Virtual Reality (VR) is steadily gaining traction. One of its main drivers are VR games that offer a more immersive experience than regular video games displayed on a conventional screen. However, as with any medium gaining more widespread use, the issue of accessibility is also gaining in importance. With regular video games, the importance of accessibility has been well established. As described by Heron (2016), video games, as any other medium, is not something that is just consumed and then set down. People want to talk about their experience with a game, how it made them feel, and what they thought about it. If these mediums are even partly inaccessible it not only excludes individuals from certain experiences, but also from connecting with their peers through them. Past studies by Beeston et al. (2018), Mott et al. (2020), and Gerling et al. (2020) have shown that impaired players have a similar taste in games as their able counterparts and that they are similarly excited about VR games.
Accessibility in VR presents a new set of challenges that make it more difficult for developers to apply techniques already known from regular video games. The largest of these challenges is how the actions of the player are characterised. With regular video games, player input can be seen as commands that are executed by the game character. This allows the player to use a simple-to-learn action, such as pressing a button on a keyboard or gamepad, to perform a complicated in-game action such as performing a riposte in fencing that requires a great deal of dexterity and training in reality. It also allows for easy replacement of input schemes because a command can also be triggered by another button or when a certain threshold on an analogue axis is met. This process is usually called “remapping” and is often utilised by organisations such as AbleGamers1 or Special Effects2 to provide physically impaired players with access to games. Such efforts usually involve developing a setup of buttons and triggers that the impaired player can operate (e.g. by using other limbs, gaze, or even their tongue) and map the commands of the input devices to the game’s commands. Another upside of this abstraction of complex actions into simple input commands is that they, and their respective remappings, can be easily transferred to other games because the only change necessary is to which new in-game action the existing input commands are mapped. While in one game the button press may trigger a riposte, in another game it might have the character reloading their weapon. While both motions are fundamentally different and require different strength and dexterity, the requirements for the player in front of the video game remain the same and they can use the same remapping for both games.
In VR games, however, this abstract layer between the player outside of the game and the game character inside of the game is mostly removed by using the player’s body as the input device. This allows for far greater immersion in the action of the game but also causes accessibility issues. For once, the requirements to the players are changing drastically. While the press of a button was enough to perform the riposte before, the player now has to extend their arm and move their body weight forward in a similar way a real fencer would. In the same sense, to reload their weapon in a VR game, the player needs to remove the current magazine from the gun, retrieve a new one from their body, and insert it. Where both actions in a regular video game could be initiated with the same button press, they now require a different set of motions involving more limbs and a higher complexity. Another aspect of this example is that VR games require a much wider spectrum of capabilities from the player. The VR fencing game will require swift, wide, and fast arm movements while the shooter will require precise and fast, but spatially limited, movements. With these requirements being much higher and much more varied than with traditional video games, it is of particular importance that players have a good tool to judge whether they will be able to play a specific game before they purchase it. With regular games, it is already customary to have a section on the store page that lists which input devices are supported by the game. However, due to the aforementioned abstraction of the control interface, this section is focused on the physical input device i.e. whether the game supports a gamepad, a steering wheel, or a mouse and keyboard. Transferred to the domain of VR, this would only cover that motion controllers with 6-degrees-of-freedom tracking are required. This information would not be sufficient for a player whether they can play the fencing game or the shooter.
Instead of a metric that centres around the input device itself, we are proposing a motion-centric metric that breaks down the motions required by the game in a way that a potential buyer can get an impression of the physical requirements of the game. As this approach would be much harder to realise manually, we are also proposing that the metric is informed by real-world data captured from unimpaired players playing the game as it was designed. Currently, this is mainly used to inform the design of the metric but it has the potential to be automated and scaled to the size of a virtual storefront such as Steam with thousands of games in its catalogue.
Such a motion-centric metric could be integrated into online stores such as Steam or hosted by a third party to provide players with an impression of the physical requirements of the game before purchasing it. The information for a single game can be used on its own if they are aware of how their own abilities refer to the metric or they could compare the requirements of the game in question with the ones of a game that they know they can play. The computational nature of this metric would allow a deployment to a large number of games at the same time without requiring much human curation as long as a sufficient amount of motion capture data is provided. This data could potentially be collected (in anonymised form) by the game platform itself, guaranteeing that the requirements are always reflecting the current state of the game even if it changes through future updates. Another use of the metric is that it can serve for developers to benchmark the requirements of their game and how it compares to other games available. This can then be used to determine aspects that may cause accessibility issues and address them by adding accessibility tools or alternative play modes.
2 Related Work
At the moment, there are no official accessibility ratings or metrics deployed in online store systems such as Steam, Origin or Uplay. External reviews of individual game and game systems are created by non-profit organisations such as AbleGamers3, Special Effect4, and DAGER System5, but they lack integration in store systems, a uniform rating scheme, and can only cover the most popular releases due to their limited resources which also meant that VR titles are rarely covered. National rating systems such as the ESRB in the US or the PEGI in Europa are widespread in use but do not consider accessibility in their ratings.
In the space of games, digital and physical, attempts have been made to close this gap by researchers developing accessibility evaluation methods. Pesántez-Cabrera et al. (2020) developed an evaluation method of how accessible serious games are to older adults. For this, the authors proposed an accessibility model and an evaluation method that takes inspiration from existing guidelines such as the Game Accessibility Guidelines (GAG) by the International Game Developers Association and ISO/IEC standards. Their method is split into four main activities: Establishing the evaluation requirements, where the essential features and requirements of the game are specified. Specifying the evaluation, where the metrics are picked to test the requirements. Designing the evaluation, where the evaluation is planned and prepared and technical aspects are specified. And lastly, executing the evaluation, where the plan is performed and the data collected. Their design allows tailoring the metrics very closely to the game’s character which allows for more detailed results than a one-size-fits-all solution such as our approach. This is very well suited for their purpose, which is finding accessibility barriers and classifying accessibility problems during development. However, it comes at the cost of being able to compare the accessibility of different games because different metrics would be chosen for them. Another limitation of their approach is that the quality of the result is linked to how well the requirements and metrics were picked in the first two steps. Heron et al. (2018b) attempted to develop a toolkit for the evaluation of the accessibility of tabletop games. Their proposed toolkit breaks the assessment down into six key sections: Visual impairments, cognitive impairments, physical impairments, communication impairments, socioeconomic impairments, and intersectional issues where particular combinations of impairments may have additional impact. Their section about physical accessibility is closest to the role of our proposed metric for the VR space, but their assessment differs in two aspects: First, movements are only one part of the assessment for physical accessibility together with the size of game tokens, physical acting, and the size of game board elements. Second and foremost, the authors’ toolkit is based around a single person or a group of people assessing the game along the categories it provides while our proposed metric is based on a computational analysis of motion capture data. The benefit of this over manual assessment is that it is not vulnerable to bias introduced by the subjective perspective of a reviewer or differences in expectations between different reviewers. Another issue of the manual approach is that it is very difficult for it to keep up with the publication schedule of new games while a computational approach together with automatic data collection requires less human intervention. Heron et al. (2018a) acknowledge these weaknesses in a follow-up publication while also pointing out that even with these limitations, their metric was successful in highlighting issues and lead to multiple collaborations with publishers and designers.
While not used for the development of a VR game accessibility metric before, analysis of motion capture data has been performed before for other purposes. Nagymáté and Kiss (2018) reviewed works that utilised motion capturing systems for human movement analysis. A few examples will be discussed here. Most commonly, motion capturing is used as a quantitative measure to compare changes in an identical or at least very similar motion between conditions or participants. Chung et al. (2016) used their motion capturing system to investigate potential improvements in gait after the use of an exercise machine for people that underwent surgery on their lower limbs. They had the patients walk a distance of 5 m with and without the exercise device and calculated joint angles from the captured motion data for one full gait cycle. This data then was compared by using a paired t-test. Nishida et al. (2017) used motion capturing for a comparison of muscle movements during running with different foot strike patterns. From the system, they acquired kinematic data that they then used to calculate the foot strike angle and muscle synergies. Comparisons were done using cosine similarity analysis and paired t-tests. Using motion capture data this way allows for a good comparison of changes in motion but it requires that the motion is the same or at least very similar. This can not be guaranteed in our case because different games will require very different motions. Instead, our proposed metric is an attempt to compute a “footprint” of the occurring motions on a common basis so that games can be compared to each other.
However, motion capturing can also be employed to detect changes in the motion’s character between conditions. For this, it is not required that the motions are similar. Maes and Leman (2013) used movement analysis to confirm quantitatively that the choreography of their “happy” condition was more expressive than the one of their “sad” condition. They had their participants dance these choreographs and compared different aspects such as positions and velocities in search of statistically significant differences. In this way, they found that in the “happy” condition, the movements of their participants were faster, more accelerated, and more impulsive. They also found that they expanded their upper limbs more, rotated more around the vertical axis, and more distance was covered in both the horizontal and the vertical direction. Giraud et al. (2016) conducted a similar study where they evaluated the impact of different moods on movement expressivity during a fitness task. For this, they collected motion capture data of 20 participants and analysed that motion by computing movement qualities inspired by the Effort and Shape dimensions of the Laban Movement Analysis by von Laban and Ullmann (1971). The authors state that computing time-series originating from this effort-shape space allows for a comprehensive and systematic approach to describing the characteristics of movements. Complex movements can be summarised and interpreted with a small set of parameters. The qualities used were Impulsiveness, Energy, Directness, Jerkiness, and Expansiveness. The data was analysed using Principal Component Analysis and Generalised Linear Mixed Models and they found that an aroused mood was strongly associated with increased mean energy, that a positive mood was associated with more impulsive movements and that a negative mood was associated with more tense movements. Using motion capture data this way does not rely on a similarity of the motions and with its focus on finding differences between different motions, we used it as a starting point in developing our accessibility metric.
3 Materials and Methods
3.1 The Metric
The basis for the development of our accessibility metric was the work by Giraud et al. (2016) and their five qualities of movement form the basis of our five measures. However, since our use case of computing movement profiles for VR games as an accessibility metric differs from theirs, some modifications were done to fit our case.
For the motion profile of the game, five measures are computed: Impulsiveness, Energy, Directness, Jerkiness, and Expansiveness.
3.1.1 Impulsiveness
The measure of Impulsiveness is used to assess the intensity and frequency of rapid accelerations and decelerations. For it, the velocity and time data from each pair of neighbouring data points are taken and the net acceleration is calculated as seen in Eq. 1 for every point in time. In this first prototype, the mean of the series was chosen to represent both the intensity and frequency of the impulses with a larger value representing movements with high net accelerations occurring more frequently.
The measure is limited in that it applies to both accelerations and decelerations equally. This trade-off was made for the simplicity and readability of the chart.
3.1.2 Energy
The measure of Energy is used to assess the extent and frequency of strong movements. For calculation, the formula of kinetic energy is applied (see Eq. 2) to each data point in time. This requires incorporating the mass of the respective limb, mlimb, that is used in the motion. Winter (2009) gives the mass of members as a proportion of the bodyweight with the head and neck together as 8.1% of the body weight and a whole arm as 5% of the whole body weight. For the calculations, a uniform body weight of 70 kg is assumed for all the participants. In this first prototype, the mean of the series was chosen to represent both the strength and frequency of the movements with larger values representing stronger movements that occur more frequently.
One weakness of this measure is the assumption of the body weight. To calculate values that most accurately depict the reality, the actual weight of the participant would have needed to be recorded before the session. While this would still be possible with individual participants in the lab, this will not scale well with large online data collection and is unrealistic for a potentially automatic deployment in store interfaces. As the metric is meant as an approximation of what the game might expect, we consider using a uniform weight to be an appropriate approximation.
3.1.3 Directness
The measure of Directness is used to assess the relation of hand movements to the head movement and whether these movements are performed independently. The Directness series is calculated by taking the dot product of the normalised velocity vectors for the head and each hand at each point in time see Eq. 3. If the movement between the hand and the head are directly related, the trajectories will be moving in parallel directions and the dot product’s value will be close to one. If the two trajectories go in different directions, the value will be closer to zero. In this first prototype, the mean of the series was chosen to represent both the extent and frequency of the Directness of the game.
3.1.4 Jerkiness
The measure of Jerkiness is assessing the curvature of the trajectory with the aim to differentiate small and intricate motions (e.g. in a puzzle game) from large and wide motions (e.g. in a fencing game). For this, the curvature equation (see Eq. 4) is used to calculate a jerkiness value for each point in time. As a measure, the mean of the series was taken to represent the complexity of motions and how often they occur.
While the curvature equation performs well in the experiment by Giraud et al. (2016), it does come with a downside: curvature values spike for very slow movements. This is likely not much of an issue in their original application with dance analysis, but occurred quite frequently during our data processing due to players keeping their head or hands still either because the game required it in some capacity or simply by standing relaxed while waiting for a level to load. For this, we had to filter the data so that all movement under 0.005 m/s was set to zero.
3.1.5 Expansiveness
The measure of Expansiveness is assessing how much the players “expanded” their body during the gameplay i.e. whether the hand movements were performed far away from the body or close to it. For this, the volume of the 3d ellipsoid is calculated that contains the points for the head and hands and is centred around a calculated centre point that is placed 20 cm below the head position. This volume is calculated for each point in time (see Eq. 5). The mean and the standard deviation of the series then form two measures for two axes in the final graph. The mean signifies the usual expansion a player can expect while the standard deviation signifies how much the requirement of the game to the expansion varies. This split into two values was required since games with very different movement profiles achieved very similar results in early testing. On closer inspection of the data, it was revealed that one game had the majority of its motion in a very close range while the other game had motion across the whole range, with the mean incidentally falling into the range of the first game. While their means were very similar, the deviations did differ greatly, leading to the introduction of the second axis.
3.2 Data Processing and Visualisation
In the first step, the series for each of the five measures described above were calculated. For Impulsiveness, Energy, and Jerkiness this produced three series each; one for the head and two for the two hands. Directness and Expansiveness only produce one series each as they already incorporate the head and both hands. In the second step, for Impulsiveness, Energy, and Jerkiness, the two series for the two hands are combined into one covering both hands. In the third step, the final values are calculated. For Impulsiveness, Energy, and Jerkiness, there are two means each for the series covering the hands and the series covering the hands. For Directness and Expansiveness, the mean can be calculated directly without separation of hand and head data. For Expansiveness, the standard deviation is computed as well.
To visualise the acquired values, we chose a combination of two radar charts. One will display the measures calculated from the hand data (Impulsiveness, Energy, and Jerkiness) and from the whole body (Directness and Expansiveness). The second one will display the measures calculated from the head data (Impulsiveness, Energy, and Jerkiness). This particular form of a graph was chosen because it allows for the comparison of a small number of games in the same chart without sacrificing too much readability.
3.3 Data Collection
The data was collected in a lab-based study in our facilities at UCL. The experiment was advertised to students currently undertaking courses at the department. This was a limitation caused by the ongoing Covid-19 pandemic. On arrival, the participants would fill in a short demographic questionnaire before getting a short introduction to the VR system, a Vive Pro. They then had 55 min to play any game they wanted from the list provided. They were not required to play the same game for the full duration and could switch at any time by notifying the experimenter. For each game they played, they filled in a short questionnaire to measure their familiarity with the game before starting it. While they played, their motion data was recorded using an application developed by us. The command line application was written in C++ and interfaces with the OpenVR API to acquire the position and input data of the VR system. This data was then written to the hard drive at regular intervals. The code for the application is open source and available in a public repository6. No instructions were given to the participants during the play sessions to encourage them to explore the games on their own. After the session, the participants were invited to book another session and try different games. Nine out of the 16 participants came for more than one session with one returning four times. For a returning participant, the demographic questionnaire would be skipped from the second session on.
3.4 The Games
For the experiment, we chose seven popular VR games that we were familiar with and that we considered different from each other. Beat Saber is a fast rhythm game where the player needs to slice blocks with their swords in swift consecutive strokes while also matching the beat of the song. Clash of Chefs is a cooking game in which the player needs to cook and assemble food from ingredients located around them. Half-Life: Alyx is a story-focused action and exploration game where the player explores the environment via teleport, solves spatial riddles, and engages in gunfights. Job Simulator is a sandbox game where the player can interact with a wide range of fun objects that are scattered in a little cubicle. Pistol Whip is another fast rhythm game but instead of swinging swords, the player needs to dodge incoming fire with their stationary body while also shooting enemies on the beat. Space Pirate trainer also requires the player to dodge incoming fire while shooting enemies but expects the player to move around in the available space and does not require synchronising fire with music. The Lab is a collection of VR demos that provide a wide range of activities from petting a robot dog to archery.
3.5 The Participants
The participants were recruited from the student body and were thus rather young and predominantly male. The age ranged from 18 to 25 with a mean of 20.81 (SD: 2.35) and a median of 20. 14 participants were male and two were female. The majority of the participants had only little previous contact with VR with 12 participants reporting that they used it between 1–5 times before. Two participants reported that they have used VR 5–10 times before while further two had no previous VR experience. While previous VR experience was low, most participants had experience with video games in general. 10 reported having played video games more than 50 times before (the highest option) with a further two reporting to have experienced them 10–50 times. Only four participants reported having played video games just 1–4 times. With the exception of four participants, all reported playing video games regularly (four daily, four weekly, three monthly, one yearly).
4 Results
In total, 24 h and 7 min of movement data were collected. However, due to the participants being able to select which game they wanted to play, the data is not equally distributed across all of them. Pistol Whip (5 h 29 min), and Half-Life: Alyx (5 h) were the two most-played games, followed by Beat Saber (4 h 31 min), Clash of Chefs (3 h 28 min), Space Pirate Trainer (2 h 40 min), The Lab (2 h 13 min), and Job Simulator (45 min). A summary of this can be seen in Figure 1.

FIGURE 1. Summary of data collected by game.
The data was processed using the programming language R in version 4.1.2 and the IDE RStudio. The code for processing the data and creating the graph can be found in the supplemental materials.
The graph generated by the metric can be seen in Figure 2 and the numeric values for mean and standard deviation are listed in Table 1 and Table 2.
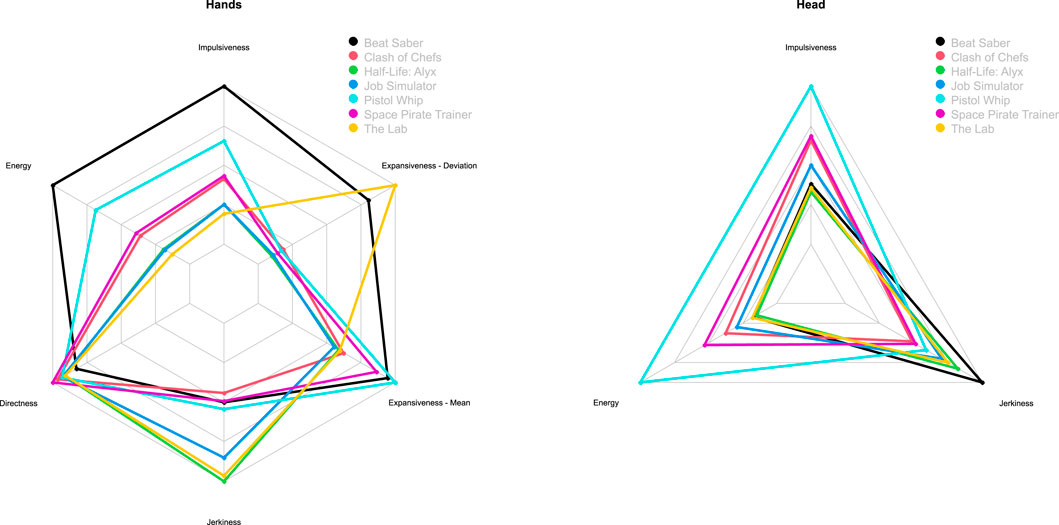
FIGURE 2. The computed outcome of our metric for seven games with normalised scales.
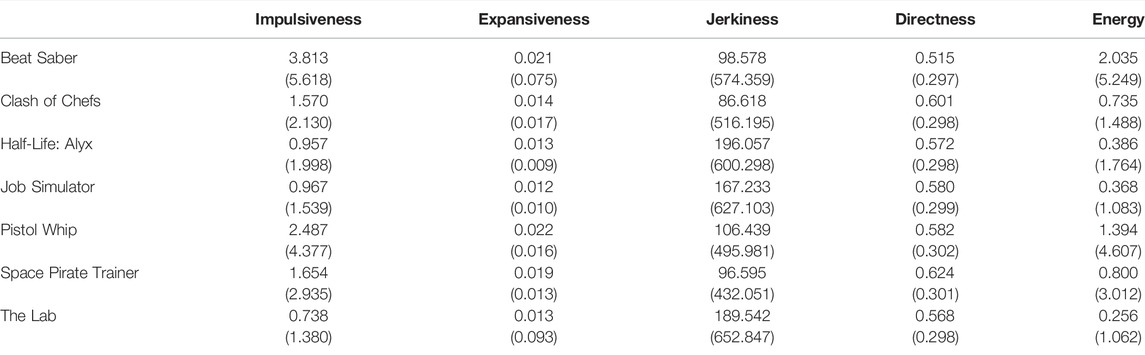
TABLE 1. Computed mean values and standard deviations (in parentheses) for the hands by game. Values are rounded to three decimals.
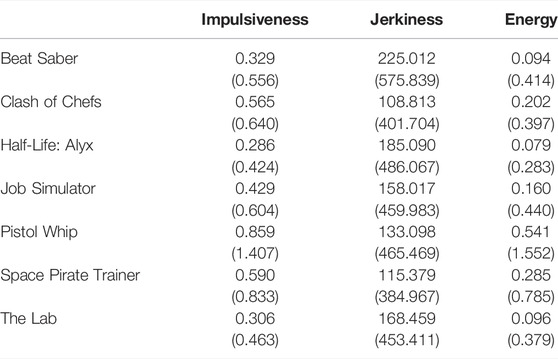
TABLE 2. Computed mean values and standard deviations (in parentheses) for the head by game. Values are rounded to three decimals.
5 Discussion
As can be seen in Figure 2, the seven games display visually different profiles with our measures. On most axes, the values are spread out and no game achieves the same values as another on all axes.
5.1 Hands and Body
Pistol Whip and Beat Saber, the two games with the most physical activity, are leading the axes of Energy and Impulsiveness while Job Simulator and The Lab, two sandbox games without time pressure, are on the opposite end of the scale. While the values are close together on the Directness axis, it is of note that Beat Saber scores least, signifying that it had the most indirect movements. This matches the character of the game since the majority of the action in the game consists of swinging the swords in an arc around the player. On the first Expansiveness axis (mean), the games form two groups: The top group, with more expansive movements, is made up of the more physically active games Beat Saber, Pistol Whip, and Space Pirate Trainer. The lower group is made up of the remaining games that are not so physically demanding. On the second axis for Expansiveness (deviation), most games form a cluster, signifying that they do not vary much in Expansiveness. However, two of the games are standing out and scored much higher. For the first of the two outliers, Beat Saber, that was expected due to the large swinging motions that make up the majority of the gameplay. However, The Lab scored even higher than Beat Saber, indicating an even larger variance in Expansiveness. This could potentially come from the sandbox character of the game as some of the mini-games, such as “Solar System” (a visualisation of the Solar System), require little expansion, while others, such as “Long Bow” (an archery game), require significantly more expansion. On the Jerkiness axis, the games are also split into two groups similarly to the first Expansiveness axis (mean). However, on this axis, the split is not as obvious. The group of physically very active games, Pistol Whip, Beat Saber, and Space Pirate Trainer, are scoring low on the axis which is most likely caused by their fast, but wide and thus less curved motions. The opposite group are the games that focus more on exploration and puzzles: The Lab, Job Simulator, and Half-Life: Alyx. Their slower and more intricate motions are likely to cause higher values of Jerkiness which is also reflected on the graph. However, the outlier of this logic is Clash of Chefs, which scores the lowest value for Jerkiness even though the intricate movements required to assemble the food should place it on the opposite side of the scale. This inconsistency of the Jerkiness axis will need to be investigated closer in the future and might motivate, together with the already existing requirement for filtering, a replacement of the curvature equation with a more suited measure.
5.2 Head
On the axes of Energy and Impulsiveness for the head data, the leading games are Pistol Whip and Space Pirate Trainer, which is likely due to both games encouraging the player to move around fast in their tracked space to dodge incoming projectiles. On the opposite end of the spectrum are The Lab and Half-Life: Alyx, which both primarily use teleportation for locomotion and encourage less physical travel. Job Simulator, which requires some moving around but at the player’s leisure, is located between these two groups. On the axis of Jerkiness for the head data, the games are in nearly the opposite order as with the axes of Impulsiveness and Energy. The slower motions that caused lower scores on the other axes are now causing higher values of curvature and vice versa. The only exception to this pattern is the score of Pistol Whip, which scores higher than expected. This resembles the inconsistency observed with the Jerkiness axis in the hand data.
5.3 Limitations
While the metric succeeds in giving the seven games distinctly different motion profiles along the chosen axes, we still think that its current form is rather limited and there is significant room for improvement.
5.3.1 Data
The first limitation of the current demonstration is the data it is based on. Participants were mostly recruited from students of our department and are thus majorly young and tech-savvy. They are also mostly people that have not tried these games before because the majority of them had very little VR experience. This will bias the results because it might be formed by movement patterns only present in beginners and that might be performed with more youthful enthusiasm than an older player might use. The ideal data set for this metric would cover all ages of players with different backgrounds. However, it should be noted that arbitrarily adding older users or users from different backgrounds could also bias the metric if they are not part of the typical player group of the game.
5.3.2 Button Input
Another shortcoming of the metric is that it does not incorporate button input in its current version. This is a serious shortcoming because button interactions are an important topic in the accessibility of video games. While buttons have a less crucial role in VR games than in non-VR video games, they are still important and games vary in complexity there as well. Beat Saber, as an example, only requires the user to press the trigger button, but Half-Life: Alyx binds inventory and menu tasks to the various buttons on the controller.
5.3.3 The Mean as a Measure
One limitation is that the values displayed on the scales are the means of the data series. While the mean is a very intuitive measure of central tendency and serves mostly well in this first prototype, it also comes with some limits. A given mean can always be achieved in two ways: either by having a large number of values around the mean or by having a small number of values that are high above and below the mean. This is problematic because one can imagine that it might be important to know for an impaired player whether the given value is a consistent requirement or whether the game will require values above and below frequently. This information can usually be determined by including the standard deviation which is a measure of the spread of the values. Expansiveness is already represented with mean and deviation because the issue described above was already encountered there during the development of the metric. However, incorporating the standard deviation into all measures would mean increasing the number of axes in the diagram from six to ten and would significantly affect the readability of the graph. A similar argument can be made against displaying the standard deviation as error bars, which will clutter the diagram when more than one game is displayed. An ideal solution would need to incorporate both information into one axis without deteriorating the readability significantly.
5.3.4 Meaningful Values
Another limitation is that most of the values displayed on the diagram are not transferring well into the real world in a way that a potential user can quickly understand what they will mean for them. While the volume of a 3D ellipsoid might be a good measure for the expansiveness of a motion, it is not a value from which a layperson can derive whether they can meet the requirements of the game or not. This applies to most of the other values as well. When solely comparing games to each other, these less human-readable measures still fulfil their purpose. Especially when the impaired player can compare an unknown game to a game they already know they can play. However, one still might consider simplifying the measures or finding more intuitive replacements.
5.3.5 Normalised Scales
Another difficulty is that the metric is currently using normalised scales where the upper limit is always the highest value achieved by any of the games in the comparison. While this is sufficient for comparing seven games, this is not viable when potentially applied to a game catalogue of the size of Steam with thousands of games. Of all the measures used, Directness is the only one with a mathematically defined upper bound due to the dot product of two normalised vectors being limited to the range between 0 and 1. The other measures are, at least theoretically, bound by the limits of the human physique. As an example, Expansiveness will have an upper limit because the range of human arm lengths is going to have an upper limit as well. However, setting the upper end of the scale at the theoretical maximum value is also not desirable, because the number of people being able to achieve high values is likely to fall off quickly the higher it goes. As a result, this would be likely to compress the axes to the point that the individual games are not discernible anymore. An example of this compression, based on our data, can be seen in Figure 3. In the graph on the right, the axis for Directness and the two axes for Expansiveness have absolute maximum values. For Directness, it is the aforementioned upper limit of the dot product while for Expansiveness, a representative value was calculated. For that, we imagined a pose with a high expansiveness and calculated the Expansiveness for a 1.8 m tall human that assumes this pose. As can be seen in the figure, this approach degrades the readability of the graph, as the values of most games fall into a very close range on all three axes. Only the deviation of Expansiveness with Beat Saber and The Lab can still be clearly singled out. Another approach could be to use the highest observed value for each axis as its maximum value. This promises a more realistic upper cap because it is not based on a theoretical maximum but on one that was actually observed with the target population. However, it gives single outliers, including ones caused by tracking glitches, the power to determine the scale. It also might get invalidated by new data with even larger values.
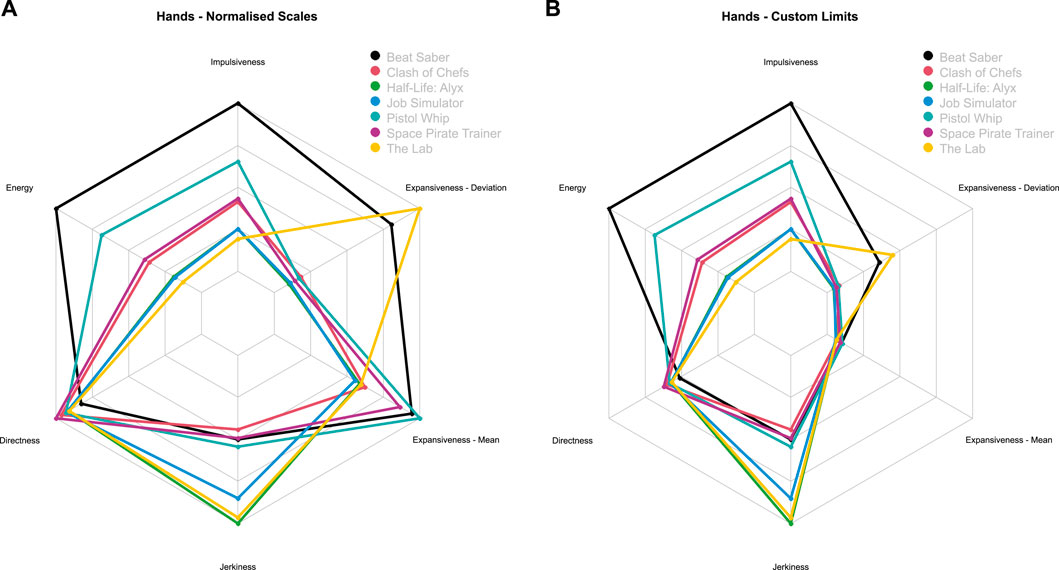
FIGURE 3. Side-by-side comparison of the computed outcome with normalised scales (A) and custom scales (B) that set the maximum value of the scale to either the mathematical upper limit (Directness) or to a theoretically calculated max value (Expansiveness).
5.4 Future Directions
In the future, we want to primarily expand in two directions: automating the data collection and incorporating button input.
5.4.1 Automatic Data Collection
During our lab-based study, more than 24 h of movement data have been collected from 18 unique participants. However, this is only a very slim base given that Beat Saber alone is played by over 1,000 people every day7. Collecting a data set of size even remotely close to this is not viable with local data collection in our lab at UCL. Instead, we want to use automatic data collection via a plugin. SteamVR allows pieces of software to be automatically started when the VR environment is used. This is usually used for overlays and similar tools, but could also be repurposed for an automatic data collection tool. This tool would capture the ID of the currently running game, record the movement happening, and send it to a server at UCL at regular intervals. That software could be distributed to participants all over the world that then would automatically contribute data when playing their VR games. Naturally, this data would need to be anonymised before being transmitted over the internet.
The upsides of this approach would be the potential to acquire a large data set with a wide set of different games and players that could not be acquired in the lab. However, this approach also comes with some caveats. For once, the data set is likely to be noisier than one collected in the lab because the environment is less controlled. People might need to put the headset down and step out to answer the doorbell. Controller batteries might run empty or other technical faults may occur. Dead zones in the coverage of the tracking system might cause the controller to jump around to locations where the physical devices are not. All of this will be captured in the data and may need to be filtered out before the data can be processed.
Another caveat is that we would have less control over the games played by the participants. While we can direct participants towards games that we have less data on in a lab environment, we do not have this control over the player at home. This makes it likely that we will receive large amounts of data from particularly popular games while we get only little data from lesser-known titles. Another risk is also that the number of participants might be large, but is spreading over a similarly large pool of games leading to a wide selection of games included in the data set, but only with very little data for each game.
One last limitation of this approach is that while we will know more about the games, we will probably know less about the participants. To maximise data protection while collecting movement data over the internet, the data transmitted would need to be fully anonymised to the point that we might even remove connections to an individual participant such as a participant ID. This way, a potential attacker would not be able to profile the user’s movement from intercepted data, but it would also prevent us from tracking participants between sessions. Demographic data could be collected from the participant at sign-up, but there is no guarantee that they will be the only ones actually using the VR system every time a recording happens.
5.4.2 Incorporating Button Input Into the Metric
As described in Section 5.3.2, button inputs should be incorporated into a future version of the metric. During the experiment, we were already capturing the inputs made by the participants, but at this time we have not determined the best way to process them yet. One way to incorporate button input in this metric could be via two new axes: The first axes would represent the frequency of button inputs. Games such as Beat Saber that use only the trigger for menu interaction and next to no other button input would be on the lower end of this while games such as Tilt Brush with its frequent inputs would most likely fall on the other end. A second axis could represent how often multiple inputs at the same time are required. An impaired user might have no issues with pressing one button at a time (potentially with the help of their other hand) but might struggle with simultaneous action where multiple buttons need to be pressed at the same time. Another aspect that we still need to explore is whether different buttons or actions such as holding instead of pressing should have different weights assigned. While the placement of the button used and the type of action might have a significant real-world impact on the accessibility of the game, it is unlikely to find a weighting that covers all forms of impairments.
6 Conclusion
We proposed a metric that profiles motion requirements for virtual reality games according to five different criteria. The purpose of the metric is to make it easier for players to decide whether they can or want to undertake the actions required by the game before buying it. The metric is not judged by a human, but can be computed out of real-world motion data and thus scales well and could potentially have a huge impact on the accessibility of VR applications. We have performed a first evaluation of the metric by collecting over 24 h of data from seven games. The outcome were seven distinct profiles of the games that are visualised in a graph in Figure 2 and are tabulated in Table 1 and Table 2. We found that most of the measures performed as expected by placing the games on the axes based on their different characteristics. Only the measure of Jerkiness did not quite meet expectations with one game not placed where we expected it to be. This anomaly will be addressed by future adjustments. We have also identified conceptual limitations of the current version and potential future improvements of the metric. Namely the current data it is based on and that button input is not incorporated yet. Both we are planning to address in future work through large-scale automated data collection and additional measures that include how frequent buttons are required.
Data Availability Statement
The raw data supporting the conclusion of this article will be made available by the authors, without undue reservation.
Ethics Statement
The studies involving human participants were reviewed and approved by Research Ethics Team Office of the Vice-Provost (Research) University College London 2 Taviton St, London WC1H 0BT. The participants provided their written informed consent to participate in this study.
Author Contributions
FJT developed the metric, performed the experiment, analysed the data, and wrote the majority of this manuscript. AS provided supervision and feedback during the development and contributed to the writing of this manuscript.
Funding
This project has received funding from the European Union’s Horizon 2020 research and innovation programme under grant agreement N° 856998.
Conflict of Interest
The authors declare that the research was conducted in the absence of any commercial or financial relationships that could be construed as a potential conflict of interest.
Publisher’s Note
All claims expressed in this article are solely those of the authors and do not necessarily represent those of their affiliated organizations, or those of the publisher, the editors and the reviewers. Any product that may be evaluated in this article, or claim that may be made by its manufacturer, is not guaranteed or endorsed by the publisher.
Acknowledgments
We thank David Swapp, Simon Julier, and Wolfgang Stürzlinger for their feedback while developing the metric.
Footnotes
2https://www.specialeffect.org.uk/
4https://www.specialeffect.org.uk/
6https://github.com/FJThiel/SteamVRMotionDataRecorder
7https://steamcharts.com/app/620980
References
Beeston, J., Power, C., Cairns, P., and Barlet, M. (2018). “Accessible Player Experiences (Apx): The Players,” in Computers Helping People with Special Needs. Editors K. Miesenberger, and G. Kouroupetroglou (Cham: Springer International Publishing), 245–253. doi:10.1007/978-3-319-94277-3_40
Chung, G.-Y., Choi, G.-S., Shin, K.-Y., and Park, J.-S. (2016). Gait Changes after Using a Temporomandibular Joint Exerciser in Patients Who Underwent Lower Limb Joint Surgery. J. Phys. Ther. Sci. 28, 1584–1587. doi:10.1589/jpts.28.1584
Gerling, K., Dickinson, P., Hicks, K., Mason, L., Simeone, A. L., and Spiel, K. (2020). “Virtual Reality Games for People Using Wheelchairs,” in Proceedings of the 2020 CHI Conference on Human Factors in Computing Systems (New York, NY, USA: Association for Computing Machinery), 1–11. doi:10.1145/3313831.3376265
Giraud, T., Focone, F., Isableu, B., Martin, J.-C., and Demulier, V. (2016). Impact of Elicited Mood on Movement Expressivity during a Fitness Task. Hum. Mov. Sci. 49, 9–26. doi:10.1016/j.humov.2016.05.009
Heron, M. J., Belford, P. H., Reid, H., and Crabb, M. (2018a). Eighteen Months of Meeple like Us: An Exploration into the State of Board Game Accessibility. Comput. Game J. 7, 75–95. doi:10.1007/s40869-018-0056-9
Heron, M. J., Belford, P. H., Reid, H., and Crabb, M. (2018b). Meeple Centred Design: A Heuristic Toolkit for Evaluating the Accessibility of Tabletop Games. Comput. Game J. 7, 97–114. doi:10.1007/s40869-018-0057-8
Heron, M. J. (2016). Cultural Integration and the Accessibility of Gaming. Comput. Game J. 5, 91–94. doi:10.1007/s40869-016-0028-x
Maes, P.-J., and Leman, M. (2013). The Influence of Body Movements on Children's Perception of Music with an Ambiguous Expressive Character. PLoS ONE 8, e54682. doi:10.1371/journal.pone.0054682
Mott, M., Tang, J., Kane, S., Cutrell, E., and Morris, M. R. (2020). ““i Just Went into it Assuming that I Wouldn’t Be Able to Have the Full Experience”: Understanding the Accessibility of Virtual Reality for People with Limited Mobility,” in ASSETS 2020 (New York, NY, United States: Association for Computing Machinery).
Nagymáté, G., and Kiss, R. (2018). Application of Optitrack Motion Capture Systems in Human Movement Analysis: A Systematic Literature Review. Recent Innovations Mechatronics 5, 1–9. doi:10.17667/riim.2018.1/13
Nishida, K., Hagio, S., Kibushi, B., Moritani, T., and Kouzaki, M. (2017). Comparison of Muscle Synergies for Running between Different Foot Strike Patterns. PLoS ONE 12, e0171535–19. doi:10.1371/journal.pone.0171535
Pesántez-Cabrera, P., Acosta, M. I., Jimbo, V., Sinchi, P., and Cedillo, P. (2020). “Towards an Evaluation Method of How Accessible Serious Games Are to Older Adults,” in 2020 IEEE 8th International Conference on Serious Games and Applications for Health (SeGAH) (Vancouver, BC, Canada: IEEE), 1–8. doi:10.1109/SeGAH49190.2020.9201655
von Laban, R., and Ullmann, L. (1971). The Mastery of Movement. London, United Kingdom: Macdonald & Evans.
Keywords: virtual reality, accessibility, motion analysis, video games, user study, motion capture
Citation: Thiel FJ and Steed A (2022) Developing an Accessibility Metric for VR Games Based on Motion Data Captured Under Game Conditions. Front. Virtual Real. 3:909357. doi: 10.3389/frvir.2022.909357
Received: 31 March 2022; Accepted: 13 June 2022;
Published: 22 July 2022.
Edited by:
Sheng Li, Peking University, ChinaReviewed by:
Junjie Shang, Peking University, ChinaMichael Vallance, Future University Hakodate, Japan
Copyright © 2022 Thiel and Steed. This is an open-access article distributed under the terms of the Creative Commons Attribution License (CC BY). The use, distribution or reproduction in other forums is permitted, provided the original author(s) and the copyright owner(s) are credited and that the original publication in this journal is cited, in accordance with accepted academic practice. No use, distribution or reproduction is permitted which does not comply with these terms.
*Correspondence: Felix J. Thiel, ZmVsaXgudGhpZWwuMThAdWNsLmFjLnVr