 Thibaud Chassin
 Jens Ingensand
94% of researchers rate our articles as excellent or good
Learn more about the work of our research integrity team to safeguard the quality of each article we publish.
Find out more
ORIGINAL RESEARCH article
Front. Virtual Real., 25 November 2022
Sec. Virtual Reality and Human Behaviour
Volume 3 - 2022 | https://doi.org/10.3389/frvir.2022.1054252
This article is part of the Research TopicMetaverse in Co-Virtual City DesignView all 7 articles
Typical urban participatory approaches engage citizens through lengthy sessions far from the area under transformation by an urban project. Several issues result from these settings of involvement including the mobilization of similar individuals, overwhelming participatory codes, or a gap between the affected urban landscape and the location of the session. This study introduces a modern approach that leverages the use of 3D web applications to address some of the critical challenges of popular participatory sessions. The developed approach, named e-guerrilla 3D participation, is based on five dimensions: immediate participation, ease of use, flexibility, place-based engagement, and immersivity. A prototype complying with these five dimensions was implemented in this study. The prototype promotes an in situ engagement where all the users (without distinction) of a public area can explore a future urban project and get involved within minutes. A usability study conducted with 26 expert and non-expert participants investigated the prototype through a fictive scenario. The findings demonstrate a positive outcome in terms of participatory results that are identifiable with the prototype (highlighting the controversial elements of the projects) and encourage feedback collected during a survey and interview. The usability study suggests key aspects that should be considered to improve the design of participatory sessions and their interactive mediums (or tools), such as realism, affordance, incentive, and purpose. The promising participatory approach (and prototype), which was unpacked step-by-step in this study, does not replace typical practices but could help to complement them by reaching a non-selected and broader public; hence leading to the design of more inclusive participatory approaches.
The current practices of public participatory approaches do not meet democratic expectations; several issues are inherent in the involvement of the population (Healey, 1998; Carpini et al., 2004), and institutions experience challenges due to the complexity of implementing participatory approaches (Innes and Booher, 2004). Creating an interactive space that facilitates the dialogue between institutions and the population should provide the same engagement opportunities for all stakeholders, including individual dwellers. This opportunity is often evaluated through representativeness, which measures how well a participatory session is able to reach the full spectrum of targeted stakeholders (Rowe and Frewer, 2000). However, today’s practices do not provide equal opportunities with the design (deliberate or not) of “invited space,” which benefits only a few individuals (Everatt et al., 2010). Furthermore, the mechanisms of involvement often require the participants to transit to a specific location at a specific time and to remain on the site for many hours. This results in a few similar individuals attending the participatory sessions (Kingston et al., 2000; Brown et al., 2014; McLain et al., 2017) and makes the session poor in terms of representativeness. As a participatory mechanism, urban participatory planning experiences similar challenges.
Digital technologies offer the opportunity to create modern virtual interactive spaces (Sinclair et al., 2017). These virtual participatory sessions, based on the use of digital Information Communication Technologies (ICT), extend the number of seats available and improve the accessibility of the sessions by providing more flexibility for the participants to choose the time of involvement (Carpini et al., 2004). Therefore, the public reached by digital participation can be broadened, which may support enhanced representativeness. In the context of urban participatory planning, the dialogue between the authorities and the public is commonly spatially anchored. To facilitate the interactions, digital cartographic mediums are adopted, notably, Geographic Information Systems (GIS) and their participatory counterpart, Public Participatory GIS (PPGIS). These systems have been identified as valuable for urban planning for more than 20 years (Al-Kodmany, 1999; Talen, 1999; Peng, 2001; Rinner, 2001) and are now commonly used in participatory planning (Czepkiewicz et al., 2018; Pánek, 2018; Falco et al., 2019; Brown and Eckold, 2020; Babelon et al., 2021). However, these solutions do not appear to be completely representative or inclusive (Sieber et al., 2016; Kahila-Tani et al., 2019) and similar participant profiles are again identified (Brown, 2012; McLain et al., 2017). Indeed, participants remain difficult to motivate to attend participatory sessions, even with digital tools (Münster et al., 2017). The key to increasing engagement is to design participatory e-tools that are easy-to-use, perceived as useful, plug-and-play, and user-centered (Bugs et al., 2010; Steiniger et al., 2016).
The cartographic medium as a visual material can stimulate dialogue between stakeholders, especially by creating a common language that could be understood and used by individuals from different backgrounds (Metze, 2020; Roque de Oliveira and Partidário, 2020). However, a 2D cartographic object does not straightforwardly portray the height parameter, which could lead to legibility challenges (thus, not fulfilling its role as visual material). The depiction of the height is nonetheless crucial for urban planning, where the debate frequently focuses on the height of new volumes (Ruming et al., 2012; Ruming, 2018). The third dimension offers a clear representation of urban and natural landscapes, facilitating the understanding of complex spatial aspects (Al-Kodmany, 2001; Schroth et al., 2011), which are often inherent to urban projects. For more than 20 years, the development of Virtual Geographic Environments (VGE) has enhanced 2D cartographic visualizations and manipulation of advanced geographic data (supported by the GIS) via the integration of 3D, and its z component (Batty, 1997; Lin and Gong, 2001; Lin et al., 2022). VGE and 3D visualization are flexible in terms of data (they incorporate various sources), representations (from abstract to realism), and interactions (from navigation to design of 3D scenes) (Çöltekin et al., 2016; Christophe, 2020). This versatility offers the ability to adapt the VGE settings to fit the participatory tasks, for instance with different representations to stimulate the collection of information. More importantly, versatility appears to motivate participants (Hayek, 2011). Nonetheless, the consumption and manipulation of 3D mediums can be troublesome for certain individuals, hence leading to inequalities that are exacerbated by socio-demographic characteristics (Burigat and Chittaro, 2007; Lokka et al., 2018; Chassin et al., 2022).
Most of the applications of PPGIS and VGE in urban participatory planning, even if web-based, are currently optimized for personal computers. Therefore, participants are still restricted in the modality of engagement. The necessity to be involved from a personal computer limits the freedom of citizens, who cannot participate on the go. Broader flexibility could be generated from the use of smartphones and mobile participation (Ertiö, 2015). Mobile-enabled participation that adopts VGE can be conducted “out of the lab” (Gill and Lange, 2015), notably through the creation of web applications running in the browser. Outdoor mobile participation has several advantages. First, it enables the participants to choose the modality of their engagement in terms of time and location (Ertiö, 2015). Second, regarding the digital divide, it seemed to be favored by disadvantaged communities, who tend to consume mobile-based broadband considerably (Mossberger and Tolbert, 2021). Therefore, mobile-enabled participation could be a valuable alternative to enhance the representativeness and inclusivity of participatory sessions. Third, it can anchor the involvement in situ (Bohøj et al., 2011). Most of the participatory sessions are located in a remote location that is by definition not situated in the area that is impacted by the project. Adopting mobile-enabled participation could, therefore, reconnect the participation with the area under transformation, facilitating the understanding and the assessment of the impact of the urban project. Moreover, the participatory session could be available for all users of public spaces, including day workers and tourists, which are often forgotten by participatory approaches. Non-local citizens can indeed provide valuable inputs in participatory planning (Onitsuka et al., 2018). Some positive applications of in situ participation are mentioned in the literature, including the use of a mixed-reality table and 3D modelization in a tent (Basile and Terrin, 2010), the design of a head-mounted Virtual Reality (VR) setting (Pouke et al., 2019), and the adoption of mobile Augmented Reality (Korn, 2013).
This study aims to introduce a new approach to participatory planning, namely e-guerrilla 3D participation, which considers current participatory challenges and creates mechanisms to tackle them. This approach develops the concept of in situ engagement through the use of a VGE and brief semi-immersive participatory tasks. One of the key objectives of the approach is to improve the inclusivity of participatory planning by implementing a 3D innovative design for quick, simple, and efficient engagement. In this study, we first present a detailed definition of e-guerrilla 3D participation and its dimensions. Then, we describe how to translate this e-guerrilla approach through a technical implementation, in other words, by developing a prototype. Next, we present the findings, which results from the testing of the prototype with expert and non-expert users in a fictive scenario (N = 26). Last, we describe findings that are remobilized to discuss the future of urban participatory e-planning.
The approach of 3D guerrilla e-participation combines several methods from diverse fields. First, the term guerrilla originates from User Experience (UX) usability testing (Nielsen, 1994). Its goal is to reduce costs (financial and temporal) related to usability engineering methods, and it reduces the “intimidation barrier” of using these approaches. The guerrilla approaches have several settings, and one of the most famous examples is a UX designer waiting in a coffee shop with a sign mentioning “Ask me about a free coffee.” When testers/participants inquire about the coffee, the UX designer explains that the testers/participants can enjoy a free drink if for a few minutes (time to drink a coffee) they test a product and answer a few questions. This method can be very efficient because: 1) it uses a strong incentive (a free coffee) to attract testers/participants; 2) it is low-cost compared to other types of testing; 3) it is engaging the testers/participants where they already are (no change of routine); and 4) it is simple to implement and can be set up hypothetically anywhere in a few minutes. These guerrilla approaches are often referred to as “quick and dirty” methods to collect user feedback but can still provide valuable information (Lallemand and Gronier, 2018; Diederichs et al., 2020). The term “dirty” implies that the testers/participants are often not representatives of the profile of the target users. Based on this guerrilla concept, the Finish company HappyOrNot (happy-or-not.com/en/) designed a well-known solution consisting of four smileys (very happy, happy, unhappy, very unhappy) that aims at gathering feedback from customers right after experiencing a service (often seen in airports, shops, etc.) (Figure 1). This solution provides the customers the opportunity to deliver in situ immediate feedback. The presence of the colored smileys and the opportunity to participate easily without engaging any time works as the right trigger to encourage customers to click on one of the buttons. This type of participation appears to be efficient and inclusive (lowering the language barriers) (Jory et al., 2014; Morgan-Daniel et al., 2021).

FIGURE 1. An example of the guerrilla solution design by HappyOrNot.
Second, our approach to guerrilla e-participation borrows mechanisms from tactical urbanism (Lydon and Garcia, 2015). Tactical urbanism describes low-cost, ephemeral actions on the territory that aim to deliver long-term transformation of the place (physical and/or social). These actions can be initiated by bottom-up as well as top-down processes. The installation of benches and tables along the street, the creation of urban gardens, or the drawing of new street signage are a few examples of tactical urbanism (Lak and Zarezadeh Kheibari, 2020; Cariello et al., 2021). Therefore, the actions produced within the scope of tactical urbanism are diverse, in situ (i.e., contained in the territory under transformation), anchored to a small scale, engaging for local communities (i.e., participatory), and often articulated around creative activities such as art (Courage, 2013). Tactical urbanism immerses local communities in an experimental setting of the place, which generates an authentic emotional response that could be investigated by practitioners (Stevens et al., 2021) to plan the evolution of the city in compliance with the urban dwellers’ needs (Silva, 2016).
Built on these concepts and examples, our approach to guerrilla 3D e-participation is based on the design of a digital participatory approach that uses 3D to support a better immersion of the participants/users in an alternative scenario of a place. guerrilla usability testing and tactical urbanism both promote involvement settings that are flexible, informal, out-of-the-box, time-bound, and proximate to participants. From these basic requirements, guerrilla testing often implies a simple but efficient way to collect information. The HappyOrNot approach is an excellent example with a high number of quantitative data produced by one-click feedback. A similar aspect of both the HappyOrNot and tactical urbanism approaches is the collection of participants’ contributions in situ, i.e., where participants are experiencing the stimulus (which is the transformation of an area in urban planning).
Therefore, our approach to e-guerrilla 3D participation aims at mobilizing mechanisms of guerrilla usability testing and tactical urbanism through five dimensions:
- Immediate participation. The participatory task should be accessible immediately without any delay. Therefore, the entry cost has to be actively reduced, to create a sentiment of plug-and-play. Moreover, the approach should respect and value the time offered by the participants that have busy routines; thus, the nature of the task to be accomplished should be quick to execute, but meaningful.
- Ease of use. Increased complexity may drive users/participants to abandon their tasks, which leads to excluding some individuals, and ultimately hindering inclusivity. Therefore, the approach should promote a user-friendly, seamless experience that could increase the engagement of users/participants.
- Flexibility. Urban projects and participatory sessions are heavily heterogeneous, e-guerrilla 3D participation should be able to comply with these diverse contexts and applications. Moreover, the involvement of urban dwellers implies a high versatility of socio-demographic characteristics and preferences. Hence, the approach should promote an engagement that fits a broad and mixed population.
- Place-based engagement. Participatory tasks should be performed in situ. The objective is to create a strong connection between participants’ contributions and the place under transformation. The place related to the project is emotionally bound to its users; therefore, enclosing the participatory interaction within the place under transformation could create more meaningful contributions. Moreover, the users of the place are more diversified than “the public” identified and invited by the authorities; the involvement in situ could facilitate the mobilization of all the users of a place.
- Immersivity. Urban projects are complex to understand due to their uncertainties. Immersivity can promote a direct engagement via portraying, without artifice, the future project within its surroundings, hence facilitating the understanding of the project.
Based on the concept of e-guerrilla 3D participation, we developed a prototype implementing the five dimensions: immediate participation, easy-to-use, flexible, place-based, and immersive (Figure 2). This section does not aspire to convey too many technical details; we will present how the five dimensions were translated into a prototype. With this demonstration, we expect to provide a factual description of the choices that were made (technical, design, functionality, etc.) in order to facilitate the understanding of the e-guerrilla 3D participation and stimulate the creation of future alternative implementations. Three subsections will discuss technological choices, controls, and participatory tasks.
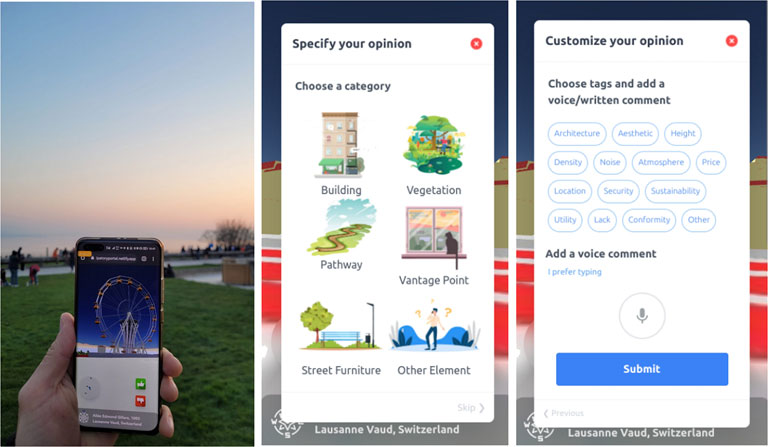
FIGURE 2. Presentation of the screen of the web application implementing the concept of guerrilla e-participation. From left to right: a picture of a participant using the app in situ and observing the current layout of the public space with the future project; first screen where the participants have to choose a category for their positive/negative tagged object; second screen where participants can develop their observation with tags and comments before submitting.
One of the requirements of the prototype is to allow in situ participation. Furthermore, to improve the freedom of the participant, the time of the engagement is not bounded. This condition implies that urban dwellers should be able to visit the place under discussion at any time and be autonomous while contributing to the project. Therefore, no specific devices operated by a facilitator can be implemented, because such devices would be available for only a few hours. Also, to comply with the easy-to-use dimension, we designed the prototype to be run directly in a browser from any smartphone. Today, smartphones are widely adopted by the population around the globe and currently represent 60% of the market share (desktop vs. mobile vs. tablet) (StatCounter, 2022).
The adoption of web technology aims at promoting access to e-tools everywhere without any download required (perceived by the consumers). Therefore, the prototype could be immediately available by addressing an URL (Uniform Resource Locator) within any browser. This URL can be typed manually, which increases the time before starting to participate. Or the URL can be accessed from a QR code (quick response code), which provides immediate access to the participatory task. Furthermore, the adoption of QR codes has been extensively used during the COVID-19 pandemic, which implies that the population is now accustomed to scanning these types of codes.
The web application was based on a virtual globe (to enable 3D), namely CesiumJS (cesium.com), which is already known and used in the scientific community (Virtanen et al., 2018; Lafrance et al., 2019; Würstle et al., 2021). Virtual globes are powerful tools that can render large areas as well as small ones. Since the 1998 and the speech of former Vice President of the United States Al Gore about digital earth (Gore, 1998), the development of the virtual globe has been thriving (Keysers, 2015). We selected CesiumJS, because the library is open source, highly flexible, provides numerous out-of-the-box functionalities, and is often updated. Furthermore, compared to other web solutions (video game engine, proprietary software, other libraries), CesiumJS supports natively geospatial data and is able to tile large datasets to render them seamlessly (Krämer and Gutbell, 2015). Another reason that motivated our choice to adopt a virtual globe is the availability of basic data (digital elevation model, satellite imagery) covering the entire surface of the Earth. Therefore, our prototype may be easily re-implemented for other projects in different locations. Regarding the data, we used the 3D building layer provided in open data by Swisstopo (swisstopo.admin.ch), which contains the entire set of buildings in LOD2 (level of detail) for all Switzerland. For projects outside Switzerland that do not have access to this qualitative open data, CesiumJS has integrated since the 1st of June 2020 out-of-the-box OpenStreetMap Buildings (osmbuildings.org), which cover nearly the entire globe (Ring, 2020).
Immersive technologies such as augmented and virtual reality with smartphones or head-mounted devices have not been selected for our prototype. The immersive feeling promoted by virtual reality technologies can be valuable; however, the necessity of using a device (headset or cardboard) that immerses the participants completely is less appealing. Some studies have shown that real-world stimuli (i.e., being in situ) could provide some opportunities for immersive virtual reality (Pouke et al., 2019); nonetheless, the use of a screen that completely obliterates the real-world view is not desirable (and is impracticable) for our approach. Relocating the participation in situ aims at promoting an association between the real world and virtual objects to facilitate the comprehension of the aspects of the project that transform the place. Augmented reality, which is closer to the real environment in the reality-virtuality continuum (Milgram et al., 1995), can flawlessly promote the association between the real and virtual world and enable public participation (Hunter et al., 2021). Furthermore, the technology of Niantic (nianticlabs.com) has been democratized by the popularity of Pokemon GO (pokemongolive.com) and it supports the integration of virtual objects in the real world without requiring embedded LIDAR (laser imaging detection and ranging) technologies. Therefore, any smartphone has access to augmented reality functionality using a basic camera (i.e., more inclusivity). However, the technology provides only a temporary environment that is reset between each use without capturing geo-location, which is a major issue for adopting this technology in our approach.
The e-guerrilla 3D participation approach emphasizes the requirement of inclusivity in participatory planning. However, the manipulation and perception of a virtual geographic environment, such as a virtual globe, can be challenging for certain users/participants according to their skills, socio-demographic characteristics, and experiences (Çöltekin et al., 2016; Ugwitz et al., 2019; Chassin et al., 2022). Considering these differences, we aimed at lowering the interaction metaphors with the virtual globe to create better affordances, thus facilitating the interaction (easy-to-use dimension). Typical interactions with virtual globes are executed through a mouse and keyboard, or a touchscreen for smartphones. The approach of e-guerrilla 3D participation is to immerse participants directly within the location of the project under discussion. Therefore, the mouse and keyboard are not straightforwardly practicable, because the participants would have to stay static or transport the mouse/keyboard/device at any time. Touchscreen-based manipulation can also hinder the association between real and virtual, with participants looking down at their phone to observe and interact with the VGE, and then looking up to observe the urban landscape, which could result in participants being mainly focused on their screens, as observed with students (Ingensand et al., 2018). Furthermore, touchscreen-based interactions have issues such as the fingers of the user covering elements that are visualized (Wobbrock et al., 2008).
Our approach to facilitating the interaction between the users/participants and the virtual globe is to mobilize the sensors accessible within the smartphone (GPS, accelerometer, orientation angles). This data from phone sensors has already been proven accurate enough in studies using pictures taken from smartphones (and by consequence containing default sensor data) and published on social networks (Foltête et al., 2020; Chassin and Ingensand, 2021). The smartphone could, therefore, be used as a tangible device to manipulate the virtual globe. The use of tangible devices has demonstrated a certain value compared to the more typical techniques of interactions (touchscreen, mouse/keyboard) (Besançon et al., 2017). This sensor data is becoming increasingly available through web browsers with the development of Sensor APIs (Application Programming Interface). With this data, it is possible to locate and orient the smartphone of a participant in real space. Considering that a virtual globe portrays a virtual image of the real world, we can, therefore, connect the real data provided within the smartphone to the virtual environment. Our controls of the virtual globe were thus reduced to moving physically within the real world and orienting the smartphone in the desired direction. Users/participants are able to visualize through their smartphone a virtual overlay (future project) on the real world, such as a portal or a window (Figure 2). Therefore, no direct interaction was necessary to manipulate and orient the virtual globe and this contributes to lowering the entry cost of the approach, thus improving its inclusivity.
With the e-guerrilla 3D participation approach, the population is involved in situ, directly within the place under negotiation, which is also the participants’ living environment. Therefore, participants are already familiar with the virtual space because it is identical to the in situ environment. The contextual objects, i.e., the buildings, are all abstractly represented in the virtual environment that is overlaying the real environment, so the participants should be able to connect these two spaces easily and focus on their participatory tasks.
In the prototype that was implemented, we aimed at collecting the participants’ opinions about a hypothetical future layout of a public place. We adopted a mechanism broadly used in Public Participatory Geographic Information Systems in a 2D layout (e.g., Sieber, 2006; Haklay et al., 2018; Bugs and Kyttä, 2019; Brown and Eckold, 2020), which aimed at collecting place-based inputs from the population about specific topics, such as security, future development, or like/dislike, through GIS functionality and vector data. In the approach embodied by the prototype, geo-located positive or negative opinions were gathered in a semi-immersive environment. To mark a geo-opinion, the participants could look at any virtual object and select an opinion.
Participants had access at any time within the web application to two participatory options, positive:
 and negative:
  . The selection of one of the two options led to two additional steps (Figure 2), which are independent of the selected options. The first step is an optional category selection that encourages participants to define the object under discussion (i.e., linked to the positive/negative opinion). The categories were: a building, vegetation (trees, bushes, plants), a pathway (street, walk path, sidewalk, etc.), a vantage point, urban furniture (benches, public trash, light pole, etc.), and other elements (that do not fit any category). The selection of the category was facilitated by the depiction of generic images supporting the participants in the selection of the right category. The second step, also optional, offered participants more freedom to define their opinion. Participants in this last step could select tags connected to their opinion and category and add written or vocal comments. Vocal comments were encouraged because they are simple and quick to generate for any participant (no typing is involved), and the voice can be recorded, thus providing additional valuable information about the participants (age, sex, emotion, etc.), that can be automatically recovered with a satisfactory accuracy (Zaman et al., 2021).
Saved in a database, each participant’s contributions (opinion, category, tag(s), vocal and written comments) were associated with the sensor data recorded at the time of the contribution (GPS position, orientation of the mobile phone).
The participatory task was implemented for the case study that will be presented in the next section. With the flexibility provided by web applications and virtual globes, other participatory tasks can be implemented as well, to fit the use context in which the approach of e-guerrilla 3D participation would be applied.
The evaluation of the usability of a new technological tool is complex and often overlooked. This study aimed at challenging our approach with participants (expert and non-expert) through a fictive scenario in a real location. Participants (N = 26) were invited to give their opinion on a park’s new layout. Through the usability study, we gathered technical and conceptual feedback to test the validity of our approach/prototype in a real practice exercise and to identify improvement outlooks.
The scenario designed for the usability study was fictive but realistic enough to convince the participants of its validity. For the study area, we selected an urban green space, located in Lausanne, Switzerland and presented in Figure 3. This urban green space was appropriate for the conduction of the experiment, because this public space is mostly bare, with a large grass surface, and contains only a few pieces of urban furniture. The place overlooks an open space, where a lake and mountains are clearly visible. However, because of its relative barrenness, it is not very popular. Therefore, this urban green space is suitable for the conduction of our usability study because: 1) the place is located in the open air without many trees, which is beneficial for the use of the GPS sensor of the phone; 2) the place is not cluttered by too many objects (urban furniture), which should be modeled in the VGE or it could complexify the scenario (with the additional virtual objects); and 3) the breathtaking view can be obstructed to stimulate the participants’ feedback.
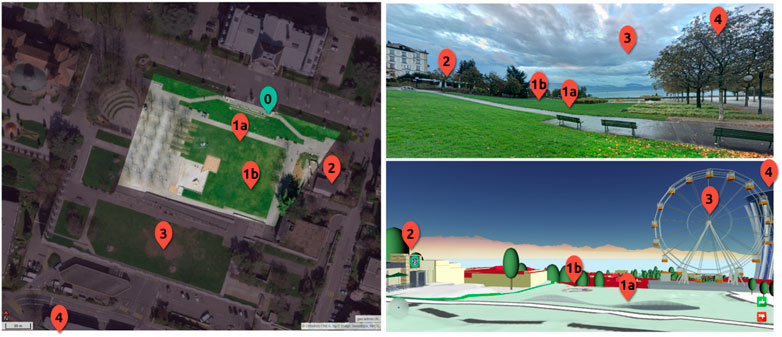
FIGURE 3. Illustration of the study area with the location of the project’s objects. The top view of the study area shows a lighter surface, which represents the explorable area during the usability study. On the right, the study area is presented from a first-person perspective with a realistic view (right-top) and a view from the VGE (right-bottom).
The markers, shown in Figure 3, portray the location of the additional objects that have been effectively implemented in the scenario: [0] (green) indicates the starting point, [1a] and [1b] the implementation of two benches, [2] the replacement of a restaurant by a famous American coffeehouse, [3] a substantial Ferris wheel, and [4] a skyscraper. The fictive transformations created by the projects were consciously controversial to stimulate participants’ divided opinions. For instance, the addition of a coffee house could contribute to enhancing the place, but we selected an American brand known to be polarizing.
We are convinced of the unrealistic nature of this fictive project. The scope of the project under discussion is too large and if the population is consulted at any point of an urban project, it would be on a reduced range of objects. However, the goal of our study was to assess the performance of the prototype and collect participants’ tangible feedback on the approach.
Figure 4 presents the procedure of the usability study. Two entries are present in the figure: on the left are the steps that were executed during the experiment, and on the right is the expected practice of the approach/prototype without a facilitator. The usability study of 30 min was conducted with one participant at a time. In the expected practice, several participants can be involved at the same time, and the time of engagement lasts only a few minutes.
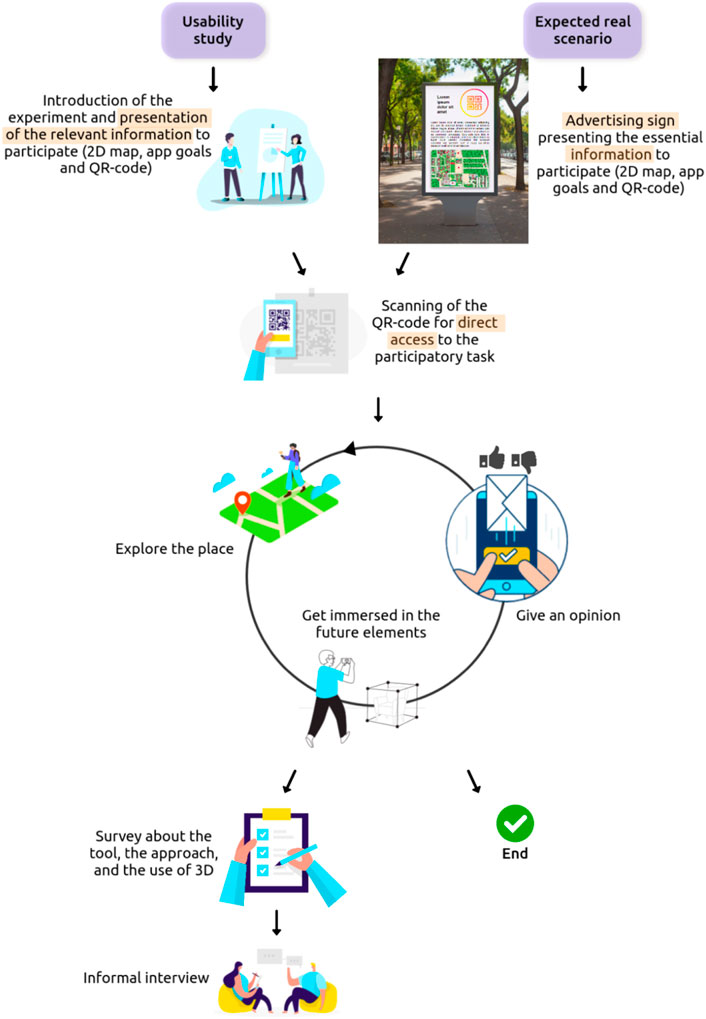
FIGURE 4. The procedure of the usability study. The left track shows the step of the experiments between a facilitator/observer and the participants. The right track portrays the expected practice of the approach/prototype.
The usability study started by welcoming the participant, explaining the program of the experiment, highlighting the fictive aspects of the scenario, presenting a 2D paper-based map of the fictive project, and explaining the operation of the prototype. Each of the project’s objects was explained one by one and their orientation in the real place was shown. The explanations were developed with contextual details and comments on the philosophy of each transformation induced by the project. For instance, the conversion of the restaurant into a coffee house was imagined to address the lack of takeaway offerings in the area (contributing to the non-popularity of the place). Furthermore, information about the fictive participatory session was also shared with the participants. We envisioned the participatory session taking place after a design phase conducted by urban experts and the project leaders. The project was ready to be submitted to the legal public inquiry (where the population can legally oppose the project), but the municipality fictitiously requested this participatory session to assess the population preferences and measure possible opposition.
Participants were also informed how the collected contributions would be considered. In the real expected practice, an information sign containing a QR code would describe this information.
Then, the participant scanned a QR code to access the prototype. No download was required, but two authorizations were requested from the participants: access to the GPS position and access to the microphone of the phone (to be able to leave vocal comments). The experiment was conducted on a unique phone to standardize the contributions of the participants. The participants were then free to explore the future project with the prototype, get immersed in the new layout, and record contributions. An observer was shadowing the participant to make sure that the prototype was used as expected and to record any difficulties in conducting the participatory tasks.
After this step, the expected practice of a few minutes was completed. In the usability study, the feedback of the participants was collected through an online survey and was followed by a brief informal interview.
The usability study concerned 26 participants, who were invited to participate from 22 March to 27 April 2022. Nearly 40% of the mobilized participants were female. Young and elderly were involved in the usability study, yet the median age was relatively young. More than 90% of the participants had a university degree. They mostly evaluated themselves to be confident with the use of digital and 3D tools but considered their knowledge of urban planning practices insufficient. Moreover, most of the participants declared to have never attended participatory sessions. The majority of the participants had a smartphone that is less than 2 years old, which they often use in the street (84.6%). Furthermore, they did not appear to frequently visit the study area. Table 1 summarizes the socio-demographic information of the participants collected during the online survey following the usability study. Six professionals (i.e., experts) also participated in the study. We were able to invite two participatory approach practitioners, one former municipal director of an urban planning department, a project manager in a GIS department, and two urban planning consultants.
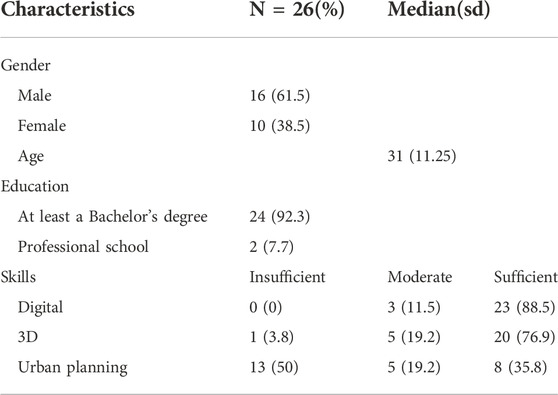
TABLE 1. Distribution of the socio-demographic characteristics of the 26 participants.
The profile of the non-expert participants fits our approach/prototype. These participants are indeed tech-savvy and young but seem to be foreign to participatory approaches. Our approach/prototype aims at improving the inclusivity of participatory approaches, i.e., mobilizing the “silent majority,” with a technological approach. Therefore, the participants engaged in this usability study appear to be one of the publics that our approach/prototype could encourage to be more involved in urban participatory planning.
The socio-demographic characteristics described in this section were collected from the survey that followed the experiment conducted with the prototype. This information was not available within the prototype or its resulting output.
The fictive study had two objectives. The first objective was to assess the quality of the output provided by the prototype, i.e., results that could be the output from the concept of guerrilla 3D e-participation. This analysis was conducted through a kernel density estimator and the identification of the objects discussed by the participants. Several additional investigations on the collected data are possible. However, these prospects of data exploration will only be described and not fully tackled because, on the one hand, we would like to focus more on the second objective that is described below, and on the other hand, the project under discussion is entirely fictive. The second objective was to evaluate the quality of the prototype and the user experience (positive or not) while interacting with the prototype. Hence, through the findings, we develop two outlooks, one about participatory planning practices with the introduction of the concept, and another which is more technical about the prototype itself.
Through this study we reached 26 participants, including six experts. The participants contributed with 150 data opinion points, which represented on average 5.8 contributions per participant. Therefore, participants shared more opinions than the number of project elements (5). Of these 150 contributions, 28% contained written comments shared by the participant and 21% of vocal comments. The contributions were mostly positive (60% were positive and 40% were negative). Furthermore, the written and the vocal comments were converted in length (number of words and seconds) to assess if a relationship between the length of the comment that was positively or negatively tagged could be identified. The results were evaluated with a Wilcoxon rank-sum statistical test, and output negative results for both (p > 0.05 for vocals, and p = 0.054 for written).
To investigate the appreciation of the future project by urban dwellers, we analyzed the spatial distribution of participants’ contributions (positive and negative). Figure 5 depicts the Kernel Density Estimator (KDE) of these opinions. Distributed between the positive and negative KDE, there are three main kernels, which describe areas that have collected the most contributions. Figures 5A,B highlight one kernel (close to object 1a) that is positioned at the same location for the negative and positive contributions. A shared kernel indicates a controversial area, where the participants were vividly engaged with the project elements situated in this area. Moreover, the two additional distinct kernels indicate an area where the participants seem to agree on the positivity (close to object 1b) or negativity (close to object 3 facing object 4) of the object observed at these locations. Therefore, the two areas where participants appear to share an alike perception of the project’s elements do not need further discussion, because the participants have a clear standpoint. However, the area of identified share kernel should be further discussed in additional participatory sessions, through an extended engagement in order to understand the causes of this divergence.

FIGURE 5. Kernel Density Estimator of the positive (A) and negative (B) contributions recorded by the participants. Points 1a, 1b, 2, 3, and 4 represent the objects of the project described in Figure 3.
Participants were able to record a positive or a negative contribution through the prototype at any time during their immersion in the future project. All the contributions were stored in a database with the GPS position and the orientation angles of the smartphone, although the object targeted by the participant was not documented. This free engagement had three advantages: 1) more flexibility in the prototype implementation (that is not affected by the project and its object under discussion); 2) the reduced time needed to contribute (no additional step to record the object); and 3) the ability to engage the discussion with elements that were not present within the project. For instance, it was possible to mark an empty location as negative to indicate the lack of trees or benches.
This approach implies that the targeted objects by the participants were not straightforwardly identifiable. Hence the development of a post-processing operation was required to label the targeted objects. These operations are described in Figure 6C. From the stored GPS position and orientation of the smartphone, we could create a vector, whose length was defined as greater than the study area. This vector was used as the height of an isosceles triangle, which was constructed around the vector with a short base. The triangle was then checked for any project objects enclosed on its surface. If no objects were identified, the base of the triangle was increasingly extended, until an object was detected. A maximum triangle base had also been defined to be able to detect a contribution that was not aimed at any object. The raw orientations of all the positive (blue) and negative (red) contributions are shown in Figure 6A. We can observe that contributions have a clear orientation toward the objects of the project and that it would have been possible to identify the approximate position of the objects from the orientations. Figure 6B illustrates a positive/negative distribution of the identified objects through the method presented in Figure 6C. Only three contributions did not target a project object. With the identification of the objects, we observe that bench 1b was significantly valued by the participants. The other objects demonstrated fewer differences between the positive or negative appreciations. Only the Ferris wheel (3) was considered a negative element of the project. However, because of the small differences in the participants’ opinions, objects 1a (bench), 2 (coffee house), 3 (Ferris wheel), and 4 (tower) could be discussed further through additional participatory sessions.
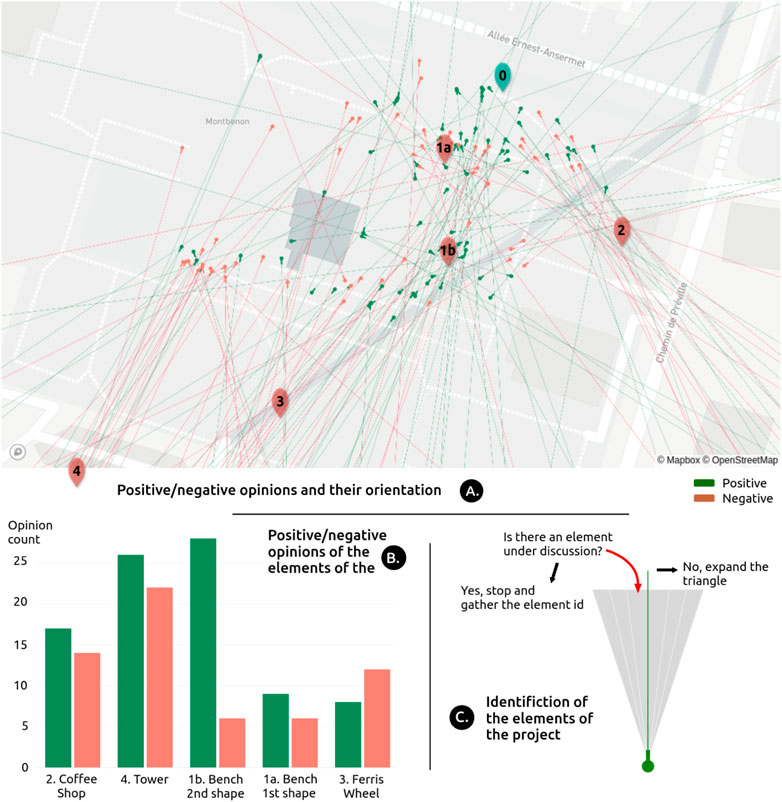
FIGURE 6. Analysis of the project’s elements targeted by the participant contributions. (A) Raw orientations of the contributions are classified as positive/negative. (B) Positive/negative distribution of the objects of the project. (C) Adopted method to recover the targeted objects from a position and an orientation.
The data collected through the prototype and consequently the concept of e-guerrilla participation could be further analyzed. In the previous section, we presented two indicators that are widely used by practitioners in urban participatory planning. In this section, we mention other indicators that could be extracted from this collected data. First, it would be possible to continue the evaluation of the targeted objects (Figure 6) by applying a filter to the orientations and their identified objects. The resulting representation would display the position from which the project objects are tagged as positive or negative, thus suggesting that certain points of view are considered more negative than positive. During the interviews, one participant mentioned a positive opinion toward the Ferris wheel from a distant location. Nevertheless, once at the base of the Ferris wheel, the participant’s opinion changed to negative (both of the points have been recorded).
Furthermore, the registered categories and tags can be assessed to identify the characteristics that were the most important for the participants. Table 2 introduces the count of tags recorded through the experiment without distinction between positive and negative. Table 2 highlights the most employed tags, and indicates the significance of these characteristics. Assessing these tags through their positive vs. negative characteristics could deliver additional information on which tags are the most important for positive aspects, or on the contrary, which tags are the most important for negative aspects. This distribution can also be connected to the targeted objects to identify which qualities each of the objects have.
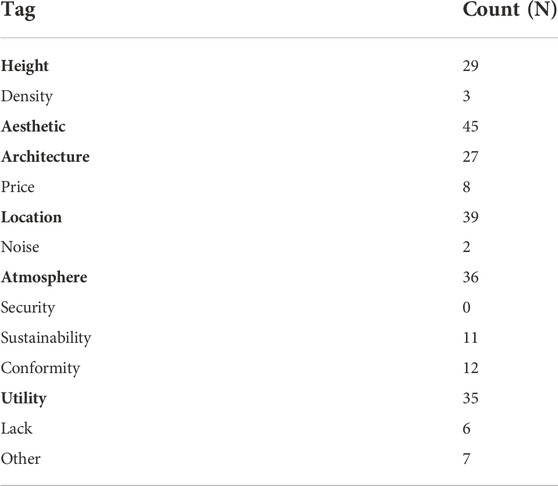
TABLE 2. Assessment of the tags recorded by the participants.
Moreover, written and vocal comments can be valorized using machine learning, and more precisely Natural Language Processing (NLP). Vocal comments can be automatically transcribed and translated. Good results were achieved with open source and free engines such as Librosa (McFee et al., 2022) and SpeechRecognition (Zhang, 2017) for the vocal-to-text transcription. Additional analysis could be performed on the text transcriptions, such as a token classification (which can identify specific components of a sentence: adjective, individual, localization, object, etc.) or sentiment analysis (that computes sentiment from a sentence: anger, joy, confusion, etc.). We suggest exploring Hugging Face (huggingface.co) to obtain these NLP engines. Furthermore, through machine learning, the voice of the participants can be analyzed in the vocal comment. The voice conveys information about the sex and the approximate age of the person; these parameters could help to identify socio-demographic characteristics, which are not collected otherwise.
The main goal of this study was to assess the usability of the guerrilla e-participation concept, its applicability, and the experience of the users in using the prototype. The last survey and interview steps contribute to evaluating this goal. Figure 7 presents the key questions posed during the survey. The answers were collected on a Likert scale (1-5) from strongly agree to strongly disagree. The experience of the participants was collected in four main categories: feedback after using the app (A.), immersive feeling (B.), understanding of the project (C.), and the fit to urban participatory planning practices (D.).
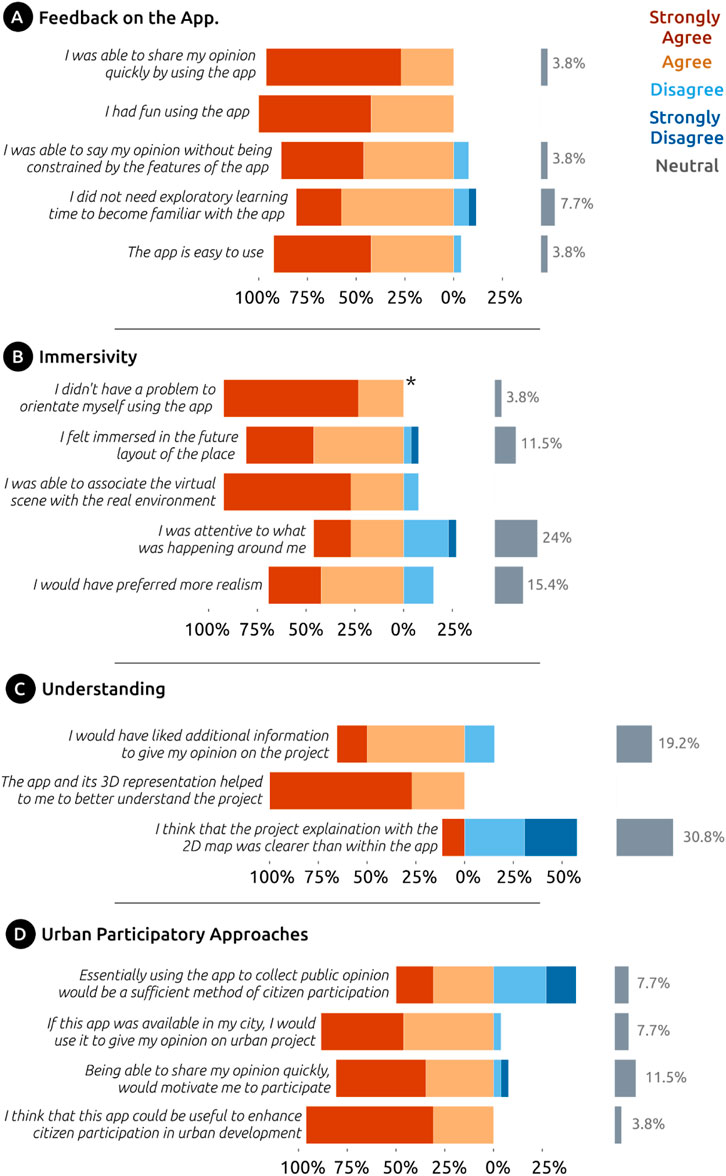
FIGURE 7. Results of the survey, portrayed on a Likert scale. * Answered as non-applicable by one of the participants. (A) Feedback on the app, (B) Immersivity. (C) Understanding. (D) Urban participatory approaches.
Participants responded very positively to the use of the prototype (namely app in the questions). The prototype ranked as easy, quick, and fun to use by nearly all the participants. This feedback is crucial because these qualities are the core of the concept implemented in this study. The reduction of available functionalities within the prototype to comply with the simplicity described in the guerrilla e-participation concept did not appear to be frustrating for the participants, who did not feel constrained for describing their contributions. The opportunity to skip or add information at any step seemed to fit the expectation of the participants, who could contribute as much as they intended to. Moreover, the exploratory learning time was considered mostly positive with more than 80% of the participants indicating seamless handling of the prototype.
The questions about immersivity were also positively received by the participants of the study. The findings demonstrate a strong connection between the virtual and real environment, with a clear self-assessed feeling of immersion in the future layout of the place. Furthermore, not recalling issues with orientation implies a good fit of the orientation of the virtual scene with the real environment. Some offsets were recorded by observation during the use of the prototype, yet in most cases, the offset was not noticed by the participants, who were too captivated by the virtual scene. The strong engagement with the prototype is demonstrated by more than 25% of the participants not being attentive to the surroundings. Following the observation notes, this number of 25% seems underestimated, because during the experiment some participants needed to be warned of the presence of people in the study area. One participant even mentioned the desire to step over one of the virtual benches, and a couple of participants even forgot to participate because there were absorbed by the prototype. Moreover, the lack of realism of the VGE was communicated several times during the interviews, and in the survey around 70% of the participants would have preferred more realism. However, the abstraction of the virtual scene was not mentioned during the use of the prototype, and it did not hinder its handling. The preference for more realism was only stated after the experiment, during the survey, or during the interviews.
Before engaging with the prototype, the future project was presented in situ with the help of a 2D map and oral explanations. The questions related to the understanding aimed to assess the role of 3D in improving the comprehension of a future project. Surprisingly, all 26 participants recorded a positive impact of 3D and the prototype to facilitate the understanding of the project with around 75% strongly agreeing with the statement. In contrast, most of the participants felt neutral (30%) or negative (>50%) that their understanding of the project was clearer with the 2D explanation. This last statement is undoubtedly affected by the spoken qualities of a facilitator, but an outstanding presentation of the project with a 2D map would be insufficient to reverse the tide. When using the prototype, the participants expressed the need for more information, which could hypothetically be implemented directly within the prototype with links to additional documentation.
According to the participants of the study, the prototype and the e-guerrilla 3D participatory concept appear to enhance participatory approaches. Participants acknowledged the usefulness of the prototype for urban participatory development. Furthermore, they indicated that quick participation is a significant incentive to encourage their participation, just as they considered the prototype to be a good way to contribute quickly. We can postulate that the concept of guerrilla e-participation could improve and increase public participation. Additionally, participants reported their desire to use the prototype if it were available in their city. However, the prototype as a unique means of engagement appears to be more dividing. Some participants indicated their disagreement with using only a prototype, but 50% would consider it sufficient. Hence, participatory approaches should be customizable to fit urban dwellers’ expectations, i.e., providing opportunities to deepen the engagement with other participatory mediums for the individuals who desire it.
Following the testing of the prototype, one step of the survey collected socio-demographic characteristics, which were used along with the answers to the survey questions to compute a correlation matrix between these two parameters. The results are depicted in Figure 8. The correlation matrix portrays 2-by-2 the correlation coefficient for these parameters. The blue color indicates a negative correlation and the red color portrays a positive correlation. Not all the pairs of parameters will be described.
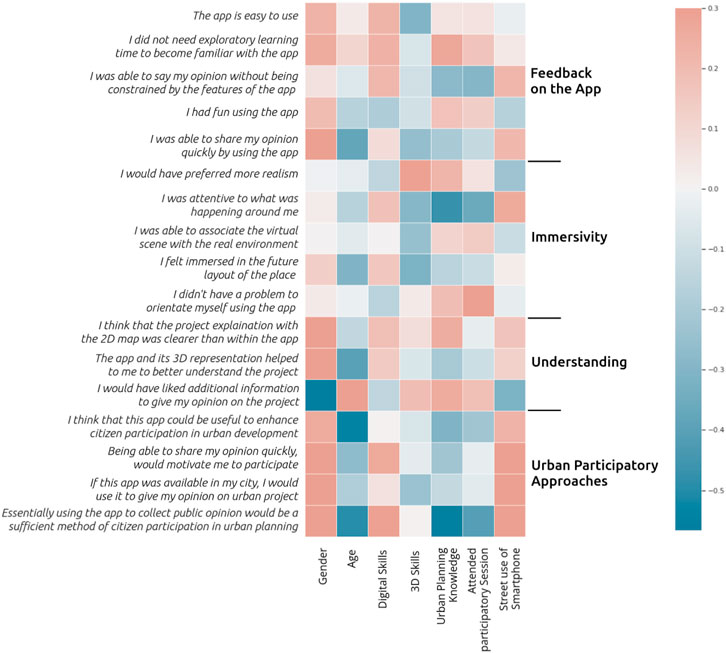
FIGURE 8. Correlation matrix between socio-demographic characteristics of the participants and their answers in the survey.
This correlation matrix was computed to investigate how socio-demographic characteristics have possibly affected the answer to the survey. Seven characteristics were denied: gender, age, digital skills, 3D skills, urban planning knowledge, attended participatory session (if a participant has already been involved in a participatory session), and street use of a smartphone (if a participant tends to use their smartphone in the street). These characteristics were encoded in increasing numerical values to compute the matrix. The findings show that age is negatively correlated with the fact that the prototype could be useful to enhance participatory planning and be used as a unique participatory tool. Therefore, the higher age means fewer expectations with the e-guerrilla participation concept. Regarding digital skills, an increase in proficiency appears to be correlated to easier handling of the prototype and the value expectation of quick engagement with digital tools only. However, higher familiarity with 3D technologies implies a higher requirement for realism and less immersivity. More expertise in urban planning, by an increased knowledge or involvement in participatory sessions, seems to be related to less enthusiasm for adopting the prototype in urban participatory planning. The opposite relationship can be observed for frequent users of smartphones.
These correlations are discussed for only 26 participants that mainly answered with similar points of view. Accordingly, a few individuals could impact the observed differences, and these differences can be measured on answers that are positive (strongly agree vs. agree).
The concept of e-guerrilla participation that has been detailed in this study demonstrated a strong potential for participatory planning. The results of the usability study portrayed informative output about participants’ preferences in the project under discussion, with the highlight of the areas and objects of controversy. During the interviews, most of the participants mentioned the simplicity of the prototype (the interactions are more natural than a mouse/keyboard), its immersive qualities, and its originality, which are also observable in the answers to the survey. Being able to explore the project in situ has been acknowledged as an engaging way to participate, with an expert participant describing the prototype as an upgrade of typical surveys, which could help to lower their dropping rate. Moreover, the immersivity facilitated the comprehension of the project. Some participants even compared the prototype to a video game. We also observed three participants that forgot to contribute because they were completely captivated by the VGE. Moreover, an expert participant mentioned that the virtual immersion in the project can adjust the participants’ mental representation of the different elements; for instance, the Ferris wheel is often mentally pictured by its structure (a base and a circle), although, cabins and the spokes are often forgotten.
Some challenges and issues were also raised during the interviews, and the engagement of the elderly was discussed. Seniors tend to experience hardship when interacting with cognitively expensive tools (Kessels et al., 2010; Lokka and Çöltekin, 2020), such as VGE. However, the prototype was designed to have natural interactive metaphors that lower the cognitive load, and no major difficulties regarding the orientation and the connection with the virtual environment were observed for the two (tech-savvy) participants over 60 years old.
The objective is to design a tool that is as inclusive as possible, but by definition, the adoption of a participatory medium excludes some individuals due to their motivations, preferences, or abilities (Chassin et al., 2021). The approach of e-guerrilla 3D participation needs to be completed by other participatory mediums and sessions, but this modern approach aims at engaging individuals that are currently hard to reach or identify (day workers, youth, the tech-savvy) without introducing barriers too difficult to break down for the usual suspect in typical participatory approaches.
One of the expert participants raised some concerns about the virtual representation of objects of the project in 3D. The virtual project provides the opportunity to visualize future objects at their exact scale. Therefore, the observation location strongly affects the experience of the project, which can be positive if seen from far and above or negative due to its magnitude from near and below. Furthermore, each additional virtual object should be exact in terms of representation and dimension; these two elements also impact the participants’ feedback. A delicate situation can result from a strong opposition by the population, which arises from the use of the prototype that portrays a virtual building bigger than the real expected dimensions. The 3D visualization of a project has a significant impact on its outcome, yet legal public opposition can only be supported by the official dimensions and sections of the project shared during the legal public inquiry. The use of 3D visuals from the prototype does not have any legal value but still represents an important input for decision-making processes.
The features of the prototype were extensively discussed during the interviews. Participants emphasized the simplicity of the interaction with the virtual geographic environment and the quality of the representation. However, most of the participants (including experts) asked for more realism and even stressed its necessity. The debate between more realism or more abstraction in virtual environments has been conflictual for years (Appleton and Lovett, 2003; Hayek, 2011; Voinov et al., 2018), and a one-size-fits-all solution has not been acknowledged in the scientific community. Regarding the prototype, the main topics of dicussion were the vegetation and the basemap. The representation of the trees within the VGE was recovered from the default style in the Swisstopo data. Trees were modeled in basic colors, trunk in brown and crown in green, and their size varied according to their registered height (see Figure 3). However, they all had a unique generic shape, which is not dynamic according to their species, or the shape of their canopy (following a prune or the season). The expert participants stressed the importance of trees and greenery in every urban project since natural elements are considered crucial by the population (Chételat, 2005). Consequently, a recommendation would be to improve the realism of these green elements in the VGE. The second aspect of realism was the basemap. The selected abstract representation (also from Swisstopo) did not contain enough granularity and the virtual colors were different than the real elements, such as the pathways (see Figure 3). A solution often mentioned was to adopt a satellite image, instead. However, the implementation of a photorealistic component with the abstract representation of the trees and the buildings could potentially be too contrasting. Hence, an adequate approach would be to use the main color of the real component to texture the virtual component within the virtual environment, which would improve the realism of the scene without demanding excessive time for the redesign of the elements or computational power to render the VGE. Due to the realism in the CGI (computer-generated imagery) and the video game industry, the expectation for realism can be considered as disproportionate compared to the time and budget provided to urban participatory approaches.
The tasks that participants had to perform were well understood and did not present any difficulties. However, participants indicated issues in identifying which elements were under negotiation. These elements implemented in the virtual environment were not contrasting enough to be understood as interactive. A radar showing the location of the objects was implemented in the prototype but the radar was portrayed as unclear (regarding the distances) or was not consulted by the participants. An improvement could be to create an exclamation mark on the top of each object under discussion. The addition of this sign could create contrast within the virtual environment, hence encouraging participants to interact with the object. These mechanisms could also leverage another concern specified by the participants, which is the lack of information related to the objects. In the prototype, each of the objects was connected to a simplified information box, which appeared when a project object was clicked. However, due to the lack of contrast among the virtual project objects, only half of the participants consulted this information box, which partially explains the lack of information. Furthermore, the oversimplified information box was too brief, so participants (and experts) requested more information such as the material employed, the cost of the object, or a photomontage depicting the object.
The step, where participants had to select the tags was not well understood. Too many tags were present at this step, which forced the participant to take a significant amount of time to get familiar with them, which is not in line with the immediate participation dimension. Furthermore, the tags were not responsive to the participants’ previous steps, which lead to disorientation. Some of the tags were rarely or never used, so their usefulness can be questioned. The objective of these tags was to enable the participants to add supplementary information to their contribution and to provide categories in the data that could be analyzed. Six tags were extensively used, and an improvement to this tagging mechanism would be to reduce the number of tags shown to the participants or to display them according to the participants’ inputs.
The prototype has been tested to immerse the participants in a future project just before a legal public inquiry, which allows the population to legally oppose the project under discussion. In this scenario, participants were able to discuss objects of the project that they liked or disliked through the prototype. This implementation is one specific example of the opportunity offered by the e-guerrilla 3D participation approach. One of the topics reviewed with the expert participants during the interviews was the potential applications of this approach in other contexts. Several propositions were discussed.
One scenario, similar to the one implemented, was the adoption of the approach for revisiting the legal public inquiry. This process is not appealing to the population, who only have 30 days to visit in-person the city office to consult the legal documents, and the latter are not easy to understand. This legal step is often associated with a physical mock-up placed in situ at a 1:1 scale. However, these mock-ups are created by placing vertical poles in the landscape, which can be hard to apprehend for non-expert eyes. The approach demonstrated in this study could facilitate the visualization of the project’s mock-up and improve its legibility.
Another mentioned scenario was the comparison of different alternative projects. Using the prototype, the participants could be immersed in different projects, such as street furniture layouts, building materials, or architecture designs. The virtual exploration of these future alternatives could help the participants to better understand the impact of the project on the urban landscape. The prototype could also enable voting for the preferred alternative.
Furthermore, the prototype could also be adopted as a simple informative tool, where each of the elements of the project could be visualized and consulted. Some participants suggested the implementation of an overall view, where they could envision the full project from a unique perspective (i.e., leaving the immersive view). The location of the overall view could be pre-recorded, or free, according to the participants’ needs. A flexible location could allow the participants to visualize the project from a precise position such as the window of a house affected by the project.
Some limitations of this study should be mentioned.
The limited number of participants (<30) that were involved in the usability study, increases the weight of each participant’s answers, and disrupts the significance of the statistical tests. Moreover, any user study is subjected to bias introduced by the presence of the facilitator (also called the presenter bias) (Dell et al., 2012). This bias suggests that participants tend to give more positive feedback to the technological solution that has been implemented by the presenter. This bias could have been significant due to the small number of participants in the survey and interview step of the usability study.
The libraries used to implement the prototype are still not completely stable and not all browsers are compatible (e.g., Safari and Firefox), which may lead to unexpected behavior on a larger scale. Moreover, the current versatility of smartphone offerings leads to confronting overwhelming differences in the consumer pockets in terms of screen sizes, browsers, or device architectures, which challenges the development of prototypes that are fully responsive. Also, the use of a virtual globe, here to portray 3D objects, is computationally expensive. Even with the recent technological optimization with WebGPU and 3D tiling, older devices may not be able to render the 3D environment.
Quick digital interactions, such as those implemented in our approach, may alter the meaning of the participants’ contributions and a gap could be introduced between the participants’ original opinion and the one that is recorded within the prototype (especially when the opinion is nuanced). Furthermore, as already mentioned earlier, a participatory medium will exclude some part of the population, so this approach should be complemented with other participatory sessions.
In this study, we introduced a new approach that transforms urban participatory e-planning with 3D technologies. The recent bandwidth development with 4G and 5G, in addition to the broad availability of public wi-fi hotspots, offers opportunities to reconnect the location of the population engagement with the area under transformation by the project. Based on this prospect, our approach provides an in situ involvement of the participants, who can explore freely a future project in a semi-immersive environment using only their smartphones present in their pockets. A prototype was implemented and tested during a usability study. Expert and non-expert participants acknowledged the approach and the prototype as refreshing and forward-looking.
We will now focus on improving the prototype by considering the aspects discussed with the participants and strengthening the quality of the output of the prototype by adding new analyses. One key missing component is a real-time administrative visualization tool. This component (e.g., a dashboard) could be valuable to practitioners, who would be able to easily assess the status of the participatory session. The ultimate goal of these improvements would be to design a prototype mature enough to discuss with municipality officials about its applicability in a real case project. Testing the prototype in this context would allow us to evaluate the range of the participatory transformations promoted by our approach.
The mentioned flexibility in our approach aims to create a participatory medium that could be suitable for a large range of contexts (i.e., generic) that are inherent to urban participatory planning. The use of 3D visualizations requires specific data, which is most of the time not available (hence time-consuming to create), or pricey. The difficult access to this data can hinder the adoption of 3D visualizations in participatory planning approaches. Fortunately, this data is becoming gradually available with open data initiatives, Volunteered Geographic Information (VGI) projects (e.g., OpenStreetMap Buildings, osmbuildings.org), and LIDAR data (necessary for self-driving cars). Generic participatory tools could facilitate the implementation of 3D technologies in participatory planning projects in terms of creation time and qualifications (coding, knowledge, etc.), hence providing more opportunities to the authorities (that do not always have the capacities) to adopt advanced participatory mechanisms, which could ultimately lead to more meaningful and inclusive participatory planning.
The original contributions presented in the study are included in the github page of the project, further inquiries can be directed to the corresponding author.
TC: Conceptualization, methodology, software, formal analysis, writing—original draft. JI: supervision, validation, writing—review and editing.
We would like to thank the participants for their generous time and valuable feedback that made this project possible. The base code of the prototype used in this study is open source under the license MIT, available on github: https://github.com/thibaud-c/VirtualCesiumPortal.
The authors declare that the research was conducted in the absence of any commercial or financial relationships that could be construed as a potential conflict of interest.
All claims expressed in this article are solely those of the authors and do not necessarily represent those of their affiliated organizations, or those of the publisher, the editors and the reviewers. Any product that may be evaluated in this article, or claim that may be made by its manufacturer, is not guaranteed or endorsed by the publisher.
Al-Kodmany, K. (1999). Using visualization techniques for enhancing public participation in planning and design: Process, implementation, and evaluation. Landsc. Urban Plan. 45 (1), 37–45. doi:10.1016/S0169-2046(99)00024-9
Al-Kodmany, K. (2001). Visualization tools and methods for participatory planning and design. J. Urban Technol. 8 (2), 1–37. doi:10.1080/106307301316904772
Appleton, K., and Lovett, A. (2003). GIS-Based visualisation of rural landscapes: Defining “sufficient” realism for environmental decision-making. Landsc. Urban Plan. 65 (3), 117–131. doi:10.1016/S0169-2046(02)00245-1
Babelon, I., Pánek, J., Falco, E., Kleinhans, R., and Charlton, J. (2021). Between consultation and collaboration: Self-reported objectives for 25 web-based geoparticipation projects in urban planning. ISPRS Int. J. Geoinf. 10 (11), 783. doi:10.3390/ijgi10110783
Basile, M., and Terrin, J.-J. (2010). Le projet IP City Une recherche sur la place des technologies de réalité mixte dans les représentations du projet urbain. Flux 78 (4), 58–67. doi:10.3917/flux.078.0058
Besançon, L., Issartel, P., Ammi, M., and Isenberg, T. (2017). “May 2) mouse, tactile, and tangible input for 3D manipulation,” in Proceedings of the 2017 CHI Conference on Human Factors in Computing Systems. CHI ’17: CHI Conference on Human Factors in Computing Systems (Denver Colorado USA. doi:10.1145/3025453.3025863
Bohøj, M., Borchorst, N. G., Bødker, S., Korn, M., and Zander, P.-O. (2011). “Public deliberation in municipal planning,” in Proceedings of the 5th international conference on communities and technologies. doi:10.1145/2103354.2103367
Brown, G., Donovan, S., Pullar, D., Pocewicz, A., Toohey, R., and Ballesteros-Lopez, R. (2014). An empirical evaluation of workshop versus survey PPGIS methods. Appl. Geogr. 48, 42–51. doi:10.1016/j.apgeog.2014.01.008
Brown, G., and Eckold, H. (2020). An evaluation of public participation information for land use decisions: Public comment, surveys, and participatory mapping. Local Environ. 25 (2), 85–100. doi:10.1080/13549839.2019.1703660
Brown, G. (2012). Public participation GIS (PPGIS) for regional and environmental planning: Reflections on a decade of empirical research. URISA J. 24 (2), 7
Bugs, G., Granell, C., Fonts, O., Huerta, J., and Painho, M. (2010). An assessment of Public Participation GIS and Web 2.0 technologies in urban planning practice in Canela, Brazil. Cities 27 (3), 172–181. doi:10.1016/j.cities.2009.11.008
Bugs, G., and Kyttä, M. (2019). “Public perception spatial data from the PPGIS jaguarão experiment,” in Civic engagement and politics, 177–198. doi:10.4018/978-1-5225-7669-3.ch009
Burigat, S., and Chittaro, L. (2007). Navigation in 3D virtual environments: Effects of user experience and location-pointing navigation aids. Int. J. Human-Computer Stud. 65 (11), 945–958. doi:10.1016/j.ijhcs.2007.07.003
Cariello, A., Ferorelli, R., and Rotondo, F. (2021). Tactical urbanism in Italy: From grassroots to institutional tool—Assessing value of public space experiments. Sustainability 13 (20), 11482. doi:10.3390/su132011482
Carpini, M. X. D., Cook, F. L., and Jacobs, L. R. (2004). Public deliberation, discursive participation, and citizen engagement: A review of the empirical literature. Annu. Rev. Polit. Sci. Palo. Alto. 7 (1), 315–344. doi:10.1146/annurev.polisci.7.121003.091630
Chassin, T., Cherqui, A., Ingensand, J., and Joerin, F. (2021). Impact of digital and non-digital urban participatory approaches on public access conditions: An evaluation framework. ISPRS Int. J. Geoinf. 10 (8), 563. doi:10.3390/ijgi10080563
Chassin, T., and Ingensand, J. (2021). Are city features influencing the behavior of photographers? An analysis of geo-referenced photos shooting orientation. Int. Arch. Photogramm. Remote Sens. Spat. Inf. Sci. 2021, 353–359. doi:10.5194/isprs-archives-XLIII-B4-2021-353-2021
Chassin, T., Ingensand, J., Christophe, S., and Touya, G. (2022). Experiencing virtual geographic environment in urban 3D participatory e-planning: A user perspective. Landsc. Urban Plan. 224 (104432), 104432. doi:10.1016/j.landurbplan.2022.104432
Chételat, J. (2005). Éléments méthodologiques de diagnostic paysager utilisant les systèmes d’information géographique. Lausanne: EPFL. doi:10.5075/EPFL-THESIS-2961
Christophe, S. (2020). “Geovisualization: Multidimensional exploration of the territory,” in Proceedings of the 15th International Joint Conference on Computer Vision, Imaging and Computer Graphics Theory and Applications (Valletta, Malta: 11th International Conference on Information Visualization Theory and Applications). doi:10.5220/0009355703250332
Çöltekin, A., Lokka, I., and Zahner, M. (2016). “On the usability and usefulness of 3d (Geo)Visualizations – a focus on virtual reality environments,” in The international archives of the photogrammetry, remote sensing and spatial information sciences, XLI– B2, 387–392. doi:10.5194/isprs-archives-xli-b2-387-2016
Courage, C. (2013). The global phenomenon of tactical urbanism as an indicator of new forms of citizenship. Engage 32: Citizenship and Belonging Available at: https://www.academia.edu/4078236/The_global_phenomenon_of_tactical_urbanism_as_an_indicator_of_new_forms_of_citizenship (Accessed November 8, 2022).
Czepkiewicz, M., Jankowski, P., and Zwoliński, Z. (2018). Geo-questionnaire: A spatially explicit method for eliciting public preferences, behavioural patterns, and local knowledge – an overview. Quaest. Geogr. 37 (3), 177–190. doi:10.2478/quageo-2018-0033
Dell, N., Vaidyanathan, V., Medhi, I., Cutrell, E., and Thies, W. (2012). “Yours is better! Proceedings of the SIGCHI conference on human factors in computing systems,” in CHI ’12: CHI Conference on Human Factors in Computing Systems (Austin Texas USA. doi:10.1145/2207676.2208589
Diederichs, F., Niehaus, F., and Hees, L. (2020). “Guerilla evaluation of truck HMI with VR,” in Virtual, augmented and mixed reality. Design and Interaction. 3–17. doi:10.1007/978-3-030-49695-1_1
Ertiö, T.-P. (2015). Participatory apps for urban planning—Space for improvement. Plan. Pract. Res. 30 (3), 303–321. doi:10.1080/02697459.2015.1052942
Everatt, D., Marais, H., and Dube, N. (2010). Participation for what purpose? Analysing the depth and quality of public participation in the integrated development planning process in gauteng. Politikon 37 (2-3), 223–249. doi:10.1080/02589346.2010.522333
Falco, E., Zambrano-Verratti, J., and Kleinhans, R. (2019). Web-based participatory mapping in informal settlements: The slums of Caracas, Venezuela. Habitat Int. 94 (102038), 102038. doi:10.1016/j.habitatint.2019.102038
Foltête, J.-C., Ingensand, J., and Blanc, N. (2020). Coupling crowd-sourced imagery and visibility modelling to identify landscape preferences at the panorama level. Landsc. Urban Plan. 197 (103756), 103756. doi:10.1016/j.landurbplan.2020.103756
Gill, L., and Lange, E. (2015). Getting virtual 3D landscapes out of the lab. Comput. Environ. Urban Syst. 54, 356–362. doi:10.1016/j.compenvurbsys.2015.09.012
Haklay, M., Jankowski, P., and Zwoliński, Z. (2018). Selected modern methods and tools for public participation in urban planning – a review. Quaest. Geogr. 37 (3), 127–149. doi:10.2478/quageo-2018-0030
Hayek, U. W. (2011). Which is the appropriate 3D visualization type for participatory landscape planning workshops? A portfolio of their effectiveness. Environ. Plann. B. Plann. Des. 38, 921–939. doi:10.1068/b36113
Healey, P. (1998). Collaborative planning in a stakeholder society. Town Plan. Rev. 69 (1), 1. doi:10.3828/tpr.69.1.h651u2327m86326p
Hunter, M., Soro, A., and Brown, R. (2021). Enhancing urban conversations for smarter cities: Augmented reality as an enabler of digital civic participation. QUT ePrints (No. 48) Available at: https://eprints.qut.edu.au/210604/ (Accessed November 8, 2022).
Ingensand, J., Lotfian, M., Ertz, O., Piot, D., Oberson, M., Oulevay, S., et al. (2018). “Augmented reality technologies for biodiversity education – a case study,” in AGILE 2018, Lund, Sweden, June 12–15, 2018 Available at: https://arodes.hes-so.ch/record/2422 (Accessed November 8, 2022).
Innes, J. E., and Booher, D. E. (2004). Reframing public participation: Strategies for the 21st century. Plan. Theory & Pract. 5 (4), 419–436. doi:10.1080/1464935042000293170
Jory, C. A., Shankar, R., Taylor, K., Martin, J., and Smee, C. (2014). At the touch of a button: Collecting client feedback. Learn. Disabil. Pract. 17 (3), 36–38. doi:10.7748/ldp2014.03.17.3.36.e1530
Kahila-Tani, M., Kytta, M., and Geertman, S. (2019). Does mapping improve public participation? Exploring the pros and cons of using public participation GIS in urban planning practices. Landsc. Urban Plan. 186, 45–55. doi:10.1016/j.landurbplan.2019.02.019
Kessels, R. P. C., Meulenbroek, O., Fernández, G., and Olde Rikkert, M. G. M. (2010). Spatial working memory in aging and mild cognitive impairment: Effects of task load and contextual cueing. Aging Neuropsychology Cognition 17 (5), 556–574. doi:10.1080/13825585.2010.481354
Keysers, J. (2015). ). Digital globe review 2015. Australia and New Zealand cooperative research centre for spatial information. Available at: https://www.crcsi.com.au/assets/Uploads/Globe-review-paper-March-2015.pdf (Accessed November 8, 2022).
Kingston, R., Carver, S., Evans, A., and Turton, I. (2000). Web-based public participation geographical information systems: An aid to local environmental decision-making. Comput. Environ. Urban Syst. 24 (2), 109–125. doi:10.1016/S0198-9715(99)00049-6
Korn, M. (2013). Situating engagement: Ubiquitous infrastructures for in-situ civic engagement. Available at: https://pure.au.dk/portal/files/56904964/phd2013.pdf (Accessed November 8, 2022)
Krämer, M., and Gutbell, R. (2015). “June 18). A case study on 3D geospatial applications in the web using state-of-the-art WebGL frameworks,” in Proceedings of the 20th International Conference on 3D Web Technology. (Heraklion Crete Greece: Web3D ’15: The 20th International Conference on Web3D Technology). doi:10.1145/2775292.2775303
Lafrance, F., Daniel, S., and Dragićević, S. (2019). Multidimensional web GIS approach for citizen participation on urban evolution. ISPRS Int. J. Geoinf. 8 (6), 253. doi:10.3390/ijgi8060253
Lak, A., and Zarezadeh Kheibari, S. (2020). Towards a framework for facilitating the implementation of tactical urbanism practices: Assessment criteria in the place-making approach in Iran. Geoforum 115, 54–66. doi:10.1016/j.geoforum.2020.07.003
Lallemand, C., and Gronier, G. (2018). Méthodes de design UX: 30 méthodes fondamentales pour concevoir des expériences optimales. Paris, France: Editions Eyrolles.
Lin, H., and Gong, J. (2001). Exploring virtual geographic environments. Ann. GIS 7 (1), 1–7. doi:10.1080/10824000109480550
Lin, H., Xu, B., Chen, Y., Jing, Q., and You, L. (2022). “The virtual geographic environments: More than the digital twin of the physical geographical environments,” in New thinking in GIScience (Singapore: Springer Nature). doi:10.1007/978-981-19-3816-0_3
Lokka, I. E., and Çöltekin, A. (2020). Perspective switch and spatial knowledge acquisition: Effects of age, mental rotation ability and visuospatial memory capacity on route learning in virtual environments with different levels of realism. Cartogr. Geogr. Inf. Sci. 47 (1), 14–27. doi:10.1080/15230406.2019.1595151
Lokka, I. E., Çöltekin, A., Wiener, J., Fabrikant, S. I., and Röcke, C. (2018). Virtual environments as memory training devices in navigational tasks for older adults. Sci. Rep. 8 (1), 10809. doi:10.1038/s41598-018-29029-x
Lydon, M., and Garcia, A. (2015). Tactical urbanism: Short-term action for long-term change. Washington: Island Press.
McFee, B., Metsai, A., McVicar, M., Balke, S., Thomé, C., Raffel, C., et al. (2022). librosa/librosa. Zenodo. doi:10.5281/ZENODO.6759664
McLain, R. J., Banis, D., Todd, A., and Cerveny, L. K. (2017). Multiple methods of public engagement: Disaggregating socio-spatial data for environmental planning in Western Washington, USA. J. Environ. Manag. 204 (1), 61–74. doi:10.1016/j.jenvman.2017.08.037
Metze, T. (2020). Visualization in environmental policy and planning: A systematic review and research agenda. J. Environ. Policy & Plan. 22 (5), 745–760. doi:10.1080/1523908X.2020.1798751
Milgram, P., Takemura, H., Utsumi, A., and Kishino, F. (1995). Augmented reality: A class of displays on the reality-virtuality continuum. SPIE Proc. doi:10.1117/12.197321
Morgan-Daniel, J., Adkins, L. E., Tennant, M. R., Norton, H. F., Hough, C., Edwards, M. E., et al. (2021). Piloting a diversity, equity, and inclusion needs assessment to explore patron perceptions at a University health science library. Hypothesis 33 (1), 25262. doi:10.18060/25262
Mossberger, K., and Tolbert, C. J. (2021). Digital citizenship and digital communities. Int. J. E-Planning Res. 10 (3), 19–34. doi:10.4018/IJEPR.20210701.oa2
Münster, S., Georgi, C., Heijne, K., Klamert, K., Rainer Noennig, J., Pump, M., et al. (2017). How to involve inhabitants in urban design planning by using digital tools? An overview on a state of the art, key challenges and promising approaches. Procedia Comput. Sci. 112, 2391–2405. doi:10.1016/j.procs.2017.08.102
Nielsen, J. (1994). Guerrilla HCI: Using discount usability engineering to penetrate the intimidation barrier. Nielsen Norman Group. Available at: https://www.nngroup.com/articles/guerrilla-hci/.
Onitsuka, K., Ninomiya, K., and Hoshino, S. (2018). Potential of 3D visualization for collaborative rural landscape planning with remote participants. Sustainability 10 (9), 3059. doi:10.3390/su10093059
Pánek, J. (2018). Participatory mapping in Community participation – case study of Jeseník, Czech Republic. Quaest. Geogr. 37 (3), 151–162. doi:10.2478/quageo-2018-0031
Peng, Z.-R. (2001). Internet GIS for public participation. Environ. Plann. B. Plann. Des. 28 (6), 889–905. doi:10.1068/b2750t
Pouke, M., Ylipulli, J., Rantala, S., Alavesa, P., Alatalo, T., and Ojala, T. (2019). “A qualitative study on the effects of real-world stimuli and place familiarity on presence,” in 2019 IEEE 5th Workshop on Everyday Virtual Reality (Osaka, Japan: WEVR). doi:10.1109/wevr.2019.8809590
Ring, K. (2020).Introducing cesium OSM buildings. Cesium. Available at: https://cesium.com/blog/2020/06/01/cesium-osm-buildings/ (Accessed November 8, 2022).
Rinner, C. (2001). Argumentation maps: GIS-based discussion support for on-line planning. Environ. Plann. B. Plann. Des. 28 (6), 847–863. doi:10.1068/b2748t
Roque de Oliveira, A., and Partidário, M. (2020). You see what I mean? – a review of visual tools for inclusive public participation in eia decision-making processes. Environ. Impact Assess. Rev. 83 (106413), 106413. doi:10.1016/j.eiar.2020.106413
Rowe, G., and Frewer, L. J. (2000). Public participation methods: A framework for evaluation. Sci. Technol. Hum. Values 25 (1), 3–29. doi:10.1177/016224390002500101
Ruming, K., Houston, D., and Amati, M. (2012). Multiple suburban publics: Rethinking community opposition to consolidation in Sydney. Geogr. Res. 50, 421–435. doi:10.1111/j.1745-5871.2012.00751.x
Ruming, K. (2018). Post-political planning and community opposition: Asserting and challenging consensus in planning urban regeneration in newcastle, new south wales. Geogr. Res. 56 (2), 181–195. doi:10.1111/1745-5871.12269
Schroth, O., Pond, E., Campbell, C., Cizek, P., Bohus, S., and Sheppard, S. R. J. (2011). Tool or toy? Virtual globes in landscape planning. Future Internet 3 (4), 204–227. doi:10.3390/fi3040204
Sieber, R. E., Robinson, P. J., Johnson, P. A., and Corbett, J. M. (2016). Doing public participation on the geospatial web. Ann. Am. Assoc. Geogr. 106 (5), 1030–1046. doi:10.1080/24694452.2016.1191325
Sieber, R. (2006). Public participation geographic information systems: A literature review and framework. Ann. Assoc. Am. Geogr. 96 (3), 491–507. doi:10.1111/j.1467-8306.2006.00702.x
Silva, P. (2016). Tactical urbanism: Towards an evolutionary cities’ approach? Environment and planning. Environ. Plann. B. Plann. Des. 43, 1040–1051. doi:10.1177/0265813516657340
Sinclair, A. J., Peirson-Smith, T. J., and Boerchers, M. (2017). Environmental assessments in the internet age: The role of e-governance and social media in creating platforms for meaningful participation. Impact Assess. Proj. Apprais. 35, 148–157. doi:10.1080/14615517.2016.1251697
StatCounter (2022). Desktop vs mobile vs tablet market share worldwide. StatCounter Global Stats. Available at: https://gs.statcounter.com/platform-market-share/desktop-mobile-tablet/worldwide/.
Steiniger, S., Poorazizi, M. E., and Hunter, A. J. S. (2016). Planning with citizens: Implementation of an e-planning platform and analysis of research needs. Urban Plan. 1 (2), 46–64. doi:10.17645/up.v1i2.607
Stevens, Q., Awepuga, F., and Dovey, K. (2021). Temporary and tactical urbanism in Australia: Perspectives from practice. Urban Policy Res. 39 (3), 262–275. doi:10.1080/08111146.2021.1963225
Talen, E. (1999). Constructing neighborhoods from the bottom up: The case for resident-enerated GIS. Environ. Plann. B 26, 533–554. doi:10.1068/b260533
Ugwitz, P., Juřík, V., Herman, L., Stachoň, Z., Kubíček, P., and Šašinka, Č. (2019). Spatial analysis of navigation in virtual geographic environments. Appl. Sci. (Basel). 9 (9), 1873. doi:10.3390/app9091873
Virtanen, J.-P., Hyyppä, H., Kurkela, M., Vaaja, M. T., Puustinen, T., Jaalama, K., et al. (2018). Browser based 3D for the built environment. Nordic J. Surv. Real Estate Res. 13 (1), 54–76. doi:10.30672/njsr.67846
Voinov, A., Çöltekin, A., Chen, M., and Beydoun, G. (2018). Virtual geographic environments in socio-environmental modeling: A fancy distraction or a key to communication? Int. J. Digital Earth 11 (4), 408–419. doi:10.1080/17538947.2017.1365961
Wobbrock, J. O., Myers, B. A., and Aung, H. H. (2008). The performance of hand postures in front- and back-of-device interaction for mobile computing. Int. J. Human-Computer Stud. 66 (12), 857–875. doi:10.1016/j.ijhcs.2008.03.004
Würstle, P., Santhanavanich, T., Padsala, R., and Coors, V. (2021). Development of a digital 3d participation platform – case study of Weilimdorf (Stuttgart, Germany). Int. Arch. Photogramm. Remote Sens. Spat. Inf. Sci. XLVI-4, 123–129. doi:10.5194/isprs-archives-XLVI-4-W1-2021-123-2021
Zaman, S. R., Sadekeen, D., Alfaz, M. A., and Shahriyar, R. (2021). “One source to detect them all: Gender, age, and emotion detection from voice,” in 2021 IEEE 45th Annual Computers, Software, and Applications Conference (COMPSAC). (Madrid, Spain: 2021 IEEE 45th Annual Computers, Software, and Applications Conference COMPSAC). doi:10.1109/compsac51774.2021.00055
Zhang, A. (2017). Speech recognition. [Python Available at: https://github.com/Uberi/speech_recognition (Accessed November 8, 2022)
Keywords: participatory sciences, urban planning, urban participatory e-planning, 3D, virtual geographic environment, e-guerrilla 3D participation
Citation: Chassin T and Ingensand J (2022) E-guerrilla 3D participation: Approach, implementation, and usability study. Front. Virtual Real. 3:1054252. doi: 10.3389/frvir.2022.1054252
Received: 26 September 2022; Accepted: 26 October 2022;
Published: 25 November 2022.
Edited by:
Shuva Chowdhury, Southern Institute of Technology, New ZealandReviewed by:
Hyekyung Imottesjo, Chalmers University of Technology, SwedenCopyright © 2022 Chassin and Ingensand. This is an open-access article distributed under the terms of the Creative Commons Attribution License (CC BY). The use, distribution or reproduction in other forums is permitted, provided the original author(s) and the copyright owner(s) are credited and that the original publication in this journal is cited, in accordance with accepted academic practice. No use, distribution or reproduction is permitted which does not comply with these terms.
*Correspondence: Thibaud Chassin, dGhpYmF1ZC5jaGFzc2luQGVwZmwuY2g=
Disclaimer: All claims expressed in this article are solely those of the authors and do not necessarily represent those of their affiliated organizations, or those of the publisher, the editors and the reviewers. Any product that may be evaluated in this article or claim that may be made by its manufacturer is not guaranteed or endorsed by the publisher.
Research integrity at Frontiers
Learn more about the work of our research integrity team to safeguard the quality of each article we publish.