 Xiang Gu1
 Lihan Chen
 Sheng Li
 - 1Lab of Graphics and Interaction, School of Computer Science, Peking University, Beijing, China
- 2School of Psychological and Cognitive Sciences, Peking University, Beijing, China
Immersive virtual technology has been widely used to modulate sociocognitive processes, such as changing individuals’ implicit attitudes towards specific groups. As to measure the effect, the implicit association test (IAT) is the most used one. However, IAT itself is controversial for its construct validity and commonly requires participants to quit virtual environments (VEs) to complete. Here, we propose an alternative paradigm, the “interpersonal distance paradigm”, which measures attitudes using interpersonal distance and can be conducted in VEs. We conducted a user study measuring weight stigma to compare the effectiveness of the interpersonal distance paradigm with two classical paradigms: the questionnaire and IAT. Results revealed a floor effect in the questionnaire method and no significant correlation between the two classic paradigms. The measurement of interpersonal distance showed a weak positive correlation with the questionnaire score, but not with IAT score. In future research, the results of more measurement methods should be combined to obtain more accurate results to better evaluate this new paradigm’s validity. The accurate results can help quantify the effects of the programs aiming at reducing weight stigma.
1 Introduction
When measuring people’s opinions on specific groups, implicit measurements is often preferred than explicit measurements for their ability to help reduce bias, such as social-desirability bias (Krumpal, 2013). One of the most frequently used paradigms is Greenwald et al.’s implicit association test (IAT) (Greenwald et al., 1998). It infers participants’ implicit stereotypes from the subconscious associations between mental representations of concepts in memory. Participants are required to sort different kinds of stimuli (e.g., images of fit men and men with obesity, and positive and negative words) into different categories (e.g., Good, Bad, Right, and Wrong) (Brownstein et al., 2019). The basic principle is that the closer the association between two concepts (e.g., “Honest” and “Good”) is, the easier it is for people to respond consistently to them. Therefore, the difference in reaction time between compatible tasks (with strong conceptual associations) and incompatible tasks (with weak or even conflicting conceptual associations) is used to reflect the strength of association between the concepts at the implicit cognitive level.
However, the implicit measures still have some drawbacks. First, the implicit ways do not measure attitudes actually. IAT is invented to represent conceptual link tightness by response time (Greenwald et al., 1998), but not exactly analyze high-level cognitions, i.e., attitudes. Therefore, it remains debatable how the experimental results of IAT can be interpreted. Second, there are various methods for data analysis because there is no common view about converting reaction time to attitudes. Taking IAT as an example, there are log transformation (Greenwald et al., 2003), median, mean, D score (Greenwald et al., 1998), z score, etc.
Nowadays, a well-designed virtual environment (VE) will evoke physiological responses similar to the ones that would occur in the corresponding physical world (Li et al., 2022), which enables us to infer people’s reaction towards specific groups in the real life from their behavior in the VE. Based by this, we proposed a new implicit paradigm conducted in VEs, the “interpersonal distance paradigm”, which measures attitudes using interpersonal distance in VEs. To evaluate its effectiveness, we used this paradigm to measure weight stigma and compare the result with results from other measurements.
1.1 Self-report explicit measurement
Weight stigma refers to “the discriminatory acts and ideologies targeted towards individuals because of their weight and size” (World Obesity Federation, 2018). The most frequently used self-report questionnaire is the Antifat Attitudes Test (AFAT) designed by Lewis (Lewis et al., 1997), which will be used in our study. This questionnaire is a five-point Likert scale with 47 items, measuring social/character disparagement, physical/romantic unattractiveness, and weight control/blame. Higher score indicates more weight stigma and “3” indicates neutral in the questionnaire. Also, questionnaires such as the Anti-fat Attitudes Questionnaire (AFA) (Crandall, 1994), Anti-fat Attitudes Scale (AFAS) (Morrison and O’connor, 1999), and Attitudes toward Obese Persons Scale (ATOP) (Allison et al., 1991) are also frequently used.
1.2 Implicit measurement
In this study, we will use the original IAT (Greenwald et al., 1998) to explore the implicit cognition on non-obese and obese groups, and then characterize weight stigma.
Other implicit measures, such as the priming task, also use reaction time to represent implicit attitudes. The priming task paradigm assumes that the stimulus information previously presented facilitates the processing of the target stimulus. The experiment is divided into two parts. Firstly, participants are asked to respond to the target stimulus (e.g., negative word) as quickly as possible to determine the baseline level. Secondly, a priming stimulus (e.g., “obese”) is presented before the target stimulus. The difference between two reaction times can be used to represent implicit cognition (Degner and Wentura, 2011).
1.3 Interpersonal distance
Interpersonal distance is the physical distance that individuals choose to maintain between themselves and others while interacting. Different zones of interpersonal distance are related to different social functions: intimate space (0–45 cm), personal space (45–120 cm), social space (129–365 cm), and public space (365–762 cm) (Goldman, 1969). Yaremych and Persky. (2019) reviewed the studies that use interpersonal distance and other physical movement to assess interpersonal bias and related constructs. Bessenoff and Sherman. (2000) found that self-reported anti-fat attitudes positively correlated with their interpersonal distance from women with obesity. Welsch et al. (2020) found that sexual attraction helps reduce the preferred interpersonal distance in the virtual reality. Ya et al. (2018) found that people kept closer interpersonal distances from the avatars of the same ethnic group as theirs. Similarly, we made some adaptions on the way to measure interpersonal distances and propose a paradigm in our study.
There are three main methodologies to demonstrate one’s interpersonal distance: projective, laboratory, and observation. The projective method involves requiring participants to imagine a situation and describe how they would respond spatially in this situation. This method brings a high cognitive load due to the inclusion of complex cognitive skills like “reconstruction, imagination, empathy, memory demands” (Uzzell and Horne, 2011). The most common laboratory method is the “stop-distance” method. Participants are required by the experimenters to keep approaching another person until they feel uncomfortable. By contrast, participants interact with others freely in the observation method. The experimenter records the distance without interrupting participants. The laboratory method is preferred for its accuracy of measurement but criticized for its ecological validity. The observation method has the highest ecological validity but the result would be affected by some uncontrolled factors in the natural environment (Uzzell and Horne, 2011). The trade-off of ecological validity and accuracy of measurement can be resolved by virtual environments (VE) where participants can have a realistic and standard experience.
At the beginning of the introduction of virtual reality into interpersonal distance research, researchers employed the traditional stop-distance method. A virtual character approaches the participant in a virtual environment until he reports discomfort (Maeda et al., 2016). This method still shows flaws in ecological validity. Later, Bailenson et al. (2003) pioneered a new paradigm. The participants are told to memorize the information in the virtual environment. To memorize, the participant needs to come close to the virtual characters and observe their shirts, clothing, hair color, pupil color, etc. In fact, the researchers are interested in the distances they keep from the virtual characters. This method was able to replicate many of the findings from previous experiments, such as the interpersonal distance is usually kept at 0.5m, and women are more sensitive to changes in the characteristics (Hall, 1990). Meanwhile, the paradigm is simple to operate and has high ecological validity because participants can explore the virtual environment freely and are not aware of the real objective.
However, this paradigm has also been questioned recently. It is found that participants keep a similar distance to the important virtual characters (participants need to memorize the information about these characters) while they keep different distances to the unimportant characters of the virtual characters (Geraets et al., 2017). It can be seen that the presence of the memory task may result in a higher cognitive load and cause participants to ignore the individual differences in the characters they face, and thus maintain a similar distance to all characters.
To address the deficiencies of the above research paradigms, we propose a new paradigm where participants are asked for directions in the virtual environment. Participants actively approach virtual characters to answer their questions. Giving directions is more natural compared to the memory task, and the interpersonal distance is less susceptible to the task as the information on the virtual characters’ bodies is not important.
Based on this design, we present two hypotheses:
Hypothesis 1: Compared to AFAT and IAT, the new paradigm has higher reliability and is not affected by ceiling and floor effect.
Hypothesis 2: Using AFAT assessment as ground truth, the correlation between the new paradigm and participants’ AFAT scores will be stronger than the correlation between their IAT and AFAT scores.
Also, considering the gender differences in weight stigma found in previous studies (Puhl et al., 2008), we would try to explore the gender difference in our paradigm. Furthermore, in all previous studies, it was difficult to differentiate between obese (BMI
2 Materials and methods
2.1 Apparatus
The apparatus used in the experiments is Oculus Rift (immersive VR headset with controllers for user interaction, FOV: 110° horizontal and vertical, resolution: 2,160 × 1,200 per eye, refresh rate: 90 Hz). Our experiment system runs on the Win10 operating system.
The experimental material included three parts. The interpersonal-distance-paradigm scenario used to measure interpersonal distance was developed on Unity (2018.2.16). The implicit association test program was developed with Python (3.6) PsychoPy module (v3.1) (Peirce et al., 2019). The Antifat Attitude Test was translated into participants’ mother language from the original version (Lewis et al., 1997).
2.2 Design
In the experiment, participants would complete three sequential sessions, i.e., giving directions in the virtual reality, taking the implicit association test, and filling out the AFAT. The order of the three sessions was strictly controlled to prevent participants from discovering the true objective of the experiment. Before the experiment, participants were informed that the experiment focuses on communication skills in virtual reality. After the experiment, the experimenter would explain the actual objective to the participants. More details of the interpersonal-distance-paradigm scenario and the implicit association test were presented in the following two subsections.
For the collected data, repeated measures ANOVAs will be employed to analyze the gender effects, and correlation analysis will be conducted to compare across AFAT, IAT, and our paradigm.
2.3 Participants
A total of 56 participants, 25 males and 31 females, were recruited for our experiment, with an age range of 18–30 years (M = 22.05, SD = 2.73). All participants are undergraduate/graduate students from Peking University. Because the gender differences in interpersonal distances can be explained somewhat by evolutionary factors (Chen and Brown, 2012), we only recruited heterosexual participants. All participants were blind to the purpose of the experiment, and they were each paid with 60 Chinese Yuan. Our experiment design and procedure conformed to the policy of the ethics committee of Peking University. After excluding those participants who were unable to successfully complete our task due to nervousness or inability to operate the controller smoothly, we analyzed the valid data collected from 47 participants, reaching a post hoc power of 56.0% (for male avatars) and 54.8% (for female avatars) in ANOVAs.
2.4 Interpersonal distance measure
The virtual scene in the experiment was shown in Figure 1. A total of six Caucasian avatars were placed on the road in front of the school campus, namely, a male person with normal weight, a male person with excess weight (overweight), a male person with obesity, a female person with normal weight, a female person with excess weight (overweight), a female person with obesity. The six avatars were in a circle with the subject as the center and a radius of 5m, standing evenly apart, and the participant could determine the order of help. From the participant’s viewpoint, there was one virtual character every 30°, as shown in Figure 2. In the design of the avatars, considering that there was not an exact conversion between BMI and body size, we only managed to display distinguishable different levels of obesity. The avatars were shown in Figure 3.
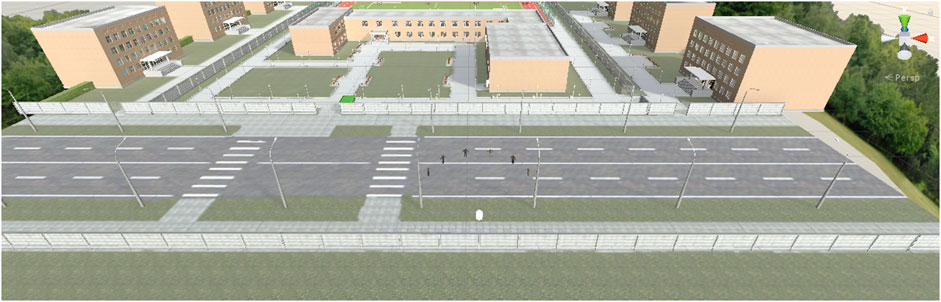
FIGURE 1. Overview of the interpersonal-distance-paradigm scenario.

FIGURE 2. Location of the virtual characters from participants’ viewpoint.
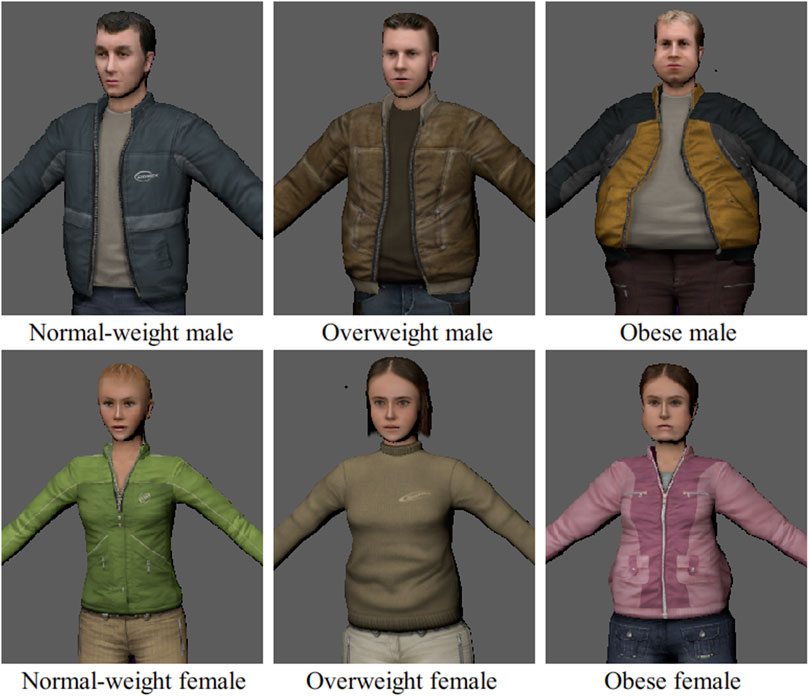
FIGURE 3. Six avatars in the virtual environment.
After the experimenter instructed the participant about how to move and interact in the VE, he kept quiet and the participant acts according to the pre-recorded voice played in the VE.
The task for the participant was to give directions to all virtual characters. A map, as shown in Figure 4C, would appear in the participant’s view. The map was fixed at 1.5 m in front of the participant and moved together with the participant. The participant could make the map appear or disappear any time they want by pressing the button “X” on the left controller.
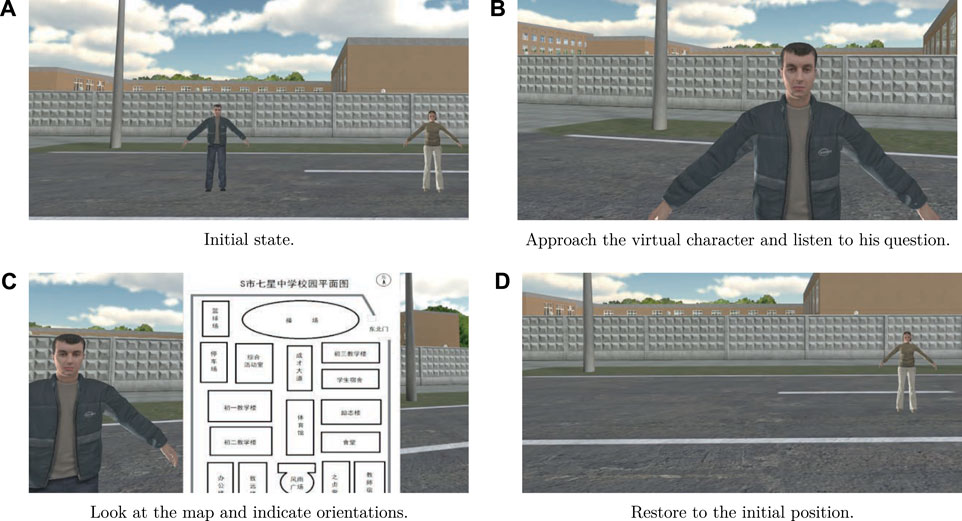
FIGURE 4. The experiment procedures (A-D) of the interpersonal-distance-paradigm scenario.
After the participant reported that he is clear about the task and the map, he would see the six virtual characters. The participant could “walk” towards the character using the thumbsticks on both controllers and “talk” to them by pressing button “B” on the right controller. A recording of “Hello, I want to go from A to B, how do I get there?” was played from the avatar and the participant was required to explain the route verbally. The audio volume depended on the distance of the participant to the avatar and it is generally sufficiently loud. After the participant correctly explained the route, the experimenter made the corresponding avatar express thanks and then disappear by pressing the corresponding number button on the keyboard. Meanwhile, the participant’s avatar was teleported back to the initial position.
Starting from the participant’s conversation with the helped character, the program recorded the real-time position of the participant’s avatar at 20 Hz and calculated the corresponding interpersonal distance. Specifically, interpersonal distance was defined as the horizontal distance from the participant’s head to the central point of the corresponding character’s body. At the end of the thank-you voice, the recording of interpersonal distance ended, and the average value of all sampled data during the process was calculated as the interpersonal distance. This session ended when the participant successfully oriented all six characters. The procedures are shown in Figure 4.
2.5 Implicit association test
The implicit association test was adapted from the “Weight IAT” in “Project Implicit” (The Project Implicit Team, 2011). The design of sessions referred to the literature (Nosek et al., 2013) and the blocks in IAT were shown in Table 1.
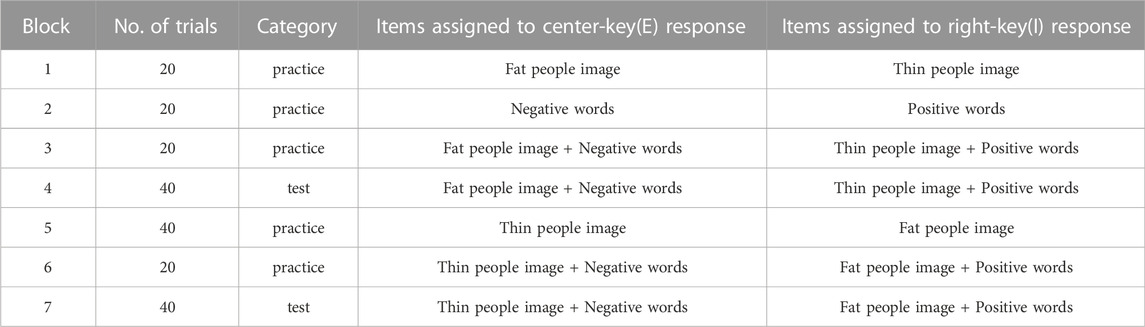
TABLE 1. Sequence of blocks in the implicit association test (IAT).
3 Results
We present our results and evaluate them on the following three components below. First, we will show the descriptive statistics results. Second, we explore the effects of obesity levels on interpersonal distances. Finally, we explore the superiority of the new paradigm from the perspective of reliability and accuracy.
3.1 Descriptive statistics
For the interpersonal distance, we calculate the average distance as illustrated in Subsection 2.4. For IAT, we calculate D score for each participant as in the study by Nosek et al. (2013). For AFAT, as in the original study (Lewis et al., 1997), we calculate the average score in each dimension, and the average score of the whole questionnaire as the composite score. The remaining 47 participants (23 males and 24 females) have an age range of 18–30 years (M = 21.96, SD = 2.874).
Regarding the AFAT, the descriptive statistics of this study and the original study (Lewis et al., 1997) are shown in Table 2. By two-sample unpaired t−test comparison on “the whole questionnaire” score, man participants in our study obtained significantly lower score than the man participants in the original study (Lewis et al., 1997) (t (79.46) = 2.48, p = 0.026) and women participants did not show significant difference (t (124.90) = 1.38, p = 0.332). Descriptive statistics for the IAT and the interpersonal distance are shown in Tables 3, 4.
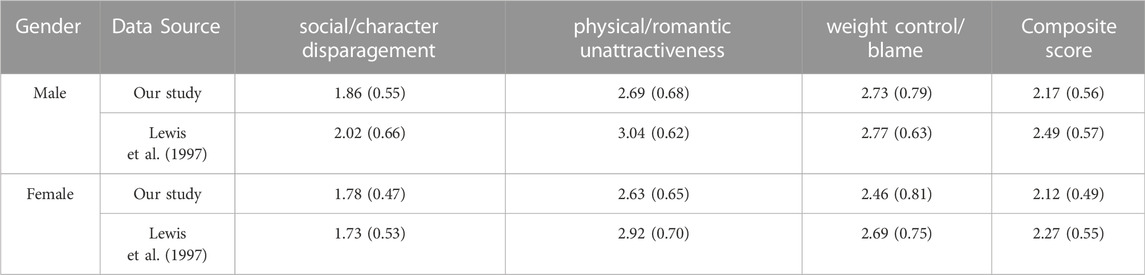
TABLE 2. Descriptive Statistics for the Antifat Attitude Test, presenting mean value (M) and standard deviation (SD) in “M(SD)” way.
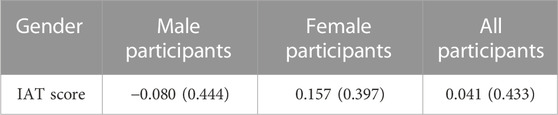
TABLE 3. Descriptive Statistics for the Implicit Association Test (D score), presenting mean value (M) and standard deviation (SD) in “M(SD)” way.
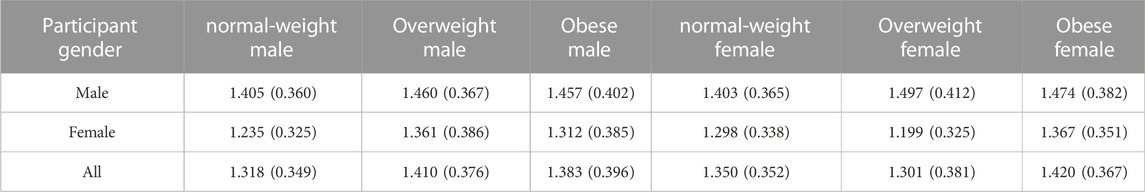
TABLE 4. Descriptive Statistics for the Interpersonal Distance (meter), presenting mean value (M) and standard deviation (SD) in “M(SD)” way.
3.2 Effect of gender on interpersonal distance
A repeated measures ANOVA is employed to analyze the gender effect, with the between-group independent variable gender (male vs female) and the within-group independent variable obesity level (normal-weight vs excess-weight vs obese).
For male characters, the main effect of obesity level on participants’ interpersonal distance is significant (F (2, 90) = 3.692, p = 0.029,
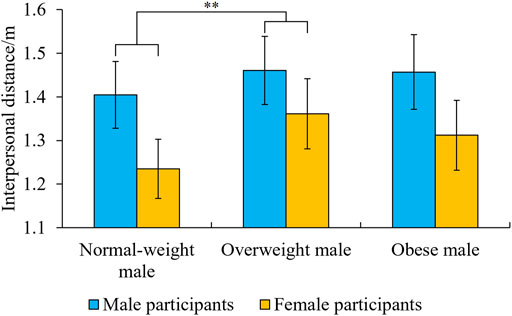
FIGURE 5. Interpersonal distance maintained by male and female participants for male characters with different levels of obesity.
For female characters, the main effect of obesity level on participants’ interpersonal distance is significant (F (2, 90) = 4.114, p = 0.020,
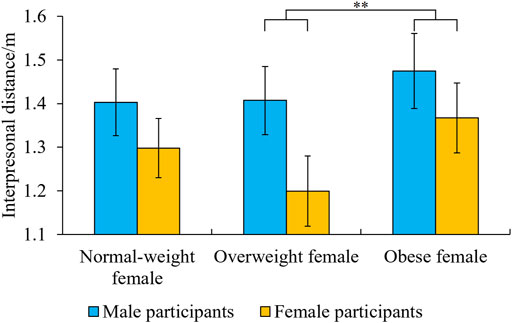
FIGURE 6. Interpersonal distance maintained by male and female participants for female characters with different levels of obesity.
3.3 Weight stigma calculation in the interpersonal distance paradigm
Similar to the IAT, we propose two methods to characterize weight stigma from the original interpersonal distance value. The first one sets the mean value of interpersonal distances that all participants of the same gender keep to the normal-weight characters as the baseline, and the difference between the distance each participant maintains to the characters with excess weight/obesity and the baseline is characterized as the degree of stigmatization on the individual with excess weight/obesity. For example, all male participants keep 1.405 m away from the normal-weight male characters on average. For the participant who kept 1.473 m away from the male character with excess weight, we characterize 0.068 (1.473–1.405) as his weight stigma to the male character with excess weight. The second one is similar to the D score (Nosek et al., 2013) in the IAT, where the difference in the former method is divided by the standard deviation of the six interpersonal distances of the specific participant.
First, we calculate Cronbach′s alpha for the AFAT (using 47 items) and the two calculation methods (using weight stigma towards four different characters, i.e., male with excess weight, male with obesity, female with excess weight, female with obesity) to test their internal consistency. Cronbach′s alpha cannot be calculated for IAT because each participant has only one IAT score. Cronbach′s alpha is 0.941, 0.928, 0.958 for the AFAT, first calculation method, and the second calculation method, respectively, which indicates all three methods have sufficiently high internal consistency, i.e., high across-item reliability.
Second, we test the ceiling and floor effect (CFE). Three metrics are used, namely skewness, kurtosis, and the percentage of low extreme values (LEV) and high extreme values (HEV) achieved by participants. For AFAT, we define the lowest (“1”) and highest (“5”) possible scores as extreme values for each item. For IAT and two calculation methods for interpersonal distances, we define the lowest 20% and highest 20% in the participants’ response range as extreme values. The results are shown in Table 5, 6. For the 47 items of AFAT, there are 43 items that over 15% of the participants answered “1” to it. Among these 43 items, there are 24 items that over 40% of the participants answered “1” to it. This indicates a severe CFE in the AFAT.

TABLE 5. Ceiling and floor effect analysis for the AFAT and IAT.
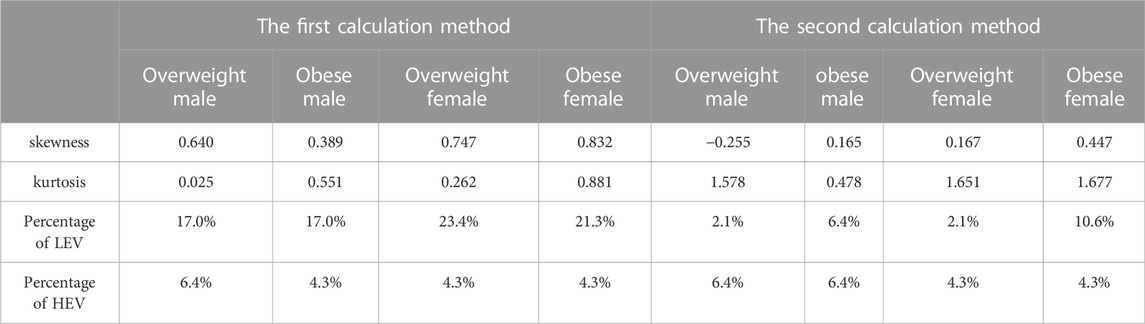
TABLE 6. Ceiling and floor effect analysis for interpersonal distance.
As shown in Tables 5, 6, the skewness and kurtosis of all methods are in an acceptive range. However, regarding the CFE, the AFAT and the first calculation method showed significant floor effect as a high percentage
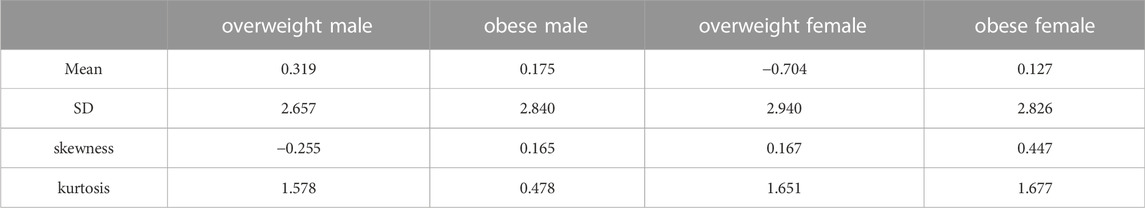
TABLE 7. Descriptive statistics of the calculated weight stigma.
The following are the results of the correlation analysis between the D-distance and the two traditional approaches. Also, we explored the correlation between the two classical paradigms, as shown in Table 8.
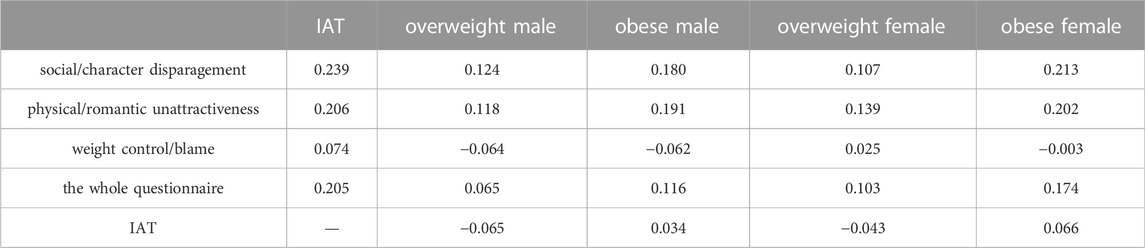
TABLE 8. Correlation matrix for the AFAT, IAT, and D-distance. The “IAT” column presents the correlation between the IAT score and the AFAT.
Considering that the correlation results are all insignificant, it is hard to tell what the true level of stigmatization of each participant exactly is, and thus a credible baseline level could not be established. In the absence of a true value with consensus, we cannot compare the accuracy of different methods.
4 Discussion
4.1 Disadvantages of the AFAT and IAT
For the AFAT, the average score of each item is close to 2, i.e., the majority of the participants’ attitudes are “relatively disagree” with the stigmatization items. Also, the high percentage of low extreme values indicates a significant floor effect. Male participants’ scores are significantly lower in our study than in the original study, and a similar tendency can be found among female participants, as shown in Table 2. The cultural differences and the progress in social inclusion can somewhat explain this change.
The Implicit Association Test also has some bias. According to Lewis et al. (1997), the IAT measures the strength of the implicit association between two concepts. Although a large number of studies have directly linked it to concepts such as stigmatization and discrimination, Karpinski and Hilton (2001) found that the IAT result cannot predict participants’ discrimination behavior. In addition, the IAT effect changed when participants get familiarized with the pairwise combinations (e.g., repeating the “fat-elegant” combination), which supports the environmental association interpretation. That is, the IAT scores reflect “the associations a person has been exposed to in his or her environment” rather than the extent to which the person agrees with the evaluative associations (Karpinski and Hilton, 2001). In this study, IAT showed neither ceiling nor floor effect, but had a weak and insignificant correlation with the AFAT, which indicates that we cannot determine whether the IAT result could be interpreted as weight stigma. In practice, implicit and explicit attitudes are different constructs, and thus the correlation between implicit and explicit measures tends to be relatively low Hofmann et al. (2005), which can partly explain the low correlation in our study. Other reliable implicit methods (e.g., Oliver et al. (2017)) could be used to analyze the correlation in future works.
4.2 Advantages of the interpersonal distance paradigm
In our interpersonal-distance-paradigm scenario, participants kept different distances to different characters, as illustrated in Subsection 3.2. Thus, our task brought less cognitive load and performs better than the memory task (Geraets et al., 2017), where participants keeps a similar distance to the important virtual characters. We can safely conclude that our paradigm is effective in measuring the interpersonal distance in the virtual environment.
We proposed two calculation methods to characterize weight stigma using the raw distance value and the second method, D-distance is chosen for its immunity to ceiling and floor effects. However, using the same criterion as for IAT, our measure cannot determine whether it can represent participants’ stigma towards individuals with obesity accurately. This is because no significant correlations can be found between different paradigms and the true stigma level cannot be established.
4.3 Limitations and future works
Some participants were unfamiliar with virtual reality technology and were too nervous to adjust their position freely to make themselves comfortable during the giving-direction process. Moreover, these participants tended to keep the initial orientation, so they showed a sideways facing state when facing the characters, as shown in Figure 7. These behaviors are inconsistent with real-life giving-direction contexts. In future work, we would use real-walking locomotion, or we would provide more practice trials to help participants be familiar with the operation. In addition, we should improve the rendering quality of the scene and provide more natural appearance and animation of the virtual character, therefore, making the users more immersive with a higher presence.
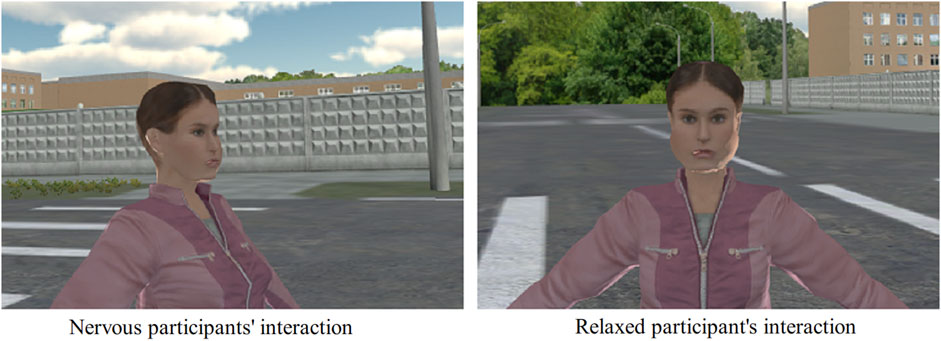
FIGURE 7. sample interaction performance of subjects with different proficiency levels.
The ethnicity of the virtual characters may also introduce some bias. As shown in Figure 3, all avatars are of Caucasian appearance, different from the participants’ race. Different cultures view people with obesity differently. In North America or Europe, the poor are more prone to obesity while this is not the case in China. In many rural areas of China, people with higher levels of education are more likely to be overweight and being overweight can be seen as a sign of wealth. In this regard, we cannot measure the participants’ weight stigma accurately if they see being overweight as a positive phenomenon. In future works, we will focus on cultural differences and conduct experiments on a wider range of races.
In our study, only one character is provided for each type of body, and there exist major size differences in the depiction of obesity between the man and woman avatars. Like the memory task, we would introduce more characters/roles to make the measurement more precise. We can consider different role playing even with role exchange Gu et al. (2022). The weight stigma assessment in our study depends on the given samples of participant. However, with more avatars and more participants, norm values can be established for specific social groups, such as different races, different genders and people with different nationalities. Then, the extent of weight stigma for individuals can be calculated using norm values rather than group means. Also, we would extend the interpersonal-distance-paradigm scenario to other stigma measurements, and compare its measurement with other traditional methods. Furthermore, the interpersonal distance paradigm can help quantify the effects of the specific programs aiming at reducing weight stigma. The paradigm itself may have the potential to be extended to help reduce weight stigma by facilitating contact and communication between participants and the virtual characters with obesity.
Data availability statement
The raw data supporting the conclusions of this article will be made available by the authors, without undue reservation.
Ethics statement
The studies involving human participants were reviewed and approved by Ethics committee of Peking University. The patients/participants provided their written informed consent to participate in this study.
Author contributions
XG (author #1): Conceptualization, Methodology, Software, Data Curation, Investigation, Formal Analysis, Writing—Original Draft. LC (author #2): Conceptualization, Experiment Design, Investigation GW (author #3): Conceptualization, Project Administration, Supervision, Resources SL (author #4): Conceptualization, Methodology, Project Administration, Supervision, Resources, Funding Acquisition, Writing - Review and Editing.
Conflict of interest
The authors declare that the research was conducted in the absence of any commercial or financial relationships that could be construed as a potential conflict of interest.
The handling editor is currently co-organizing a Research Topic with one of the authors SL, and confirms the absence of any other collaboration.
Publisher’s note
All claims expressed in this article are solely those of the authors and do not necessarily represent those of their affiliated organizations, or those of the publisher, the editors and the reviewers. Any product that may be evaluated in this article, or claim that may be made by its manufacturer, is not guaranteed or endorsed by the publisher.
References
Allison, D. B., Basile, V. C., and Yuker, H. E. (1991). The measurement of attitudes toward and beliefs about obese persons. Int. J. Eat. Disord. 10, 599–607. doi:10.1002/1098-108x(199109)10:5<599::aid-eat2260100512>3.0.co;2-#
Bailenson, J. N., Blascovich, J., Beall, A. C., and Loomis, J. M. (2003). Interpersonal distance in immersive virtual environments. Pers. Soc. Psychol. Bull. 29, 819–833. doi:10.1177/0146167203029007002
Bessenoff, G. R., and Sherman, J. W. (2000). Automatic and controlled components of prejudice toward fat people: Evaluation versus stereotype activation. Soc. Cogn. 18, 329–353. doi:10.1521/soco.2000.18.4.329
Brownstein, M., Madva, A., and Gawronski, B. (2019). What do implicit measures measure? Wiley Interdiscip. Rev. Cogn. Sci. 10, e1501. doi:10.1002/wcs.1501
Chen, E. Y., and Brown, M. (2012). Obesity stigma in sexual relationships. Obes. Res. 13, 1393–1397. doi:10.1038/oby.2005.168
Crandall, C. S. (1994). Prejudice against fat people: Ideology and self-interest. J. personality Soc. Psychol. 66, 882–894. doi:10.1037/0022-3514.66.5.882
Degner, J., and Wentura, D. (2011). Types of automatically activated prejudice: Assessing possessor- versus other-relevant valence in the evaluative priming task. Soc. Cogn. 29, 182–209. doi:10.1521/soco.2011.29.2.182
Geraets, C. N. W., Beilen, M. V., Pot-Kolder, R., Counotte, J., Gaag, M. V. D., and Veling, W. (2017). Social environments and interpersonal distance regulation in psychosis: A virtual reality study. Schizophrenia Res. 192, 96–101. doi:10.1016/j.schres.2017.04.034
Greenwald, A. G., McGhee, D. E., and Schwartz, J. L. (1998). Measuring individual differences in implicit cognition: The implicit association test. J. personality Soc. Psychol. 74, 1464–1480. doi:10.1037/0022-3514.74.6.1464
Greenwald, A. G., Nosek, B. A., and Banaji, M. R. (2003). Understanding and using the implicit association test: I. An improved scoring algorithm. J. personality Soc. Psychol. 85, 197–216. doi:10.1037/0022-3514.85.2.197
Gu, X., Li, S., Yi, K., Yang, X., Liu, H., and Wang, G. (2022). Role-exchange playing: An exploration of role-playing effects for anti-bullying in immersive virtual environments. IEEE Trans. Vis. Comput. Graph. 1, 1–15. doi:10.1109/TVCG.2022.3184986
Gulledge, C. M., Smith, D. G., Ziedas, A., Muh, S. J., Moutzouros, V., and Makhni, E. C. (2019). Floor and ceiling effects, time to completion, and question burden of promis cat domains among shoulder and knee patients undergoing nonoperative and operative treatment. JBJS Open Access 4, e0015. doi:10.2106/jbjs.oa.19.00015
Hall, J. A. (1990). Nonverbal sex differences: Accuracy of communication and expressive style. Charles Village, Baltimore: Johns Hopkins University Press.
Hofmann, W., Gawronski, B., Gschwendner, T., Le, H., and Schmitt, M. (2005). A meta-analysis on the correlation between the implicit association test and explicit self-report measures. Pers. Soc. Psychol. Bull. 31, 1369–1385. doi:10.1177/0146167205275613
Karpinski, A., and Hilton, J. L. (2001). Attitudes and the implicit association test. J. personality Soc. Psychol. 81, 774–788. doi:10.1037/0022-3514.81.5.774
Krumpal, I. (2013). Determinants of social desirability bias in sensitive surveys: A literature review. Qual. Quant. 47, 2025–2047. doi:10.1007/s11135-011-9640-9
Lewis, R. J., Cash, T. F., Jacobi, L., and Bubb-Lewis, C. (1997). Prejudice toward fat people: The development and validation of the antifat attitudes test. Obes. Res. 5, 297–307. doi:10.1002/j.1550-8528.1997.tb00555.x
Li, S., Gu, X., Yi, K., Yang, Y., Wang, G., and Manocha, D. (2022). Self-illusion: A study on cognition of role-playing in immersive virtual environments. IEEE Trans. Vis. Comput. Graph. 28, 3035–3049. doi:10.1109/TVCG.2020.3044563
Maeda, M., Tominaga, T., Hijikata, Y., and Sakata, N. (2016). “Controlling virtual body size to reduce discomfort caused by inappropriate interpersonal distance,” in Proceedings of the 2016 ACM international symposium on wearable computers (ACM) (New York, NY: Association for Computing Machinery).
Morrison, T. G., and O’connor, W. E. (1999). Psychometric properties of a scale measuring negative attitudes toward overweight individuals. J. Soc. Psychol. 139, 436–445. doi:10.1080/00224549909598403
Nosek, B. A., Greenwald, A. G., and Banaji, M. R. (2013). “The implicit association test at age 7: A methodological and conceptual review,” in Automatic processes in social thinking and behavior (London, England: Psychology Press).
Oliver, M. D., Datta, S., and Baldwin, D. R. (2017). A sympathetic nervous system evaluation of obesity stigma. PloS one 12, e0185703. doi:10.1371/journal.pone.0185703
Peirce, J., Gray, J. R., Simpson, S., MacAskill, M., Höchenberger, R., Sogo, H., et al. (2019). Psychopy2: Experiments in behavior made easy. Behav. Res. Methods 51, 195–203. doi:10.3758/s13428-018-01193-y
Puhl, R. M., Andreyeva, T., and Brownell, K. D. (2008). Perceptions of weight discrimination: Prevalence and comparison to race and gender discrimination in America. Int. J. Obes. (Lond). 32, 992–1000. doi:10.1038/ijo.2008.22
The Project Implicit Team (2011). Project implicit. AvaliableAt: https://www.projectimplicit.net/ (Accessed March 30, 2022).
Uzzell, D., and Horne, N. (2011). The influence of biological sex, sexuality and gender role on interpersonal distance. Br. J. Soc. Psychol. 45, 579–597. doi:10.1348/014466605x58384
Welsch, R., von Castell, C., Rettenberger, M., Turner, D., Hecht, H., and Fromberger, P. (2020). Sexual attraction modulates interpersonal distance and approach-avoidance movements towards virtual agents in males. PloS one 15, e0231539. doi:10.1371/journal.pone.0231539
World Obesity Federation (2018). Weight stigma. AvaliableAt: https://www.worldobesity.org/what-we-do/our-policy-priorities/weight-stigma.
Ya, M. G., Saveleva, O. A., and Zinchenko, Y. P. (2018). The study of ethnic attitudes during interactions with avatars in virtual environments. Psychol. Russ. State art 11, 18–29. doi:10.11621/PIR.2018.0102
Keywords: implicit association test, interpersonal distance, weight stigma, implicit measures, explicit measures, ceiling and floor effect
Citation: Gu X, Chen L, Wang G and Li S (2022) An alternative paradigm for assessing attitudes in virtual reality — Interpersonal distance paradigm: Taking weight stigma as an example. Front. Virtual Real. 3:1015791. doi: 10.3389/frvir.2022.1015791
Received: 10 August 2022; Accepted: 02 December 2022;
Published: 21 December 2022.
Edited by:
Susan Persky, National Human Genome Research Institute (NIH), United StatesReviewed by:
Hiroshi Ashida, Kyoto University, JapanPierre Lebreton, Nippon Telegraph and Telephone, Japan
Copyright © 2022 Gu, Chen, Wang and Li . This is an open-access article distributed under the terms of the Creative Commons Attribution License (CC BY). The use, distribution or reproduction in other forums is permitted, provided the original author(s) and the copyright owner(s) are credited and that the original publication in this journal is cited, in accordance with accepted academic practice. No use, distribution or reproduction is permitted which does not comply with these terms.
*Correspondence: Sheng Li , bGlzaGVuZ0Bwa3UuZWR1LmNu