 Pooya Rahimian
 Jodie M. Plumert
 Joseph K. Kearney
- 1Department of Computer Science, University of Iowa, Iowa, IA, United States
- 2Department of Psychological and Brain Sciences, University of Iowa, Iowa, IA, United States
Visual feedback latency in virtual reality systems is inherent due to the computing time it takes to simulate the effects of user actions. Depending upon the nature of interaction and amount of latency, the impact of this latency could range from a minor degradation to a major disruption of performance. The goal of this study was to examine how visuomotor latency impacts users’ performance in a continuous steering task and how users adapt to this latency with experience. The task involved steering a bike along an illuminated path in a dark environment viewed in an HTC Vive head-mounted virtual reality display. We examined how users adapt to visuomotor latency in two different conditions: 1) when the user controlled the steering while the bike moved forward at a constant speed, and 2) when the user controlled the steering and the speed of the bike through pedaling and braking. We found that users in both conditions started with a large steering error at the beginning of exposure to visuomotor latency but then quickly adapted to the delay. We also found that when users could control their speed, they adjusted their speed based on the complexity of the path (i.e., proximity to turns) and they gradually increased their speed as they adapted to latency and gained better control over their movement. The current work supports the idea that users can adapt to visual feedback delay in virtual reality regardless of whether they control the pace of movement. The results inform the design of virtual reality simulators and teleoperation systems and give insight into perceptual-motor adaptation in the presence of latency.
Introduction
A fundamental difference between real and virtual worlds is that natural interactions in the real environment are temporally synchronous, whereas interactions in a virtual environment always involve latency due to the time it takes to simulate cause and effect reactions. This inevitable delay in VR systems may impair user performance by creating a discrepancy between sensory and motor control systems. Unlike virtual environments, we perceive our interactions with the real world as seamless, coherent, and integrated despite the fact that there is more than a hundred-millisecond delay between our visual sensory system and the motor command system (Sarpeshkar and Mann, 2011). Our brains compensate for different internal latencies of sensory systems (e.g., visual) to provide coherent multi-sensory experiences. This raises questions about how we perform in presence of visuomotor latency in a virtual environment and whether we can adapt to visuomotor latency.
The question of whether we can adapt to visuomotor delay is a controversial topic. Some preliminary studies suggested that users cannot adapt to visuomotor delay in teleoperation tasks (Smith et al., 1960; Sheridan and Ferrell 1963; Smith et al., 1963; Held et al., 1966). They showed that users relied on an act-and-wait strategy to mitigate the effect of latency and consequently, they did not adapt to the visuomotor latency. In contrast, more recent studies have shown that users are very capable of adapting to visuomotor latency (Cunningham D. W. et al., 2001; Cunningham DW. et al., 2001; Miall and Jackson, 2006; Kennedy et al., 2009; Davis et al., 2010; Rohde et al., 2014). However, while there are many studies that have focused on adaptation to visuomotor delay in ballistic movements (e.g., pushing a button or reaching to a stationary object), only a few studies have explored adaptation to visuomotor delay in continuous control tasks (e.g., steering a vehicle). These studies suggest that users adapt to the visuomotor latency in continuous control tasks when a constant pace of interaction is imposed (i.e., users travel at a constant speed; Cunningham D. W. et al., 2001; Cunningham DW. et al., 2001; Rohde et al., 2014; Miall and Jackson, 2006; Kennedy et al., 2009).
We examined the effect of visuomotor latency on user steering performance in a continuous control task that involved riding a bike in a virtual environment that was viewed through a head-mounted virtual reality system. Participants attempted to follow a path with 90° turns illuminated by yellow disks in a dark environment. We examined how users adapted to visuomotor latency in two different conditions: 1) when the bike traveled with a constant speed and 2) when the user had control over the speed of the bike through pedaling and braking. As measured by steering error, we found that users adapted to the imposed visuomotor latency rapidly and then re-adapted when the latency was removed. In addition, we showed that users followed the path more accurately with latency when they had control over the speed of bike, though the pattern of adaptation and re-adaptation was the same as when users did not control the speed of the bike. Users adjusted the speed of bike based on the complexity of the path (i.e., proximity to turns), slowing down as they approached turning points and speeding up once they passed the turning point. Finally, we found that users gradually increased their speed as they adapted to the level of latency and gained better control. These findings support the idea that users can adapt to the visuomotor latency during a steering task in a virtual environment. In addition, our study suggests that visuomotor latency adaptation occurs regardless of whether users control the speed of self-movement.
Related Work
A precise action demands tight spatial and temporal coordination between the visual sensory and motor command systems. A perturbation in space or time typically leads to user performance degradation. Well before the emergence of virtual reality, von Helmholtz (1896) examined how humans adapt to a spatial misalignment using an A-B-A design (i.e., pre-exposure—exposure—post-exposure). During the pre-exposure phase, participants were asked to point to a visual target in front of them as quickly and accurately as possible. Participants received visual feedback while they were pointing to the target. During the exposure session, participants wore prism goggles that laterally shifted their field of view to the right. When wearing the prism goggles, participants initially pointed to the visual location of the target rather than the physical location of the target. In addition to misaligned pointing, the speed of pointing was drastically impeded. Participants gradually compensated for this misalignment after a few minutes of practice with feedback and they eventually gained the same speed and accuracy they had prior to wearing the goggles. Finally, during the post-exposure phase, participants removed the goggles and performed the same pointing task. von Helmholtz observed that participants could not point to the correct physical location of the target despite the fact that they were no longer wearing the prism goggles. This spatial misalignment is known as negative aftereffect. Others have explored similar phenomena by rotating and reversing the field of view (Harris, 1963; Welch, 1978; Bedford, 1993).
Redding et al. (2005) proposed a theoretical framework to explain adaptation and negative aftereffect phenomena in prism experiments. They suggested that two parallel mechanisms are involved in the prismatic shift: 1) A swift error reduction at the beginning of prism exposure, which is the result of a conscious cognitive strategy to minimize the error in motor control, and 2) a slow decrement in error with practice, which is the result of an automatic realignment of the visual and motor system reference frames with experience. Petitet et al. (2018) noted an analogy between a prismatic shift and a misaligned rifle scope. A marksman aims a rifle right at the center of a target, but the bullets systematically hit 10° to the right. Based on their experience with missing the target (i.e., visual feedback), marksmen may use the strategy of deliberately aiming 10° to the left to compensate for the systematic misalignment in the scope. In contrast, the marksman can mechanically re-align the barrel based on the missing target angle so that he does not need to aim 10° to the left anymore. Barrel adjustment is analogous to realigning the visuomotor mapping. In the prism experiment, both processes happen concurrently and independently, but the strategic cognitive correction is dominant at the beginning and disappears after few trials, whereas the perceptual-motor adaptation process continues across the entire set of trials. Moreover, users usually make cognitive adjustments through an open-loop phase while perceptual-motor adaptation occurs during closed-loop performance. This theoretical framework describes the negative aftereffect as the manifestation of a compensatory mechanism developed to cancel out the disturbance between the visual system information and the motor system output.
Similar to spatial misalignment (e.g., prismatic shift), a sufficiently large temporal misalignment (i.e., latency) can also lead to performance degradation. Much of what is known about the effect of latency on performance in motor tasks comes from studies of teleoperation (Cunningham, et al., 2001a, 2001b; Davis et al., 2010; Rohde et al., 2014; Miall and Jackson, 2006; Kennedy et al., 2009. The main source of delay in teleoperation is the time to transmit information between remote sites. While the source of the latency differs in teleoperation as compared to VR, latency is likely to influence motor performance in similar ways.
Early studies found no evidence of adaptation to visual latency in continuous tracing and steering tasks (Smith et al., 1960; Sheridan and Ferrell 1963; Smith and Smith, 1962; Smith et al., 1963; Held et al., 1966). Smith et al. (1960) conducted an experiment with delayed visual feedback to investigate how latency influenced nine different drawing and writing tasks. Users were asked to trace a shape or write letters with a 520 ms delayed visual feedback. Accuracy was severely degraded, and there was as much a ten-fold increase in the time to complete tasks. Smith et al. (1963) examined adaptation to latencies in a maze-tracing task. Participants practiced the task over a 3-day period with latencies of 1s, 15s, and a complete task delay in which participants only saw the result after completion of the task. They found no evidence of adaptation over for any of the latency conditions. Sheridan and Ferrell (1963) conducted a teleoperation task using an apparatus with two parts consisting of 1) a master part that the user controlled, and 2) a slave part that replicated the master part movements with or without additional latency to the baseline. The user was instructed to move two arms on the master part to control the slave part which grabbed a remote cube and moved it to the target position. They found that time to complete the task progressively increased with delays of 1.0 s, 2.1 s, and 3.2 s with no sign of adaptation.
Other more recent studies have found clear evidence of visuomotor adaptation in steering tasks. Cunningham D. W. et al. (2001) tested visuomotor adaptation by adding temporal delay on visual feedback. They designed an experiment where an animated airplane moved from the top to the bottom of the screen with a constant speed. Users were asked to control the airplane laterally using a keyboard to avoid colliding with obstacles. The measure was the percentage of trials completed successfully at the top speed. They used an A-B-A design in which they started with no latency with different constant speeds in a pre-exposure session. In the exposure session, they then added a significant delay (235 ms) on visual feedback and trained users with different constant speeds. In the post-exposure session, they repeated the same task with no latency (the same as pre-exposure) only on the fastest speed. They found that a large visual feedback latency impaired user controllability at the beginning of the task but that performance gradually improved after few trials. In the post-exposure session, users started with larger error than the pre-exposure session despite the fact that there was no visual feedback latency, but then quickly returned to baseline performance. The results of their experiment indicated that users adapted to visuomotor latency. In speculating on why Sheridan and Ferrell (1963) and others failed to find temporal adaptation in their steering tasks, they hypothesized that when users encounter latency, they naturally slow down to mitigate the effect of latency. Sheridan and Ferrell (1963) reported that participants strategically shifted to a form of open-loop control, making a move and then waiting to see the consequence before making the next move. Smith et al. (1963) observed a similar wait-and-see strategy. Cunningham D. W. et al. (2001) argue that this wait-and-see approach effectively prevents visuomotor adaptation because the participant is never exposed to the altered relationship between action and outcome. When users cannot control the pace of the interaction (i.e., adjust their speed), they are essentially forced to engage in a closed-loop perceptual-motor re-alignment process.
Cunningham DW. et al. (2001) tested this hypothesis by examining how drivers steered a vehicle travelling at a constant speed in a driving simulator. Participants attempted to drive a vehicle along a road that was bounded by an invisible tube. Participants were stopped when they contacted the boundary of the tube. The experiment was divided into three phases: pretest, training, and posttest. During the pretest phase, participants drove the track 20 times (five times at each of four different speeds). This was followed by the training phase in when participants drove with one of three latencies (130 ms, 230 ms, or 430 ms) until one of three termination criteria were met based on their success at completing the route. Lastly, in the posttest phase participants drove five trials with no latency. They found that lateral position error increased with all three levels of latency. For the 430 ms latency group, performance was so disrupted that only one participant made it past the first curve during the first few trials. All three groups improved their performance as they experienced latency during the training phase. Participants in the 130 and 230 ms groups showed an aftereffect once latency was removed, performing worse in the posttest phase than in the pretest phase (although the difference was only significant for the 230 ms group). This experiment convincingly showed that when users were forced to travel with a constant speed, they adapted to the visuomotor delay during the training phase and then re-adapted when the visuomotor delay was removed (at least at the 230 ms level). Although this experiment provides insight about temporal visuomotor adaptation in a fairly complex environment (i.e., driving in a virtual environment), there are several limitations of the experiment. First, because users were prevented from driving off the road, the degree of lateral displacement was underestimated. Second, the rate at which users adapted and re-adapted was not clear because lateral error and steering reversals are not reported on a trial-by-trial basis. And third, because all users drove at a constant speed, it is not clear whether users would also adapt if they controlled their own speed.
Subsequent work has confirmed that users can adapt to latencies in the range of 200–300 ms in manual and head tracking tasks when the target speed is held constant (Miall and Jackson, 2006; Kennedy et al., 2009; Rohde et al., 2014). The degree to which users adapt to latency when they control their own speed is less clear. Davis et al. (2010) examined how participants adapt to a fixed latency of 700 ms and a variable latency of 400 to 1,100 ms in a driving simulator where participants controlled both speed and steering. They found that average speed was highest and accuracy was best in the baseline (no latency condition) and that accuracy was worst in the variable latency condition. However, they do not report on whether or not participants adapted to latency either by improving performance with experience or by testing for an aftereffect.
The goal of the current investigation was to further examine adaptation to visuomotor delay in a continuous steering task performed in a head-mounted virtual reality system. The basic task involved steering a bicycle along an illuminated path with a series of 90° turns in a darkened virtual environment. We used an A-B-A design in which riders first rode without additional visuomotor latency (pre-latency phase), then rode with additional visuomotor latency (latency-training phase), and finally rode again without additional visuomotor latency (post-latency phase). In the first experiment, participants steered the bicycle while riding at a constant speed; in the second experiment, participants steered the bicycle while controlling their speed through pedaling and braking. The primary measure was the degree of steering error while riders navigated the turns in the path. We were especially interested in the extent to which riders adapted to the visuomotor delay in the latency-training phase and re-adapted to the lack of visuomotor delay in the post-latency phase, both when they did not control the bike speed (Experiment 1) and when they controlled the bike speed (Experiment 2).
Materials and Methods
Apparatus and Task
We instrumented a mid-size bike with a VIVE tracker attached to the handlebars to measure the angle of the front fork. The bike was mounted on a stationary frame and placed at the center of a tracking area covered by two VIVE lighthouses, one in front and one in the back. Users sat on the bike and viewed the virtual environment through an HTC VIVE head-mounted display (HMD) system. Their task was to steer the bike along an illuminated path in a dark virtual environment. The path was represented by a series of yellow half-spheres on a dark gray floor (Figure 1). The diameter of the markers was 0.2 m and the center-to-center distance between every two consecutive markers was 2 m. The users could only see the 30 markers ahead (i.e., 60 m). As the bike moved forward along the path, new markers appeared. This partial path appearance focused the rider’s attention on the path immediately in front of them. The path was composed of straight 40-m segments interspersed by 90° turn angles.
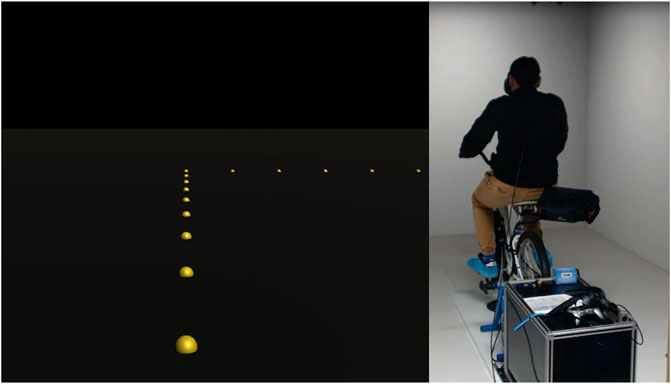
FIGURE 1. User perspective in the experiment. The path is shown with a sequence of yellow markers on the floor.
Users in the constant speed experiment (Experiment 1) rested their feet on the bike pedals but did not pedal because the bike moved forward at a constant speed (4.1 m/s). Users were instructed that as soon as the bike moved forward, they should attempt to follow the path as closely as possible. Users in the pedaling experiment (Experiment 2) were instructed to pedal the bike at a comfortable speed and follow the yellow markers as closely as possible. Users were instructed to use the right-hand brake if they needed to decelerate the bike. The study was approved by the Institutional Review Board at the University of Iowa and all participants provided informed consent prior to participation. All data was de-identified by assigning a number to each participant and using only these numbers for all data files.
Bike Kinematic Model
We simulated the bike kinematic model in the virtual environment (VE). The bike moved (virtually) forward and its trajectory at each frame was calculated based on two parameters—the current steering angle and the center-to-center distance between the front and back wheels (wheelbase). In our bike model, there was no lateral acceleration and consequently, it did not slip in turns. This assumption simplified the bike kinematic model to the Ackerman steering model (Tzafestas, 2013).
Baseline Latency of the System
In order to accurately measure the motion-to-photon latency in this system, we developed a novel measurement technique with ± 0.1 ms accuracy. We used two photo sensors to capture the rotation of the VIVE tracker and the corresponding image update in the HMD. We attached a light sensor to a platform and pointed a laser beam at the light sensor. A VIVE tracker was attached on top of a servo motor controlled by an Arduino UNO board. The servo motor rotated the VIVE tracker and a paper index with a constant rotational speed (see Figure 2). The paper index broke the laser ray and cast a shadow on the light sensor. Another light sensor was mounted inside of the headset to capture the display light. In the calibration phase, the tracker was rotated until the paper index blocked the laser ray. This orientation of the tracker was recorded as nominal zero. In the testing phase, a script turned the HMD displays from black to white whenever the angle of the tracker was greater than or equal to nominal zero. The light sensor inside of the headset captured the change in emitted light. The outputs of the two light sensors were recorded by a computer through a stereo audio input. The temporal difference between the signals gives the motion-to-photon latency of the system. Our measurements indicated that the baseline motion-to-photon latency was about 46 ms on average.
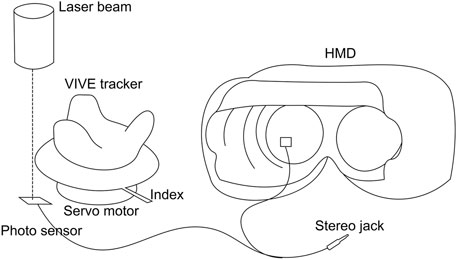
FIGURE 2. Diagram of the latency measurement apparatus.
To introduce additional latency to the base latency, we captured the orientation of the tracker and buffered it for a short duration. This duration was related to the system frame rate. The recorded timestamp of our system indicated that the frame rate was about 90fps (measured as 11 ms latency ±1 ms). We repeatedly measured the latency of buffered frames with the same apparatus. This meant that we could add latency in increments of ∼11 ms.
Determining the level of visual feedback delay that is sufficient to push users to ride the bike at the upper limit of their ability is challenging because it highly depends on the nature of the interaction. Cunningham DW. et al. (2001) reported that users could not steer a virtual vehicle with 430 ms visual feedback delay. In pilot work, we examined 330 ms, 385 ms, and 440 ms latencies using a bike steering task. We found that 330 ms was not challenging enough because our users immediately adapted to the latency. In contrast, 440 ms was too difficult to ride; users could not control the bike after turns. To study adaptation, it is important to find a level of delay that disrupts performance but not so much as to make the task impossible to do. Thus, 385 ms was selected as the visuomotor feedback latency in this investigation. We note that this level is roughly in the middle of latencies reported in research on latency in steering and tracking tasks since the year 2000 (200–700 ms; Cunningham D. W. et al., 2001, Cunningham et al., 2001 DW.; Davis et al., 2010; Rohde et al., 2014; Miall and Jackson, 2006; Kennedy et al., 2009).
Experimental Design
We used an A-B-A within-subjects design in which participants completed three consecutive rides. After the three practice trials at the beginning, users completed 48 trials (i.e., turns) in total consisting of 12 pre-latency trials, 24 latency-training trials, and 12 post-latency trials. As shown in Figure 3, users started with a pre-latency phase. At the beginning of the pre-latency phase, users completed three practice turns consisting of a 15°, 45°, and 75° turn to left, right, and left, respectively. After the practice trials, without any interruption or break, users continued riding the bike along twelve 90° turns randomly assigned to the left or right. Once users finished the entire path, the simulation terminated the application. During this break (30s to 1min), users saw only the blacked-out screen. Meanwhile, the experimenter set up the latency-training phase of the experiment. During the latency-training phase, users rode the bike in the presence of 385 ms additional latency on steering. This phase consisted of 24 consecutive turns of 90° randomly assigned to be to the left or right. Once users finished the entire path, the simulation again terminated the application. Users again observed a blacked-out screen while the experimenter prepared the system for the post-latency phase of the experiment. The post-latency phase was exactly the same as pre-latency phase without practice trials (12 turns of 90°).
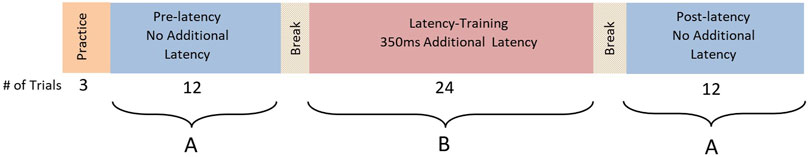
FIGURE 3. A-B-A design with 51 turns (including three practice trials at the beginning) divided into the pre-latency, latency-training, and post-latency rides.
Experiment 1: Constant Speed
In Experiment 1, users completed the three phases while steering and moving forward with a constant speed of 4.1 m/s. The constant speed of the bike was based on nine pilot sessions with a separate group of users whose pedaling speed on average was 4.1 m/s. Sixteen users participated in Experiment 1 (mean age = 18.71 years, eight males and eight females). They were recruited from an Elementary Psychology course and received course credit for participating. None of them had previously participated in a similar experiment.
Experiment 2: Pedaling
In Experiment 2, users completed the three phases while steering and pedaling the bike. They could accelerate the bike by pedaling faster or slow down by using the hand brake. Sixteen users participated in Experiment 2 (mean age = 18.46 years, seven males and nine females). They were recruited from an Elementary Psychology course and received course credit for participating. None of them had previously participated in a similar experiment.
Measures
While users were riding, the virtual positions and orientations of the bike were recorded at every time frame. This information was used to calculate lateral displacement from the path (Figure 4A). Lateral displacement was estimated by first calculating the distance between the virtual contact point of the front wheel and the closest point on the path at every time frame (Figure 4B) and then calculating the area under the bike trajectory curve and the path to determine the average lateral error (Figure 4C). We calculated the average lateral error from 20 m before to 20 m after a turn point on each trial. This measurement provides an overall picture of how a user performed in a 90° turn.
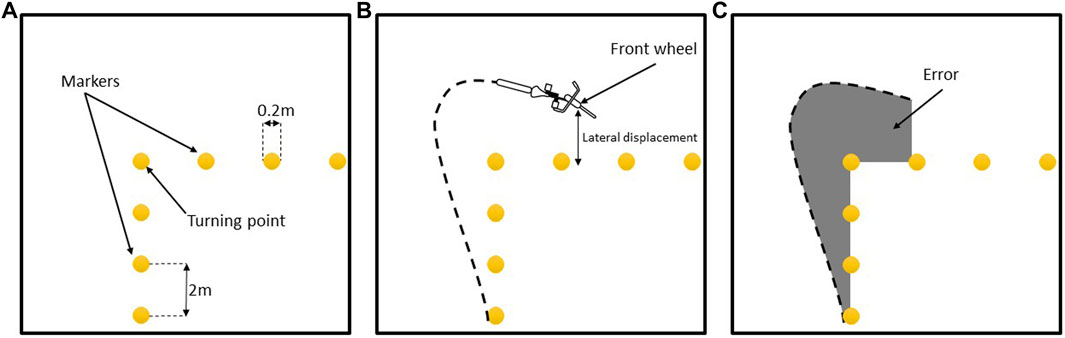
FIGURE 4. (A) A sequence of virtual markers (spheres) on the ground plane creates a series of segments, each 40 m long, that join at 90° angles. (B) Lateral displacement is measured by the shortest distance between the front wheel and the path. (C) The error on a trial is measured by the area under the bike trajectory curve relative to the path.
Results
Experiment 1 Results: Constant Speed
Adaptation
The average lateral error in pre-latency, latency-training, and post-latency phases was
In Figure 5, the entire 48 trials are divided into pre-latency, latency-training, and post-latency phases. As this figure shows, there is a downward trend of error in each of the phases. The average lateral error in the first trial (i.e., first turn) of the pre-latency phase was
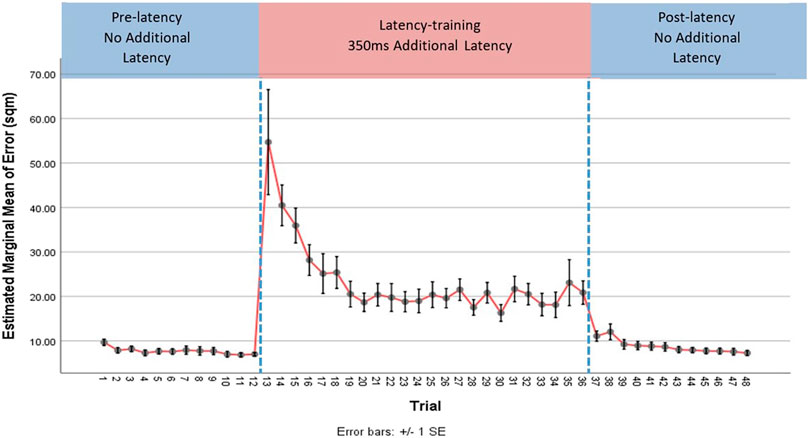
FIGURE 5. Average lateral error across 48 trials (90° turns) in the three phases of Experiment 1. Error bars represent standard errors.
Figure 5 provides visual evidence that users improved their performance as they proceeded along the path in each phase. We also conducted separate repeated measures ANOVAs for each phase on the average lateral error with trial as a factor. We found a significant main effect of trial in the pre-latency (
To assess change in error (i.e., trial effects) in each phase, we used a strategy of comparing adjacent trials, starting with the first pair in the phase. This strategy limited the number of statistical tests performed, while systematically testing for change in steering error. During the pre-latency phase, paired-comparison tests showed that only trials one and 2 (i.e., turns) were significantly different from one another, t (15) = 2.73, p = 0.016. During the latency-training phase, only trials 15 and 16 were significantly different from each other, t (15) = 4.41, p = 0.001, despite the clear reduction in error between trials 13 and 19 shown in Figure 5. This was likely due to the very large variability in error at the beginning of the latency-training phase. There were no other significant differences between adjacent trials except for an unexplained decrease in error from trial 29 to 30, t (15) = 3.67, p = 0.002, and an unexplained increase in error from trial 30 to 31, t (15) = -2.73, p = 0.016. Finally, during the post-latency phase, the first pair of trials was not significantly different (trials 37 and 38), t (15) = -0.652, p = 0.52, but the second pair of trials showed a significant difference (trials 38 and 39), t (15) = 2.57, p = 0.02.
Re-Adaptation
Pre- and post-latency phases were similar in the sense that users did not experience latency in either phase. The only difference was where in the sequence the pre- and post-latency phases occurred, either before or after the latency-training phase. As previously noted, we observed an adaptation pattern in every phase and here we were interested in capturing a possible re-adaptation process. By comparing the last trial of the pre-latency condition with the first trial of the post-latency condition we get a measure of how much the intervening latency trials disrupted performance. The average error comparison of the last trial of the pre-latency phase (
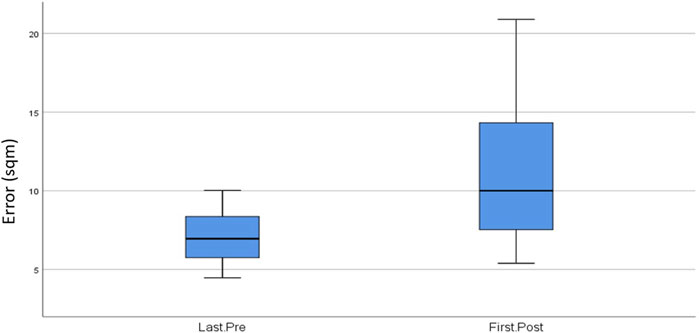
FIGURE 6. Average lateral error in the last trial of the pre-latency phase and the first trial of the post-latency phase in Experiment 1. Error bars represent standard errors.
Experiment 2 Results: Pedaling
Adaptation
Experiment 2 was the same as Experiment 1 except that users pedaled and steered the bike. The average lateral error in pre- and post-latency phases was relatively similar (pre-latency =
Figure 7 shows the error across the entire 48 trials (excluding practice trials). Comparison of the first and the last trials of each phase shows a decreasing pattern of error during every phase. Error decreased from
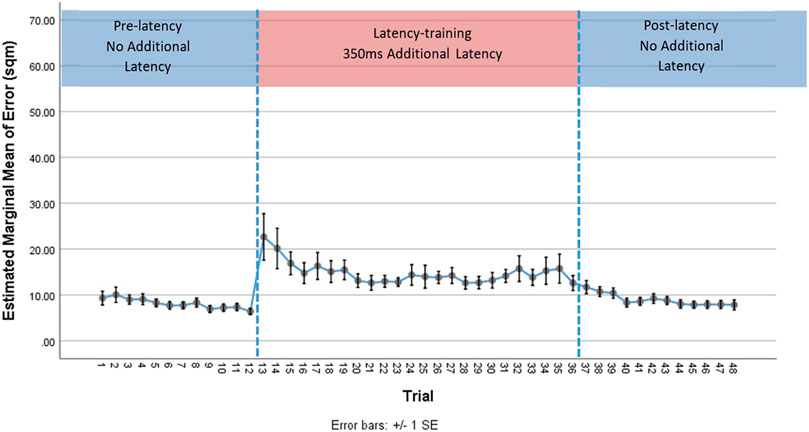
FIGURE 7. Average lateral error across 48 trials (90° turns) in the three phases of Experiment 2. Error bars represent standard errors.
We conducted separate repeated measures ANOVAs for each phase on the average lateral error with trial as a factor (i.e., turn). We found a significant main effect of trial in the pre-latency (
Re-Adaptation
The comparison of average error between the last trial of pre-latency phase and the first trial of post-latency phase shows that the error almost doubled (last trial of pre-latency phase =
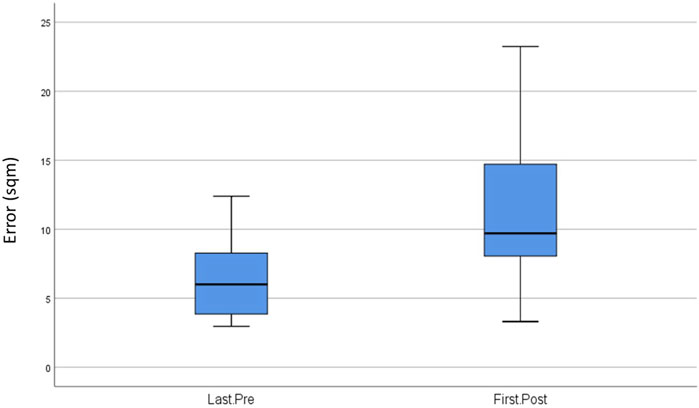
FIGURE 8. Average lateral error in the last trial of the pre-latency phase and the first trial of the post-latency phase in Experiment 2. Error bars represent standard errors.
Speed While Turning
In Experiment 2, users controlled the speed of the bicycle. The speed of bike was recorded at every frame. As with the measurement of lateral error, we analyzed a segment of 20 m before and after a 90° turn, with the turning point at the center of this segment.
For each trial (i.e., turn), we divided the segment into 20 bins of 2 m and calculated the average speed within that bin. Figure 9 shows the average speed during pre-latency, latency-training, and post-latency phases across the 20 bins where 0 represents the turning point. This shows that users consistently slowed down near the turning point and then accelerated back up to speed as they left the turning point. This pattern was the same across all three phases, suggesting that participants slowed down near the turning points to minimize the steering error.
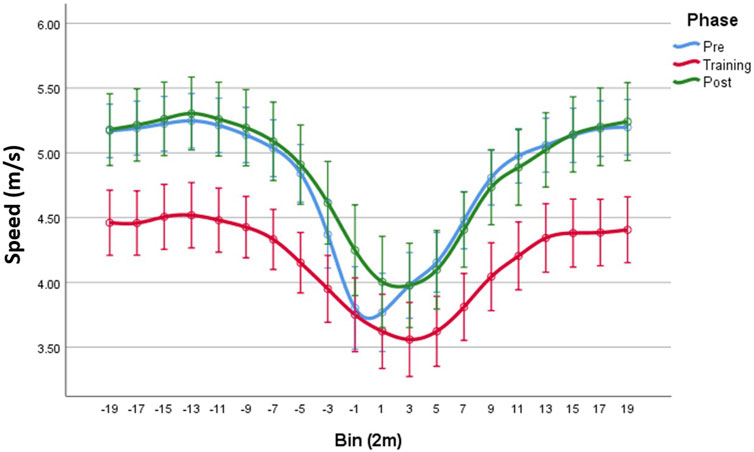
FIGURE 9. Average speed as users approached each turn across the different phases. Error bars represent standard error.
We conducted a repeated measures ANOVA on speed across these three different phases, with phase (3 levels) and bin (20 levels) as factors. The results of this analysis show a significant effect of phase (
We also looked at how average speed differed across phases. The average speed in the latency-training phase (4.10 m/s) was clearly lower than in the pre-latency (4.77 m/s) and post-latency (4.83 m/s) phases which were quite similar to each other. This suggests that riders reduced speed during the latency-training phase to cope with the greater difficulty of the controlling the bike in the face of substantial latency.
How did participants adjust their speed within a phase? Figure 10 shows how participants adjusted their speed from trial to trial across the experiment. We conducted separate repeated measures ANOVAs for each phase on speed with trial as a factor. We found a significant main effect of trial in pre-latency phase (
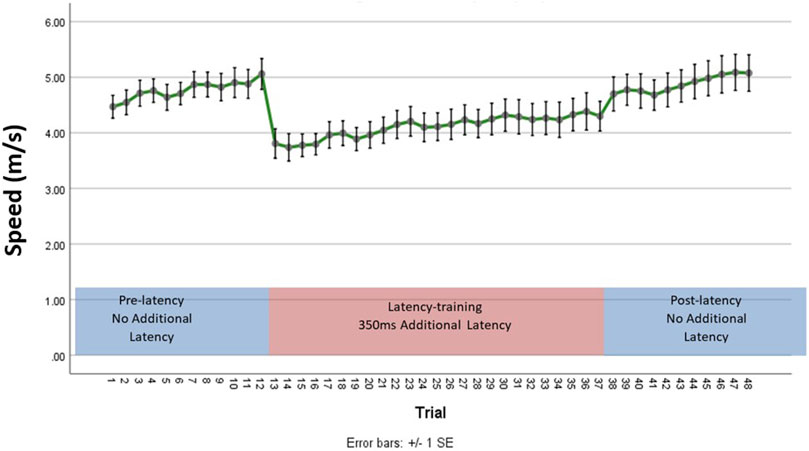
FIGURE 10. Average speed across 48 trials (90° turns) in the three phases of Experiment 2. Error bars represent standard errors.
Results: Cross-Experiment Comparisons
The only difference between Experiments 1 and 2 was whether or not users controlled the speed of bike. This section statistically compares these two experiments side-by-side. A comparison of average error between the constant speed (Experiment 1) and pedaling (Experiment 2) experiments shows that the users performed similarly in both pre- and post-latency phases. However, the constant speed condition clearly resulted in larger error in latency-training phase compared to the pedaling condition.
We collapsed phases over trial and conducted a mixed model ANOVA by considering phase as the main within-subjects factor and experiment (i.e., constant speed vs pedaling) as the between-subjects factor. This analysis shows a significant main effect of phase (
Discussion
This experiment examined the influence of visuomotor latency and speed regulation on the steering behavior of bicyclists in a head-mounted virtual reality system. In the first experiment the bicycle was self-propelled and the speed of motion was held constant, whereas in the second experiment riders controlled their speed through pedaling and braking. In both experiments, users rode a stationary bike while following a path of illuminated yellow markers as closely as possible. Both experiments had three phases. In the first phase, users rode through twelve 90° turns with minimal (∼46 ms) visuomotor latency on the steering. In the second phase, users rode through twenty-four 90° turns with 385 ms additional visuomotor latency on steering. Finally, in the third phase, users again rode through twelve 90° turns with minimal (∼46 ms) visuomotor latency on the steering. The dependent measure was the average lateral displacement of the bicycle from the actual path (i.e., error) across all frames within 20 m before and 20 m after a turning point (i.e., a trial).
In the constant speed experiment (Experiment 1), we found that users started each phase with a larger error at the beginning than at the end and quickly improved and stayed at a lower steady level of error until the end of the phase. Although this pattern was consistent across all three phases, the source of error was different. Users in pre-latency phase were new to the concept of riding a bike in a virtual environment. In addition, the dynamics and speed of the bike, along with the sharp turns in the path contributed to high error at the beginning of the pre-latency phase. The last few trials of the pre-latency phase demonstrated a steady pattern of lower error indicating that the users had adapted to the task. In the latency-training phase, users experienced a large additional visuomotor latency (385 ms), causing a temporal discrepancy between physically turning to steer and seeing the visual result. This latency dramatically impaired performance in the beginning trials, but users recovered and adapted to the latency. Users took slightly longer than the pre-latency phase to adapt to the additional visuomotor latency and users did not fully compensate even after 24 trials. In the post-latency phase, users experienced no latency following the large latency during the latency-training phase. Despite the fact that users had gone through 39 trials before starting post-latency phase, the level of error was higher at the start of the post-latency phase as compared to the end of the pre-latency phase. Participants then gradually re-adapted to riding without latency and reached a performance level similar to pre-test by the end of the experiment.
A major question these results raise is what are the processes that underlie adaptation and re-adaptation? Previous studies (Redding et al., 2005; Redding and Wallace, 2006a; Redding and Wallace, 2006b) on spatial visuomotor adaptation have found a consistent pattern of error: 1) a drastic decrement in error at the beginning of the prism exposure thought to reflect a cognitive strategy engaging the motor control system, and 2) a gradual decrement in error involving the visuomotor system known as perceptual-motor realignment (Petitet et al., 2018). We found exactly the same effect in our temporal visuomotor adaptation experiments. Users in the latency-training phase started with a large amount of error. They then substantially reduced the error at the beginning and gradually improved their performance. After removing the visual feedback delay, the post-latency phase started with a significant negative aftereffect which quickly disappeared. These patterns suggest that both a cognitive strategy and perceptual-motor realignment occurred in this experiment. Once participants noticed the discrepancy between turning the bike handlebars and the delayed visual result, they may have realized that they needed to begin turning earlier as they approached each turn. This type of conscious strategy may have accounted for the large decrement in error after the first few turns in the latency-training phase, after which participants showed gradual improvement as perceptual-motor realignment processes allowed them to fine-tune their steering in the presence of visuomotor latency.
A second major question this investigation addresses is how does the pace of the interaction impact adaptation and re-adaptation to visuomotor delay? Cunningham DW. et al. (2001) argued that adaptation occurs only if the pace of interaction is constant. They supported this claim using work by Sheridan and Ferrell (1963) reporting that users slowed down the interaction by taking an “act-and-wait” strategy to achieve their desired accuracy. This raises a question as to whether a constant pace of interaction is a necessary requirement of adaptation.
In Experiment 2, we addressed this question by allowing users to control the pace of movement by pedaling the bike. Similar to Experiment 1, in every phase the error was larger at the beginning trials compared to later trials and gradually decreased to a steady level. A comparison between pre- and post-latency phases showed a significant negative aftereffect during the post-latency phase. Based on our observations, as long as the perturbation factor is predictable and consistent (Rohde et al., 2014), users can adapt to the latency even when they control the pace of interaction. In another words, control over the pace of interaction does not interfere with visuomotor adaptation. Although users in the latency-training phase of Experiment 2 reduced the error to a steady level after few trials, this level was still higher than the steady level of error during the pre- and post-latency phases. This indicates that users in the latency-training phase did not completely compensate for the visuomotor latency even by controlling the pace of movement. A cross-experiment comparison between the constant speed and pedaling experiments with respect to error revealed that users performed similarly in the pre- and post-latency phases of both experiments. However, users in latency-training phase of the constant speed experiment had greater error compared to the corresponding phase in pedaling experiment. Clearly, the sole difference between these two latency-training phases was whether users controlled the speed of bike. Slowing down allowed users in Experiment 2 to better compensate for visuomotor latency than users in Experiment 1.
Interestingly, we found that users rode the bike at a slower speed in the latency-training phase than in the pre- and post-latency phases. This observation is consistent with Davis et al. (2010) who found that when users encounter latency, they were inclined to slow down to better control their movement and to minimize their error. Besides the general slowdown in the latency-training phase, users adjusted their speed to the complexity of the path in Experiment 2. They slowed down when they approached a turning point and they accelerated once they passed the turning point. Besides the fact that users in the present investigation managed to increase and decrease their speeds with respect to the complexity of the path (i.e., entering vs exiting a turn), they increased their overall speed as they adapted and became accustomed to the conditions. They always started a new phase with a slower speed and as they proceeded, they gradually sped up. This occurred even though there was no pressure to quickly complete the task. This is analogous to theories of risk homeostasis (Wilde, 1998) where people maintain a constant risk (i.e., here it is the level of error); as they improve in controlling the bike, they tend to ride faster.
There are several limitations of the current investigation. First, we only tested a single constant latency that was based on pilot testing to determine a latency that made steering the bike neither too easy nor too hard. During pilot studies, we found that participants instantly compensated for a latency of 330 ms, but could not complete the task when the latency was 440 ms. The 385 ms latency was a sweet spot that allowed us to study the processes of adaptation and readaptation to visuomotor latency. We also chose a single riding speed based on pilot work testing average riding speed for a separate group of users. Future work should explore how variation in the parameters of latency and speed impact adaptation and readaptation to visuomotor latency. Second, we did not include a control group who rode the entire path (all 48 turns) with no latency. Instead, we selected A-B-A experimental design to capture adaptation and readaptation within subjects. As a result, we do not know how performance at the beginning of the post-latency phase compares to performance of a group who did not experience the intervening visuomotor latency. Quite likely, a comparison of the first trial of the post-latency phase to the corresponding trial of a control group would show an even larger difference in performance. Third, our strategy for conducting post-hoc tests of trial effects within a phase involved comparing adjacent pairs of trials, starting with the first pair in the phase and continuing until the difference was statistically non-significant. This strategy limited the number of statistical tests performed, while systematically testing for change in steering error. We chose this strategy rather than performing all pairwise comparisons with a statistical correction for the number of tests. This allowed us to greatly curtail the number of post-hoc tests while still testing for evidence of change in performance. Given that participants adapted so quickly in each phase, only a small number of post-hoc tests were conducted. However, the downside of this approach is that very gradual changes in error or speed are not easily detected when only comparing adjacent pairs. Lastly, the error metric we used is based on distance from the path to be followed. Because the path includes 90° turns, the minimum achievable error would likely depend on the rider’s speed and not be zero. Nevertheless, we believe the error metric does capture the relative error within phases, between phases, and between experiments.
To the best of our knowledge, this is the first study examining the underlying process of adaptation in the presence of a large visuomotor latency when users either ride at a constant speed or control their speed in a continuous steering task in a virtual environment. Our study suggests that users can adapt to a significant visuomotor feedback latency. Although the negative aftereffect was brief, our findings also indicate that users of flight or vehicle simulators must make sure they safely recalibrate to real-world conditions before operation. In addition, this study may be helpful for psychologists studying perception and action by introducing virtual reality as a reliable and well-controlled environment for understanding the processes of visuomotor adaptation.
Data Availability Statement
The raw data supporting the conclusions of this article will be made available by the authors, without undue reservation.
Ethics Statement
The studies involving human participants were reviewed and approved by the University of Iowa Institutional Review Board (IRB). The participants provided their written informed consent to participate in this study.
Author Contributions
PR contributed to the design, implementation, data collection, and statistical analysis. JK and JP contributed to the design and supervision of this work. All authors contributed to writing the article and approved the submitted version.
FUNDING
This work was supported in part by National Science Foundation award CNS-1305131 and by the Safety Research Using Simulation University Transportation Center (SAFER-SIM). SAFER-SIM is funded by a grant from the U. S. Department of Transportation's University Transportation Centers Program (69A3551747121). However, the U. S. Government assumes no liability for the contents thereof.
Conflict of Interest
The authors declare that the research was conducted in the absence of any commercial or financial relationships that could be construed as a potential conflict of interest.
Publisher’s Note
All claims expressed in this article are solely those of the authors and do not necessarily represent those of their affiliated organizations, or those of the publisher, the editors and the reviewers. Any product that may be evaluated in this article, or claim that may be made by its manufacturer, is not guaranteed or endorsed by the publisher.
References
Bedford, F. (1993). Perceptual Learning. Psychol. Learn. Motiv. 30, 1–60. doi:10.1016/s0079-7421(08)60293-5
Cunningham, D. W., Billock, V. A., and Tsou, B. H. (2001a). Sensorimotor Adaptation to Violations of Temporal Contiguity. Psychol. Sci. 12 (6), 532–535. doi:10.1111/1467-9280.d01-17
Cunningham, D. W., Chatziastros, A., Von der Heyde, M., and Bülthoff, H. H. (2001b). Driving in the Future: Temporal Visuomotor Adaptation and Generalization. J. Vis. 1 (1), 88–98. doi:10.1167/1.2.3
Davis, J., Smyth, C., and McDowell, K. (2010). The Effects of Time Lag on Driving Performance and a Possible Mitigation. IEEE Trans. Robot. 26 (3), 590–593. doi:10.1109/tro.2010.2046695
Harris, C. S. (1963). Adaptation to Displaced Vision: Visual, Motor, or Proprioceptive Change? Science 140, 812–813. doi:10.1126/science.140.3568.812
Held, R., Efstathiou, A., and Greene, M. (1966). Adaptation to Displaced and Delayed Visual Feedback from the Hand. J. Exp. Psychol. 72 (6), 887–891. doi:10.1037/h0023868
Helmholtz, H. (1896). “Handbuch der physiologischen Optik,” in Allgemeine Encyklopädie der Physik [General encyclopedia of physics]. Editor G. Karsten (Hamburg-Leipzig: L. Voss), 9, 1–874.
Kennedy, J. S., Buehner, M. J., and Rushton, S. K. (2009). Adaptation to Sensory-Motor Temporal Misalignment: Instrumental or Perceptual Learning? Q. J. Exp. Psychol. 62 (3), 453–469. doi:10.1080/17470210801985235
Miall, R. C., and Jackson, J. K. (2006). Adaptation to Visual Feedback Delays in Manual Tracking: Evidence against the Smith Predictor Model of Human Visually Guided Action. Exp. Brain Res. 172 (1), 77–84. doi:10.1007/s00221-005-0306-5
Petitet, P., O’Reilly, J. X., and O’Shea, J. (2018). Towards a Neuro-Computational Account of Prism Adaptation. Neuropsychologia 115, 188–203. doi:10.1016/j.neuropsychologia.2017.12.021
Redding, G. M., and Wallace, B. (2006a). Prism Adaptation and Unilateral Neglect: Review and Analysis. Neuropsychologia 44 (1), 1–20. doi:10.1016/j.neuropsychologia.2005.04.009
Redding, G. M., and Wallace, B. (2006b). Generalization of Prism Adaptation. J. Exp. Psychol. Hum. Percept. Perform. 32 (4), 1006–1022. doi:10.1037/0096-1523.32.4.1006
Redding, G. M., Rossetti, Y., and Wallace, B. (2005). Applications of Prism Adaptation: A Tutorial in Theory and Method. Neurosci. Biobehav. Rev. 29 (3), 431–444. doi:10.1016/j.neubiorev.2004.12.004
Rohde, M., Van Dam, L. C., and Ernst, M. O. (2014). Predictability Is Necessary for Closed-Loop Visual Feedback Delay Adaptation. J. Vis. 14 (3), 4–23. doi:10.1167/14.3.4
Sarpeshkar, V., and Mann, D. L. (2011). Biomechanics and Visual-Motor Control: How it Has, Is, and Will Be Used to Reveal the Secrets of Hitting a Cricket ball. Sports Biomech. 10 (4), 306–323. doi:10.1080/14763141.2011.629207
Sheridan, T. B., and Ferrell, W. R. (1963). Remote Manipulative Control with Transmission Delay. IEEE Trans. Hum. Factors Electron. HFE-4 (1), 25–29. doi:10.1109/thfe.1963.231283
Smith, K. U., and Smith, W. M. (1962). Perception and Motion: An Analysis of Space-Structured Behavior. Philadelphia: W. B. Saunders Co.
Smith, W. M., McCrary, J. W., and Smith, K. U. (1960). Delayed Visual Feedback and Behavior. Science 132, 1013–1014. doi:10.1126/science.132.3433.1013
Smith, K. U., Wargo, L., Jones, R., and Smith, W. M. (1963). Delayed and Space-Displaced Sensory Feedback and Learning. Percept Mot. Skills 16 (3), 781–796. doi:10.2466/pms.1963.16.3.781
Welch, R. B. (1978). Perceptual Modification: Adapting to Altered Sensory Environments. New York, NY: Academic Press.
Keywords: immersive virtual environments, visuomotor latency, steering behavior, head-mounted displays, perceptual-motor adaptation
Citation: Rahimian P, Plumert JM and Kearney JK (2021) The Effect of Visuomotor Latency on Steering Behavior in Virtual Reality. Front. Virtual Real. 2:727858. doi: 10.3389/frvir.2021.727858
Received: 19 June 2021; Accepted: 18 November 2021;
Published: 21 December 2021.
Edited by:
Corey Bohil, University of Central Florida, United StatesReviewed by:
Phil Lopes, Universidade Lusófona, PortugalHenrique Galvan Debarba, IT University of Copenhagen, Denmark
Copyright © 2021 Rahimian, Plumert and Kearney. This is an open-access article distributed under the terms of the Creative Commons Attribution License (CC BY). The use, distribution or reproduction in other forums is permitted, provided the original author(s) and the copyright owner(s) are credited and that the original publication in this journal is cited, in accordance with accepted academic practice. No use, distribution or reproduction is permitted which does not comply with these terms.
*Correspondence: Joseph K. Kearney, am9lLWtlYXJuZXlAdWlvd2EuZWR1