 Negar Khojasteh
 Andrea Stevenson Won
94% of researchers rate our articles as excellent or good
Learn more about the work of our research integrity team to safeguard the quality of each article we publish.
Find out more
ORIGINAL RESEARCH article
Front. Virtual Real., 10 June 2021
Sec. Technologies for VR
Volume 2 - 2021 | https://doi.org/10.3389/frvir.2021.643331
This article is part of the Research TopicMeeting Remotely – The Challenges of Optimal Avatar Interaction in VRView all 8 articles
Numerous studies have shown the potential benefits of collaborative virtual environments (CVEs) for distributed teams. However, there are few longitudinal studies on collaboration in immersive virtual environments, and existing studies mostly examine how pairs or groups adapt over time. In a longitudinal study, we examined what does and does not change over time as individual users adapt to collaboration in virtual environments. In our mixed-methods, exploratory study, we matched 20 participants in random pairs over five sessions. We assigned each participant to complete a different collaborative task, with a different partner, in each session. Our quantitative data analysis and qualitative interview data show that adaptation to VR increased significantly over time. Presence ratings did not show change over time, but participants reported developing new ways to communicate in VR. We also identified patterns indicating a relationship between a person’s emotional state and their partner’s ability to recognize their emotion. We conclude with a discussion of our findings and provide design implications and future directions for designers and researchers in the field.
Considerable previous work has shown the potential benefits of virtual reality (VR) in computer-supported cooperative work (CSCW). It has been examined in the context of design (e.g., Koutsabasis et al., 2012; Paes et al., 2017), education (e.g., Warburton, 2009; Freina and Ott, 2015), data analysis (Nguyen et al., 2019), and clinical applications (Larsen et al., 2009), to name just a few examples.
Of particular relevance today, collaborative virtual environments (CVEs) hold enormous potential for remote teams. VR provides users the unique advantage of a shared virtual environment in which spatial relationships between team members and virtual objects are maintained. This presents an important advantage to people and teams who aim to work on shared tasks (Slater et al., 2000; Otto et al., 2006). In addition, nonverbal behavior such as mutual gaze (Bailenson et al., 2001) and proximity (Bailenson et al., 2008) can be expressed to a greater extent than through traditional video-mediated communication tools. Working together in virtual reality can reduce the environmental costs of travel (Bosch-Sijtsema and Sivunen, 2013). People with visa restrictions can benefit from CVEs to attend meetings and events around the world virtually. And, as has become salient recently with the COVID19 pandemic, VR can help mitigate global disruptions that make face-to-face interactions very difficult. However, the opportunity for users to collaborate in CVE using consumer equipment is relatively new, and many people who might potentially benefit from CVEs are not experienced users of VR. Thus, understanding how naive users adapt to CVEs over time is a timely and relevant question.
In this paper, we describe an exploratory, mixed-methods longitudinal study that focuses on individual, rather than team, adaptation to collaboration in VR. Our contributions are as follows. First, we assign each individual to a new task and a new partner each time in an effort to distinguish the effects of individual experience over time on perceived social and physical presence and workload. Second, we examine the effects of task on perceived social and physical presence and workload. Finally, we examine how individuals self-present, express and understand emotional states in CVEs, and how their strategies might change over time. We describe new strategies that individuals used with strangers, and find support for the influence of nonverbal behavior in emotion recognition. As pointed out by other researchers, design considerations for VR are mostly focused on individual user experience (Bleakley, 2020), however our work proposes guidelines for enhancing social interactions and communication in virtual reality and therefore contributes to ongoing work that aims to design better VR platforms for social interactions.
In the following sections, we review the current literature on existing lab-based and longitudinal social VR studies. We will briefly review previous work on workload, presence, and recognition of nonverbal cues and emotions in mediated communication. In the methods section, we describe our longitudinal study in which participants visited the lab for five sessions, in each of which they were assigned to work with a new partner and on a new task. We provide quantitative and qualitative data analysis and findings in the results section. We conclude with a discussion of these findings, including implications for researchers and designers in the field of HCI in general and social VR specifically.
From early work (Axelsson et al., 1999; Slater et al., 2000; Wideström et al., 2000; Schroeder et al., 2001) to more recent studies (e.g., Andrist et al., 2017) lab studies in which participants come to the lab for a single visit have provided valuable insights on collaboration in VR. Researchers have explored immersion and leadership behavior (Steed et al., 1999), workload experienced by team members (Pouliquen-Lardy et al., 2016), environmental and social presence and the relationship between dimensions of presence (Steed et al., 1999; Slater et al., 2000). Factors that affect task performance such as gaze (Andrist et al., 2017), haptic feedback (Basdogan et al., 2000), the role of self-avatars (Pan and Steed, 2019), and communication mode (e.g., audio vs. video, Sallnäs, 2005) have also been studied in the context of VR and teamwork.
However, participants in these VR studies have often never used VR before (Bailenson and Yee, 2006) and as called by some researchers in the field are “VR first timers” (Gunkel et al., 2018). Even if participants have been exposed to consumer VR systems, they are more likely to have used them for entertainment purposes rather than collaboration or social interaction (Slater and Sanchez-Vives, 2016). Therefore, naive users may still be adjusting to immersive technology and the experience of interacting with another person via avatars during the experiment session. This process of adjustment could affect their ability to engage with their partners, and even to complete the tasks.
To understand how users adapt to new technology, data collected over multiple time points can offer new insights. For example, repeated exposure to VR has been found to decrease simulation sickness (Bailenson and Yee, 2006). Collecting such data can occur through long-term field studies with interviews (e.g., Wetsch, 2008) or longitudinal lab studies (e.g., Bailenson and Yee, 2006) that include repeated behavioral measures (e.g., Yee and Bailenson, 2008). However, few longitudinal studies in VR exist (with important exceptions, e.g., Fruchter, 2018). With most research on VR conducted as one-time lab studies (e.g., Basdogan et al., 2000; van der Land et al., 2013; Pan and Steed, 2019), less is known about how users adapt to virtual environments over time and how adapting and getting comfortable with VR affects users’ social interactions in VR. In the following section, we will review the handful of studies that have looked specifically at team collaboration in VR over time (Steed et al., 2003; Bailenson and Yee, 2006; Moustafa and Steed, 2018), as well as some related work.
Researchers in HCI have highlighted the importance of temporality in studying user experience such as changes in users’ behavior, comfort level with the system, and perception of the system’s usability over time (Forlizzi and Battarbee, 2004; Hassenzahl and Tractinsky, 2006; Courage et al., 2009; Karapanos et al., 2009). Longitudinal research is thus considered as an extremely valuable method for studying changes in users’ behavior and perception over time (Gerken et al., 2007; Courage et al., 2009; Leite et al., 2013).
However, longitudinal studies are time-consuming and resource-intensive and it is difficult to bring the same participants back to the lab multiple times (Bailenson and Yee, 2006). Because of these challenges, longitudinal lab studies are not very common in HCI generally (Gerken et al., 2007; Karapanos et al., 2009; McLellan et al., 2012) and in the field of social VR specifically (Bailenson and Yee, 2006; Porter III and Robb, 2019).
Some longitudinal work in social VR has looked at topics such as expression of personality and linguistic metrics (Yee et al., 2011), changes in social behavior and activity (Harris et al., 2009), and people’s use of Second Life for entertainment (Wetsch, 2008). However, longitudinal studies on collaboration and teamwork in VR (Steed et al., 2003; Bailenson and Yee, 2006) are very few. This is especially true for studies that examine the use of immersive VR, in which participants wear headsets and see their actions, and their teammates’ actions, represented by avatars, even though immersive VR is becoming increasingly widely used (McVeigh-Schultz et al., 2018). Below, we review these few longitudinal studies on collaboration and teamwork that have been conducted in CVEs.
One of the first studies that explored collaboration in CVEs was Steed et al. (2003) study. Five pairs of participants (two pairs of friends and three pairs of strangers) worked on five tasks for 210 min and responded to questionnaires after each task. Participants reported that they enjoyed open-ended and social tasks more than tasks which needed “analysis and spatial coordination”. Lack of facial expressions and difficulty understanding other people’s actions and intentions made collaboration challenging. The authors also noted that despite their expectations, these challenges did not fade over time. We discuss literature on nonverbal cues and emotion and our research questions in more detail in Section 2.3.
Bailenson and Yee (2006) conducted a longitudinal study in which three groups of three participants worked on problem-solving tasks for 15 sessions. In their study, avatars were made based on the photographs of participants by researchers and were kept the same throughout all 15 sessions. In addition to head-movements, sense of presence, and co-presence were measured with post-task questionnaires. According to the authors, the presence questionnaire was “designed to measure how immersed participants were in VR”, and co-presence questionnaire was “designed to measure how human-like and socially relevant the other avatars were” (p. 703). No statistically significant changes over time in reported sense of presence and co-presence was found. However, head movement data showed that participants looked at each other less frequently in later sessions (60% of the time) compared to earlier sessions (80% of the time). In this study, as participants gained more experience with the equipment, reports of simulator sickness decreased and teams became more cohesive and connected over time. Based on their study, Bailenson and Yee (2006) highlighted the importance of longitudinal studies in VR and pointed out an important note: given the VR technology is extremely novel to first-time users, the way they use the system and interact with others is most likely different from the way that experienced users behave. We discuss related work on presence and our associated research questions in more detail in Section 2.4.
In a more recent study, Moustafa and Steed (2018) conducted a longitudinal study of social VR with nine groups of two and three participants who knew each other (friends or family members). Participants used VR over a period of 4 weeks, completed diary notes, and were interviewed by researchers. Based on the qualitative data, the authors concluded that affective experiences in VR were similar to real life experiences. They also noted that lack of nonverbal cues and facial expressions makes it harder for users to interpret social cues. For example, their participants reported challenges with turn taking as there was no way for them to know someone is about to speak. Overall, the authors argue that over time users adapted to limited nonverbal cues and other limitations of the mediated communication. For example, participants relied more on voice as other cues such as facial expressions were absent. They found that users preferred to customize their avatars to represent themselves. The majority of participants made changes to their avatar over time; experimenting with available options or influenced by family members’ comments. We discuss literature on avatar customization and our research questions in Section 2.5 in more detail.
In all of these longitudinal studies, the same pairs or groups worked together for multiple sessions so group members adapted to VR together. However, keeping the groups unchanged does not allow us to separate out the effects of individual experience in virtual environments. Our longitudinal VR study aims to contribute to research in social VR by exploring these previous measures individually, including potential changes in users’ perceived presence and workload over time and among five different tasks. In addition, we wanted to examine how users learn to express their emotional state, and read the emotional states of their collaborators, and how emotional expression and interpretation might be influenced by available cues. We were also interested in how participants would choose to customize their avatars when given multiple opportunities to do so. In particular, we wanted to isolate the changes in individual experience from the dynamics of a group working together over several sessions, as this confounds the experience of getting to know one’s teammates with the experience of getting to know the system.
Workload as a concept for measuring difficulty of working with a system or difficulty of performing a task is widely used in Human Computer Interaction (HCI) (e.g., Mark et al., 2008; Nguyen and Fussell, 2014) and other fields such as human factors (Endsley, 1999; Kaber and Endsley, 2004), and Human Robot Interaction (Lohse et al., 2014). One of the common uses of mental workload is in comparing ease of use of systems or interfaces (e.g., Xu et al., 2014). If users’ mental workload is lower after or during use of system A compared to system B, researchers can conclude that system A is probably easier to use than system B (Goyal and Fussell, 2016).
VR researchers have used mental workload in areas such as exploring user experience in VR (Greenwald et al., 2017; Rajanna and Hansen, 2018), and teamwork in VR (e.g., Pouliquen-Lardy et al., 2016). For example, in a study on teamwork in VR (Pouliquen-Lardy et al., 2016), researchers used NASA-TLX scale to measure reported workload and found that team members who had the role of guiding (instructing) the task experienced lower workload than those who were performing the tasks.
To our knowledge, workload has not previously been used in longitudinal studies of social VR. We added this concept to our study to explore whether performing tasks in VR becomes easier over time according to this measure. This allows us to compare the concept of workload to the adaptation concept discussed below. In other words, we aimed at exploring the relationship between adaptation to VR environment and ease of performing tasks (workload).
RQ1: How does participants’ perceived workload change over time and by nature of the task?
Nonverbal behaviors such as gestures, head movements, and facial expressions play an important role in interpersonal communication and determining the emotional state of others (Hancock and Dunham, 2001; Manstead et al., 2011). When people interact using computer-mediated communication (CMC) tools their access to non-verbal cues is limited (Walther et al., 2005). Some CMC tools, such as video conferencing applications, provide users an audio and visual channel which help them in expressing and receiving a subset of nonverbal cues. During video calls, users can see each other’s head movements and facial expressions (Neustaedter and Greenberg, 2012), however, some nonverbal cues such as mutual gaze (eye contact) are not supported in majority of CMC tools (Fussell and Setlock, 2014). In comparison, virtual reality communicates head position as a proxy for gaze, but facial expressions are generally not tracked given that users communciate via avatars and don’t see each other’s faces during VR interaction.
The existing literature on nonverbal communication in VR is extensive (see Tanenbaum et al., 2014 for a review). However, the availability and accuracy of nonverbal signals provided to users in VR depends on how designers and developers of VR platforms choose to define and implement the tracking and rendering mechanisms of the platform. For example, head tracking is supported by almost all commercial social VR platforms such as High Fidelity, Facebook Spaces, and VRChat (Tanenbaum et al., 2020) and has important benefits for exchanging nonverbal cues. Tracking and rendering head movement means that when user do a head nod this movement is visible to others in VR space via the avatar. Unlike head movement and lip sync (synchronized avatar lip movement with user voice), tracking user’s facial expression is not common in social VR platforms (Tanenbaum et al., 2020).
Research has showed that people rely on alternative available cues when visual or auditory cues are not available (Walther, 1996). For example, while using a text-based CMC tools, users rely on other linguistic and paralinguistic factors such as word choice (Harris and Paradice, 2007), chronomics or temporal features of conversation (Walther and Tidwell, 1995), and emoticons (Dresner and Herring, 2010) in showing emotions and interpreting the emotional state of others.
We know that VR platforms offer features such as preset facial expressions (similar to emojis) to support emotion expression. However, preset facial expressions are not the only way for users to show emotions and affect in VR. In their longitudinal study, Moustafa and Steed (Moustafa and Steed, 2018) found that participants consider voice as an important factor in conveying emotion. Another potential way for users to express how they feel could be through expressive words, or in other words use of verbal communication. We selected a platform, Facebook Spaces, which allowed users to express themselves using speech, tone of voice, gestures, and emojis in replacement of facial expressions.
Considering what we discussed above, we propose the following research questions:
RQ2a: Among the available cues (word choice, tone of voice, gestures, facial expression features) which one do users value most in showing emotions? And, does that priority change over time?
RQ2b: Are users able to accurately identify their partner’s emotional state using the available cues in VR, and if so, does this ability change over time?
RQ2c: Do users who report prioritizing nonverbal cues like gesture or facial expression show greater accuracy when identifying partners’ emotional states?
There are many definitions for the concept of presence. One of the most common definition of presence defines it as subjective experience of being in the virtual environment (Slater and Wilbur, 1997; Oh et al., 2018). Presence is a key concept in majority of studies in social VR as it is perceived as a measure of people’s experience in a virtual environment (Cummings and Bailenson, 2016). Presence is “mediated by an environment that engages our senses, captures our attention and fosters our active involvement” (Witmer et al., 2005, p. 298). Presence is not a unidimensional concept and can be divided into subcategories. While the terminology varies in different fields, most researchers agree that we can define at least two subdimensions for presence: physical (also known as spatial or environmental) presence and social presence.
Physical presence is defined as “the extent to which one feels present in the mediated environment, rather than in the immediate physical environment” (Steuer, 1992, p. 75). Researchers have studied physical presence and the benefits of mediated and virtual environments where users experience high levels of physical presence. Based on past research, we know that physical presence can intensify effects of the media experience such as the sense of joy users feel during the interaction (Tamborini and Skalski, 2006) and it can also be associated with effectiveness of simulation in exposure therapy (Ling et al., 2014) and educational settings (Freina and Ott, 2015). Given that number of longitudinal studies in social VR are limited, our understanding of changes in users’ sense of physical presence over time is also limited. Past longitudinal studies either have not measured spatial (physical) presence directly (Steed et al., 2003), or have not found a statistically significant change in spatial presence over time (Bailenson and Yee, 2006). To contribute to this line of work, and to explore the potential effect of exposure and practice on subjective sense of spatial presence we included the following research question in our study.
RQ3a: How does participants’ sense of physical presence, including their ability to adapt to the environment, change over time and by nature of the task?
Another dimension of presence that is important in shaping our understanding of users’ experience in virtual environment is the notion of social presence. Biocca, Harms, and Burgoon (Biocca et al., 2003) define social presence as “sense of being together with another.” While physical presence is focused on one’s experience and perception toward the environment, social presence focuses on social and interpersonal aspect of the experience.
RQ3b: How does participants’ sense of social presence change over time and by nature of the task?
The importance of providing users the ability to choose and customize avatars has been shown in many VR studies. For example, Ducheneaut et al. (2009) examined how and why users customize their avatars in the context of three gaming platforms. Among other interesting findings, they found that customizing hair was of high priority for most users and they also found that users tended to create their avatars adhering to Western beauty standards (e.g., younger and leaner version of themselves).
In a recent study, based on interview with social VR users, Freeman et al. (2020) highlight the importance of avatar customization to users and emphasize that users attribute an “intimate connection” between their body and the avatar, resulting in a desire to make the avatar similar to themselves. Several participants in their study pointed out the fact that social VR platforms do not offer tools and features for users to easily create a high resemblance avatar.
In longitudinal social VR studies, researchers get the unique opportunity to examine users’ perception of avatar as well as customization practices over time. For example, Moustafa and Steed (2018) concluded that participants chose avatars that resembled them overall. They also discussed that more than half of the participants made alterations to their avatars over time mostly “to experiment with the various representations available” or because they were “forced to do so by their families” (p. 7).
In Moustafa and Steed (2018) study people interacted with friends and family members and therefore it is possible that users’ choice of highly self-resembling avatars was due to the fact that they wanted to present themselves consistently with how others know them. In our study design, we aimed at pairing users with strangers and therefore we had the opportunity to examine the potential effect of familiarity with the platform on users’ approaches to avatar customization over time.
RQ4: Do participants’ approaches to avatar customization change over time? (and if so, why?)
The following list shows the seven research questions that we discussed and proposed in the previous section. Throughout the paper, we keep the same order in all sections and subsections.
• RQ1: How does participants’ perceived workload change over time and by nature of the task?
• RQ2a: Among the available cues (word choice, tone of voice, gestures, facial expression features) which one do users value most in showing emotions? And, does that priority change over time?
• RQ2b: Are users able to accurately identify their partner’s emotional state using the available cues in VR, and if so, does this ability change over time?
• RQ2c: Do users who report prioritizing nonverbal cues like gesture or facial expression show greater accuracy when identifying partners’ emotional states?
• RQ3a: How does participants’ sense of physical presence, including their ability to adapt to the environment, change over time and by nature of the task?
• RQ3b: How does participants’ sense of social presence change over time and by nature of the task?
• RQ4: Do participants’ approaches to avatar customization change over time? (and if so, why?)
For this study, we selected a consumer virtual reality system. Facebook Spaces, that allowed us to readily connect participants in a collaborative virtual environment and observe how they adapted to the environment over repeated visits. After each session, participants reported dimensions of physical presence (adaptation and involvement), task workload, and social presence after each session. We also asked participants to report which cues (e.g., tone of voice, avatar movement) they prioritized in showing and interpreting emotion during their interactions in VR. Finally, we asked participants to report on their own emotional states, and to estimate the emotional states of their partners. We also recorded how users chose to represent themselves using avatars, given the opportunity to customize their avatar appearance at each session. Finally, we conducted a qualitative interview at the end of the five sessions. All data collection was completed before the COVID19 pandemic lockdown. In the following paragraphs we provide information about participants, equipment, tasks and procedures, as well as the measures we used.
All participants who completed the five sessions (15 participants) were interviewed one on one by the first author after they completed the last session. One participant opted to join session four as her last session due to personal travel plans. Since session four was her last session, she participated in the interview after session four instead of session five. Semi-structured interviews lasted 20–35 min and with participants’ consent were audio-recorded for further analysis. Participants were allowed to skip questions or to request the recording to be paused at any point. The researcher asked participants about their experience of using VR for collaboration with another person, their approach in expressing their emotions and interpreting others’ emotions, as well as the challenges they had faced in using VR and completing the tasks. The interview questions also included questions about avatar customization and the factors that were important to students regarding the way their avatar looked. At the end of the interview, the researcher debriefed participants on the purpose of the study and the collected data. The researcher also answered any questions raised by participants.
Twenty-two participants were recruited through the Cornell university SONA system, an online platform on which students can sign up for research studies on campus. Before the first session, each participant had a short informational meeting with the researcher regarding time commitment, compensation, and potential eligibility matters such as being prone to motion sickness. Out of 22 students who came to the one on one informational meeting, two withdrew from the study due to academic schedule conflicts or being prone to motion sickness. The rest signed informed consent, leaving 20 participants (six male, thirteen female, and one person who identified as non-binary) aged between 18 and 23 (M = 19.55). Participants received a total amount of 80 dollars for participating in all five sessions of study (partial compensation was paid per session). Six participants self identified as Asian, five as Caucasian, four as Biracial, two as Black American, one Hispanic, and two preferred to not mention their ethnicity. Out of 20 participants, 15 completed all five sessions, two completed four sessions, two completed three sessions and one person completed only two sessions. Students who dropped out told us that they got too busy with school work and could not come to the lab anymore.
We used a consumer version of the Oculus Rift headset with Touch controllers for the right and left hands for all sessions and all participants. Oculus Rift’s resolution is 2160 × 1200 (1080 × 1200 per eye) with 456 ppi pixel density, 90 Hz refresh rate and 110° field of view. Oculus Rift also has hand controllers for both left and right hands, which support front-facing tracking. The total weight of the headset is 470 g (1.04 lb).
Participants were in separate rooms during the experiment. Each room was equipped with a 15-inch laptop and the Oculus Rift headset and hand controllers. Participants were assisted with donning the headset and grasping the hand controllers. We used the consumer version of Facebook Spaces for this study.
In this study, we used Facebook Spaces as the virtual environment for all sessions. We chose it for several reasons.
First, Facebook Spaces allowed users to customize their avatar. Users could modify features ranging from the color and shape of facial features, to hair style, accessories such as glasses, and outfit color. This allowed us to investigate whether participants would prefer to create avatars that resembled themselves, and whether these representations would remain consistent across sessions.
Second, we chose Facebook Spaces to explore participants’ use of the available facial expression feature in this environment. The facial expression feature was triggered by hand controllers and allowed users to make the avatar look sad, happy, etc. We wished to investigate whether participants would use this feature, and, if so, whether use would increase over time.
We also used Facebook Spaces to allow us to increase the range of tasks that participants could complete together. For example, all participants were shown how to use the virtual pen. The virtual pen allowed users to create 3D drawings which they could hold and move around in the space. In all sessions, we used one of the default backgrounds of the space. Participants saw a table, their partner’s avatar (across the table), and a 360-degree panoramic photograph of a park (Figure 1).
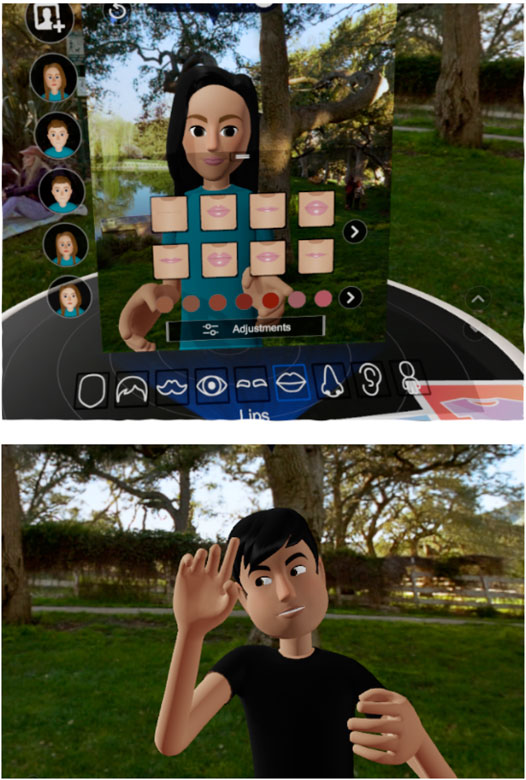
FIGURE 1. Top: Participants created their avatar in Facebook Spaces in the beginning of every session before starting the conversation with the other participant. Bottom: Participants saw a table, their partner’s avatar and a 360-degree panoramic photograph of a park.
During the VR sessions, participants were seated at all times on movable office chairs in separate rooms. Participants had enough room to move around in a space that was approximately 6.5 ft × 6.5 ft (2 m × 2 m). At the first session, participants received a short training on how to use the headset and hand controllers. For consistency, all participants received the standard on-boarding demo training provided by Oculus (First Contact demo). This brief demo teaches the users how to use the hand controllers (e.g., using buttons, grabbing objects, pointing, etc).
After training, participants were given 3 min to create their avatars for the first time. Each participant created their own avatar using the Facebook Spaces avatar options. This process was repeated at the beginning of each session. Each time participants started from the default avatar and customized it (Figure 1. Top image shows the avatar customization menu).
At each session, participants were given the instructions for that session task. They then donned headsets, created their avatar and joined the other participant in VR. Tasks were assigned in a random order. Regardless of the task, participants were asked by the researcher to take the headsets off after 15 min. By keeping the task time at 15 min for all sessions we ensured that all participants got the same amount of VR experience per session. Participants were asked to not participate in any other VR study for the period of 5 weeks that they were involved in this longitudinal project. The duration of 15 min was set after pilot testing. We noticed that after around 25–30 min of working in VR some users experience mild discomfort (e.g., eye strain) and therefore chose the 15 min limit to ensure the comfort of participants.
Participants came to separate rooms each time and did not meet each other prior to their VR interactions. Researchers kept a record of each participant’s previous tasks to ensure that the assigned task for each session was new to both participants.
Time slots were posted for online reservations on a weekly basis. Therefore, each week participants signed up for the upcoming week (their next session). Researchers made sure that no one completed two sessions on the same week to keep the days between two sessions to a minimum of 5 days. In very few cases, students had to skip a week due to their busy academic schedule which resulted in a gap of 10–14 days between two of their sessions. None of the participants who completed all five sessions skipped more than a week.
During the sessions, a researcher observed participants as well as their interactions from the laptop screen and took notes related to the usability of the platform such as the use of the emotion expression feature or any challenges they had in using the other features of Facebook Spaces. The researcher told participants they would remain in the room to answer questions. During the debrief, participants were informed that the researcher had taken notes on their behavior without including any personal identifiers such as names and were given the opportunity to see the notes and withdraw from the study if they wished. Fortunately none of the participants chose to withdraw.
We selected five tasks that allowed for a range of interactions with both partner and environment. Several tasks were considered and tested with research assistants in the lab or during the pilot runs. Tasks that were too short or easy (e.g., photographing a specific object in the virtual space) or too long or difficult (e.g., solving a difficult math equation) were removed. For choosing the final set of tasks we drew on McGrath’s (1984) “circumplex model of group task types”. Drawing on decades of research on group dynamics and task classification, McGrath (1984) have proposed a classification schema that categorizes group tasks into four quadrants: generate, choose, negotiate, and execute. These four task types are mapped on two dimensions: a horizontal dimension of conceptual vs. behavioral and a vertical dimension of conflict vs. cooperation. For example, choose is on the conceptual side and has two subtypes of problem-solving tasks (on the cooperation side of the vertical dimension) and decision-making (on the conflict side of the vertical dimension). Together these four tasks types cover a wide range of activities used in group and team research. This framework has been widely used by researchers who study group dynamic and performance (e.g., De Dreu and Weingart, 2003; Woolley et al., 2010). In choosing the final set of tasks we made sure that the tasks cover a wide range of task types according to McGrath (1984) model. Three of the tasks (Brainstorm, Twenty Questions, Lifeboat) are on the conceptual side of the model and two (Fishing, Draw and Guess) are on the behavioral and execution side of the model. Additionally, we took into account considerations specific to VR studies in defining the tasks and study design. Informed by research in VR (e.g., Dużmańska et al., 2018) we selected tasks shorter than 20 min to avoid discomfort or cybersickness. The five tasks used in the study are described below.
Participants took turns selecting an item from the virtual environment and their partner had 20 questions to guess the selected item. Participants completed as many rounds as they could in 15 min. This task has been used in other studies on teamwork in VR (e.g., Bailenson and Yee, 2006) and could be counted as a problem-solving task in the choose category in McGrath’s task classification model (McGrath, 1984).
Participants were assigned two brainstorming tasks adopted from research on teamwork (Engel et al., 2014). In Task A, pairs were directed to come up with as many uses as possible for a brick. In Task B, they were asked to think of as many words as they could which begin with the letter S and end with the letter N (e.g., “Sun”). Participants could use the virtual pen to record the words and ideas. This task could be counted as an idea generation task in the generate category in McGrath’s task classification model (McGrath, 1984).
Participants were asked to catch as many fish as they could in the Facebook Spaces fishing game. No other instructions were given, however, players were directed to use the in-game 2-min tutorial to learn the game together in the virtual environment. This task could be counted as a physical execution task in the execute category in McGrath’s task classification model (McGrath, 1984).
We adopted a modified version of the original lifeboat task (Hardin, 1974) from previous work on intercultural collaboration (Gao et al., 2017). The task begins with a short story. Nine people are in a sinking yacht that has only one lifeboat which can accommodate five people. Participants read a short description about each person on the yacht. They are then asked to rank the nine people to decide who should be given a place in the lifeboat and therefore saved from drowning. Each participant completed their own ranking on paper before entering VR. They were then asked to try to reach consensus by discussing their rankings. In the VR environment, the list of people on the lifeboat and the information about them was available to them as an easily readable table in the virtual environment. This task could be counted in the negotiate category as a task that deals with “resolving conflicts of viewpoints” in McGrath’s task classification model (McGrath, 1984).
Participants took turns using a virtual pen to draw objects. Their partner then had to guess what object was depicted. Participants were told to complete as many rounds as they could in 15 min. This task can be counted in the execute or choose category since it has both physical (e.g., drawing with pen) and problem-solving aspects. However, we counted this as an execute task since we noticed in the pilot tests that majority of experiment time is devoted to drawing and making the drawing look closer to the elected object and the thinking and guessing time was much shorter in comparison. Additionally, from the pilot tests we realized that compared to the other execute task, fishing, this task was easier.
We took screenshots of participants’ avatars at each session. After each session, participants answered an online Qualtrics survey with Likert scale, ranking, and open response questions. We ran factor analyses and calculated Cronbach’s alpha (shown with α symbol below) which is used for measuring internal consistency (reliability) among different items of the same scale (Bhattacherjee, 2012). The items for each of these variables that loaded together in factor analysis were averaged to obtain an overall score for each facet of the participant’s experience. Additional measures are reported in the Supplementary Materials.
Our first RQ was focused on workload. We adopted the Raw NASA TLX scale (RTLX) (Hart, 2006) for measuring workload which is a very common self-report measure for the workload. The only difference between the RTLX and the original NASA TLX (Hart and Staveland, 1988) is that in RTLX the pair-wize comparisons are removed and items are averaged. In the original TLX, participants are asked to do a pair-wize comparison of factors (e.g., physical demand vs. temporal demand) as well as a rating of each factor. We did not ask participants to do pair-wize comparisons. Our survey asked them to rate their experience regarding the level of mental demand, physical demand, temporal demand, effort, performance (reverse coded), and frustration on a scale from 1 (low) to 7 (high).
Factor analysis showed that the items form a reliable scale
All six items are listed below.
• (Mental demand) How much mental and perceptual activity was required (e.g., thinking, deciding, calculating, remembering, looking, searching, etc.)?
• (Physical demand) How much physical activity was required (e.g., pushing, pulling, turning, controlling, activating, etc.)?
• (Temporal demand) How much time pressure did you feel due to the rate or pace at which the tasks or task elements occurred?
• (Effort) How hard did you have to work (mentally and physically) to accomplish your level of performance?
• (Performance-reverse coded) How successful do you think you were in accomplishing the goals of the task set by the experimenter?
• (Frustration) How insecure, discouraged, irritated, stressed and annoyed vs. secure, gratified, content, relaxed and complacent did you feel during the task?
RQ2b, and RQ2c were focused on emotion recognition. Adopted from UWIST mood checklist (Matthews et al., 1990), 18 emotions were listed in one-word format such as energetic, alert, sad, active, etc. Participants were asked to rate their emotional state, and then their partner’s emotional state on a scale of one to four (definitely, slightly, slightly not, definitely not). This allowed us to determine each participant’s state of mind at each session. It also allowed us to correlate self-ratings of emotional states with partner-ratings of emotional states, to determine the partner’s emotion recognition accuracy, using the self-ratings as a ground truth.
Factor analysis resulted in three components for self emotional ratings and three components for partner emotional ratings. Items in each component made reliable measures and were conceptually relevant. For example, items “satisfied”, “happy”, and “cheerful” were grouped together in one component. For self ratings we called the components self-happy
To examine RQ2a and RQ2c we asked participants to rank four items based on the level of information each item gave them in understanding their partner’s state of mind (from most to least useful). The four items are listed below.
• My partner’s choice of words
• My partner’s tone of voice
• My partner’s movements as seen in virtual reality
• My partner’s facial expressions as seen in virtual reality
RQ3a was focused on the experience of physical presence. We adopted items from Witmer et al. (2005) Presence Questionnaire to measure two aspects of physical presence: adaptation and involvement. For adaptation, the three selected items created a reliable scale
• How proficient in moving and interacting with the virtual environment did you feel at the end of the experience?
• How well could you concentrate on the assigned tasks or required activities rather than on the mechanisms used to perform those tasks or activities?
• How quickly did you adjust to the virtual environment experience?
Similar to adaptation, we adopted four items from involvement dimension of Witmer and colleagues’ (2005) Presence Questionnaire. The four selected items created a reliable scale
• How natural did your interactions with the environment seem?
• How much did the visual aspects of the environment involve you?
• How much did your experiences in the virtual environment seem consistent with your real world experiences?
• How compelling was your sense of moving around inside the virtual environment?
RQ3b was focused on the experience of social presence. We used a 10-item scale to measure the social dimension of presence (social presence). Items were adopted from previous work (Nowak, 2001; Oh et al., 2016) and asked participants to choose a response for each statement on a 7-point scale (from one: strongly disagree to seven: strongly agree). Factor analysis resulted in two components which we called Co-presence and transportation, following (Nowak, 2001) definitions.
For co-presence four items made a reliable a scale
• I remained focused on my partner throughout our interaction.
• My partner remained focused on me throughout our interaction.
• My partner’s emotions were clear to me.
• My emotions were clear to my partner.
The second component of the factor analysis grouped six items together and these six items also made a reliable scale
• I felt like I was in the same room as my partner.
• I felt like I was face to face with my partner.
• I felt like the other participant was present.
• I felt like the other participant was real.
• I felt like I was in the same room with the other participant.
• I felt like the other participant was aware of my presence.
In this section we discuss our findings in the context of the open-ended questions of the survey and the 16 exit interviews we conducted. Each participant was interviewed once, after the last session. All interviews were audio recorded, transcribed verbatim and were coded using a coding approach driven from grounded theory (Glaser et al., 1968).
We did not start analyzing the interviews until after the last interview. The coding was done in phases. In the first phase, the first author of this paper, performed one round of open coding on three interviews. The researcher then merged the codes with similar meanings and continued the process by coding more interviews, adding new codes when necessary and merging codes with similar meanings. Before completing the analysis, another researcher blind to the research questions of the study participated in several meetings. During these meetings, the second researcher went over the interview transcripts (without access to any predefined codes) and discussed the codes she would assign to each data point and discrepancies were discussed in depth. Finally, the first author completed the analysis and created themes based on codes that were related together.
We categorized the themes into four categories: 1) Increased comfort over time, 2) Emotional expression in VR, 3) Experience of presence in VR, and 4) Avatar customization and appearance.
Aligning with our finding of adaptation scores increasing over time, all of the participants mentioned that they got more comfortable with using the controllers and with being in the virtual space over the course of five sessions.
P1: “I think that through the multiple sessions, I was able to use the tools better and felt more comfortable in VR and like learning the hand controls because of practice … I definitely got much more comfortable with how to use the technology as I came in each time.”
P2: “I feel like, the more times I did it, the more I adjusted to the virtual reality space more quickly.”
Several participants mentioned that as they got more experienced with using controllers and with being in the VR space, they were able to focus on tasks more and accomplish task goals better and easier. One way to explain this finding is drawing on Wicken’s multiple resource theory (Wickens, 2008). In VR space and when participants use hand controllers to interact with objects, they need to multitask and manage hand movements, head movement, and the conversation. Adapting to VR and gaining mastery of the hand controllers could reduce workload and allow users to attend to other aspects of their experience such as the task or their conversational partner.
P5: “I found using it much easier, I could actually use both hands. I had to think on individual fingers in the beginning and I was concentrating on the mechanics but today, I wasn’t concentrating on the mechanics as much as concentrating on the task.”
P10: “Over time, I could do more things in it. I was more comfortable moving my arms and controllers, like, where I could move and what I could do. So I felt more comfortable being in that space and I felt like I was able to connect to the other person more.”
As users present themselves using embodied avatars when they use VR, expression and interpretation of non-verbal cues are limited compared to face to face or CMC tools such as video conferencing. Our focus in this study was on emotional expression. All participants mentioned that they relied on tone of voice to interpret their partners’ emotion and mood. This is consistent with Moustafa and Steed’s longitudinal social VR study (Moustafa and Steed, 2018) in which they found that people rely on voice to convey emotions. Paying attention to word choice was also mentioned by several participants as their strategy in recognizing others’ emotions.
P8: “the tone of voice was pretty much the only thing you could really use to differentiate emotions and stuff and what like people were trying to convey because I tried using, the facial expressions, and I didn’t really end up using any of them.”
When we asked them how they expressed emotion, participants mentioned that they tried to shows the screenshots from the session how they feel and their engagement using both word choice and tone of voice. Overall, this is aligned with research on CMC that indicates adaptive approach to CMC use. In other words, people rely on available cues and channels (e.g., voice) when the CMC tool they use lacks a certain affordance (Walther, 1996; Walther et al., 2010). In case of VR, it seems like people also use tone of voice in the lack of facial expressions.
P5: “your enthusiasm for the task is shown by the pitch and the tones and all that, and both of us were enthusiastic and we showed it and I think because of that we performed better. I think the tone of voice is critical because your partner wouldn’t really be interested, if you are just sounding dull.”
Related to this, we asked participants about the emotion feature available in Facebook Spaces. This feature allowed users to choose a preset facial expression for their avatar (e.g., laughter) by pressing certain keys on the hand controllers. Although they were introduced to this feature at the beginning of each session, we noticed that very few people used it in the experiment sessions. In the interviews, three participants said they forgot to use it once they engaged with the task. Other participants pointed out the usability issues and the unintuitive process of using this feature.
P12: “I feel like because facial expressions are more of something that kind of happens in the moment and with VR it’s something that you have to consciously think about and like do the movement on the hand things (controllers) in order to do the facial expression.”
P9: “I think because facial expressions are just very intrinsic. And you don’t ever think to yourself, oh, I should make my face look like this in real life … You just do it. So because you don’t ever have to think of how to make your facial expressions look a certain way, then you don’t think like, “Hey, I’m feeling this way. So I should make my face look this way so I’ll press this button.”
While we did not track the exact number of times each participant used the facial expression feature, our observation notes show that this feature was rarely used. Among the several available options such as expression of laughter, frown face, etc. only the laughter option was used by a small number of participants.
Some of our participants mentioned other strategies to overcome the limited nonverbal cues available in VR and address challenges discussed in previous work (e.g., Bowers et al., 1996; Moustafa and Steed, 2018) such as turn-taking and managing the flow of conversation. One of the interviewees told us about filling out long pauses with ums and uhs. These are considered as signals of short (uh) or long (um) upcoming delays (Tree, 2001) and in this case were used to fill moments of silence or pause.
P8: “in real life, if there is silence you can tell that people are thinking. But in VR, if you’re thinking there’s not really any way to convey that. So you’re just kind of sitting in silence. For example for the brainstorm, I was thinking but I felt like this is kind of weird that we’re just sitting in silence. So I would like pretend, like make verbal thinking noises like um, uh.”
Some of the participants pointed out that as they got more comfortable with VR and the virtual environment, they felt more present in the virtual environment (physical presence). In other words, the more people get comfortable with the controllers and the virtual space, the more they feel a sense of “non-mediation” (e.g., reduced attention to hand controllers and equipment), and this could contribute to a higher overall sense of presence (Lombard and Ditton, 1997).
P16: “I think during the first few time where you’re still not sure what’s going on it feels like, ‘Oh, you’re in simulation. Like it’s not real.’ But as you get more used to it, you feel like, you’re part of the environment. And you don’t really feel like you’re in a situation where you feel like you’re in a different room … After I got the hang of it, Whenever I would put it on, I kind of forgot that I was actually in this (experiment) room. I was actually at that table with the person. So definitely I felt a lot more into the environment.”
P2: “You grow used to it very quickly, where you adjust to the virtual environment, it feels a lot more natural, like, the more that you do it. The first couple times it still feels like your avatar is your body, that sort of thing. But you’re thinking ‘oh, wow, this is very immersive, I feel this way’. Whereas now, it’s immersive, to the point where I don’t even think about it. I’m not consciously aware of the fact that it is immersive, it just feels a lot more natural.”
There were also two participants who mentioned that they did not experience changes in their sense of presence. However, they also mentioned adaptation.
P3: “I feel like it didn’t really change that much. I think I got more comfortable maneuvering around like, the VR space. And sometimes I would discover things that I thought were really cool. So it was more like discovering things, I guess. But I think my attitude toward it didn’t change that much. I feel like I always thought it was pretty immersive.”
Related to RQ4, during the interviews, we asked participants how they decided on characteristics of their avatar. Aligned with previous work (e.g., Moustafa and Steed, 2018) most participants told us that they tried to create their avatar to look similar to their appearance in real life.
Figure 2 shows the screenshots from the session. Overall, participants created self-consistent avatars. In our study, only a few participants used features very different than their face and body features. However, we found that for a small number of participants the importance of avatar appearance was beyond resemblance or experimenting with available options. Considerations such as self-presentation and impression management, ethnic background, and preferred gender identity were mentioned as important factors in choosing avatar characteristics.
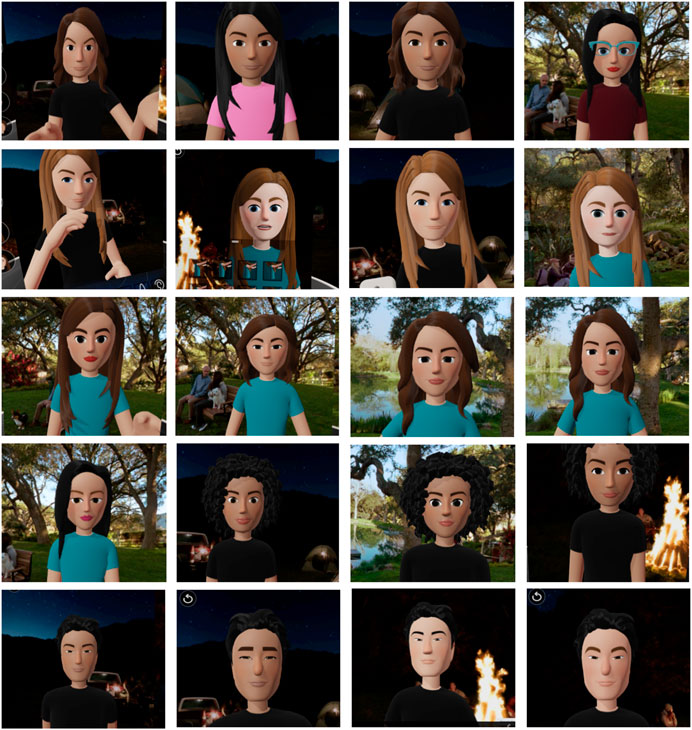
FIGURE 2. Participants created their avatars before joining the shared environment every session. Each row shows screenshots of one participant’s avatar over time.
P2: “I’m trans and so whenever I make an avatar, I don’t think it looks particularly like me. But it’s more like what I want to look like and that can actually be very relieving to be able to live in that kind of body. I imagine that to other people, it looks a bit jarring, because they’ll see kind of like a male looking avatar and, like here, my somewhat high pitched voice coming out of it.”
P12, survey response: “I was worried about my avatar looking sad, tired, or unapproachable. When discussing an issue so heavy I wanted to look approachable and friendly (response after lifeboat task)”
Finally, two participants mentioned that interacting via avatar instead of face-to-face was a helpful aspect of working with people in VR. This is aligned with previous work that has shown that shy people feel less anxious in VR compared to face to face communication (Hammick and Lee, 2014). Considering this perceived benefit of being “hidden” by the avatar for some users, we can argue that some users might prefer lack of full resemblance of the avatar to themselves.
P4: “there was also a sense of, like, I was hidden behind the system. So like, in the beginning, I felt kind of weird that I was like, a bad drawer … But I just felt kind of better knowing like, we’re not in the same room. I know, like, in the back of my mind, that I’m alone here … Because you are hidden in a sense, behind the virtual avatar.”
We ran a linear mixed effects regression model for each dependent variable. Such models have advantages over repeated measure ANOVAs, such as handling missing values (e.g., for participants who did not finish all five sessions, see Krueger and Tian (2004) for details). In each model we included time and task as fixed effects (independent variables) and participant ID as a random effect. Before choosing this model we tested other possible models with partner ID and also with partner ID and dyad ID as random effects included in the model. We used Akaike information criterion (AIC) test (Akaike, 1998) which is a very common approach in comparing alternative models for finding the one that fit data better and choose the model mentioned above as our model for analysis. For statistically significant main effects, pairwise comparisons were conducted on estimated marginal means with Tukey correction which also does p-value corrections for multiple comparisons. It should be noted that Means (M) and Standard Error (SE) reported in this section are based on raw means not estimated means.
Effect sizes are used for calculating the magnitude of the effect of an independent variable on the outcome variable. Reporting effect sizes and their confidence intervals (CIs) for empirical studies and avoiding the interpretation of results solely based on statistical significance (p-values) is highly recommended (Pek and Flora, 2018). Unfortunately, there is no universally agreed upon method for calculating effect sizes in multilevel and generalized linear mixed models (Jaeger et al., 2017; Rights and Sterba, 2019). In our analysis, we have reported the marginal
All analysis was conducted in R. We used lmer (from package lme4) for mixed model, and r. squaredGLMM (from package MuMIn) for calculating marginal R-squared (
We found a main effect of task on reported workload,
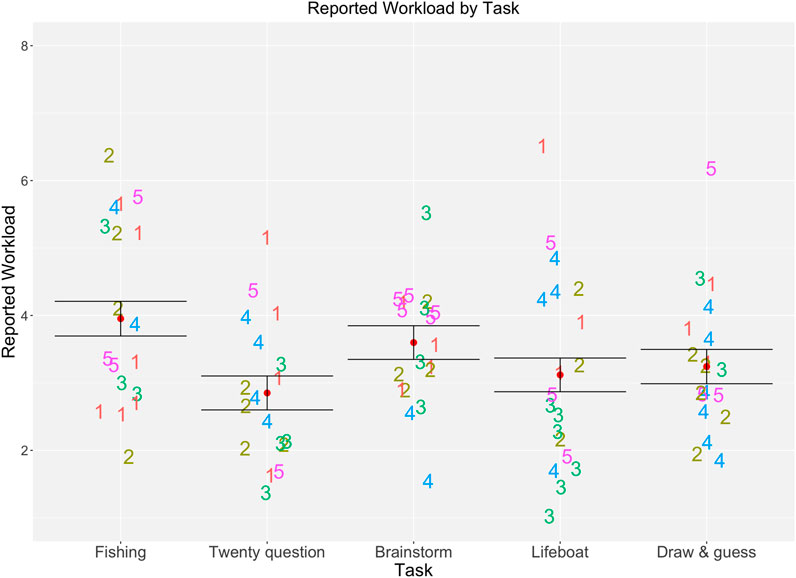
FIGURE 3. Workload reported by participants for all sessions (1: low to 7:high). Red dots represent mean and black bars show standard error of the mean (SE). Numbers on the plot shows session number and the position of number is associated with the reported workload.
Ratings of self-reported happiness did not differ over time
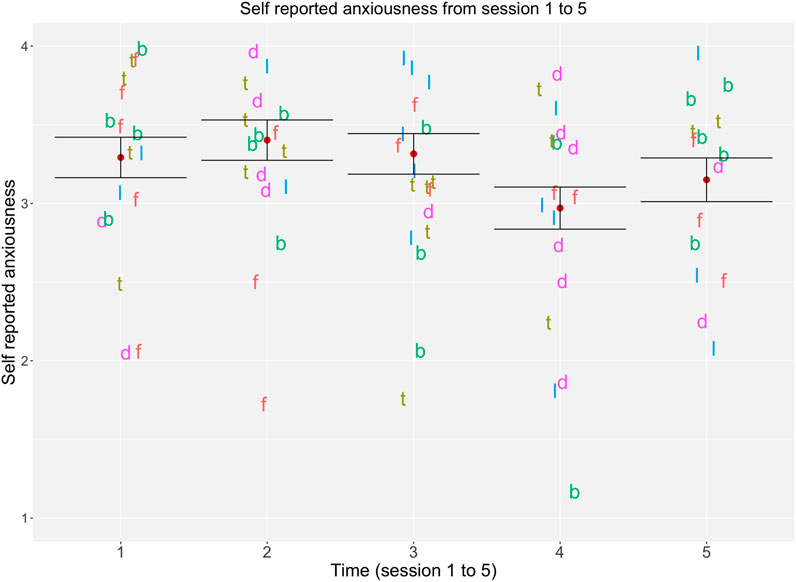
FIGURE 4. Anxiousness reported by participants for each session (1: Definitely, 2: Slightly, 3: Slightly not, 4: Definitely not). Letters shows task names (f: fishing, t: twenty questions, b: brainstorm, l: lifeboat, d: draw and guess). Red dots represent mean and black bars show standard error of the mean. For this plot items were reverse coded to make interpretation easier.
There were no statistically significant changes in ratings of self-energy over time

FIGURE 5. Energy score reported by participants for all sessions (1: Definitely, 2: Slightly, 3: Slightly not, 4: Definitely not). Red dots represent mean and black bars show standard error of the mean (SE). Numbers on the plot shows session number and the position of number shows participant’s reported rating of energy level.
We next examined whether participants’ emotional states would affect their partners’ ability to make accurate estimates. We found that participants’ self reported happiness correlated positively with emotion recognition accuracy across all five time points
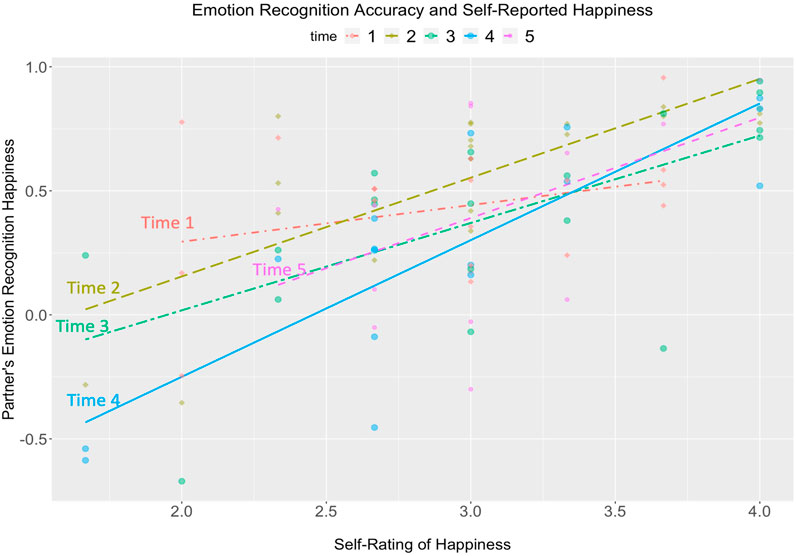
FIGURE 6. Accuracy of emotion recognition positively correlated with self-reported happiness. For this plot, items were reverse-coded to make it easier to interpret (1: Definitely not to 4: Definitely). Y axis show correlation rates.

FIGURE 7. Accuracy of emotion recognition positively correlated with self-reported energy. For this plot, items were reverse-coded to make it easier to interpret (1: Definitely not to 4: Definitely). Y axis shows correlation rates.
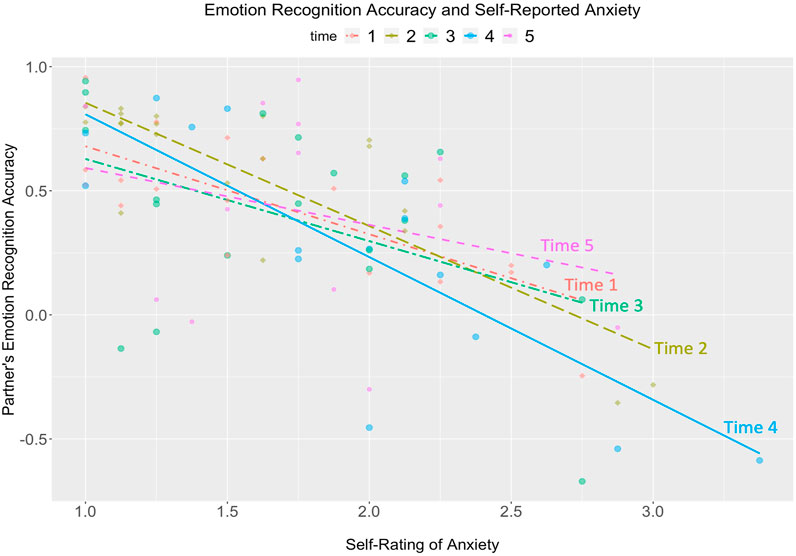
FIGURE 8. Accuracy of emotion recognition negatively correlated with self-reported anxiety. For this plot, items were reverse-coded to make it easier to interpret (1: Definitely not to 4: Definitely). Y axis show correlation rates.
Since for each participant and each session we had a rating of self emotion and a rating of partner emotion, we also analyzed whether participants’ ratings of each others’ emotions became more accurate over time or depending on the task. We correlated participants’ ratings of their partner with their partner’s self-ratings. On average, participants’ accuracy at recognizing their partners’ emotional states was significantly above the zero correlation expected by chance. However, emotion recognition accuracy did not change over time, or by task (all p-values
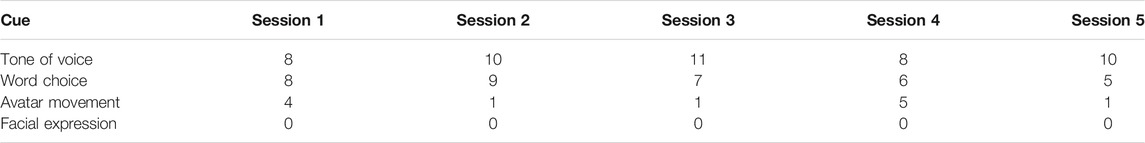
TABLE 1. Number of participants who chose each of the cues as the most important in inferring their partner emotion (See Supplementary Materials for all rankings).
RQ2c asks whether the order in which users rank the available cues (word choice, tone of voice, gestures, facial expression features) predict the accuracy of emotion recognition of their partner. In our analysis, we did not find any significant relationship between the order in which participants ranked cues, or their first-choice cues, and the emotional recognition accuracy (all p-values
Taking task into account, we found a significant effect of time on adaptation,
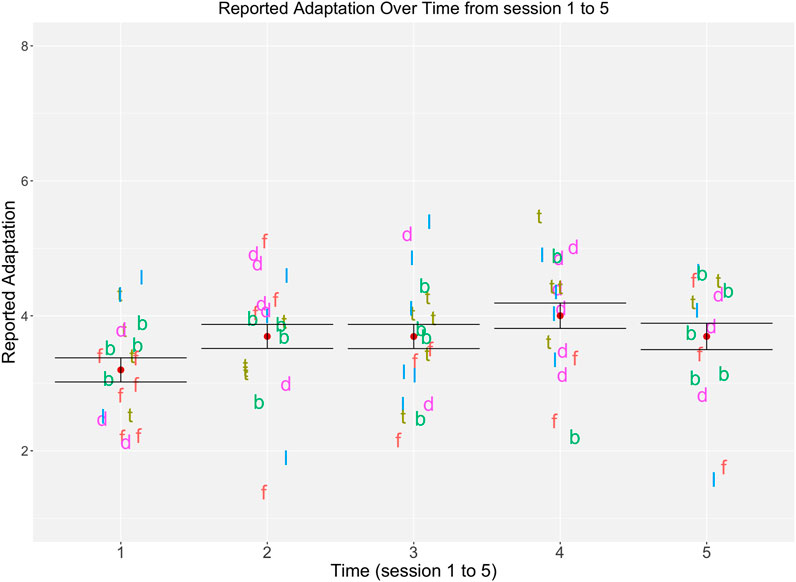
FIGURE 9. Adaptation reported by participants for each session (1: not at all to 5: very much). Letters shows task names (f: fishing, t: twenty questions, b: brainstorm, l: lifeboat, d: draw and guess). Dots represent mean and black bars show standard error of the mean.
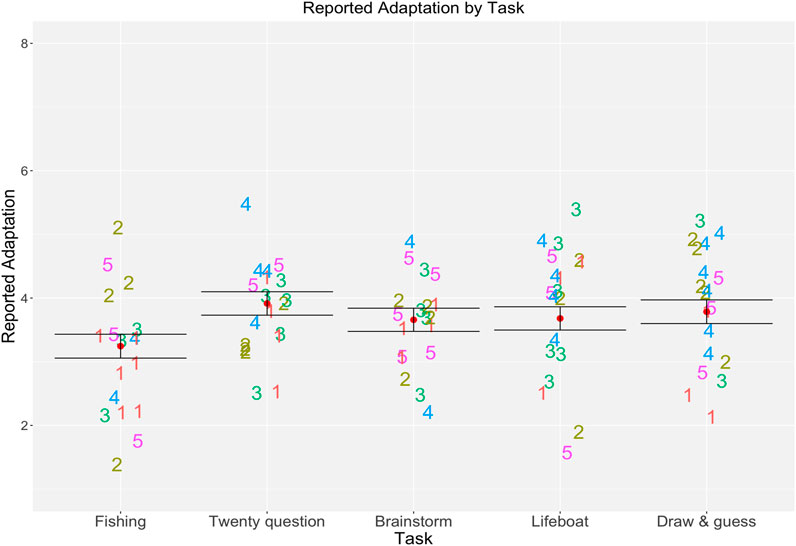
FIGURE 10. Adaptation reported by participants for each task for all sessions. Red dots represent mean and black bars show standard error of the mean (SE). Numbers on the plot shows session the number and the position of the number is associated with the reported workload.
We found no effect of time or task on the involvement subcategory of physical presence (all p-values
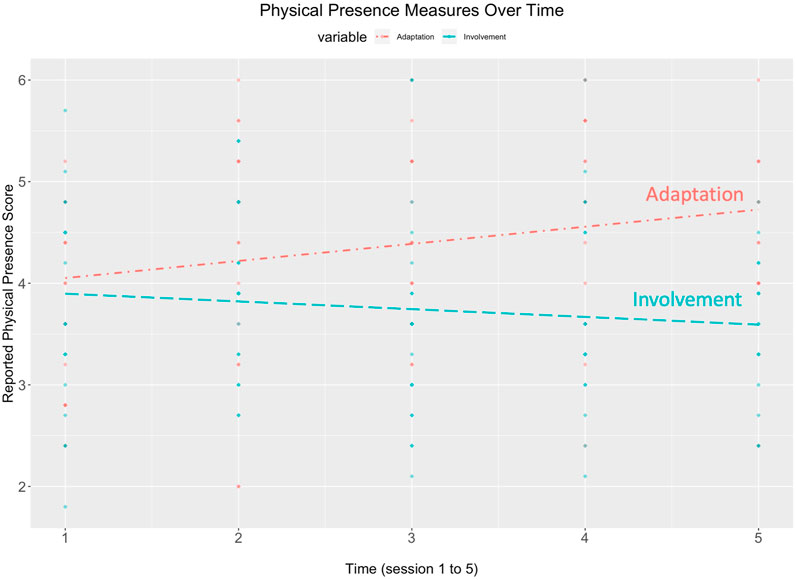
FIGURE 11. Ratings of physical presence-Adaptation and Involvement over time.
We found no significant differences in the average measure of self-reported co-presence over time
We found no effect of time or task on the transportation subcategory of social presence (all p-values
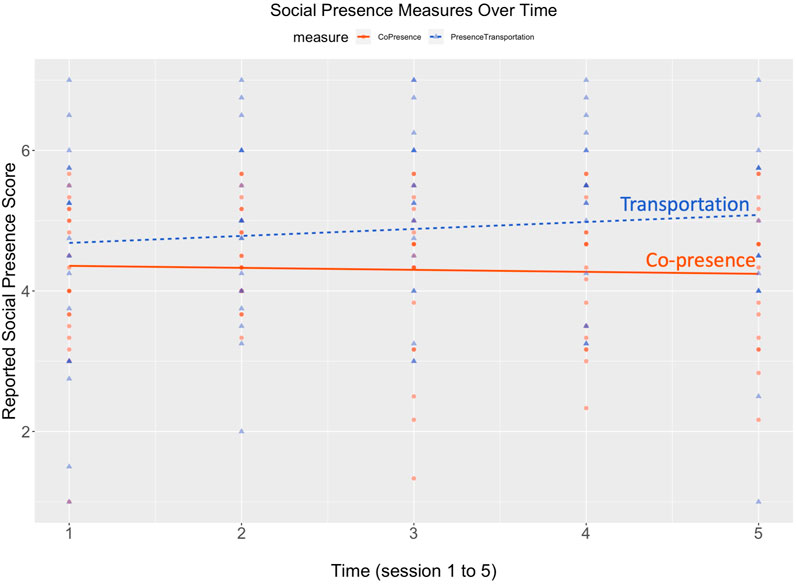
FIGURE 12. Ratings of social presence Co-presence and Transportation over time.
In this study, we recruited 20 participants who collaborated with teammates in VR. We were able to collect data from 15 people throughout five sessions, two through four sessions, and two through three sessions. Consistent with previous work, we did not find significant changes in individuals’ physical presence or social presence (co-presence and transportation) ratings over time. However, we did find significant differences in social presence (co-presence dimension) by task. Both quantitative and qualitative responses indicated that participants were able to individually adapt to collaborating in virtual reality over time. While we did not see changes in workload over time, we did see differences between tasks, again, consistent with previous work (e.g., Luong et al., 2020). We found that the correlation between participants’ ratings of their partner’s emotional states and partner’s self-reported emotion ratings were significantly higher than chance, and that emotional accuracy ratings correlated positively with self-ratings of energy and happiness level. However, emotional accuracy (partners’ ability to accurately rate emotional states) correlated negatively with self-ratings of anxiety. Below, we discuss the details of our findings, design implications, limitations of our study and plans for next steps.
During the exit interviews all participants mentioned that they got more comfortable with VR over time as they practiced working with the equipment more. Some said that they got better at doing tasks over time as well. We had two measures related to adaptation: the NASA TLX workload (Hart and Staveland, 1988; Hart, 2006) and the adaptation dimension of physical presence (Witmer et al., 2005). Participants’ self-reported workload did not show any statistically significant reduction over time. It is possible that participants’ rating of workload was affected more by the difficulty of the task than their competence. For example, participants in session four or five were probably competent with VR, however, a difficult task still resulted in rating the experienced workload as high.
We found a significant difference in workload between the fishing and twenty questions task, such that participants reported the fishing task as being significantly more difficult than the twenty questions task. Based on our observation notes, we believe that the fishing task was more difficult due to the high use of hand controllers. We noted that some participants found it challenging to use hand controllers and the combinations of buttons in order to adjust the virtual fishing wand at the right angle. The twenty questions task, perceived as easier, did not required participants to use their hands for anything beyond simple movements such as pointing.
We were interested in understanding which cues participants relied on to recognize others’ emotions (RQ2a, RQ2b). Survey and interview data showed that users mostly rely on voice for interpreting the emotional state of their partner. In response to the ranking question, tone of voice as the first rank and word choice as the second rank were the top two choices for all tasks and remained top choices over all five sessions. This aligns with research on emotion recognition in VR (e.g., Moustafa and Steed, 2018; Sun et al., 2019) that highlights the importance of voice in determining emotions of others. Regarding RQ2c, we did not find a significant relationship between cues participants reported prioritizing and participants’ accuracy in recognizing their partner’s emotions.
Additionally, we found that Facebook Spaces emotion feature was rarely used and was never selected as one of the top two cues in the participants’ rankings. Based on the interview data it seems that the manual selection of emotion on the avatar was perceived as unnatural and in some cases burdensome according to the participants. The Oculus headset used in this study does not support face tracking. However, some new HMDs such as HP Omnicept support facial tracking with integrated cameras2. With facial tracking, users’ facial expressions can be automatically tracked and presented on their avatar.
One of the interesting findings of this study is about emotion recognition. Our quantitative analysis showed that participant’s emotional accuracy ratings correlated positively with self-ratings of energy and happiness level. However, emotional accuracy (partners’ ability to accurately rate emotional states) correlated negatively with self-ratings of anxiety. For decades, researchers have studied vocal communication of emotion and emotion recognition in human interactions (see Scherer, 2003 for a review). Research has shown that emotions such as sadness and anger could be recognized based on one’s voice, however, emotions such as joy are most accurately recognized from the facial expressions (Scherer, 2003). In VR people cannot see each others’ faces and facial expressions and therefore one would expect that people would be less accurate in recognizing emotions that are best recognized based on facial expressions (e.g., joy and happiness). However, we saw that participants were better at recognizing emotions when their partners were happier or more energetic, and worse when they were anxious. This raises the intriguing possibility that when users feel anxious in VR, they move less, providing fewer clues to their emotional state. This implies that movement still provides an important information channel, even when users prioritize audio cues. We should note that this is a speculation and more research is needed to better understand emotion recognition accuracy in VR as our work shows important nuances in this topic.
We found significant changes in the adaptation dimension of physical presence scores. Participants rated their sense of adaptation higher in session four compared to session one. This is consistent with our qualitative findings. During the interviews participants mentioned that as they got more experience with VR over time (session by session) they got more comfortable and competent with it.
Our social presence measures (co-presence and transportation) did not show significant changes over time. However, some participants mentioned during the interviews that they were able to connect to their partner better after learning how to work with VR equipment. Related to this, in their longitudinal study, Bailenson and Yee (Bailenson and Yee, 2006) found that over time team cohesion increases. With the same group of people working together over time, the cohesion observed in Bailenson and Yee’s study could be attributed to increase in team experience, VR experience or both. In our study, pairs did not have any history together, so it seems that experience in VR might be a factor in how users feel about social interactions and those they talk to in VR. More studies are needed on whether and how users’ experience of social presence increases or decreases with repeated individual exposure to VR.
Among the five tasks, participants’ self-reported sense of social presence (co-presence dimension) was lowest for the fishing task which was rated as the most difficult task. Reported co-presence was highest for the draw and guess task. Both of these tasks were execution tasks on Mcgrath’s (1984) task type framework and both required use of controllers throughout the session. However, fishing was mostly an individual task with focus on successful execution (catching virtual fish) meaning that participants were not required to work together to complete it. On the other hand, draw and guess was a social and interactive task with creative elements and participants needed to interact throughout the session. In the interviews, draw and guess was mentioned as their favorite task by most of the participants. We believe that the social aspect of draw and guess contributed to users’ ratings of social presence or sense of being together. In summary, aligned with previous work on teamwork in VR (Steed et al., 2003), our study shows that social tasks are more appropriate for CVEs than tasks that are less social. It seems that the social interaction aspect of these tasks increases the social presence (co-presence) experienced by users.
In research question 4 (RQ4) we investigated avatar customization. We were interested in whether participants’ preferences regarding characteristics of their avatar appearance changes over time as they got more experience in VR. Overall, our participants created self-consistent avatars and their avatars remained similar to the ones created in their previous sessions. Characteristics related to racial background and gender identity were very important for the participants and these were included in the avatar customization from the first session. Another interesting point raised by participants’ comments is that designing avatars with a transparent rendering of emotions might not be the ideal solution in all cases. In our study, two participants mentioned that they felt as if they were hiding behind the avatar and this helped them feel less anxious during the interaction. Other researchers have found that people might “emote more freely when their avatar does not express those emotions” (Bailenson et al., 2006). Therefore, in some cases users might benefit from the lack of connection between their facial expressions and the expressions on the avatars that are visible to others.
Since our study captures a snapshot of naive users adapting to social VR over time, it offers some interesting design implications for designers as well as researchers in social VR, described below.
We observed that participants rarely used the emotion expression feature provided by the platform. During the interviews they told us that they had concerns about accidentally using the wrong facial expression on their avatar and it seemed unnatural to them to use hand controllers for showing emotions on the avatar. Real-time tracking of face movements and facial expressions (e.g., Hickson et al., 2019; Wei et al., 2019) and rendering them on user avatar is a promising solution. However, implementation of reliable face-tracking systems is complicated and not yet common among commercial VR platforms. In a review of ten commercial social VR platforms such as Facebook Spaces, Rec Room, and High Fidelity, researchers (Tanenbaum et al., 2020) found that most of these platforms rely on preset expressions or puppeteered expressions and only one platform, Sansar, changes avatar facial expressions based on user’s voice. Our work shows that users heavily rely on tone of voice in recognizing others’ emotions. Considering this, we argue that users will benefit from designs that leverage voice in emotion communication such as voice modulation approaches in VR (Sonalkar et al., 2020). Therefore, in automated emotion expression solutions, allowing users to turn this feature off would be important.
Our second point relates to hardware design. We noticed that the strap of the headset was not well-suited for some hairstyles. In addition, depending on the face-shape sometimes it was difficult for our participants to adjust the headset on their face properly, leaving a large gap. This challenge is not unique to our study. Mboya (2020) reported a similar issue in her thesis work working with Black women from Kenya. She describes that her participants had difficulty wearing the headset on and almost half of the times a headset strap would snap off when a participant was trying it on. To address these challenges, we suggest that headsets must be designed in a way that accommodate people of diverse cultural and ethnic backgrounds. Additional design solutions related to hard-ware design should also be considered. For example, the required use of two hand-controllers for people with limited mobility could be challenging (Mott et al., 2020).
In addition, based on our findings related to user’s interest in avatar customization we suggest that designers of social VR platforms continue to provide avatar characteristics that could be representative of one’s racial background and gender identity.
Finally, we propose two takeaways related to the design of social VR studies and data collection in lab experiments. First, this study demonstrates that different types of tasks can have different effects on self-reported physical presence as well as social presence. This finding has implications for researchers of social VR and emphasizes the importance of considering task difficulty as a potential factor that could affect participants’ responses to questions around physical and social presence. Secondly, in common with other work in VR (e.g., Bailenson and Yee, 2006), our study supports the idea that naive participants require a period of adjustment to get comfortable with the environment and controllers and more advanced features such as a writing with virtual pen. Researchers should consider how to provide participants in lab studies adequate time to adjust prior to the experiment segment of the lab session, especially if they are first time users.
In this section we discuss the limitations of our work and propose future directions for researchers in the field. One of the main limitations of this study is the small sample size, due to the need to complete the study within one semester. Therefore, our quantitative findings may be under-powered and we recommend that researchers who are interested in this topic to study collaboration in VR with a larger number of participants. While we found statistical support for only some dimensions of presence (physical presence adaptation) changing over time, trends in our data as well as participants’ self-reported responses imply that slight changes in presence (both physical and social) might be measurable with a larger sample size. It is particularly notable that social presence measures tended to slightly increase over time (Figure 12). This was the case even though participants were interacting with a different participant each time, so this tenuous increase cannot be attributed to team building or greater familiarity with one’s partner. This result deserves further investigation. We have made our anonymized dataset and R code available on OSF we and hope that future researchers might find it useful in planning future work.
Our second limitation was our population of convenience. All participants of this study were undergraduate students and were in the age range of 18–23 years old. Even though participants did not have any experience with Facebook Spaces, this age group is generally characterized by high usage of technology (Jiang and Vogels, 2019). Therefore, results might be different for novice VR users of other age groups such as older adults (e.g., Miller et al., 2014) or children (e.g., Maloney et al., 2020). Additionally, in our study participants worked in teams of two. It would be worthwhile for other researchers in the field to study collaboration in teams with more than two members in VR.
Thirdly, the tasks in our study were simple, short and emotionally neutral. Future work should look at people’s strategies in expressing emotions during tasks and activities that involve a more intense emotional experience (e.g., Chirico et al., 2018). From an ethics point of view, inducing negative emotions in the laboratory setting raises ethical concerns, making this a question perhaps best answered by studying collaboration of real teams over time. For scheduling limitations and out of precaution in avoiding potential motion sickness (Dużmańska et al., 2018), we kept the task time under 20 min. In pretesting, we tested the tasks to ensure that the level of difficulty is similar. With the pilot participants that we did pretest, we did not find significant differences in the difficulty of the tasks; however, when we ran the full study, we did find this difference. Future work should look into the potential effect of task duration and VR experience on users’ collaboration and communication in VR using tasks that are at the same level of difficulty and possibly longer than 20 min.
Finally, we relied on self-report measures. Use of multiple measurement approaches such as eye tracking (e.g., Steptoe et al., 2008; Stoptoe et al., 2010) and physiological measures would potentially provide more information to the researchers. We also did not collect performance measures due to the difference in type of tasks. Future studies with larger number of participants that incorporate behavioral (e.g., body movement tracking, Sun et al., 2019) and physiological data collection methods, could provide more insights on behavioral and perceptual changes over time. Additionally, we recommend use of other data analysis methods such as conversational analysis which could lead to useful insights on how people work together in VR.
Despite the importance of collecting longitudinal data, recruiting large numbers of participants for longitudinal studies is likely to remain time-consuming and expensive. We look forward to the continued development of alternative methods of recruitment and data collection. For example, in their crowdsourcing approach Ma et al. (2018) recruit eligible participants who already have a VR headset. Cross-lab collaborations using shared collaborative virtual environments can also expand possibilities for data collection, by allowing to help fill the need for more studies exploring experiences in virtual environments over time (Steed et al., 2020). These efforts are likely to gain importance as the motivations to improve virtual collaborations multiply. We hope that this study of how inexperienced participants learned to use an early social VR platform helps to build a foundation for this future work.
The datasets presented in this study can be found in online repositories. The names of the repository/repositories and accession number(s) can be found in the article/Supplementary Material Anonymized data and R code is available via an online OSF link. (https://osf.io/sb8kj/).
The studies involving human participants were reviewed and approved by the Cornell University Institutional Review Board for Human Participant Research (IRB) Office. The patients/participants provided their written informed consent to participate in this study.
ASW: faculty advisor NK: Ph.D. candidate.
The authors declare that the research was conducted in the absence of any commercial or financial relationships that could be construed as a potential conflict of interest.
We would like to thank Stephen Parry (Cornell Statistical Consulting Unit for his support with the statistical analysis of the data, Susan R. Fussell for her feedback on the earlier drafts of this paper, and Leslie Park and Katherine Miller for their support during the data collection phase. We also thank Jacob Grippin and Florio Arguillas of the Cornell Institute for Social and Economic Research (CISER) for their support as we prepared the code and data for public access on OSF. We appreciate the Cornell Open Access Publication Fund for the financial support that covered the publication expenses of this paper. Finally, we thank our participants, the reviewers and the editor of our work, and others who helped us in this project.
The Supplementary Material for this article can be found online at: https://www.frontiersin.org/articles/10.3389/frvir.2021.643331/full#supplementary-material
2https://www8.hp.com/us/en/vr/reverb-g2-vr-headset-omnicept-edition.html
Akaike, H. (1998). “Information Theory and an Extension of the Maximum Likelihood Principle,” in Selected Papers of Hirotugu Akaike. Editors E. Parzen, K. Tanabe, and G. Kitagawa (New York, NY: Springer), 199–213. doi:10.1007/978-1-4612-1694-0_15
Andrist, S., Gleicher, M., and Mutlu, B. (2017). “Bidirectional Gaze Mechanisms for Collaborative Interaction with Virtual Characters,” in Proceedings of the 2017 CHI Conference on Human Factors in Computing Systems, New York, NY, May 6, 2017 (ACM), Vol. 17, 2571–2582. doi:10.1145/3025453.3026033
Axelsson, A., Abelin, Å., Heldal, I., Nilsson, A., Schroeder, R., and Wideström, J. (1999). “Collaboration and Communication in Multi-User Virtual Environments: A Comparison of Desktop and Immersive Virtual Reality Systems for Molecular Visualization,” in The Sixth UKVRSIG Conference, Salford University, September 1, 1999. 107–117.
Bailenson, J. N., Blascovich, J., Beall, A. C., and Loomis, J. M. (2001). Equilibrium Theory Revisited: Mutual Gaze and Personal Space in Virtual Environments. Presence: Teleop. Virt. Environ. 10, 583–598. doi:10.1162/105474601753272844
Bailenson, J. N., and Yee, N. (2006). A Longitudinal Study of Task Performance, Head Movements, Subjective Report, Simulator Sickness, and Transformed Social Interaction in Collaborative Virtual Environments. Presence: Teleop. Virt. Environ. 15, 699–716. doi:10.1162/pres.15.6.699
Bailenson, J. N., Yee, N., Blascovich, J., Beall, A. C., Lundblad, N., and Jin, M. (2008). The Use of Immersive Virtual Reality in the Learning Sciences: Digital Transformations of Teachers, Students, and Social Context. J. Learn. Sci. 17, 102–141. doi:10.1080/10508400701793141
Bailenson, J. N., Yee, N., Merget, D., and Schroeder, R. (2006). The Effect of Behavioral Realism and Form Realism of Real-Time Avatar Faces on Verbal Disclosure, Nonverbal Disclosure, Emotion Recognition, and Copresence in Dyadic Interaction. Presence: Teleop. Virtl. Environ. 15, 359–372. doi:10.1162/pres.15.4.359
Basdogan, C., Ho, C. H., Srinivasan, M. A., and Slater, M. (2000). An Experimental Study on the Role of Touch in Shared Virtual Environments. ACM Trans. Comput.-Hum. Interact. 7, 443–460. doi:10.1145/365058.365082
Bhattacherjee, A. (2012). Social Science Research: Principles, Methods, and Practices. Athens, GA: Global Text Project.
Biocca, F., Harms, C., and Burgoon, J. K. (2003). Toward a More Robust Theory and Measure of Social Presence: Review and Suggested Criteria. Presence: Teleop. Virt. Environ. 12, 456–480. doi:10.1162/105474603322761270
Bleakley, A. E. (2020). “Towards an Interaction Design Framework for Conversation Roles in VR,” In Mensch und Computer 2020-Workshopband. Editors C. Hansen, A. Nürnberger, and B. Preim, (Bonn, Germany: Gesellschaft für Informatik e.V).
Bosch-Sijtsema, P. M., and Sivunen, A. (2013). Professional Virtual Worlds Supporting Computer-Mediated Communication, Collaboration, and Learning in Geographically Distributed Contexts. IEEE Trans. Profess. Commun. 56, 160–175. doi:10.1109/TPC.2012.2237256
Bowers, J., Pycock, J., and O’brien, J. (1996). “Talk and Embodiment in Collaborative Virtual Environments,” in Proceedings of the SIGCHI Conference on Human Factors in Computing Systems, New York, NY, April, 1996. 58–65.
Chirico, A., Ferrise, F., Cordella, L., and Gaggioli, A. (2018). Designing Awe in Virtual Reality: An Experimental Study. Front. Psychol. 8, 2351. doi:10.3389/fpsyg.2017.02351
Courage, C., Jain, J., and Rosenbaum, S. (2009). “Best Practices in Longitudinal Research,” in CHI’09 Extended Abstracts on Human Factors in Computing Systems, Boston, MA, April, 2009. 4791–4794.
Cummings, J. J., and Bailenson, J. N. (2016). How Immersive Is Enough? a Meta-Analysis of the Effect of Immersive Technology on User Presence. Media Psychol. 19, 272–309. doi:10.1080/15213269.2015.1015740
De Dreu, C. K. W., and Weingart, L. R. (2003). Task versus Relationship Conflict, Team Performance, and Team Member Satisfaction: A Meta-Analysis. J. Appl. Psychol. 88, 741–749. doi:10.1037/0021-9010.88.4.741
Dresner, E., and Herring, S. C. (2010). Functions of the Nonverbal in Cmc: Emoticons and Illocutionary Force. Commun. Theor. 20, 249–268. doi:10.1111/j.1468-2885.2010.01362.x
Dużmańska, N., Strojny, P., and Strojny, A. (2018). Can Simulator Sickness Be Avoided? a Review on Temporal Aspects of Simulator Sickness. Front. Psychol. 9, 2132. doi:10.3389/fpsyg.2018.02132
Ducheneaut, N., Wen, M.-H., Yee, N., and Wadley, G. (2009). “Body and Mind: a Study of Avatar Personalization in Three Virtual Worlds,” in Proceedings of the SIGCHI conference on human factors in computing systems, Boston, MA, April, 2009. . 1151–1160.
Endsley, M. R. (1999). Level of Automation Effects on Performance, Situation Awareness and Workload in a Dynamic Control Task. Ergonomics 42, 462–492. doi:10.1080/001401399185595
Engel, D., Woolley, A. W., Jing, L. X., Chabris, C. F., and Malone, T. W. (2014). Reading the Mind in the Eyes or Reading between the Lines? Theory of Mind Predicts Collective Intelligence Equally Well Online and Face-To-Face. PloS one 9, e115212. doi:10.1371/journal.pone.0115212
Forlizzi, J., and Battarbee, K. (2004). “Understanding Experience in Interactive Systems,” in Proceedings of the 5th conference on Designing interactive systems: processes, practices, methods, and techniques, Cambridge, MA. 261–268.
Freeman, G., Zamanifard, S., Maloney, D., and Adkins, A. (2020). “My Body, My Avatar: How People Perceive Their Avatars in Social Virtual Reality,” in Extended Abstracts of the 2020 CHI Conference on Human Factors in Computing Systems, Honolulu, HI, April 25, 2020. Vol. 1–8.
Freina, L., and Ott, M. (2015). “A Literature Review on Immersive Virtual Reality in Education: State of the Art and Perspectives,” in The international scientific conference elearning and software for education, Bucharest, Romania, April 23–24, 2015. Vol. 1. 10–1007.
Fruchter, R. (2018). “M3r: Transformative Impacts of Mixed Media Mixed Reality Collaborative Environment in Support of Aec Global Teamwork,” in Transforming Engineering Education: Innovative Computer-Mediated Learning Technologies. Editors C. M. Carol, M. Ivan, and F. Renate (Reston,VA: American Society of Civil Engineers), 229–257. doi:10.1061/9780784414866.ch08
Fussell, S. R., and Setlock, L. D. (2014). “Computer-mediated Communication,”in Oxford library of psychology. The Oxford handbook of language and social psychology. Editors T. M. Holtgraves (Oxford, United Kingdom: Oxford University Press), 471–490.
Gao, G., Hwang, S. Y., Culbertson, G., Fussell, S. R., and Jung, M. F. (2017). Beyond Information Content: The Effects of Culture on Affective Grounding in Instant Messaging Conversations. Proc. ACM Hum.-Comput. Interact. 1, 18. doi:10.1145/3134683
Gerken, J., Bak, P., and Reiterer, H. (2007). “Longitudinal Evaluation Methods in Human-Computer Studies and Visual Analytics,” in InfoVis: Workshop on Metrics for the Evaluation of Visual Analytics, October 28, 2007.
Glaser, B. G., Strauss, A. L., and Strutzel, E. (1968). The Discovery of Grounded Theory; Strategies for Qualitative Research. Nurs. Res. 17, 364. doi:10.1097/00006199-196807000-00014
Goyal, N., and Fussell, S. R. (2016). “Effects of Sensemaking Translucence on Distributed Collaborative Analysis,” in Proceedings of the 19th ACM Conference on Computer-Supported Cooperative Work & Social Computing, San Francisco, CA, February 27, 2016, 288–302.
Greenwald, S. W., Wang, Z., Funk, M., and Maes, P. (2017). “Investigating Social Presence and Communication with Embodied Avatars in Room-Scale Virtual Reality,” in International Conference on Immersive Learning, London, United Kingdom, June 23–27, 2017 (Berlin, Germany: Springer), 75–90. doi:10.1007/978-3-319-60633-0_7
Gunkel, S. N., Stokking, H. M., Prins, M. J., van der Stap, N., Haar, F. B. t., and Niamut, O. A. (2018). “Virtual Reality Conferencing: Multi-User Immersive Vr Experiences on the Web,” in Proceedings of the 9th ACM Multimedia Systems Conference, Amsterdam, Netherlands, June 12–18, 2018, 498–501.
Hammick, J. K., and Lee, M. J. (2014). Do shy People Feel Less Communication Apprehension Online? the Effects of Virtual Reality on the Relationship between Personality Characteristics and Communication Outcomes. Comput. Hum. Behav. 33, 302–310. doi:10.1016/j.chb.2013.01.046
Hancock, J. T., and Dunham, P. J. (2001). Impression Formation in Computer-Mediated Communication Revisited: An Analysis of the Breadth and Intensity of Impressions. Commun. Res. 28, 325–347. doi:10.1177/009365001028003004
Harris, H., Bailenson, J. N., Nielsen, A., and Yee, N. (2009). The Evolution of Social Behavior over Time in Second Life. Presence: Teleop. Virt. Environ. 18, 434–448. doi:10.1162/pres.18.6.434
Harris, R. B., and Paradice, D. (2007). An Investigation of the Computer-Mediated Communication of Emotions. J. Appl. Sci. Res. 3, 2081–2090.
Hart, S. G. (2006). “Nasa-task Load Index (Nasa-tlx); 20 Years Later,” in Proceedings of the human factors and ergonomics society annual meeting, Los Angeles, CA, October 1, 2006 (Sage publications Sage CA), Vol. 50, 904–908. doi:10.1177/154193120605000909
Hart, S. G., and Staveland, L. E. (1988). “Development of Nasa-Tlx (Task Load Index): Results of Empirical and Theoretical Research,” in Advances in Psychology. Editors A. M. Colley,, and J. R. Beech (Amsterdam, Netherlands: Elsevier), Vol. 52, 139–183. doi:10.1016/s0166-4115(08)62386-9
Hassenzahl, M., and Tractinsky, N. (2006). User Experience-A Research Agenda. Behav. Inf. Technol. 25, 91–97. doi:10.1080/01449290500330331
Hickson, S., Dufour, N., Sud, A., Kwatra, V., and Essa, I. (2019). “Eyemotion: Classifying Facial Expressions in Vr Using Eye-Tracking Cameras,” in 2019 IEEE Winter Conference on Applications of Computer Vision, Waikoloa Village, HI, January 7–11, 2019 (IEEE), 1626–1635.
Jaeger, B. C., Edwards, L. J., Das, K., and Sen, P. K. (2017). An R 2 Statistic for Fixed Effects in the Generalized Linear Mixed Model. J. Appl. Stat. 44, 1086–1105. doi:10.1080/02664763.2016.1193725
Jiang, J., and Vogels, E. A. (2019). Millennials Stand Out for Their Technology Use, but Older Generations Also Embrace Digital Life, pew research
Kaber, D. B., and Endsley, M. R. (2004). The Effects of Level of Automation and Adaptive Automation on Human Performance, Situation Awareness and Workload in a Dynamic Control Task. Theor. Issues Ergon. Sci. 5, 113–153. doi:10.1080/1463922021000054335
Karapanos, E., Zimmerman, J., Forlizzi, J., and Martens, J.-B. (2009). “User Experience over Time: an Initial Framework,” in Proceedings of the SIGCHI conference on human factors in computing systems, Montréal Québec, Canada, April, 2009. 729–738.
Koutsabasis, P., Vosinakis, S., Malisova, K., and Paparounas, N. (2012). On the Value of Virtual Worlds for Collaborative Design. Des. Stud. 33, 357–390. doi:10.1016/j.destud.2011.11.004
Krueger, C., and Tian, L. (2004). A Comparison of the General Linear Mixed Model and Repeated Measures Anova Using a Dataset with Multiple Missing Data Points. Biol. Res. Nurs. 6, 151–157. doi:10.1177/1099800404267682
Larsen, C. R., Soerensen, J. L., Grantcharov, T. P., Dalsgaard, T., Schouenborg, L., Ottosen, C., et al. (2009). Effect of Virtual Reality Training on Laparoscopic Surgery: Randomised Controlled Trial. BMJ 338, b2074. doi:10.1136/bmj.b1802
Leite, I., Martinho, C., and Paiva, A. (2013). Social Robots for Long-Term Interaction: a Survey. Int. J. Soc. Robot. 5, 291–308. doi:10.1007/s12369-013-0178-y
Ling, Y., Nefs, H. T., Morina, N., Heynderickx, I., and Brinkman, W.-P. (2014). A Meta-Analysis on the Relationship between Self-Reported Presence and Anxiety in Virtual Reality Exposure Therapy for Anxiety Disorders. PloS One 9, e96144. doi:10.1371/journal.pone.0096144
Lohse, M., Rothuis, R., Gallego-Pérez, J., Karreman, D. E., and Evers, V. (2014). “Robot Gestures Make Difficult Tasks Easier: the Impact of Gestures on Perceived Workload and Task Performance,” in Proceedings of the SIGCHI Conference on Human Factors in Computing Systems, Toronto Ontario, Canada, April 26–May 1, 2014. 1459–1466.
Lombard, M., and Ditton, T. (1997). At the Heart of it All: The Concept of Presence. J. Computer-Mediated Commun. 3, JCMC321. doi:10.1111/j.1083-6101.1997.tb00072.x
Luong, T., Argelaguet, F., Martin, N., and Lécuyer, A. (2020). “Introducing Mental Workload Assessment for the Design of Virtual Reality Training Scenarios,” in 2020 IEEE Conference on Virtual Reality and 3D User Interfaces (VR), Atlanta, GA, March 22–26, 2020 (IEEE), 662–671.
Ma, X., Cackett, M., Park, L., Chien, E., and Naaman, M. (2018). “Web-based Vr Experiments Powered by the Crowd,’ in Proceedings Of the 2018 World Wide Web Conference (Republic and Canton of Geneva, Switzerland: International World Wide Web Conferences Steering Committee), Lyon, France, April 23–27, 2018, (New York: ACM), 33–43. doi:10.1145/3178876.3186034
Maloney, D., Freeman, G., and Robb, A. (2020). “It Is Complicated: Interacting with Children in Social Virtual Reality,” in 2020 IEEE Conference on Virtual Reality and 3D User Interfaces Abstracts and Workshops, Atlanta, GA, March 22–26, 2020 (IEEE), 343–347.
Manstead, A. S., Lea, M., and Goh, J. (2011). Facing the Future: Emotion Communication and the Presence of Others in the Age of Video-Mediated Communication. Face-to-face Communication over the Internet: Issues, Research, Challenges. Editors A Kappas, and NC Krämer (Cambridge, United Kingdom: Cambridge University Press), Vol. 144–175.
Mark, G., Gudith, D., and Klocke, U. (2008). “The Cost of Interrupted Work: More Speed and Stress,” in Proceedings of the SIGCHI conference on Human Factors in Computing Systems, Florence, Italy, April 5–10, 2008, 107–110.
Matthews, G., Jones, D. M., and Chamberlain, A. G. (1990). Refining the Measurement of Mood: The Uwist Mood Adjective Checklist. Br. J. Psychol. 81, 17–42. doi:10.1111/j.2044-8295.1990.tb02343.x
Mboya, A. M. (2020). Allo-I (S): Mixed Reality and Mixed Method Tools for Alternative Imaginations. Ph.D. thesis. Cambridge (MA): Massachusetts Institute of Technology.
McGrath, J. E. (1984). Groups: Interaction and Performance. Englewood Cliffs, NJ: Prentice-Hall, Inc.. Vol. 14.
McLellan, S., Muddimer, A., and Peres, S. C. (2012). The Effect of Experience on System Usability Scale Ratings. J. Usability Stud. 7, 56–67.
McVeigh-Schultz, J., Márquez Segura, E., Merrill, N., and Isbister, K. (2018). “What’s it Mean to “Be Social” in Vr? Mapping the Social Vr Design Ecology,” in Proceedings of the 2018 ACM Conference Companion Publication on Designing Interactive Systems, New York, NY, June, 2018. 289–294.
Miller, K. J., Adair, B. S., Pearce, A. J., Said, C. M., Ozanne, E., and Morris, M. M. (2014). Effectiveness and Feasibility of Virtual Reality and Gaming System Use at Home by Older Adults for Enabling Physical Activity to Improve Health-Related Domains: a Systematic Review. Age. Ageing 43, 188–195. doi:10.1093/ageing/aft194
Mott, M., Tang, J., Kane, S., Cutrell, E., and Ringel Morris, M. (2020). “I Just Went into it Assuming that I Wouldn’t Be Able to Have the Full Experience” Understanding the Accessibility of Virtual Reality for People with Limited Mobility,” in The 22nd International ACM SIGACCESS Conference on Computers and Accessibility, Boulder, CO, April 29, 2020. 1–13.
Moustafa, F., and Steed, A. (2018). “A Longitudinal Study of Small Group Interaction in Social Virtual Reality,” in Proceedings of the 24th ACM Symposium on Virtual Reality Software and Technology, Tokyo, Japan, November 28–December 01, 2018 (New York: ACM), 22.
Neustaedter, C., and Greenberg, S. (2012). “Intimacy in Long-Distance Relationships over Video Chat,” in Proceedings of the SIGCHI Conference on Human Factors in Computing Systems, Austin TX, May 5–10, 2012 (New York: ACM), 753–762.
Nguyen, D. T., and Fussell, S. R. (2014). Lexical Cues of Interaction Involvement in Dyadic Instant Messaging Conversations. Discourse Process. 51, 468–493. doi:10.1080/0163853x.2014.912544
Nguyen, H., Ward, B., Engelke, U., Thomas, B., and Bednarz, T. (2019). “Collaborative Data Analytics Using Virtual Reality,” in 2019 IEEE Conference on Virtual Reality and 3D User Interfaces (VR), Osaka, Japan, March 23–27, 2019, (New York City: IEEE), 1098–1099. doi:10.1109/VR.2019.8797845
Nowak, K. (2001). “Defining and Differentiating Copresence, Social Presence and Presence as Transportation,” in Presence 2001 Conference, Philadelphia, PA, May 21-23, 2001 (Citeseer), 1–23.
Oh, C. S., Bailenson, J. N., and Welch, G. F. (2018). A Systematic Review of Social Presence: Definition, Antecedents, and Implications. Front. Robotics AI 5, 114. doi:10.3389/frobt.2018.00114
Oh, S. Y., Bailenson, J., Krämer, N., and Li, B. (2016). Let the Avatar Brighten Your Smile: Effects of Enhancing Facial Expressions in Virtual Environments. PloS One 11, e0161794. doi:10.1371/journal.pone.0161794
Otto, O., Roberts, D., and Wolff, R. (2006). “A Review on Effective Closely-Coupled Collaboration Using Immersive Cve’s,” in Proceedings of the 2006 ACM international conference on Virtual reality continuum and its applications, Hong Kong, China, June, 2006, 145–154.
Paes, D., Arantes, E., and Irizarry, J. (2017). Immersive Environment for Improving the Understanding of Architectural 3d Models: Comparing User Spatial Perception between Immersive and Traditional Virtual Reality Systems. Automat. Constr. 84, 292–303. doi:10.1016/j.autcon.2017.09.016
Pan, Y., and Steed, A. (2019). How Foot Tracking Matters: The Impact of an Animated Self-Avatar on Interaction, Embodiment and Presence in Shared Virtual Environments. Front. Robotic. AI 6, 104. doi:10.3389/frobt.2019.00104
Pek, J., and Flora, D. B. (2018). Reporting Effect Sizes in Original Psychological Research: A Discussion and Tutorial. Psychol. Method. 23, 208. doi:10.1037/met0000126
Porter III, J., and Robb, A. (2019). “An Analysis of Longitudinal Trends in Consumer Thoughts on Presence and Simulator Sickness in Vr Games,” in Proceedings of the Annual Symposium on Computer-Human Interaction in Play, Barcelona, Spain, October 22–25, 2019, 277–285.
Pouliquen-Lardy, L., Milleville-Pennel, I., Guillaume, F., and Mars, F. (2016). Remote Collaboration in Virtual Reality: Asymmetrical Effects of Task Distribution on Spatial Processing and Mental Workload. Virtual Real. 20, 213–220. doi:10.1007/s10055-016-0294-8
Rajanna, V., and Hansen, J. P. (2018). “Gaze Typing in Virtual Reality: Impact of Keyboard Design, Selection Method, and Motion,” in Proceedings of the 2018 ACM Symposium on Eye Tracking Research & Applications, Warsaw, Poland, June 14–17, 2018, 1–10. doi:10.1145/3204493.3204541
Rights, J. D., and Sterba, S. K. (2019). Quantifying Explained Variance in Multilevel Models: An Integrative Framework for Defining R-Squared Measures. Psychol. Methods 24, 309. doi:10.1037/met0000184
Sallnäs, E. L. (2005). Effects of Communication Mode on Social Presence, Virtual Presence, and Performance in Collaborative Virtual Environments. Presence: Teleop. Virt. Environ. 14, 434–449. doi:10.1162/105474605774785253
Scherer, K. R. (2003). Vocal Communication of Emotion: A Review of Research Paradigms. Speech Commun. 40, 227–256. doi:10.1016/s0167-6393(02)00084-5
Schroeder, R., Steed, A., Axelsson, A.-S., Heldal, I., Abelin, Å., Wideström, J., et al. (2001). Collaborating in Networked Immersive Spaces: as Good as Being There Together? Comput. Graphics 25, 781–788. doi:10.1016/s0097-8493(01)00120-0
Slater, M., Sadagic, A., Usoh, M., and Schroeder, R. (2000). Small-group Behavior in a Virtual and Real Environment: A Comparative Study. Presence: Teleop. Virt. Environ. 9, 37–51. doi:10.1162/105474600566600
Slater, M., and Sanchez-Vives, M. V. (2016). Enhancing Our Lives with Immersive Virtual Reality. Front. Robotic. AI 3, 74. doi:10.3389/frobt.2016.00074
Slater, M., and Wilbur, S. (1997). A Framework for Immersive Virtual Environments (Five): Speculations on the Role of Presence in Virtual Environments. Presence: Teleop. Virt. Environ. 6, 603–616. doi:10.1162/pres.1997.6.6.603
Sonalkar, N., Mabogunje, A., Miller, M., Bailenson, J., and Leifer, L. (2020). “Augmenting Learning of Design Teamwork Using Immersive Virtual Reality,” in Design Thinking Research. Editors H. Plattner, C. Meinel, and L. Leifer (Berlin, Germany: Springer). 67–76. doi:10.1007/978-3-030-28960-7_5
Steed, A., Ortega, F., Williams, A., Kruijff, E., Stuerzlinger, W., Batmaz, A. U., et al. (2020). Evaluating Immersive Experiences during Covid-19 and beyond. Interactions 27. doi:10.1145/3406098
Steed, A., Slater, M., Sadagic, A., Bullock, A., and Tromp, J. (1999). Leadership and Collaboration in Shared Virtual Environments,” in Proceedings IEEE Virtual Reality (Cat. No. 99CB36316), Houston, TX, March 13–17, 1999 (IEEE), 112–115.
Steed, A., Spante, M., Heldal, I., Axelsson, A.-S., and Schroeder, R. (2003). “Strangers and Friends in Caves: an Exploratory Study of Collaboration in Networked Ipt Systems for Extended Periods of Time,” in Proceedings of the 2003 symposium on Interactive 3D graphics, Monterey, CA, April 27, 2003 (New York: ACM), 51–54.
Steptoe, W., Steed, A., Rovira, A., and Rae, J. (2010). “Lie Tracking: Social Presence, Truth and Deception in Avatar-Mediated Telecommunication,” in Proceedings of the SIGCHI Conference on Human Factors in Computing Systems, Paris France, April 10–15, 2010 (New York, NY: ACM), 1039–1048. doi:10.1145/1753326.1753481
Steptoe, W., Wolff, R., Murgia, A., Guimaraes, E., Rae, J., Sharkey, P., et al. (2008). “Eye-tracking for Avatar Eye-Gaze and Interactional Analysis in Immersive Collaborative Virtual Environments,” in Proceedings of the 2008 ACM Conference on Computer Supported Cooperative Work, San Diego, CA, November 8, 2008 (New York, NY: ACM). doi:10.1145/1460563.1460593
Steuer, J. (1992). Defining Virtual Reality: Dimensions Determining Telepresence. J. Commun. 42, 73–93. doi:10.1111/j.1460-2466.1992.tb00812.x
Sun, Y., Shaikh, O., and Won, A. S. (2019). Nonverbal Synchrony in Virtual Reality. PloS One 14. doi:10.1371/journal.pone.0221803
Tamborini, R., and Skalski, P. (2006). “The Role of Presence in the Experience of Electronic Games,” in Playing video games: Motives, responses, and consequences, Editors V. Peter, and B. Jennings (Mahwah, NJ: Lawrence Erlbaum Associates), 225–240.
J. Tanenbaum, M. S. El-Nasr, and M. Nixon (2014). Nonverbal Communication in Virtual Worlds: Understanding and Designing Expressive Characters. Pittsburgh, PA: ETC Press Pittsburgh.
Tanenbaum, T. J., Hartoonian, N., and Bryan, J. (2020). “How Do I Make This Thing Smile? an Inventory of Expressive Nonverbal Communication in Commercial Social Virtual Reality Platforms,” in Proceedings of the 2020 CHI Conference on Human Factors in Computing Systems, Honolulu, HI, April 25, 2020. Vol. 1–13.
Tree, J. E. F. (2001). Listeners’ Uses Ofum Anduh in Speech Comprehension. Mem. Cogn. 29, 320–326. doi:10.3758/bf03194926
van der Land, S., Schouten, A. P., Feldberg, F., van den Hooff, B., and Huysman, M. (2013). Lost in Space? Cognitive Fit and Cognitive Load in 3d Virtual Environments. Comput. Hum. Behav. 29, 1054–1064. doi:10.1016/j.chb.2012.09.006
Walther, J. B. (1996). Computer-mediated Communication: Impersonal, Interpersonal, and Hyperpersonal Interaction. Commun. Res. 23, 3–43. doi:10.1177/009365096023001001
Walther, J. B., Deandrea, D. C., and Tong, S. T. (2010). Computer-mediated Communication versus Vocal Communication and the Attenuation of Pre-interaction Impressions. Media Psychol. 13, 364–386. doi:10.1080/15213269.2010.524913
Walther, J. B., Loh, T., and Granka, L. (2005). Let Me Count the Ways: The Interchange of Verbal and Nonverbal Cues in Computer-Mediated and Face-To-Face Affinity. J. Lang. Soc. Psychol. 24, 36–65. doi:10.1177/0261927x04273036
Walther, J. B., and Tidwell, L. C. (1995). Nonverbal Cues in Computer-Mediated Communication, and the Effect of Chronemics on Relational Communication. J. Organizational Comput. Electron. Commerce 5, 355–378. doi:10.1080/10919399509540258
Warburton, S. (2009). Second Life in Higher Education: Assessing the Potential for and the Barriers to Deploying Virtual Worlds in Learning and Teaching. Br. J. Educ. Technol. 40, 414–426. doi:10.1111/j.1467-8535.2009.00952.x
Wei, S. E., Saragih, J., Simon, T., Harley, A. W., Lombardi, S., Perdoch, M., et al. (2019). Vr Facial Animation via Multiview Image Translation. ACM Trans. Graphic. 38, 1–16. doi:10.1145/3306346.3323030
Wetsch, L. R. (2008). The “New” Virtual Consumer: Exploring the Experiences of New Users. J. Virtual Worlds Res. 1
Wickens, C. D. (2008). Multiple Resources and Mental Workload. Hum. Factors 50, 449–455. doi:10.1518/001872008x288394
Wideström, J., Axelsson, A.-S., Schroeder, R., Nilsson, A., Heldal, I., and Abelin, Å. (2000). “The Collaborative Cube Puzzle: A Comparison of Virtual and Real Environments,” in Proceedings of the Third International Conference on Collaborative Virtual Environments, San Francisco, CA, September 10–12, 2000 (New York, NY: ACM), 165–171. doi:10.1145/351006.351035
Witmer, B. G., Jerome, C. J., and Singer, M. J. (2005). The Factor Structure of the Presence Questionnaire. Presence: Teleop. Virt. Environ. 14, 298–312. doi:10.1162/105474605323384654
Woolley, A. W., Chabris, C. F., Pentland, A., Hashmi, N., and Malone, T. W. (2010). Evidence for a Collective Intelligence Factor in the Performance of Human Groups. Science 330, 686–688. doi:10.1126/science.1193147
Xu, B., Gao, G., Fussell, S. R., and Cosley, D. (2014). “Improving Machine Translation by Showing Two Outputs,” in Proceedings of the SIGCHI Conference on Human Factors in Computing Systems, Toronto Ontario Canada, April 26–May 01, 2014, 3743–3746.
Yee, N., and Bailenson, J. N. (2008). A Method for Longitudinal Behavioral Data Collection in Second Life. Presence: Teleop. Virt. Environ. 17, 594–596. doi:10.1162/pres.17.6.594
Keywords: VR, virtual reality, remote collaboration, presence, social presence
Citation: Khojasteh N and Won AS (2021) Working Together on Diverse Tasks: A Longitudinal Study on Individual Workload, Presence and Emotional Recognition in Collaborative Virtual Environments. Front. Virtual Real. 2:643331. doi: 10.3389/frvir.2021.643331
Received: 17 December 2020; Accepted: 22 April 2021;
Published: 10 June 2021.
Edited by:
Katja Zibrek, Inria Rennes—Bretagne Atlantique Research Center, FranceReviewed by:
Mark Billinghurst, University of South Australia, AustraliaCopyright © 2021 Khojasteh and Won. This is an open-access article distributed under the terms of the Creative Commons Attribution License (CC BY). The use, distribution or reproduction in other forums is permitted, provided the original author(s) and the copyright owner(s) are credited and that the original publication in this journal is cited, in accordance with accepted academic practice. No use, distribution or reproduction is permitted which does not comply with these terms.
*Correspondence: Negar Khojasteh, bms1ODZAY29ybmVsbC5lZHU=
Disclaimer: All claims expressed in this article are solely those of the authors and do not necessarily represent those of their affiliated organizations, or those of the publisher, the editors and the reviewers. Any product that may be evaluated in this article or claim that may be made by its manufacturer is not guaranteed or endorsed by the publisher.
Research integrity at Frontiers
Learn more about the work of our research integrity team to safeguard the quality of each article we publish.