 Kate N. de Castro
 Elena V. Donoso Brown
 Rachael Miller Neilan
 Sarah E. Wallace
- 1Department of Occupational Therapy, Rangos School of Health Sciences, Duquesne University, Pittsburgh, PA, United States
- 2Department of Mathematics and Computer Science, McAnulty College of Liberal Arts, Duquesne University, Pittsburgh, PA, United States
- 3Communication and Cognition Laboratory, Department of Speech Language Pathology, Rangos School of Health Sciences, Duquesne University, Pittsburgh, PA, United States
Background: Adherence to home practice rehabilitation programs is important for efficacy; however, adherence is challenging for many individuals post-stroke. Accelerometers have emerged as a potential means to support home practice. This secondary data analysis explored the use of a commercially available accelerometer with custom software to collect and analyze data to corroborate self-reported practice collected during a home program.
Methods: The initial study was a single subject design trial that investigated the effect of preferred music listening on adherence to an upper extremity home practice program (Trial Number NCT02906956. ClinicalTrials.gov). The participants (n = 7) were post-stroke adults with aphasia and hemiparesis of the upper extremity. Participants completed home program exercises while wearing accelerometers and recorded practice times in a logbook. Data were collected, cleaned, processed, and analyzed to facilitate descriptive comparisons and clinical interpretations of accelerometer output data.
Results: Across all participants, an average of 47% of data were captured and usable for analysis. Five out of seven participants self-reported longer practice times compared to accelerometer duration output by a mean of 66.5 s. Individual exercise set mean total angular velocity and standard deviation of acceleration demonstrated potential for use across time to monitor change.
Conclusions: One challenge of integrating accelerometers into clinical practice is the amount of data loss and the steps for data processing. The comparisons of available accelerometer data to the self-reported logs, however, were generally representative. Future investigations should explore ways to increase data capture and accessibility of the data for feedback to the client and practitioner.
Introduction
Hemiparesis is the most common post-stroke neurological impairment and affects participation in activities of daily living (ADLs) and meaningful occupations (Reiterer et al., 2008). Therefore, rehabilitation of the hemiparetic upper extremity is a key factor in promoting independence post-stroke. One effective rehabilitation approach to increase motor function and prevent learned non-use involves rebuilding neural connections through task repetitive practice (Lang and Birkenmeier, 2014). While this approach shows promise, clinicians have limited time to provide direct services to clients. This barrier often leads to the use of home programs to extend treatment through unsupervised practice.
One challenge clinicians face when monitoring home programs is the limited ability to track adherence to programs. There are two approaches commonly reported in the literature to measure adherence to home programs: self-report via journal/diary/logbook or use of a technological method to track activity (Frost et al., 2017; Donoso Brown et al., 2020a). The ability to monitor adherence using technology would allow for provision of timely feedback as well as reminders to engage in exercises. Examples of technology include pedometers, virtual reality gloves, computer games, and accelerometers (Standen et al., 2015; Donoso Brown et al., 2020a).
Wrist-worn accelerometers may be particularly useful for tracking adherence to upper extremity home programs because they are non-invasive, portable, and light weight. In addition, tri-axial accelerometers are able to measure acceleration in three perpendicular planes (X, Y, Z). The portable and non-invasive nature of these devices promotes the ability to wear them in a real-world environment (Uswatte et al., 2006; Noorkõiv et al., 2014; Bailey et al., 2015; Urbin et al., 2015). Another appealing aspect of this device is that there are accelerometers incorporated into commercially available activity monitors (i.e., smartwatches), which could increase accessibility.
Research grade accelerometers, specifically, have been found to be valid and reliable tools for measuring upper extremity activity among adults with and without stroke (Bailey et al., 2015; Urbin et al., 2015). In previous research with persons post-stroke, Noorkõiv and colleagues used accelerometry to identify active and inactive periods of hemiparetic upper extremity movement (Noorkõiv et al., 2014). Additionally, Lee et al. (2018) found that accelerometers can differentiate between goal-directed and non-goal directed movements with 87% accuracy. Accelerometers can also compare right and left upper extremity movement, thus allowing clinicians to monitor learned non-use, which cannot be otherwise measured using standardized stroke assessments (Reiterer et al., 2008; Bailey et al., 2015). Finally, accelerometer data has been found to correlate with standardized measures of upper extremity function, which provides some evidence of the potential for this device to monitor progression in the real-world environment across the period of time when they are being worn (Uswatte et al., 2006; Reiterer et al., 2008). Despite the benefits of using accelerometers to monitor post-stroke upper extremity rehabilitation, there remain challenges regarding data capture and management. For example, Uswatte et al. (2006) completed a study in which participants wore accelerometers for two 3-day periods; however, researchers lost 23% of accelerometer data due to errors with downloading and storing data, participant error when wearing the devices, and technological failure. Additionally, data output from accelerometers can be difficult to process and interpret intuitively (Urbin et al., 2015).
In addition to these challenges, most investigations in individuals post-stroke have explored the use of research grade accelerometers rather than commercially available devices (Noorkõiv et al., 2014). One benefit of commercially available accelerometers is the variety of wristband designs which could increase independence in doffing and donning the device when in use (Lee et al., 2018). Additional benefits found in an investigation of the Fitbit® (Rowe and Neville, 2019) include accessibility, affordability, and provision of immediate feedback. Rowe and Neville (2019) compared the Fitbit®, to the gold standard accelerometer, ActiGraph® in healthy adults. The results found that while less sensitive to the capture of upper extremity movement measured via step count, the data from both devices was strongly correlated (i.e., r > 0.8). Similarly, the commercially available Microsoft Band™ has been found to consistently track duration, angular velocity, and acceleration as well as produce anticipated data outcomes when worn by healthy adults during task-repetitive exercises (Gough et al., 2019). While these studies outline some benefits of using commercially available accelerometers and indicate preliminary psychometric information, there is limited research available regarding the use of these devices for monitoring home exercise programs for persons post-stroke. Therefore, the objective of this secondary data analysis was to understand elements of practicality related to use of a commercially available accelerometer with custom software programs to corroborate self-reported data and provide information on characteristics of practice when completing an upper extremity home program. We sought to answer three research questions:
(1) What percentage of self-reported practice sessions were recorded by accelerometers during the home exercise program?
(2) How does self-reported practice duration of a home program compare to the recorded duration captured via accelerometry?
(3) What can accelerometer outputs, such as angular velocity and acceleration, tell us about speed or movement quality during practice over time?
Five variables related to accelerometer data were explored during data analysis, including (1) data capture (%); (2) duration (s); (3) percent active time (%); (4) angular velocity (degrees/s); and (5) standard deviation of acceleration (m/s2) in the X, Y, and Z planes.
Methods
Initial Study Background
These data were collected during a single subject design intervention study (ABAB) to evaluate the impact of preferred music listening during home program practice on adherence (Donoso Brown et al., 2020b). Seven stroke survivors in the chronic phase of recovery participated in the original study. Participants ranged from 45 to 83 years in age (Mean = 63.43; SD = 16.7) and experienced right upper extremity hemiparesis and mild to moderate aphasia (Donoso Brown et al., 2020b). See Supplementary Table 1 for details of participant demographics. Results from the original study indicate that four participants met or exceeded the target of 10 practice sessions per week (Donoso Brown et al., 2020b). The remaining participants fell below 10 practice sessions per week for at least 1 week during the study period and no consistent effect of preferred music listening was found. Additionally, participants reported their experiences with the bands as motivating although some reported needing assistance to put them on prior to practicing (Wallace et al., 2018).
Secondary Analysis
The secondary data analysis presented is a descriptive quantitative analysis of the metrics obtained from the accelerometer worn on the paretic limb during home practice. When applicable, metrics such as number of exercises and duration, were compared to data collected via self-report by the participants in their logbooks.
Data Collection
During data collection, participants wore one commercially available activity monitor (Microsoft Band™) on each wrist while completing several, task repetitive exercises, with rest breaks between sets, in their home environment. The exercises varied for each participant, as the initial study assessed adherence to home exercise programs. Exercises were selected based on activities that were meaningful and motivating to each participant as well as their upper extremity level of impairment. See Supplementary Table 1 for each participant's exercises. Practice sessions consisted of two to three different exercises. Participants were typically instructed to practice each exercise in three sets of 20 repetitions. During breaks between each individual exercise set, participants were asked to rest their hands to aid in data processing. Participants were asked to complete two practice sessions per day, 5 days a week, for 4 weeks. In the logbooks, participants recorded the start time and stop time for each exercise, number of individual exercise sets for each exercise, and number of repetitions completed within each individual exercise set.
The Microsoft Band™ was connected to a mobile phone, which was not connected to a cellular or wireless network. The phone contained an application developed by Venetasoft, Children's National Hospital, and the University of Pittsburgh, which was provided to the authors by request, to extract raw data from the Microsoft Band™'s triaxial accelerometer and gyroscope. The frequency of data collection was set at 62 hertz. The band and phone were connected by Bluetooth. The application was left running continuously during the study period to eliminate the need for participants to start and stop data collection on the devices. Participants needed to put the Microsoft Bands™ on their wrists and then record the start time prior to beginning their practice session. Participants were taught to check the phone for a green light, indicating that the application was collecting data. Additionally, participants were instructed to contact the research team if technical difficulties arose. Data were manually downloaded from the phones once per week during the study. Only data from the paretic (right) limb was analyzed.
Data Processing and Cleaning
Data captured by the accelerometer included angular velocity (degrees/s) and acceleration (m/s2) in each of the X, Y, and Z spatial planes. These data were downloaded from the phones as .log files. Due to the size of the files, they were exported into SPSS® (IMB, Version 26) and data from each exercise were extracted based on participant-reported start and stop times in their logbooks. The data were not filtered; therefore, we used all data points collected during each exercise in our analyses. We used all data collected to ensure the variability of the metrics being studied was well-captured. Accelerometer data corresponding to each exercise were then saved as .csv files. The exercise files were then imported into Matlab® (Mathworks, Version 2020) and run one at a time through a custom program, which included a graphical interface to guide the user in each step of data importation and analysis.
The Matlab® program read the data from each .csv file and parsed it into six vectors. Three vectors contained the absolute value of angular velocity (degrees/s) in each of the X, Y, and Z planes, respectively. The other three vectors contained the absolute value of acceleration (m/s2) in each of the X, Y, and Z planes, respectively. The absolute value was used because we were interested in the magnitude of these values and not the direction. From these six vectors, the program generated six graphs displaying angular velocity and acceleration in each of the X, Y, and Z planes over the entire length of time represented by the data set. When possible, visual inspection of the graphs was used to note patterns representative of repetitive exercise and rest periods. We also used visual inspection to identify precise start and stop times (i.e., line numbers in Matlab®) for individual exercise sets as well as total exercise. Graphs were considered readable if each individual exercise set was preceded and followed by a rest period during which the velocity values were approximately zero. As needed, multiple graphs (e.g., angular velocity X and angular velocity Y) were referenced to identify the rest periods. The start and stop times were identified as Matlab® line numbers corresponding to the times at which the participant transitioned from a rest period (zero velocity) to an individual exercise set (non-zero velocity), and vice versa. See Figure 1 for example of resulting start and stop times from visual inspection using Matlab® output. Start and stop times had to be identifiable across all sets in the exercise in order for the data to be considered usable for individual set analysis. There were some exercises for which we were unable to visually identify distinct start and stop points, as there was no discernable pattern of activity when the data was graphed. As a result, these data were not used during analysis.
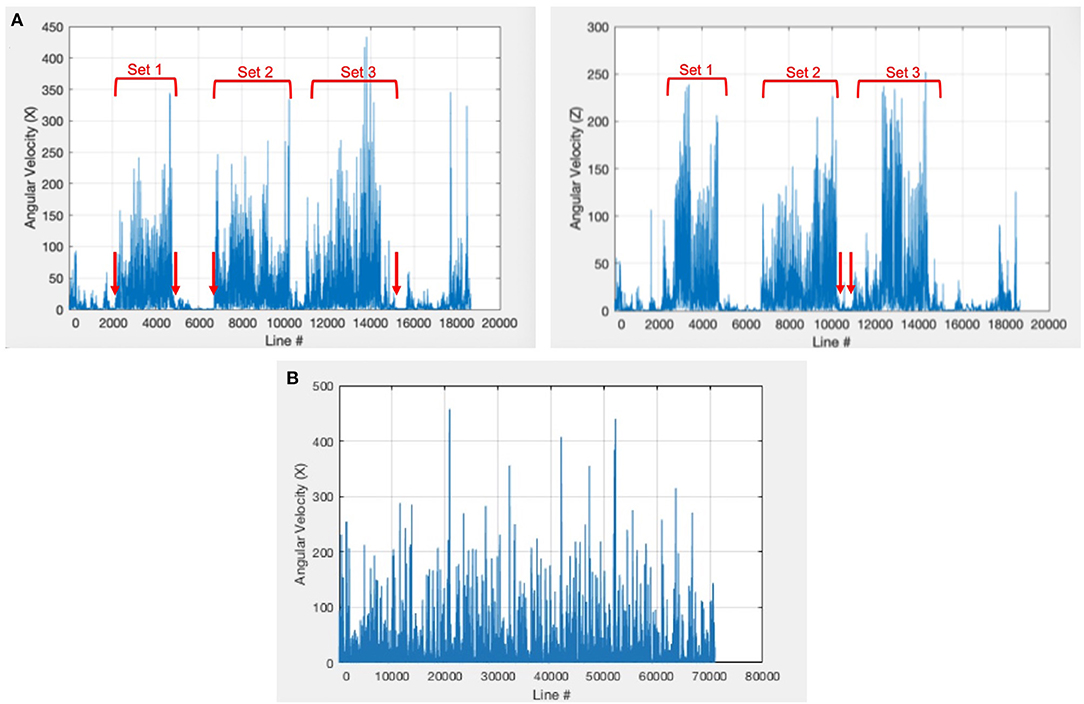
Figure 1. Example Matlab® output for determination of start and stop points. Participant 3 completed three individual exercise sets during the exercise seen in graph (A). We were able to visually identify start and stop points for each set. Set 1 started at line 2170 and stopped at line 4809, set 2 started at 6778 and stopped at 10320, and set 3 started at 10960 and stopped at 15200. Participant 6 reported having completed three individual exercise sets during the exercise seen in graph (B); however, we were unable to visually identify three individual exercise sets when graphing the data in the custom Matlab® program: (4597, 70940).
To analyze individual sets within an exercise, the start and stop times of each individual exercise set found by visual inspection were entered into the Matlab® program. The line numbers for the start and stop times were recorded in order to allow for consistency when re-running the data for the exercise. The program then analyzed data obtained between the start and stop of each set in an exercise (i.e., beginning of first set to end of first set, beginning of second set to end of second set). These data did not include the rest periods that participants were instructed to take between individual exercise sets. The files were run through the program a second time to analyze the data for the total exercise (i.e., beginning of first set of an exercise to end of the last set of exercise). This total exercise data included rest breaks. By considering both sets of data, we were able to determine if the variables collected operated as expected in relation to the inclusion and exclusion of rest breaks.
The Matlab® program was designed to output the following variables. Duration (s) was determined by first calculating the difference in the line numbers representing the stop and start times and then converting this quantity to seconds. Duration provided a measure of practice time. The average, standard deviation, max, and min of angular velocity (degrees/s) and acceleration (m/s2) between select start and stop times were also outputted. Angular velocity and acceleration provided measures of magnitude and variability in practice speed and were calculated for each of the X, Y, and Z directions as well as their sum (i.e., total). To answer the specific research questions outlined for this secondary analysis, the following variables were used: duration, average total angular velocity (VX+VY+VZ), and standard deviation of acceleration. The standard deviation of acceleration was chosen as a primary focus because variability in acceleration has been shown to positively correlate with functional performance of the affected upper extremity post-stroke (Urbin et al., 2015).
Data Analysis
All data outputted by Matlab® were organized and further analyzed in Excel. The sum of the durations, as well as the angular velocity and acceleration outputs from the individual exercise sets were compared to those corresponding to the total exercise. Additionally, the percentages of data capture and active time were calculated for each participant and averaged across all assigned exercises. Four analyses were completed to answer the research questions: (1) amount of exercises with usable data captured by the accelerometer vs. number of self-reported exercises; (2) self-reported exercise duration vs. accelerometer recorded duration; (3) total average angular velocity across an entire exercise vs. total average angular velocity during individual exercise sets; and (4) trends observed in total average angular velocity and the standard deviation of acceleration over time.
Data Capture
To answer the first research question, the percentage of data capture was calculated by dividing the number of exercises captured via the accelerometers by the number of exercises reported by participants. For each participant, the percentage of data capture was calculated for each exercise on a weekly basis and then averaged over all weeks and exercises in the study period. We then calculated the average percentage of data capture across all participants to provide a single measure of data capture for the study. A similar method was used to calculate the percentage of exercises that were unreadable or lost due to technological failure for each participant.
Duration
The accelerometer output yielded two variables related to duration: (1) individual exercise set duration; and (2) total exercise duration, which included the time spent resting between sets. For each participant, the self-reported duration, accelerometer-recorded sum of individual exercise set duration, and accelerometer-recorded exercise duration were averaged for each participant and then across all participants in the study. Descriptive comparisons were made between (1) self-reported and accelerometer-recorded exercise durations; and (2) total exercise duration and the sum of individual exercise set durations. Additionally, the percent of active practice time during each exercise was calculated using accelerometer output by dividing the average of the sum of individual exercise set durations by average total exercise duration.
Angular Velocity
The total average angular velocity from each exercise was descriptively compared with the total average angular velocity obtained over individual exercise sets to determine the impact of rest breaks on these outputs. It was anticipated that total average angular velocity as a measure of speed would be greater in the individual exercise sets, as these data did not include rest breaks. Additionally, for participants with >50% data captured (n = 3), the individual exercise set average for total average angular velocity in each assigned exercise was graphed as a function of time and a line of best fit was found to determine the trend in total average angular velocity over the study period. To determine if trends observed over the study period were statistically significant, an unpaired t-test (α = 0.01) compared the first nine individual exercise sets' average total angular velocity to the last nine individual exercise sets' average total angular velocity.
Acceleration
For participants with >50% of data captured (n = 3), the standard deviation of acceleration in the X, Y, and Z planes was obtained for individual exercise sets and total exercise. The individual set values were then averaged within each exercise. These values were then graphed for each assigned exercise as a function of time and a line of best fit was found to determine the trend in individual exercise set average standard deviation of acceleration over the study period. In order to determine if trends observed over the study period were statistically significant, an unpaired t-test (α = 0.01) compared the first nine individual exercise sets' average standard deviation of acceleration to the last nine individual exercise sets' average standard deviation of acceleration.
See Supplementary Table 2 for a list of all variables and their calculation for these analyses.
Results
Data Capture
Across all participants, an average of 47.27% (range 17.33–70.41%) of all self-reported exercises were captured by the accelerometers and produced corresponding usable data in Matlab®. For three out of seven participants, data were captured for >50% of all self-reported exercises (P2, P3, P6). Technological failure accounted for an average of 30.5% (range 8.3–54.8%) of the remaining self-reported exercises. Five out of seven participants lost an entire week of accelerometer data due to technological failure. An average of 19.9% (range 2.3–50.69%) of the captured data illustrated no discernable pattern of activity. See Table 1 for details on participant data capture percentages.
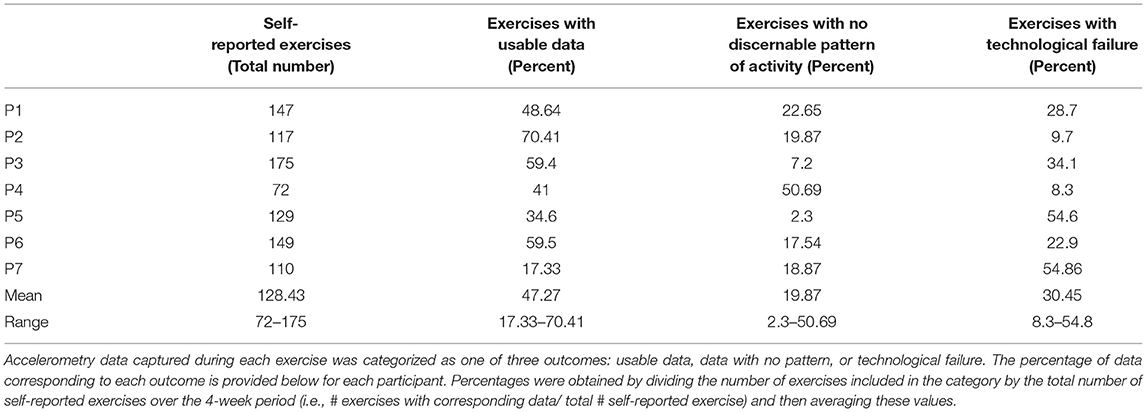
Table 1. Categorization of data capture and comparison to self-reported practice.
Duration
Self-reported total exercise duration was longer than accelerometer-recorded total exercise duration for five out of the seven participants. These five participants reported practicing for an average of 66.5 s longer (range 5.58–182.29) than accelerometer-recorded total exercise duration. Additionally, total exercise duration was on average 85.93 s longer (range 17.33–220.59) than the sum of the individual exercise set durations. Furthermore, during exercise, six out of the seven participants were active for 75% or more of the time. The average active time percentage across the seven participants was 85.22%, ranging from 63.99 to 95.5% active time. See Table 2 for average self-reported and accelerometer-recorded duration values for each participant, as well as active time percentages and Supplementary Figure 1 for graphs of the difference between self-reported and accelerometer-recorded durations for each participant's assigned exercise.

Table 2. Comparison of self-report and accelerometer recorded duration.
Angular Velocity
Across all participants a mean difference in average total angular velocity of 15.02 degrees/s (range 0.39–51.83) was found between the individual exercise sets and total exercises (includes rest breaks). See Table 3 for the total average angular velocity comparisons across all participants. When total average angular velocity measures were graphed over time, eight out of the nine slopes were positive with a range of 0.029–3.99. All three participants demonstrated a statistically significant increase in individual set total angular velocity in at least one activity over the study period (p < 0.01). P3 had the two largest positive slopes of 2.48 and 3.99. See Supplementary Figure 2 for graphs of these data with corresponding statistical analyses.
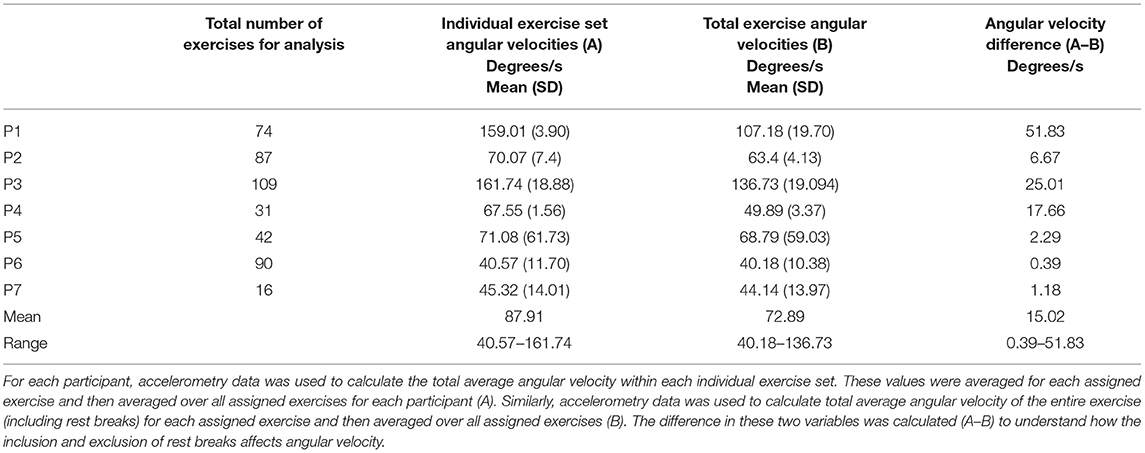
Table 3. Comparison of individual exercise set and total exercise total average angular velocity (degrees/s) across all exercises.
Standard Deviation of Acceleration
When analyzing the graphs of individual exercise set average standard deviation of acceleration over time, the slopes of all trendlines associated with P2 and P6 ranged from −0.0005 to 0.0004 and represented minimal change in individual exercise set average standard deviation of acceleration over the length of the study period. For P3, seven of the nine slopes were positive (range: −0.0017 to 0.0117) and five of these corresponded to a statistically significant increase in the individual exercise set average standard deviation of acceleration over the study period (p < 0.001). See Supplementary Figures 3–5 for graphs of these data and corresponding statistical analyses.
Discussion
This paper presents the secondary analysis of data captured via a commercially available accelerometer during completion of an upper extremity home program for individuals with chronic stroke. Our analysis found that data captured via the accelerometer across all participants on average was missing more than half of the self-reported exercises. However, self-reported duration and duration as measured by the accelerometer were similar in exercises captured. In addition, total angular velocity matched anticipated differences between total exercise and individual exercise set values. Furthermore, angular velocity provided a measure of change across time, demonstrating an increase for all participants. The standard deviation of acceleration also demonstrated a change over time for one participant.
Data capture is an area of primary concern, particularly considering the amount of data loss in our investigation was almost twice the amount reported by Uswatte et al. (2006). Factors that could have contributed to the level of technological failure include the length of time data were captured unchecked and the loss of the Bluetooth connection between the phone and the devices. To support increased data capture, mechanisms to allow for data capture directly on the device or to have real time capture and uploading to an online server for daily monitoring could be beneficial (Lee et al., 2018). Research grade accelerometers have developed these features (ActiGraph, 2018), but accelerometers have not been reported as consistently used in clinical practice post-stroke (Donoso Brown and Fichter, 2017).
Despite the limited data capture, the available data were consistent with self-reported data. The greatest difference observed on average was ~3 min when comparing self-reported and accelerometer-recorded duration. One explanation for the differences in self-reported and accelerometer-recorded duration could be the elapsed time between recording in the logbook and beginning the exercise. Our comparisons between accelerometer and self-reported data differ from previous research, which has often compared accelerometer outputs to standardized stroke assessments (Uswatte et al., 2006; Reiterer et al., 2008). These findings differ from a previous study which investigated reporting of daily paretic arm use to values captured via accelerometry and found that most participants either under or overreported their arm use in comparison to accelerometry measures (Waddell and Lang, 2018). One possible explanation for the difference between previous research and our study was that participants were directly recording practice in an individualized logbook, whereas previous investigations used a standardized self-reported assessment with a rating scale. This direct recording could have increased the accuracy between the self-reported and objective measure for data captured. Overall, having an objective report of time spent practicing could corroborate client report of practice and facilitate discussion about potential challenges. In addition, the ability to use total exercise duration and individual exercise set duration to calculate an active time percentage allows clinicians to understand more about how clients use breaks while engaging in home practice.
Our findings also suggest the potential for angular velocity and standard deviation of acceleration to monitor changes in practice. When graphed across time for the three participants with >50% data capture, the averages of individual exercise set total angular velocity indicated an increase in speed for all participants in at least two assigned exercises. This increase in speed would be anticipated as participants became more familiar with the exercises overtime. These findings suggest that the average of individual exercise set angular velocities could be valuable to clinicians in observing changes in practice. Additionally, the standard deviation of acceleration was able to capture a notable change for one participant. Another point of note was that neither of these variables appeared to change in a manner expected with the inclusion or removal of the intervention in the initial study (i.e., ABAB design). However, this finding is consistent with the results in the initial study as it did not demonstrate a consistent difference in adherence with the presence or absence of preferred music listening. Future investigations should continue to explore how best to use these variables for home practice and measurement of outcomes.
Limitations
There were several limitations to this secondary data analysis, including the limited diversity of the sample, selection of activities, potential error with data processing, and accuracy of self-reported data. Regarding the sample, all participants were in the chronic phase of stroke recovery; however, future investigations should include persons in the earlier phase of stroke recovery to allow for observation of change in variables like the standard deviation of acceleration. Exercises represented functional activities that occupational therapists would likely use as interventions for people post-stroke and were personalized to be motivating and relevant to each participant. Although these exercises allowed us to evaluate the use of accelerometers for real-life clinical activities; selection of other motor exercises that required different movements and positions of the upper extremity that were consistent across all participants may have allowed for more controlled data collection and precise analysis. Data processing contained many steps and future investigations would benefit from streamlining and automating many of these steps to allow for increased clinical utility and reduction of measurement error. For example, instead of visual inspection for start and stops, modifying the programming of the analysis program to identify these times based on minimum and maximum thresholds for angular velocity would decrease the time related to processing and reduce the influence of human error. Finally, while participants were trained to use the aphasia-friendly logbooks and competency was ensured prior to initiating independent practice, there is a potential for error and inaccuracies with collecting self-reported start and stop times. This error could impact how the .log files were initially cut during data processing, as well as comparisons made between self-reported and accelerometer-recorded duration.
Future Research
Future research can explore a variety of areas to further increase the potential of using commercially available accelerometers for home programs in research and clinical settings. First, cloud-based monitoring of accelerometer data during home exercise could potentially increase data capture and support real-time, technology-related problem solving. It would also be beneficial to compare the results of this study to a baseline study where exercises are performed in the presence of a rehabilitation therapist to mitigate data collection and technological errors. Additionally, machine learning could be investigated to increase the accessibility of clinically meaningful data for clients and rehabilitation therapists to receive feedback more easily. These potential areas of exploration (machine learning and cloud-based monitoring) would eliminate many technological issues and data processing steps, thus closing the gap between human-computer interaction challenges and margin of error.
In addition to refining the human computer interaction within the use of accelerometers for engaging in home programs, exploration of the utilization of these devices with virtual reality applications is an area for future investigations. Some initial explorations of combining accelerometry with virtual reality have used the accelerometer to monitor physical activity levels (Gomes et al., 2019), while others have aimed to create a device that can control objects in a virtual space (Perng et al., 2020). Findings from our study can support further integration into virtual reality applications by identifying variables of potential interest when monitoring practice remotely.
Conclusions
Our study specifically explored duration, angular velocity, and standard deviation of acceleration outputs, which can provide key feedback regarding practice times, quality of practice, and improvement in function over time during post-stroke rehabilitation programs. Overall, this study increases our understanding of how to interpret accelerometer output variables as clinically meaningful data during home exercise programs for post-stroke adults. Using commercially available accelerometers promotes the accessibility and affordability of accelerometers to be used in home environments, unlike related studies that often use research-grade devices. While the commercially available accelerometers produced data that aligned with the anticipated outcomes for the variables considered, challenges regarding the human-computer interaction between post-stroke adults and use of accelerometers must be overcome prior to implementation of this technology into real-world stroke rehabilitation programs. Additional research should be conducted to explore ways to increase data capture and expedite data processing. Ultimately, accelerometer data should be easily translated into information that is meaningful and motivating both to the client and rehabilitation therapists, as feedback is an important factor in the stroke rehabilitation process (Lee et al., 2018).
Data Availability Statement
The raw data supporting the conclusions of this article will be made available by the authors, without undue reservation.
Ethics Statement
The studies involving human participants were reviewed and approved by Duquesne University Institutional Review Board. The patients/participants provided their written informed consent to participate in this study.
Author Contributions
KD: primary person responsible for completion of secondary data processing and analysis, wrote first draft of entire paper, and major editing on paper submission. ED: co-PI on initial study, supported data processing and analysis, and major editing on paper submission. RM: lead developer of custom Matlab® software, supported data processing and analysis, and major editing. SW: co-PI on initial study and major editing on paper submission. All authors contributed to the article and approved the submitted version.
Funding
The initial study was funded through an internal Duquesne University grant from the Aging Research and Teaching Consortium.
Conflict of Interest
ED and SW received internal grant funding for the initial study through their employer.
The remaining authors declare that the research was conducted in the absence of any commercial or financial relationships that could be construed as a potential conflict of interest.
Acknowledgments
We would like to acknowledge Brian Adams and all other students who have worked on creating and testing the custom software for this analysis. We are also grateful to the participants of the initial study.
Supplementary Material
The Supplementary Material for this article can be found online at: https://www.frontiersin.org/articles/10.3389/frvir.2021.642434/full#supplementary-material
References
ActiGraph (2018). Introducing the CENTREPOINT insight watch [Infographic]. actigraphcorp.com. Available online at: https://s3.amazonaws.com/actigraphcorp.com/wp-content/uploads/2018/09/19142005/ActiGraph_SalesSheet_CentrePointInsightWatch2018_DarkGrey_FINAL.pdf (accessed March 1, 2020).
Bailey, R.R., Klaesner, J.W., and Lang, C.E. (2015). Quantifying real-world upper limb activity in nondisabled adults and adults with chronic stroke. Neurorehabil. Neural Repair 29, 969–978. doi: 10.1177/1545968315583720
Donoso Brown, E.V., Eskander, J., Wallace, S.E., and Mull, J. (2020b). Effects of preferred music listening on adherence to upper extremity home programs. Phys. Occupat. Ther. Geriatr. 27, 377–400. doi: 10.1080/02703181.2020.1865500
Donoso Brown, E. V., and Fichter, R. (2017). Home programs for upper extremity recovery post-stroke: a survey of occupational therapy practitioners. Top. Stroke Rehabil. 24, 573–578. doi: 10.1080/10749357.2017.1366013
Donoso Brown, E. V., Nolfi, D., Wallace, S. E., Eskander, J., and Hoffman, J. M. (2020a). Home program practices for supporting and measuring adherence in post-stroke rehabilitation: a scoping review. Top. Stroke Rehabil. 27, 377–400. doi: 10.1080/10749357.2019.1707950
Frost, R., Levati, S., McCllurg, D., Brady, M., and Williams, B. (2017). What adherence measures should be used in trials of home-based interventions? A systematic review of the validity, reliability, and acceptability of measures. Arch. Phys. Med. Rehabil. 98, 1241–1256. doi: 10.1016/j.apmr.2016.08.482
Gomes, T. T., Schujmann, D. S., and Fu, C. (2019). Rehabilitation through virtual reality: physical activity of patients admitted to the intensive care unit. Revista Brasileira de Terapia Intensiva 31:456. doi: 10.5935/0103-507X.20190078
Gough, M., McElroy, T., Donoso Brown, E. V., Neilan Miller, R., Kessler, F., and Gallipoli, J. (2019). Exploring the use of Microsoft bands to measure task-repetitive practice. Am. J. Occupat. Therapy 73:7311500049. doi: 10.5014/ajot.2019.73S1-PO8015
Lang, C. E., and Birkenmeier, R. L. (2014). Upper-Extremity Task-Specific Training After Stroke or Disability: A Manual for Occupational Therapy and Physical Therapy. Bethesda, MD: AOTA Press.
Lee, S. I., Adans-Dester, C.P., Grimaldi, M., Dowling, A.V., Horak, P.C., Black-Schaffer, R.M., et al. (2018). Enabling stroke rehabilitation in home and community settings: a wearable sensor-based approach for upper-limb motor training. IEEE J. Transl. Eng. Health Med. 6, 1–11. doi: 10.1109/JTEHM.2018.2829208
Noorkõiv, M., Rodgers, H., and Price, C. I. (2014). Accelerometer measurement of upper extremity movement after stroke: a systematic review of clinical studies. J. Neuroeng. Rehabil. 11:144. doi: 10.1186/1743-0003-11-144
Perng, S. S., Hu, N. T., Tsai, P. S., Wu, T. F., and Chen, J. Y. (2020). Wearable devices to control objects in virtual reality. Sensors Mater. 32, 2007–2015. doi: 10.18494/SAM.2020.2789
Reiterer, V., Sauter, C., Klösch, G., Lalouschek, W., and Zeitlhofer, J. (2008). Actigraphy–a useful tool for motor activity monitoring in stroke patients. Eur. Neurol. 60, 285–291. doi: 10.1159/000157882
Rowe, V. T., and Neville, M. (2019). Measuring reliability of movement with accelerometry: Fitbit® versus ActiGraph®. Am. J. Occupat. Therapy 73, 1–6. doi: 10.5014/ajot.2019.030692
Standen, P. J., Threapleton, K., Connell, L., Richardson, A., Brown, D. J., Battersby, S., et al. (2015). Patients' use of a home-based virtual reality system to provide rehabilitation of the upper limb following stroke. Phys. Ther. 95, 350–359. doi: 10.2522/ptj.20130564
Urbin, M. A., Bailey, R. R., and Lang, C. E. (2015). Validity of body-worn sensor acceleration metrics to index upper extremity function in hemiparetic stroke. J. Neurol. Phys. Therapy 39:111. doi: 10.1097/NPT.0000000000000085
Uswatte, G., Giuliani, C., Winstein, C., Zeringue, A., Hobbs, L., and Wolf, S. L. (2006). Validity of accelerometry for monitoring real-world arm activity in patients with subacute stroke: evidence from the extremity constraint-induced therapy evaluation trial. Arch. Phys. Med. Rehabil. 87, 1340–1345. doi: 10.1016/j.apmr.2006.06.006
Waddell, K. J., and Lang, C. E. (2018). Comparison of self-report versus sensor-based methods for measuring the amount of upper limb activity outside the clinic. Arch. Phys. Med. Rehabil. 99, 1913–1916. doi: 10.1016/j.apmr.2017.12.025
Keywords: accelerometers, rehabilatation, stroke, upper extremity, home exercise, hemiparesis
Citation: de Castro KN, Donoso Brown EV, Miller Neilan R and Wallace SE (2021) Feasibility of Using Commercially Available Accelerometers to Monitor Upper Extremity Home Practice With Persons Post-stroke: A Secondary Data Analysis. Front. Virtual Real. 2:642434. doi: 10.3389/frvir.2021.642434
Received: 16 December 2020; Accepted: 18 March 2021;
Published: 21 April 2021.
Edited by:
Danielle Levac, Northeastern University, United StatesReviewed by:
Savita G. Bhakta, University of California, San Diego, United StatesMinxin Cheng, Northeastern University, United States
Copyright © 2021 de Castro, Donoso Brown, Miller Neilan and Wallace. This is an open-access article distributed under the terms of the Creative Commons Attribution License (CC BY). The use, distribution or reproduction in other forums is permitted, provided the original author(s) and the copyright owner(s) are credited and that the original publication in this journal is cited, in accordance with accepted academic practice. No use, distribution or reproduction is permitted which does not comply with these terms.
*Correspondence: Elena V. Donoso Brown, ZG9ub3NvYnJvd25lQGR1cS5lZHU=