- 1Department of Urology, Soroka University Medical Center, Faculty of Health Sciences, Ben-Gurion University of the Negev, Be’er-Sheva, Israel
- 2Soroka Clinical Research Center, Soroka University Medical Center, Faculty of Health Sciences, Ben-Gurion University of the Negev, Be’er-Sheva, Israel
Purpose: The outcome of the present study is to determine variables available at the time of diagnosis able to predict disease reclassification in prostate cancer (PCa) patients on active surveillance (AS).
Materials and methods: From January 2014 to December 2018, 114 consecutive low-risk PCa patients were enrolled in AS protocol according to inclusion criteria: PSA ≤ 10 ng/ml, Gleason score (GS) ≤ 6 or International Society of Urological Pathology (ISUP) Gleason grade group (GG) 1, maximum cancer core length (MCCI) < 50%, and ≤ 2 positive cores on biopsy. Patients were followed with confirmatory and yearly prostate biopsy, semi-annually with prostate-specific antigen (PSA), and digital rectal examination (DRE). Disease reclassification was defined as upgrading biopsy: GS ≥ 3 + 4 = 7 or ISUP GG ≥ 2, more than two positive cores, MCCI > 50%, or changes in serum PSA > 10 ng/ml. Uni- and multivariate Cox proportional hazards regression models, receiver performance curves (ROC), and Kaplan-Meier analysis were performed to characterize AS criteria and identify variables that predict disease reclassification. Finally, decision curve analysis (DCA) was performed to evaluate the net benefit of using PV in addition to standard variables to predict disease reclassification.
Results: PCa was diagnosed by systematic transrectal ultrasound-guided prostate biopsy (TRUS-Bx). The mean (range) follow-up was 32.7 (12-126) months. Disease reclassification occurred in 46 patients (40%). On univariate statistical analysis prostate specific antigen (PSA) (p = 0.05), prostate volume (PV) (p = 0.022), PSA density (PSAD) (p < 0.001) and number of positive cores (p = 0.021) were significant factors for disease reclassification. On the multivariate analysis, PSAD (p < 0.001) and PV (p = 0.003) were the only statistically significant independent variables to predict disease reclassification. A PSAD cut-off of 0.16 ng/ml² and a PV cut-off of 44 ml gave a maximal area under the curve, 0.69 and 0.63, respectively. Kaplan-Meier analysis showed that the median survival free from disease reclassification during AS was almost doubled in patients with PSAD < 0.16 ng/ml2 or PV > 44 ml. DCA showed a positive net benefit and clinical usefulness of the model, including PV, to predict disease reclassification between threshold probabilities of 20-50%.
Conclusions: PV and PSAD significantly predicted failure from AS in our patients. Patients with a baseline PV of fewer than 44 ml would be more likely to have disease reclassification and unsuitable for acceptable AS protocols. Therefore, we believe that PV may help to select PCa patients for AS, especially in populations where the use of mpMRI is limited.
Introduction
Active surveillance (AS) is an alternative approach to immediate medical intervention for men with low-risk diseases and selected patients with intermediate-risk prostate cancer (PCa) (1, 2). The AC can reduce the harm from curative treatment for selected men, and in the long term, this is a safe and viable option for patients with low to intermediate-risk PCa (3, 4). Over the past two decades, data from several institutions have demonstrated the overall safety of AS, with 5- and 10-yr cancer-specific survival rates consistently exceeding 94% (5).
A potential disadvantage in this approach is the presence or development of more aggressive undiagnosed disease in these patients that need continuous monitoring and caution before selection (6).
The application of multiparametric magnetic resonance imaging (mpMRI) in AS protocols for patients with low-risk PCa has been approved and included in international guidelines (7). However, the necessity of using mpMRI for decision-making in patients with AS has not yet been proven. Baccaglini et al., in a systematic review and meta-analysis of the accuracy of MRI-guided prostate biopsy in patients under AS, concluded that further studies focusing on the role of mpMRI as a single method in AS are warranted (8). Rajwa et al., in another systematic review and meta-analysis study of the role of mpMRI during AS, suggested that mpMRI alone in AS patients are unreliable in reclassifying the disease (9).
Recently, diagnostic and prognostic models using new biomarkers such as prostate health index (PHI), four-kallikrein panel (4K score), and prostate cancer antigen 3 (PCA3) have also shown their predictive value in AS (10). Cantiello et al. added PCA3 and PHI to the Prostate Cancer Research International Active Surveillance Study (PRIAS) (11) Epstein criteria (12) for selecting patients for AS, resulting in improved prognostic performance (13). Unexpectedly, while Lin DW et al. evaluated the utility of 4K score prediction of high-grade PCa in AS study, they found that prostate volume (PV) strongly predicted the presence of higher-grade PCa (14). Additionally, a positive 17-gene prostate genomic RNA (GPS) test is associated with a significantly increased risk of high-grade PCa (15). However, clear advantages in obtaining accuracy and cost-effectiveness for its regular use in AS protocols have yet to be demonstrated.
Therefore, the outcome of the present study is to determine variables available at the time of diagnosis able to predict disease reclassification, especially where mpMRI and sophisticated genetic tests are not available or very expensive.
In this study, we summarized our experience in a cohort of PCa patients who have been diagnosed with systematic transrectal ultrasound (TRUS)-guided biopsy and were monitored in AS protocol. Interestingly, we found that patients with small PV were at higher risk of disease reclassification.
Materials and methods
Soroka University Medical Center’s ethics committee approved the study and waived informed consent requirements, and all methods were performed in accordance with the relevant guidelines and regulations (0238 – 20 – SOR). In this single-institution cohort study, we retrospectively reviewed data of 114 consecutive patients eligible for AS criteria out of 437 patients diagnosed with PCa by systematic TRUS-Bx at our institution between January 2014 and December 2018. None of the study patients underwent mpMRI before the biopsy. Low-risk PCa patients were considered candidates for AS according to strict inclusion criteria proposed by Johns Hopkins and Toronto University: PSA ≤ 10 ng/ml, Gleason score (GS) ≤ 6, or International Society of Urological Pathology (ISUP) Gleason grade group (GG) 1, maximum cancer core length (MCCI) < 50%, and ≤ 2 positive cores on biopsy (5, 16). Patients who did not meet these criteria were excluded from the study. PSA levels were measured twice a year without clinical signs or symptoms for further evaluation. Following the strict AS inclusion criteria mentioned above, men included in the AS group were biopsied annually or earlier if this was due to an alarming increase in PSA levels. Almost all men underwent confirmatory biopsy within 12 months of diagnosis. Initial and repeat biopsies consisted of a minimum of ten cores. The PV was obtained by TRUS measurements performed by a single operator; consequently, PSAD was calculated (17). Disease reclassification was defined as upgrading biopsy: GS ≥ 3 + 4 = 7 or GG 2, more than two positive cores, MCCL > 50%, or changes in serum PSA > 10 ng/ml (5, 16). Most patients with documented disease reclassification underwent curative treatment such as radical surgery or radiation therapy.
Statistical analyses
Study population characteristics were summarized using descriptive statistics. Continuous variables were compared using a t-test for normally distributed variables and Mann–Whitney U test for non-normally distributed variables. The Chi-square test was used for categorical variables. Results are presented as means ± standard deviations (SDs) for normally distributed continuous variables and as medians and interquartile ranges (IQRs) for non-normally distributed variables. Categorical data are presented as percentages. To determine the optimal cut-off of the PSAD and PV, we established receiver operating characteristic (ROC) curves. Sensitivity, specificity, and Youden’s J statistics for each parameter were calculated. Kaplan–Meier survival curves and estimates were used to analyze the relationship between disease reclassification and PSAD or PV category, above or below the determined threshold. Multivariable analysis was performed using Cox proportional hazard regression for disease reclassification during the entire follow-up period. The results of the survival model are presented as hazard ratios (HRs) with 95% CI. Finally, we performed a decision curve analysis (DCA) to calculate the net benefit and clinical usefulness of applying PV to predict disease reclassification in patients with low-risk PCa (18). Statistical significance was defined at p < 0.05. Statistical analyses were performed using packages “survival” and “dcurves” in the R software, version 4.0.2
Results
A total of 114 patients who underwent diagnostic systematic TRUS-guided biopsy met the study inclusion criteria. Demographic and clinical characteristics of all patients eligible for AS criteria and disease reclassification status are listed in Table 1. The mean follow-up was 32.7 months among the selected patients, ranging from 12 to 126 months. In all patients, the mean (SD) PSA value was 6.35 (2.45) ng/ml, the mean (SD) PSAD was 0.18 (0.10) ng/ml², and the mean (SD) PV was 42.79 (24.41) ml. The disease was stable in 68 (60%) patients, and disease reclassification was observed in 46 patients (40%). Of the 46 patients with disease reclassification, 17 (37%) upgraded to GS ≥ 7 (GG ≥ 2), 18 (40%) had elevated PSA > 10 ng/ml, four (9%) had an increase in the number of cores involved, and four (9%) had a rise in MCCI.
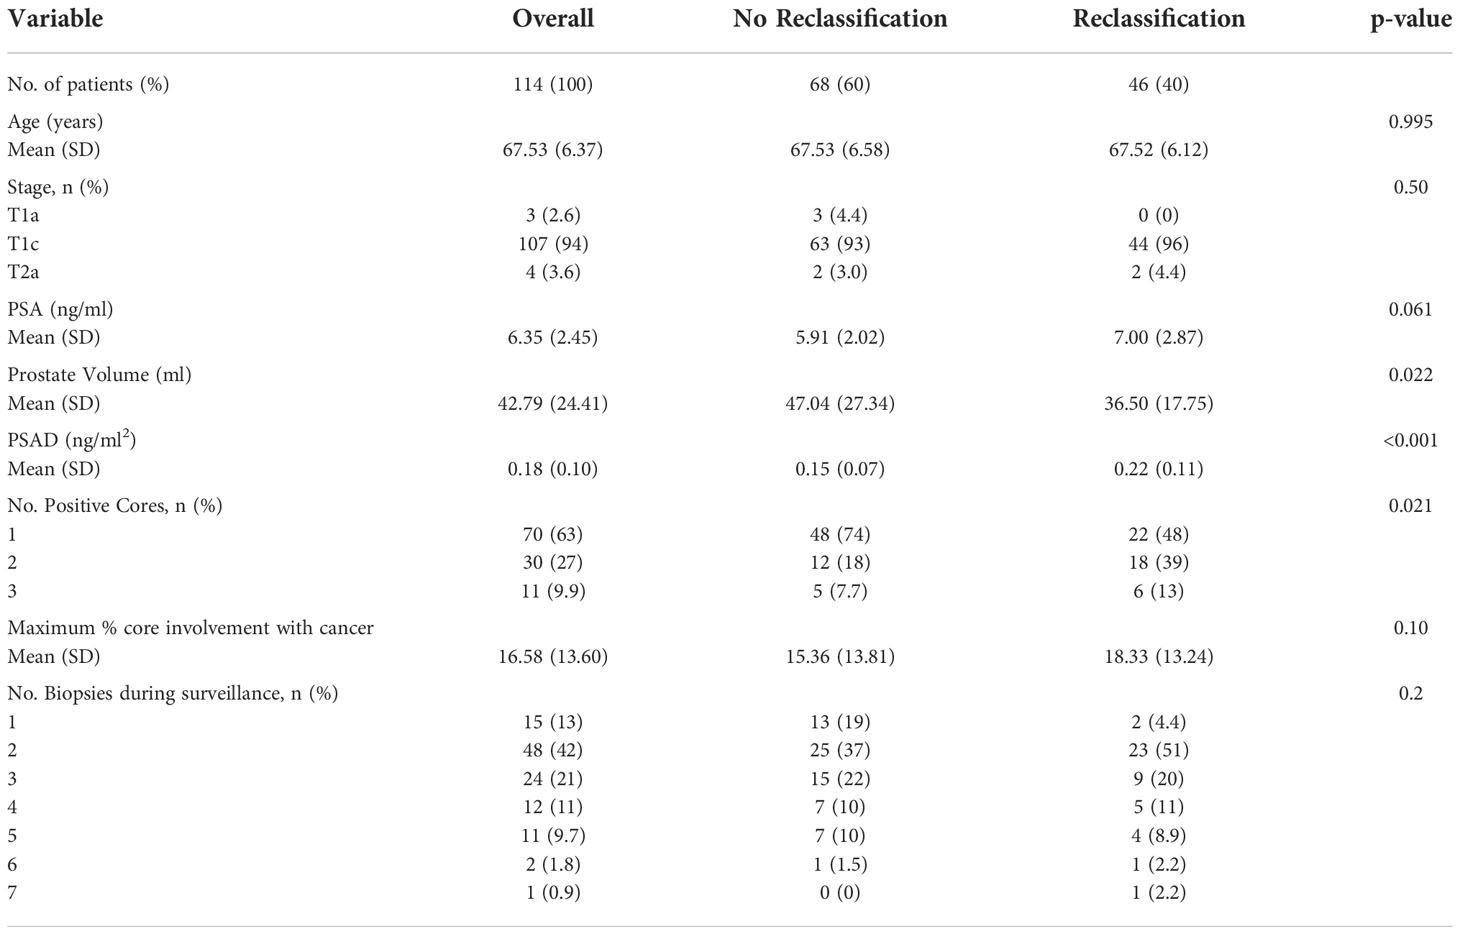
Table 1 Clinical characteristics of all patients eligible for active surveillance and reclassification status.
On univariate statistical analysis PSA (p = 0.05), PV (p = 0.022), PSAD (p < 0.001) and number of positive cores (p = 0.021) were significant factors for disease reclassification. Since PSAD is directly derived from PV, we created two models for greater statistical reliability in multivariate analysis. In the multivariate analysis, PSAD (p < 0.001) and PV (p = 0.003) were the only statistically significant independent variables to predict disease reclassification (Table 2).
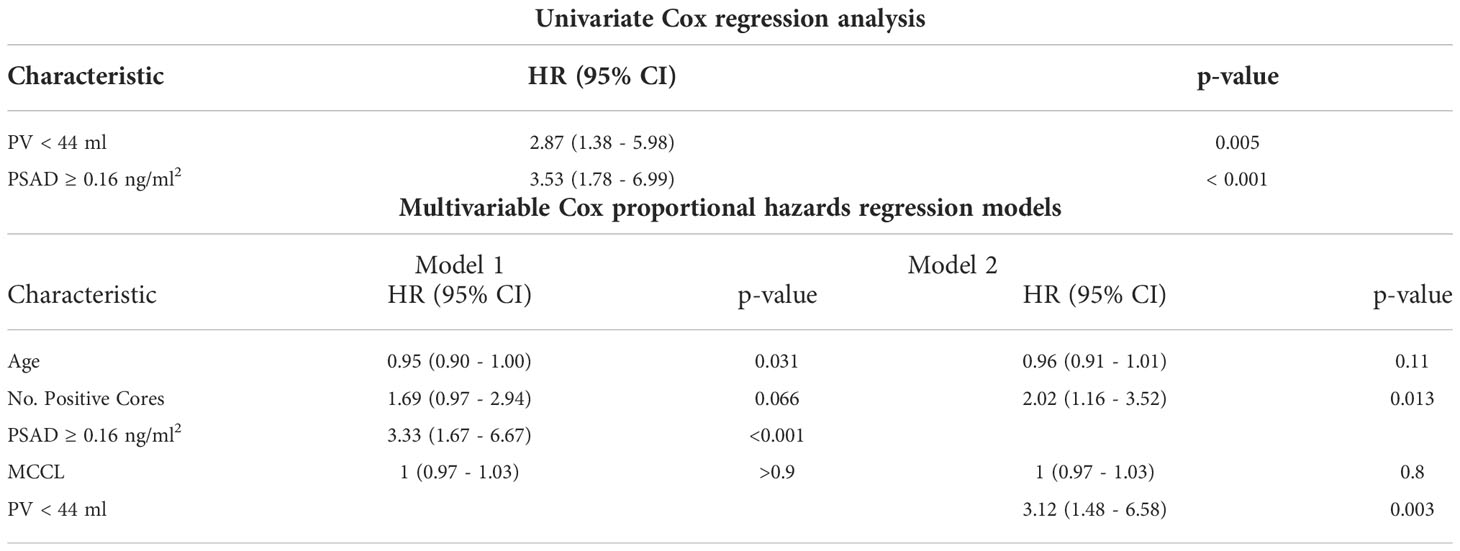
Table 2 Univariate and multivariate Cox proportional hazards regression models for disease reclassification.
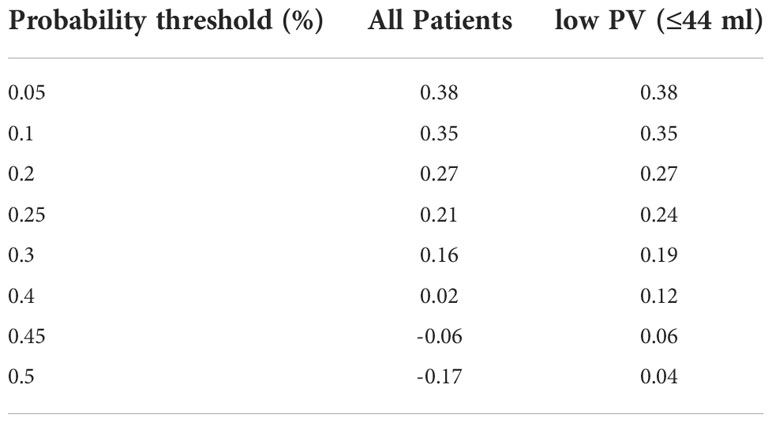
In order to estimate the optimal cut-off value for PSAD and PV, a ROC curve was plotted (Figure 1). The coordination points of the curve derived a cut-off PSAD with the best balance between sensitivity and specificity in identifying patients with disease reclassification (Figure 1A). According to the coordinates of the curve, a PSAD cut-off of 0.16 ng/ml² was found (sensitivity: 0.7391, specificity: 0.6176, AUC: 0.6913, Youden’s J: 0.3567). The optimal cut-off value of PV estimated by the ROC curve was 44 ml (sensitivity: 0.4706, specificity: 0.8043, AUC: 0.6271, Youden’s J: 0.2749) (Figure 1B). Using the Kaplan-Meier method, we generated a risk stratification of disease reclassification based on our calculated PSAD and PV cut-off values (Figure 2). At diagnosis, patients with PSAD greater than 0.16 ng/ml² were more likely to experience disease reclassification than patients with PSAD less than 0.16 ng/ml². The median time of AS was 93 months in patients with initial PSAD less than 0.16 ng/ml² versus 50 months in patients with PSAD greater than 0.16 ng/ml² (Figure 2A). Similarly, the median time of AS was 92 months in patients with initial PV of more than 44 ml versus 56 months in patients with PV less than 44 ml (Figure 2B). The cumulative risk for disease reclassification (HR and 95% CI) over time calculated by Kaplan Meier estimates for PSAD and PV cut-off values is shown in Table 3. DCA showed a positive net benefit and clinical usefulness of the model, including PV, to predict 6-year disease reclassification between threshold probabilities of 20-50% (Table 4; Figure 3).
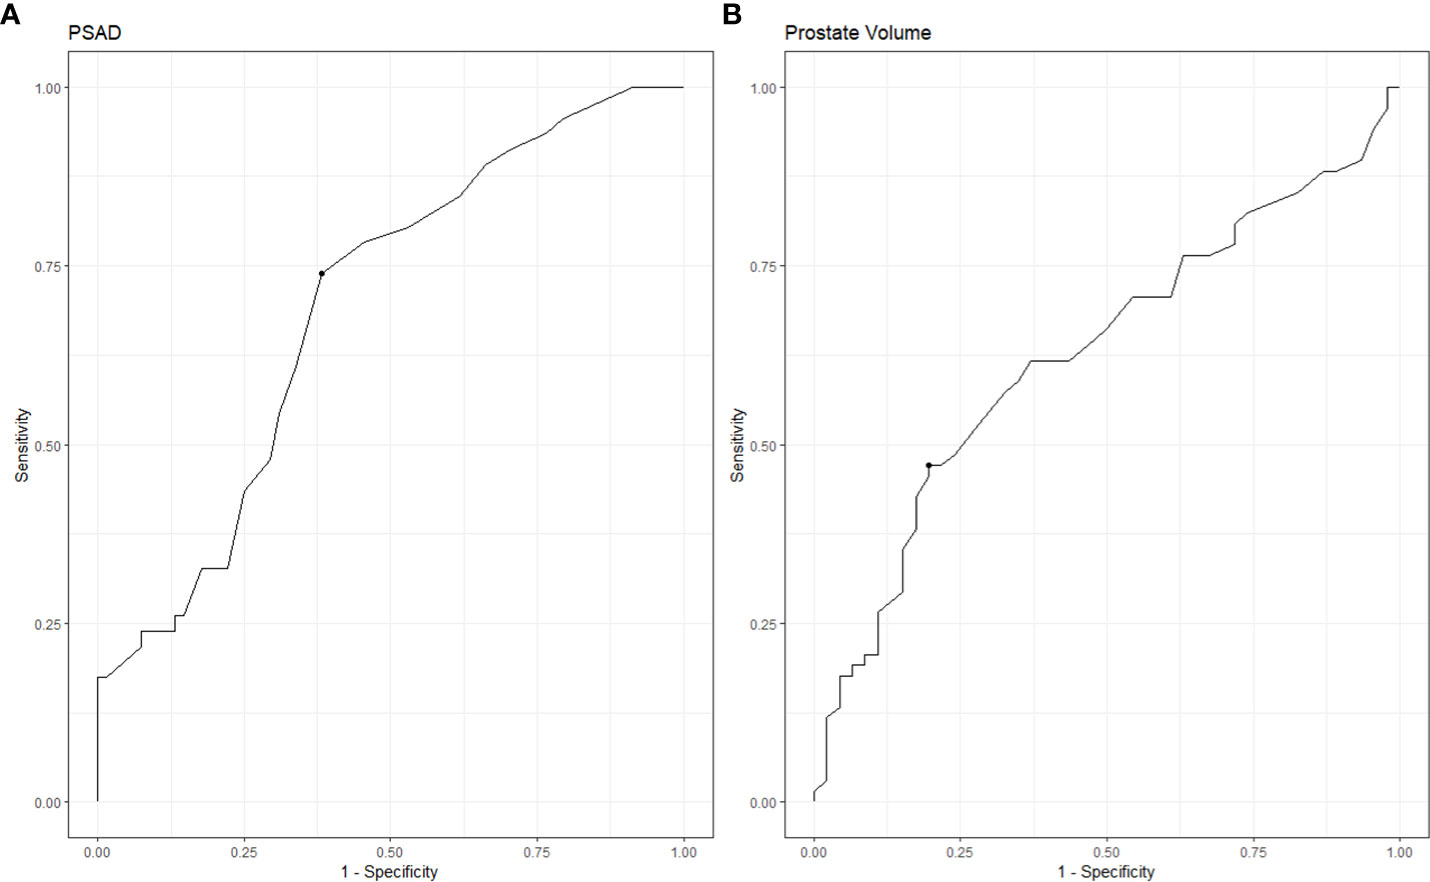
Figure 1 ROC analysis of PSAD and PV for predicting disease reclassification. (A) ROC analysis for PSAD. (B) ROC analysis for PV.

Figure 2 Kaplan-Meier estimates of time to disease reclassification. (A) Risk stratification of disease reclassification by PSAD cut-off of 0.16 ng/ml2. (B) Risk stratification of disease reclassification by PV cut-off of 44 ml.
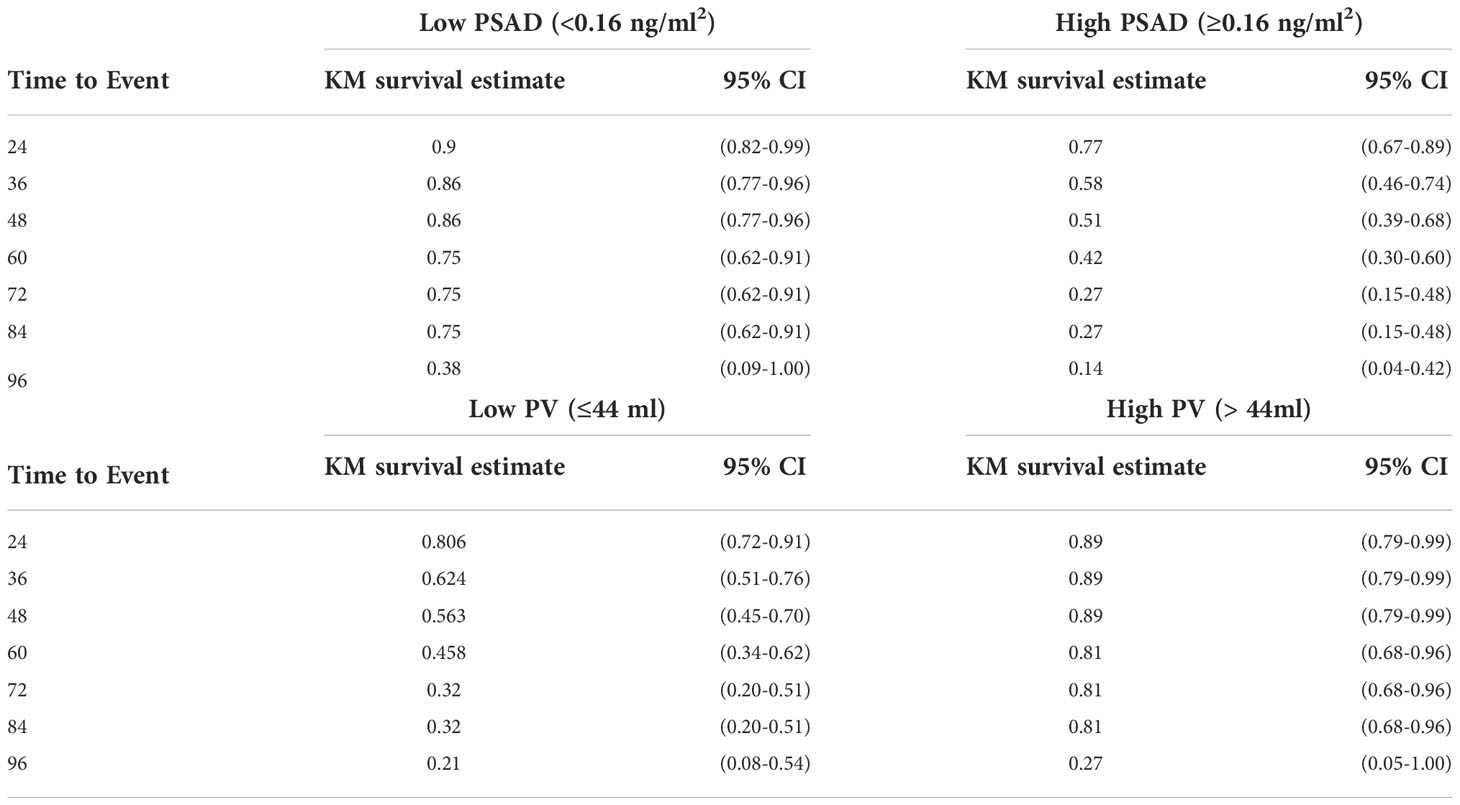
Table 3 Kaplan-Meier estimate for time to disease reclassification according to PSAD and PV cut-off values.
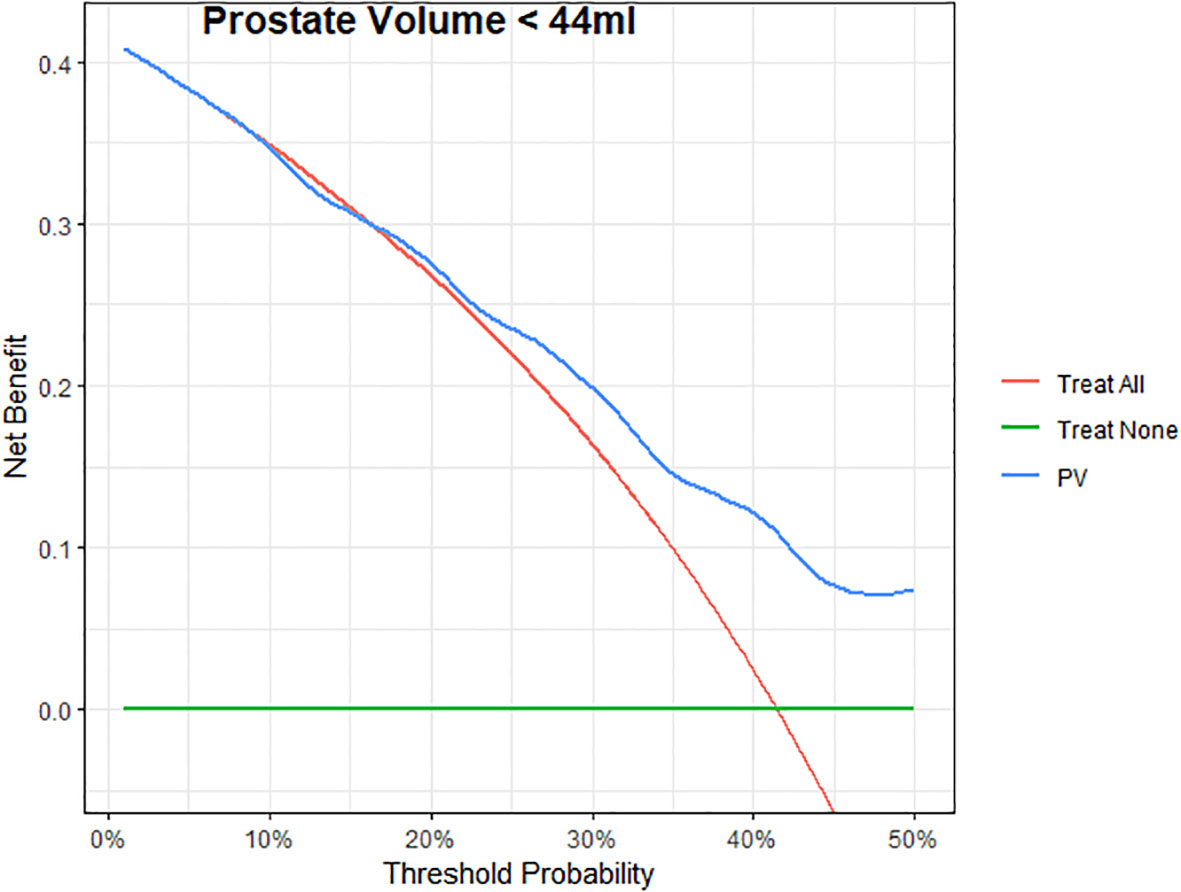
Figure 3 Decision curves for Prostate volume (PV) to predict 6-years to PCa reclassification in patients. The green line represents the net benefit of treating no patients; the red line is the net benefit of treating all patients similarly; the blue line is the net benefit of treating patients according to the PV model.
Discussion
This study identified PV, in addition to PSAD, as a powerful independent predictor for disease reclassification in low-risk PC patients. Most importantly, these measures are simply calculated and available at the time of initiating AS protocol.
Recently, several novel nomograms were introduced to identify candidates for AS using mpMRI criteria. Gandaglia et al. showed that adding mpMRI findings to the PRIAS protocol for AS patients’ selection would increase the number of patients eligible for AS by 10% without increasing the risk of upgrading after radical prostatectomy (19). Luzzago et al. also developed a nomogram to identify candidates for AS, which increased men’s eligibility for AS by 25% to 35%, compared to the PRIAS and Johns Hopkins criteria (20). In contrast, the initial results of the ASIST study did not show an increase in reclassification of AS patients when MRI-targeted biopsies were added to systematic biopsies. However, after two years of follow-up, the reclassification rate was lower in the MRI group than in the systematic biopsy group (13% vs. 27%) (21). Lately, Lantz et al. developed and internally validated a MAP model for selecting AS patients, resulting in a 25% increase in patients eligible for AS compared to the PRIAS criteria (22). These models are built on adding new criteria such as mpMRI PI-RADS Systems to the classic Epstein and PRAIS criteria to identify patients suitable for AS. Nevertheless, although these models are very promising, they should be tested by external validations and be accepted into guidelines before they can be used in daily practice.
The classical criteria for evaluating candidates for AS were proposed by D’Amico (23), and Epstein (12) are PSA < 10 ng/ml, GS ≤ 6, clinical stage T1–T2a, and fewer than three biopsy cores positive, ≤ 50% cancer in any core. These criteria are recommended for use by the National Comprehensive Cancer Center (NCCN) and the European Association of Urology (EUA) (24).
PSAD is currently accepted as having a role in identifying patients with low-risk diseases for AS (1). Nordström et al. analyzed biopsy results from 5291 men in the population-based STHLM3 study, suggesting that including PSA density in the diagnostic algorithm helps evaluate men with low-grade PCa (25). Maggi et al., in a long-term outcomes study of PCa patients on AS, found that men diagnosed with GG1 and GG2 and PSAD 0.15 ng/ml2 or greater had worse upgrade-free survival and lower treatment-free survival (3). Bruno et al. found that PSA density is not affected by the presence of prostatic inflammation as a confounding factor in diagnosing PCa; therefore, it should be used for early screening of patients at risk for prostate cancer (26). It has been demonstrated that PSAD predicts aggressive prostate cancer (27). It was an independent predictor of GS upgrade in radical prostatectomies and repeat prostate biopsies (28, 29). Recently, Falagario et al. investigated optimal diagnostic strategies based on the combined use of PSAD and MRI in patients at risk for developing PCa. They concluded that the combined results of PSAD and MRI help guide the decision to perform a biopsy in PI-RADS 4–5 or PI-RADS 3 if PSAD > 0.10 or PSAD > 0.2 (30).
In our low-risk prostate cancer patients eligible for AS, PSAD independently predicted disease reclassification. Analysis of the ROC curve reveals that a PSAD cut-off value of 0.16 ng/ml2 has the best ability to identify adverse pathological outcomes.
The use of PV in routine AS protocols has not been described yet (31). Many years ago, it was discussed in the literature that smaller prostates are associated with more aggressive diseases. Freedland et al. found that men with smaller prostates had more advanced diseases and suggested that prostate size is an important prognostic variable in predicting biochemical progression (32). Briganti et al. also concluded that small prostates were associated with higher grade PCa at biopsy and radical prostatectomy, and men with small prostates were a priori predisposed to higher grade PCa (33). However, these observations could be explained by the fact that the association between PV and high-grade disease may be a consequence of the grade-dependent performance of PSA rather than proper tumor biology (34). In 2008, Turley et al. found that the GS upgrading rate increased as PV decreased (35). In the same year, Dong et al. identified clinical and pathological parameters that predict pathological upgrading after radical prostatectomy and found that PV significantly predicts upgrading PCa (36). In 2012 Roobol et al. concluded that PV is a critical element in predicting the risk of prostate cancer on biopsy (37). Yamada et al. investigated the ability of current AS protocols to predict upstaging of low-risk PCa in Asian men undergoing radical prostatectomy. They added the measuring of PV to the PRIAS criteria, and when the prostate volume was greater than 50 ml, the predictive rate of upstaging of low-risk PCa improved (38).
Although everyone agrees that PV strongly predicts higher-grade PCs at biopsy and predicts upstaging of low-risk PCs at follow-up, the use of PV as an additional criterion for selecting AS patients was rarely discussed in the literature.
More recently, a meta-analysis was published using data of 5,530 men from 25 established cohorts within the Movember Foundations GAP3 Consortium to identify and validate predictors of disease reclassification at 1 or 4 years to support the risk-based selection of patients suitable for AS. They concluded that with a decrease in prostate PV, there is an increased risk of upgrading GG on biopsy at 1-year follow-up, and PV should be considered for selecting patients eligible for AS (39). In agreement, our ROC curve analysis showed that a PV of less than 44 mL could predict disease reclassification during AS. The Kaplan-Meier analysis also showed that many patients with a baseline PV ≤ 44 ml had dropped out of AS. Consequently, DCA for the predictive models was developed to evaluate the possibility of adding PV to the base model with classic criteria for predictive disease reclassification in patients with low-risk PCa. DCA showed a positive net benefit and clinical usefulness of the model, including PV, to predict disease reclassification in patients with low-risk PCa between threshold probabilities of 20-50% (Table 4; Figure 3).
Because PSA is not a significant predictor of disease reclassification in our analyses and the fact that PSAD, derived from PSA and PV, is a powerful predictor makes PV a valid variable to consider. In our study, all 17 patients with disease reclassification due to an increase in Gleason GG had a PV ≤ 44 ml.
There are several limitations to this study. First, this is a single-center retrospective study, leading to a limited sample size of enrolled patients in our cohort. Second, our database of prostate biopsies includes patients who underwent TRUS-Bx without MRI diagnostics because between January 2014 and December 2018, MRI-targeted biopsy was still limitedly used in our country and at our institute. At that time, we performed the standard systematic 12-core TRUS-Bx without mpMRI for the diagnosis of prostate cancer. Third, the study interval was five years, but the mean follow-up was 32.7 months, ranging from 12 to 126 months. In addition, since this was a single-series study, the results should be replicated and validated in other independent cohorts and possibly with different clinical parameters. Despite these limitations, we believe that the results obtained from this study could save many patients from being falsely included in AS.
Conclusion
The use of PV as a criterion in selecting patients with low-risk PCa for AS has not been previously discussed. PV and PSAD significantly predicted failure from AS in our patients. Patients with a baseline PV of fewer than 44 ml would be more likely to have disease reclassification and unsuitable for acceptable AS protocols. Therefore, we believe that PV may help select prostate cancer patients for AS where the use of mpMRI is limited.
Data availability statement
The data analyzed in this study is subject to the following licenses/restrictions: All relevant data are within the article. However, according to the National laws and regulations, the data cannot be uploaded to the data repository. The data can be shared upon the request addressed to Prof. Eitan Lunenfeld, MD, MHA, Head of IRB, Soroka University Medical Center, Beer-Sheva, Israel.ZWl0YW5fbEBjbGFsaXQub3JnLmls. Requests to access these datasets should be directed to Prof. Eitan Lunenfeld, MD, MHA, Head of IRB, Soroka University Medical Center, Beer-Sheva, Israel.ZWl0YW5fbEBjbGFsaXQub3JnLmls.
Ethics statement
Ethical review and approval was not required for the study on human participants in accordance with the local legislation and institutional requirements. Written informed consent from the patients was not required to participate in this study in accordance with the national legislation and the institutional requirements.
Author contributions
IY: manuscript writing, data collection. EM: data collection. NE: data collection. RG: statistical analysis. VN: supervision and manuscript revision. NM: manuscript writing, critical analysis, and supervision. All authors contributed to the article and approved the submitted version.
Conflict of interest
The authors declare that the research was conducted in the absence of any commercial or financial relationships that could be construed as a potential conflict of interest.
Publisher’s note
All claims expressed in this article are solely those of the authors and do not necessarily represent those of their affiliated organizations, or those of the publisher, the editors and the reviewers. Any product that may be evaluated in this article, or claim that may be made by its manufacturer, is not guaranteed or endorsed by the publisher.
Abbreviations
AS, Active Surveillance; ROC, Receiver Operating Characteristic; PCa, Prostate Cancer; PSA, Prostate Specific Antigen; PSAD, PSA Density; PV, Prostate Volume; mpMRI, Multiparametric Magnetic Resonance Imaging; PRIAS, Prostate Cancer Research International Active Surveillance Study; TRUS, Transrectal Ultrasound; GS, Gleason Score; GG, Gleason Grade Group; MCCI, Maximum cancer core length.
References
1. Klotz L. Active surveillance in intermediate-risk prostate cancer. BJU Int (2020) 125:346–54. doi: 10.1111/bju.14935
2. Cooperberg MR, Cowan JE, Hilton JF, Reese AC, Zaid HB, Porten SP, et al. Outcomes of active surveillance for men with intermediate-risk prostate cancer. J Clin Oncol (2011) 29(2):228–34. doi: 10.1200/JCO.2010.31.4252
3. Maggi M, Cowan JE, Fasulo V, Iii SLW, Lonergan PE, Sciarra A, et al. The long-term risks of metastases in men on active surveillance for early stage prostate cancer. J Urol (2020) 204(6):1222–1228. doi: 10.1097/JU.0000000000001313
4. Cooperberg MR, Carroll PR, Klotz L. Active surveillance for prostate cancer: Progress and promise. J Clin Oncol (2011) 29(27):3669–76. doi: 10.1200/JCO.2011.34.9738
5. Tosoian JJ, Mamawala M, Epstein JI, Landis P, Macura KJ, Simopoulos DN, et al. Active surveillance of grade group 1 prostate cancer: Long-term outcomes from a Large prospective cohort. Eur Urol [Internet] (2020) 77(6):675–82. doi: 10.1016/j.eururo.2019.12.017
6. Epstein JI, Feng Z, Trock BJ, Pierorazio PM. Upgrading and downgrading of prostate cancer from biopsy to radical prostatectomy: Incidence and predictive factors using the modified gleason grading system and factoring in tertiary grades. Eur Urol (2012) 61(5):1019–24. doi: 10.1016/j.eururo.2012.01.050
7. Mottet N, van den Bergh RCN, Briers E, Van den Broeck T, Cumberbatch MG, De Santis M, et al. EAU-EANM-ESTRO-ESUR-SIOG Guidelines on Prostate Cancer-2020 Update. Part 1: Screening, Diagnosis, and Local Treatment with Curative Intent. Eur Urol (2021) 79:243–62. doi: 10.1016/j.eururo.2020.09.042
8. Baccaglini W, Glina FA, Pazeto CL, Medina LG, Korkes F, Bernardo WM, et al. Accuracy of MRI-guided versus systematic prostate biopsy in patients under active surveillance: A systematic review and meta-analysis. Clin Genitourin Cancer (2021) 19(1):3–11.e1. doi: 10.1016/j.clgc.2020.06.008
9. Rajwa P, Pradere B, Quhal F, Mori K, Laukhtina E, Huebner NA, et al. Reliability of serial prostate magnetic resonance imaging to detect prostate cancer progression during active surveillance: A systematic review and meta-analysis. Eur Urol (2021) 80(5):549–63. doi: 10.1016/j.eururo.2021.05.001
10. Vickers A, Vertosick EA, Sjoberg DD, Roobol MJ, Hamdy F, Neal D, et al. Properties of the 4-kallikrein panel outside the diagnostic Gray zone: Meta-analysis of patients with positive digital rectal examination or prostate specific antigen 10 ng/ml and above. J Urol [Internet] (2017) 197(3):607–13. doi: 10.1016/j.juro.2016.09.086
11. Bokhorst LP, Valdagni R, Rannikko A, Kakehi Y, Pickles T, Bangma CH, et al. A decade of active surveillance in the PRIAS study: An update and evaluation of the criteria used to recommend a switch to active treatment. Eur Urol (2016) 70(6):954–60. doi: 10.1016/j.eururo.2016.06.007
12. Epstein JI, Walsh PC, Carmichael M, Brendler CB. Pathologic and clinical findings to predict tumor extent of nonpalpable (Stage T1 c) prostate cancer. JAMA J Am Med Assoc (1994) 271(5):368–74. doi: 10.1001/jama.1994.03510290050036
13. Cantiello F, Russo GI, Cicione A, Ferro M, Cimino S, Favilla V, et al. PHI and PCA3 improve the prognostic performance of PRIAS and Epstein criteria in predicting insignificant prostate cancer in men eligible for active surveillance. World J Urol (2016) 34(4):485–93. doi: 10.1007/s00345-015-1643-z
14. Lin DW, Newcomb LF, Brown MD, Sjoberg DD, Dong Y, Brooks JD, et al. Evaluating the four kallikrein panel of the 4Kscore for prediction of high-grade prostate cancer in men in the canary prostate active surveillance study. Eur Urol [Internet] (2017) 72(3):448–54. doi: 10.1016/j.eururo.2016.11.017
15. Kornberg Z, Cowan JE, Westphalen AC, Cooperberg MR, Chan JM, Zhao S, et al. Genomic prostate score, PI-RADSTM version 2 and progression in men with prostate cancer on active surveillance. J Urol (2019) 201(2):300–6. doi: 10.1016/j.juro.2018.08.047
16. Klotz L, Vesprini D, Sethukavalan P, Jethava V, Zhang L, Jain S, et al. Long-term follow-up of a large active surveillance cohort of patients with prostate cancer. J Clin Oncol (2015) 33(3):272–7. doi: 10.1200/JCO.2014.55.1192
17. Massanova M, Robertson S, Barone B, Dutto L, Caputo VF, Bhatt JR, et al. The comparison of imaging and clinical methods to estimate prostate volume: A single-centre retrospective study. Urol Int (2021) 105(9–10):804–10. doi: 10.1159/000516681
18. Vickers AJ, Elkin EB. Decision curve analysis: A novel method for evaluating prediction models. Med Decis Mak (2006) 26(6):565–74. doi: 10.1177/0272989X06295361
19. Gandaglia G, van den Bergh RCN, Tilki D, Fossati N, Ost P, Surcel CI, et al. How can we expand active surveillance criteria in patients with low- and intermediate-risk prostate cancer without increasing the risk of misclassification? development of a novel risk calculator. BJU Int (2018) 122(5):823–30. doi: 10.1111/bju.14391
20. Luzzago S, de Cobelli O, Cozzi G, Peveri G, Bagnardi V, Catellani M, et al. A novel nomogram to identify candidates for active surveillance amongst patients with international society of urological pathology (ISUP) grade group (GG) 1 or ISUP GG2 prostate cancer, according to multiparametric magnetic resonance imaging findings. BJU Int (2020) 126(1):104–13. doi: 10.1111/bju.15048
21. Klotz L, Pond G, Loblaw A, Sugar L, Moussa M, Berman D, et al. Randomized study of systematic biopsy versus magnetic resonance imaging and targeted and systematic biopsy in men on active surveillance (ASIST): 2-year postbiopsy follow-up. Eur Urol [Internet] (2020) 77(3):311–7. doi: 10.1016/j.eururo.2019.10.007
22. Lantz A, Falagario UG, Ratnani P, Jambor I, Dovey Z, Martini A, et al. Expanding active surveillance inclusion criteria: A novel nomogram including preoperative clinical parameters and magnetic resonance imaging findings. Eur Urol Oncol [Internet] (2020) 5(2):187–94. doi: 10.1016/j.euo.2020.08.001
23. D’Amico AV, Whittington R, Bruce Malkowicz S, Schultz D, Blank K, Broderick GA, et al. Biochemical outcome after radical prostatectomy, external beam radiation therapy, or interstitial radiation therapy for clinically localized prostate cancer. J Am Med Assoc (1998) 280(11):969–74. doi: 10.1001/jama.280.11.969
24. Lam TBL, MacLennan S, Willemse PPM, Mason MD, Plass K, Shepherd R, et al. EAU-EANM-ESTRO-ESUR-SIOG prostate cancer guideline panel consensus statements for deferred treatment with curative intent for localised prostate cancer from an international collaborative study (DETECTIVE study). Eur Urol (2019) 76(6):790–813. doi: 10.1016/j.eururo.2019.09.020
25. Nordström T, Akre O. Prostate-specific antigen ( PSA ) density in the diagnostic algorithm of prostate cancer informing prostate biopsy decisions is easily accessible. Prostate Cancer Prostatic Dis [Internet] (2018) 21:57–63. doi: 10.1038/s41391-017-0024-7
26. Bruno SM, Falagario UG, d’Altilia N, Recchia M, Mancini V, Selvaggio O, et al. PSA density help to identify patients with elevated PSA due to prostate cancer rather than intraprostatic inflammation: A prospective single center study. Front Oncol (2021) 11(May):1–8. doi: 10.3389/fonc.2021.693684
27. Kundu SD, Roehl KA, Yu X, Antenor JAV, Suarez BK, Catalona WJ. Prostate specific antigen density correlates with features of prostate cancer aggressiveness. J Urol (2007) 177(2):505–9. doi: 10.1016/j.juro.2006.09.039
28. Magheli A, Hinz S, Hege C, Stephan C, Jung K, Miller K, et al. Prostate specific antigen density to predict prostate cancer upgrading in a contemporary radical prostatectomy series: A single center experience. J Urol [Internet] (2010) 183(1):126–32. doi: 10.1016/j.juro.2009.08.139
29. Oh JJ, Hong SK, Lee JK, Lee BK, Lee S, Kwon OS, et al. Prostate-specific antigen vs prostate-specific antigen density as a predictor of upgrading in men diagnosed with Gleason 6 prostate cancer by contemporary multicore prostate biopsy. BJU Int (2012) 110(11 B):1–6. doi: 10.1111/j.1464-410X.2012.11182.x
30. Falagario UG, Jambor I, Lantz A, Ettala O, Stabile A, Taimen P, et al. Combined use of prostate-specific antigen density and magnetic resonance imaging for prostate biopsy decision planning: A retrospective multi-institutional study using the prostate magnetic resonance imaging outcome database (PROMOD). Eur Urol Oncol (2020) 4:971–979. doi: 10.1016/j.euo.2020.08.014
31. Willemse PPM, Davis NF, Grivas N, Zattoni F, Lardas M, Briers E, et al. Systematic review of active surveillance for clinically localised prostate cancer to develop recommendations regarding inclusion of intermediate-risk disease, biopsy characteristics at inclusion and monitoring, and surveillance repeat biopsy strategy. Eur Urol (2022) 81(4):337–46. doi: 10.1016/j.eururo.2021.12.007
32. Freedland SJ, Isaacs WB, Platz EA, Terris MK, Aronson WJ, Amling CL, et al. Prostate size and risk of high-grade, advanced prostate cancer and biochemical progression after radical prostatectomy: A search database study. J Clin Oncol (2005) 23(30):7546–54. doi: 10.1200/JCO.2005.05.525
33. Briganti A, Chun FKH, Suardi N, Gallina A, Walz J, Graefen M, et al. Prostate volume and adverse prostate cancer features: Fact not artifact. Eur J Cancer (2007) 43(18):2669–77. doi: 10.1016/j.ejca.2007.09.022
34. Liu JJ, Brooks JD, Ferrari M, Nolley R, Presti JC. Small prostate size and high grade disease-biology or artifact? J Urol [Internet] (2011) 185(6):2108–11. doi: 10.1016/j.juro.2011.02.053
35. Turley RS, Hamilton RJ, Terris MK, Kane CJ, Aronson WJ, Presti JC, et al. Small transrectal ultrasound volume predicts clinically significant Gleason score upgrading after radical prostatectomy: Results from the SEARCH database. J Urol (2008) 179(2):523–8. doi: 10.1016/j.juro.2007.09.078
36. Dong F, Jones JS, Stephenson AJ, Magi-Galluzzi C, Reuther AM, Klein EA. Prostate cancer volume at biopsy predicts clinically significant upgrading. J Urol (2008) 179(3):896–900. doi: 10.1016/j.juro.2007.10.060
37. Roobol MJ, Schröder FH, Hugosson J, Jones JS, Kattan MW, Klein EA, et al. Importance of prostate volume in the European randomised study of screening for prostate cancer (ERSPC) risk calculators: Results from the prostate biopsy collaborative group. World J Urol (2012) 30(2):149–55. doi: 10.1007/s00345-011-0804-y
38. Sazuka T, Goto Y, Kawamura K, Imamoto T, Nihei N, Suzuki H, et al. Validation of active surveillance criteria for pathologically insignificant prostate cancer in Asian men. Int J Urol (2016) 23(1):49–54. doi: 10.1111/iju.12952
39. Bruinsma SM, Nieboer D, Roobol MJ, Bangma CH, Verbeek JFM, Gnanapragasam V, et al. Risk-based selection for active surveillance: Results of the movember foundation’s global action plan prostate cancer active surveillance (GAP3) initiative. J Urol (2021) 206(1):62–8. doi: 10.1097/JU.0000000000001700
Keywords: active surveillance, prostate cancer, inclusion criteria, prostate volume, prostate specific antigen density
Citation: Yusim I, Mazor E, Elsaraya N, Gat R, Novack V and Mabjeesh NJ (2022) Prostate volume is an independent predictive factor in selecting low-risk prostate patients for active surveillance. Front. Urol. 2:990499. doi: 10.3389/fruro.2022.990499
Received: 10 July 2022; Accepted: 28 October 2022;
Published: 23 November 2022.
Edited by:
Salvatore Siracusano, University of L’Aquila, ItalyReviewed by:
Martina Maggi, Sapienza University of Rome, ItalyUgo Giovanni Falagario, University of Foggia, Italy
Copyright © 2022 Yusim, Mazor, Elsaraya, Gat, Novack and Mabjeesh. This is an open-access article distributed under the terms of the Creative Commons Attribution License (CC BY). The use, distribution or reproduction in other forums is permitted, provided the original author(s) and the copyright owner(s) are credited and that the original publication in this journal is cited, in accordance with accepted academic practice. No use, distribution or reproduction is permitted which does not comply with these terms.
*Correspondence: Igor Yusim, aWdvci55dXNpbUBnbWFpbC5jb20=
†ORCID: Igor Yusim, orcid.org/0000-0002-0207-7656
 Igor Yusim
 Elad Mazor1
 Victor Novack