 Nagai Shin
 Taku M. Saitoh
 Narumasa Tsutsumida
94% of researchers rate our articles as excellent or good
Learn more about the work of our research integrity team to safeguard the quality of each article we publish.
Find out more
ORIGINAL RESEARCH article
Front. Sustain. Tour., 07 February 2024
Sec. Tourism, Climate and Global Environmental Consequences
Volume 3 - 2024 | https://doi.org/10.3389/frsut.2024.1280685
This article is part of the Research TopicClimate Change and Destination Landscape Alternations and ChoicesView all articles
To further develop the accuracy of monitoring cherry flowering dates, we require phenological records from multiple points in multiple years at the catchment scale, as well as conventional in situ phenological observations, phenological data published on the Internet, and analysis using statistics of Internet search engines. We tried to detect the dates of cherry flowering phenology along the Tarumi railway, Gifu Prefecture, Japan, by using Flickr, an image hosting service, and YouTube, an online video sharing and social media platform. We detected full bloom of Cerasus ×yedoensis and Cerasus jamasakura mainly at cherry blossom viewing spots (around some train stations) on Flickr and at both viewing spots and multiple points in the landscape along the railway on YouTube. Despite local climatological differences along the railway, the detected full blooming dates corresponded not only with each other, but also with the full bloom period of Neodani Usuzumi-zakura (Cerasus itosakura), a famous tree with long-term detailed records. We could not detect the date and location in many photographs on Flickr or in any videos on YouTube. However, the usefulness of both platforms is supported by the facts that we can evaluate the year-to-year variability of full bloom dates, especially at cherry blossom viewing spots, and detect flowering phenology even in a non-photogenic landscape. By applying our method to other railways, we expect to collect multi-year records of plant phenology dates at multiple points that cannot be collected by older methods.
Cherry flowering phenology is the most typical spring phenology in Japan. Before the history of modern meteorological observations, the flowering of cherry blossoms, along with that of Magnolia kobus, was rooted in people's lives as an indicator of when to prepare fields (Iwasaki, 2018). In fact, many deciduous trees flush at the same time as or after cherry (Sato, 2014). The practice of hanami, or cherry blossom viewing, started in the 18th century CE (Iwasaki, 2018), but the hanami festival in the Imperial Palace dates back to the 9th century CE (Aono and Kazui, 2008). These traditions formed the basis of Japanese culture and sense of the seasons. However, climate change due to global warming has changed the spatio-temporal variability of cherry flowering phenology. For instance, in Japan, the mean national first flowering (FFL) date of Cerasus ×yedoensis has advanced by 1.2 days per decade from 1953 to 2022 (JMA, 2023). Abnormal flowering behaviors such as not flowering or not reaching full bloom has been reported at the southern limit of the tree's distribution (Katsuki, 2015; http://www.hachijo-vc.com/index.php). In addition, the correlation between the FFL date of C. ×yedoensis and latitude has decreased from 1953 to 2020 owing to the delayed release of endodormancy due to warming in winter (Nagai et al., 2020b). Nagai et al. (2019) reported a temporal change of the relationship between the periods of cherry flowering and festivals in two Japanese cities under past, current, and future climate conditions. For these reasons, accurate monitoring of the spatio-temporal variability of cherry flowering and full bloom has an important role in understanding not only cultural ecosystem services (i.e., aesthetic, psychological, touristic, and recreational), but also the sensitivity of ecosystems and people's lives to climate change (i.e., in adapting or migrating).
How can we advance the accuracy of monitoring cherry flowering phenology? Using data collected at specific trees, previous studies detected spatio-temporal characteristics of flowering phenology due to climatological gradients along latitude and elevation (Nagai et al., 2020b) and also to the effect of heat islands and microclimate within cities (Matsumoto et al., 2006; Ohashi et al., 2012). Such data include systematic errors caused by differences among observers but have the advantage of detail. However, such labor-intensive and time-consuming visual inspection prevents us from taking multiple observations over many years on a wide scale. To resolve this limitation, recent studies reported the usefulness of cherry flowering information published on web sites (e.g., “tenki.jp,” https://tenki.jp/sakura/; “Weather News,” https://weathernews.jp/sakura/) and of analytical statistics of Internet search engines (e.g., Google Trends; Shin et al., 2022b). In fact, by analyzing leaf-coloring information published on web sites, two studies reported the spatio-temporal characteristic of leaf-coloring phenology along latitudinal and elevational gradients (Nagai et al., 2020a) and the validity of the spatio-temporal distribution of leaf-coloring and leaf-fall dates detected by the analysis of time-series of satellite-observed vegetation index data (Tsutsumida et al., 2022), albeit not in cherry. In addition, Shin et al. (2022b) validated that the seasonal peak of “relative search volume” on Google Trends for Japan's three great cherry trees, as proxy data for people's interest in dates, correlated closely with the actual full bloom period by verification against flowering phenology data collected daily on site. However, the information published on web sites and applicable search terms on Google Trends are limited to famous cherry viewing spots and to web sites aimed at tourists and cherry blossom viewers.
Today, society is ubiquitously networked, and most people can freely upload, share, and acquire text, photographs, audio, and videos on the Internet through social networking sites and audio and video distribution services (i.e., social media). Among sites, Twitter (now X; https://twitter.com/) and Facebook (https://www.facebook.com/) cater to text, Flickr (https://www.flickr.com/), Instagram (https://www.instagram.com/), and Mapillary (https://www.mapillary.com/) to photographs, Apple and Spotify podcasts (https://www.apple.com/apple-podcasts/; https://open.spotify.com/genre/podcasts-web) to audio, and YouTube (https://www.youtube.com/) and TikTok (https://www.tiktok.com/en/) to videos. The content is distributed among very large populations with diverse aims, and thus the character of data differs between published phenological information and social media. However, the vast amount of data on social media may allow us to detect phenological data on many unmonitored cherry trees over a wide scale. In particular, we anticipate that we can acquire data even in unremarkable landscapes not favored for cherry blossom viewing. Photographs and videos that record dates and locations may allow us to examine the year-to-year variability of cherry flowering phenology. In fact, the usefulness of Flickr and Mapillary in the evaluation of the spatio-temporal distribution of cherry flowering in Japan has been reported (El Qadi et al., 2021, 2023; Funada and Tsutsumida, 2022a,b), though not that of YouTube, although De Frenne et al. (2018) indicated the usefulness of archived broadcast TV programmes of professional road cycling races in Belgium to evaluate the response of tree phenology to climate change along the course of the race at a decadal scale.
Here, to test our hypothesis, we examined the feasibility of using photographs uploaded on Flickr and videos on YouTube to detect cherry flowering phenology along the Tarumi railway, in Gifu Prefecture, Japan, and then evaluated the spatio-temporal distribution of the phenology along the railway. We examined the relationship between the detected flowering dates and long-term detailed records of flowering of the famous Neodani Usuzumi-zakura (Cerasus itosakura), which grows near the railway. We assumed that there are potentially many photographs and videos uploaded on Flickr and YouTube, because many tourists, cherry blossom viewers, and railroad fans visit the cherry blossoms here. The aim of this study was to clarify the usefulness, uncertainty, and future perspectives of our proposed new phenological study using photographs uploaded on Flickr and videos on YouTube.
Our target was the landscape along the Tarumi railway, which connects Ogaki Station (Ogaki City, Gifu Prefecture; 35°22′00.3″N, 136°37′04.2″E) with Tarumi Station (Motosu City, Gifu Prefecture; 35°38′08.5″N, 136°36′55.4″E; https://tarumi-railway.com/). The railway is an unelectrified branch line that covers 34.5 km and 19 stations (Figure 1). The landscape from Ogaki to Oribe stations is a plain covered mainly with settlements, rice paddies, and persimmon orchards, whereas that from Oribe to Tarumi stations is mountainous and is covered with deciduous broad-leaved forests, evergreen coniferous forests, rice paddies, and settlements up the Neo River valley (Table 1). The Neodani Usuzumi-zakura tree, with an estimated age of about 1,500 years, grows about 700 m south-west of Tarumi Station (35°37′55.9″N, 136°36′31.7″E; 200 m a.s.l.; https://www.city.motosu.lg.jp/category/2-18-0-0-0-0-0-0-0-0.html). In the flowering period, the Tarumi railway is crowded with many tourists, cherry blossoms viewers, and railroad fans. Although the direct distance between Ogaki and Tarumi stations is only about 30 km, the winter conditions vary widely along the route, with sporadic snow cover around Ogaki Station but continuous snow cover around Tarumi Station. The mean annual maximum snowfall at the Tarumi weather station, about 1,100 m east-north-east of Tarumi Station (35°38′20.8″N, 136°36′11.8″E; 190 m a.s.l.), was 72 cm (1991–2020; https://www.data.jma.go.jp/obd/stats/etrn/index.php).
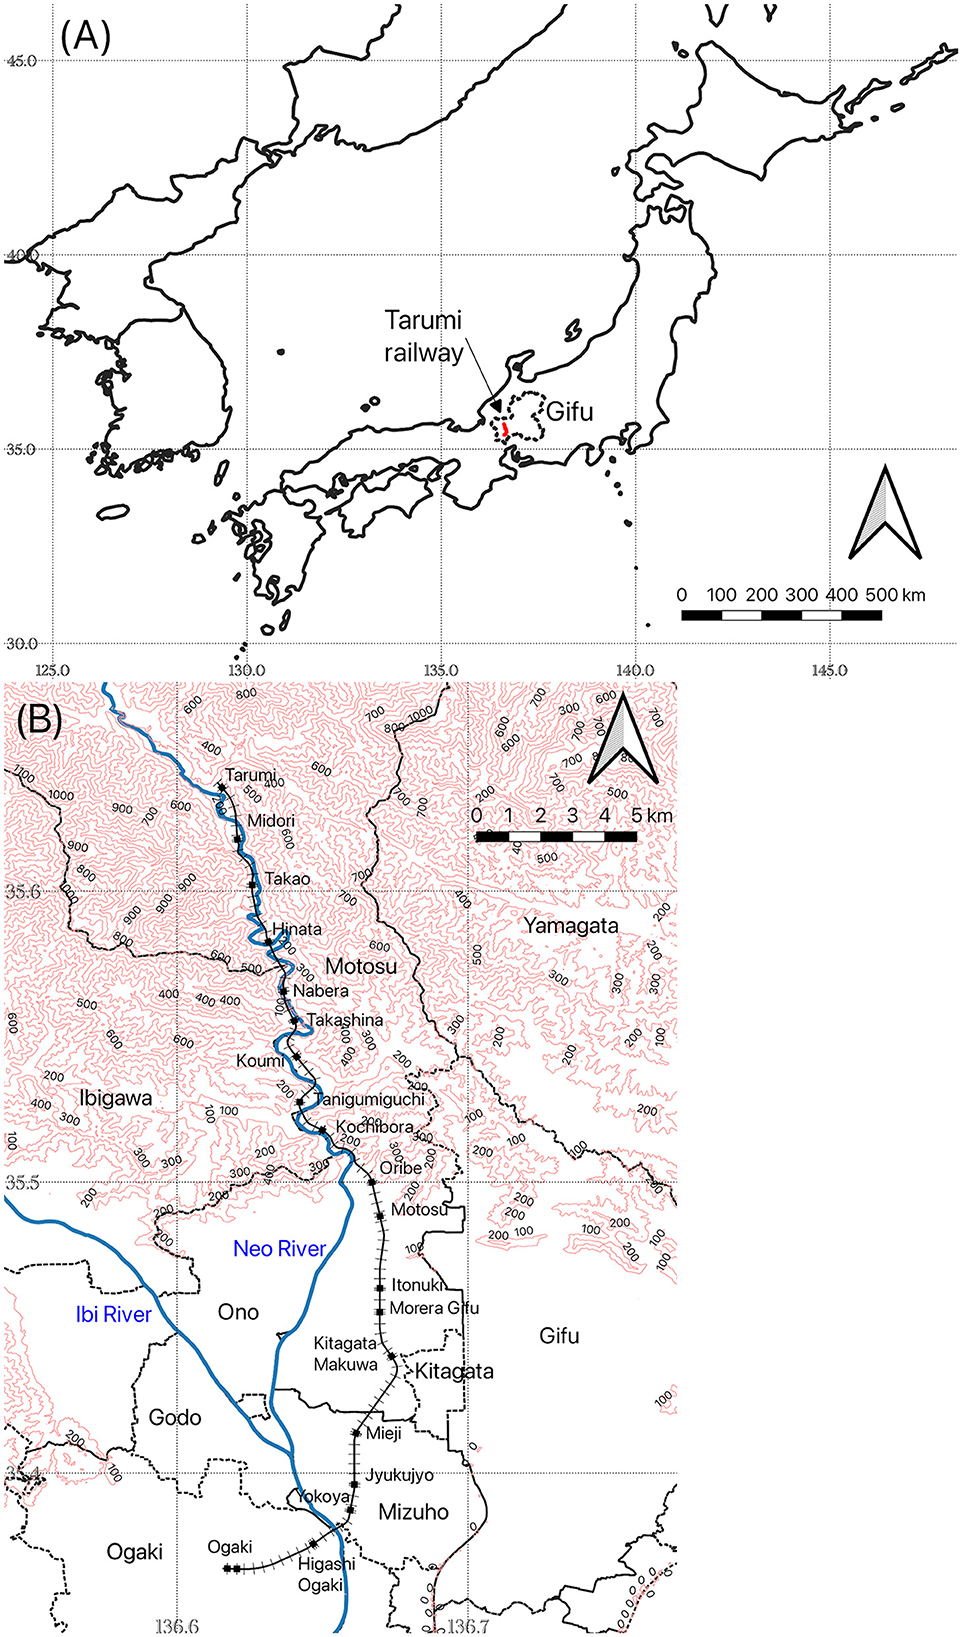
Figure 1. (A) Location of the Tarumi railway. (B) Route of the railway, administrative boundaries, elevation, and Neo River. The map is sourced from the ALOS World 3D-30 m (AW3D30) digital surface model with a 30-m spatial resolution (https://www.eorc.jaxa.jp/ALOS/en/dataset/aw3d30/aw3d30_e.htm), the Ministry of Land, Infrastructure, Transport and Tourism of Japan (https://nlftp.mlit.go.jp/ksj/gml/datalist/KsjTmplt-N03-v2_4.html) and “10 m cultural vectors” (https://www.naturalearthdata.com/downloads/10m-cultural-vectors/).

Table 1. Cherry flowering phenology detected from Flickr and YouTube.
To detect the cherry flowering phenology along the railway, we searched for “ ” (“Tarumi railway”) on Flickr (https://www.flickr.com/) on 11 and 12 June 2023 and “
 ” (“Tarumi railway and cherry”) on YouTube (https://www.youtube.com/) from 14 June to 1 November 2023. On Flickr, we detected 81 photographs related to cherry flowering by 14 posters from 2010, 2011, and 2016–2021 in the list of “Everyone's photos” (Supplementary Table 1). We acquired the date and location (i.e., “geotag”) of photographs from the Exif data. When we could not obtain the geotag, we identified the location from structures such as stations and bridges in the photographs. On YouTube, we detected 598 videos on 10 October 2023, in addition to the seven videos previously detected in June. To retrieve relevant videos, we omitted videos unrelated to cherry flowering or with no date taken information by referring to the title of the video, the attached text comments, and the video content, and ultimately were able to retrieve 91 videos. We also omitted videos with only date posted. With the above-mentioned seven videos, we watched 98 videos by 56 posters from 1992, 2004–2006, and 2010–2023 in total (Supplementary Table 2). We detected the phenology by watching videos at up to 2.0× speed. We divided the cherry trees into “C. ×yedoensis,” “Cerasus jamasakura,” and “Cerasus sp.” (unidentified species). We divided flowering stages into “before flowering,” “flowering” (<20% flowering), “20%−30% flowering,” “50% flowering” (30%−60% flowering), “70% flowering” (60%−80% flowering), “full bloom” (80%−100% flowering), “scattering” (scattered blooms remaining amongst green leaves), and “green leaves.” We identified the location by referring to structures and announcements recorded in the videos. In both photographs and videos, we divided the locations into “around stations” (within about 100 m) and “between stations.” Under the Japanese copyright act, we delimited the images to those authorized for big data analysis and AI algorithms (i.e., use without human intervention; https://www.japaneselawtranslation.go.jp/ja/laws/view/4207; in particular, article 30–4). For this reason, we manually detected cherry flowering phenology from photographs and videos by visual inspection to account for uncertainty caused by individual differences, image quality, and angle of view.
To compare cherry flowering phenology detected from images along the railway with that observed on site, we used the Neodani Usuzumi-zakura records (https://www.city.motosu.lg.jp/category/2-18-2-0-0-0-0-0-0-0.html). We compared the probability distributions between the dates of full bloom detected from Flickr and YouTube and those recorded by applying Bayes's theorem, using a beta distribution with Bayesian updating (Fujita, 2015), where the prior distribution is:
with a mean of , mode of , and variance of ; the observation (likelihood that full bloom dates detected from images [n] coincided with those in Usuzumi-zakura [r]) is:
where p is probability; and the posterior distribution is:
with a mean of , mode of , and variance of .
To evaluate the temporal change of the posterior distribution with Bayesian updating of the beta distribution (Equations 1–3), we calculated the mean, mode, and variance of the posterior distribution for every year updated, which account for the scatter and shape of the probability distribution (Fujita, 2015).
Cherry flowering phenology detected from Flickr is shown in Table 1. On the plain (Ogaki–Oribe stations), cherry flowering phenology was not detected. In contrast, in the river valley (Oribe–Tarumi stations), full bloom of C. ×yedoensis was detected. In particular, at Kochibora (11 photographs) and Tanigumiguchi stations (42), several photographs were taken in multiple years. Among them, 16 photographs included the full geotag, two could not be dated, and one could not be located. Full bloom of C. jamasakura was detected in three photographs.
Cherry flowering phenology detected from YouTube is shown also in Table 1. At most “around stations” and “between stations” on the plains, full bloom of C. ×yedoensis was detected from 1992 to 2023. At some points, records of different dates were detected in the same year. In the river valley, full bloom dates of C. jamasakura were detected in many “between stations.” Flowering phenology other than full bloom was rarely detected.
Dates of full bloom in C. ×yedoensis and C. jamasakura detected from Flickr and YouTube and of Neodani Usuzumi-zakura are shown in Figure 2. In some years (e.g., 2010, 2021, and 2022), dates detected from Flickr and YouTube were several days earlier than those of Neodani Usuzumi-zakura. However, many dates in other years lay within the full bloom period of Neodani Usuzumi-zakura.
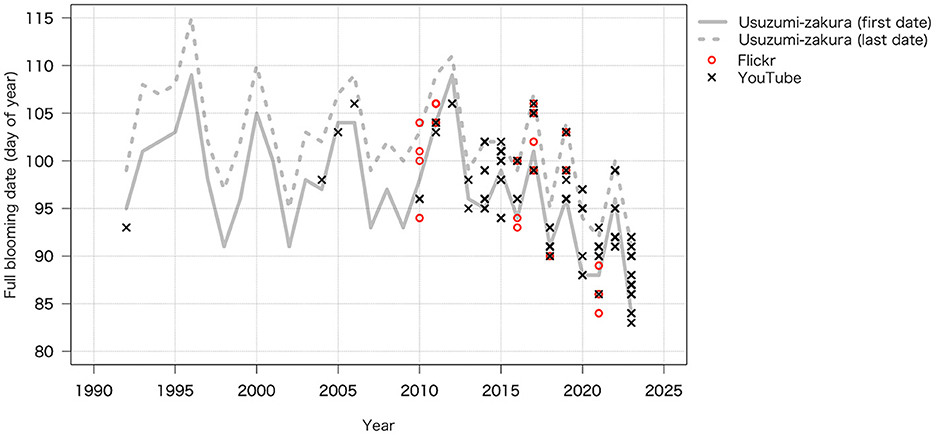
Figure 2. Relationship between full bloom period of Neodani Usuzumi-zakura and dates of full bloom in Cerasus ×yedoensis and Cerasus jamasakura detected from Flickr and YouTube along the Tarumi railway.
As for the matching probability distribution between full bloom dates in C. ×yedoensis and C. jamasakura detected from Flickr and YouTube and those of Neodani Usuzumi-zakura, temporal change of mean, mode, and variance of posterior distribution with Baysian updating of the beta distribution is shown in Figure 3. In 2023 (date of last Bayesian update), the beta distribution was B(286, 117), and the posterior distribution had a mean of 0.71, a mode of 0.71, and variance of 0.0005. This indicates that the probability of full bloom of Neodani Usuzumi-zakura was averagely 71% when full bloom in C. ×yedoensis and C. jamasakura was seen in the catchment along the Tarumi railway.
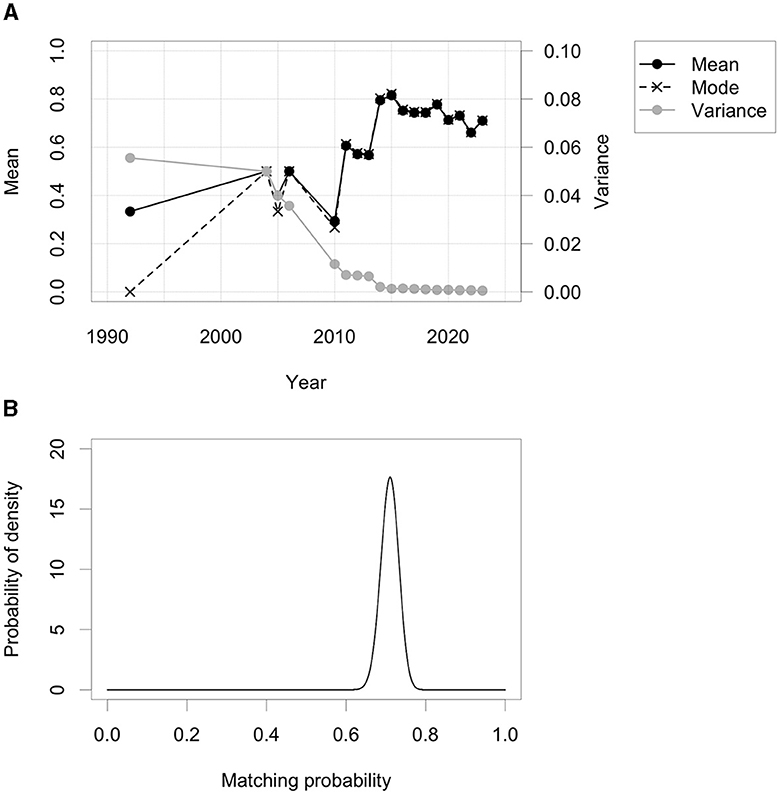
Figure 3. Matching probability distribution between full bloom dates detected from Flickr and YouTube and those of Neodani Usuzumi-zakura. (A) Temporal change of mean, mode, and variance of posterior distribution with Bayesian updating of the beta distribution. (B) The last updated beta distribution in 2023: B(286, 117).
We detected full bloom of C. ×yedoensis around stations on Flickr, and that of C. ×yedoensis and C. jamasakura around and between stations, in the surrounding mountains, and along roadsides, on YouTube (Table 1). Photographs on Flickr were taken in and around stations, while videos on YouTube were taken both in and around stations and from the front of moving trains, which affords views of the landscape both close and distant. Many YouTube videos did not include date taken information (Supplementary Table 2). We might be able to further increase the number of data points if we ask videographers for the filming dates. In addition, despite user bias due to factors such as generation, gender, and country, photographs and videos on other social media such as X, Facebook (https://www.facebook.com/), Instagram (https://www.instagram.com/), and TikTok (https://www.tiktok.com/) might be useful.
YouTube—especially videos taken from the front of moving trains—has an advantage that we can detect cherry flowering phenology at multiple points and in multiple years at locations away from favored viewing spots. However, the videos require labor-intensive viewing to identify locations, because they do not include the geotag. In addition, low picture quality of videos caused by lightning conditions, slow internet speed for live streaming, and camera shake obstructed the visual inspection of videos. As mentioned above, the limitation and bias of our method could be summarized in Table 2. In contrast, photographs on Flickr often include the full geotag in the Exif data. Funada and Tsutsumida (2022a,b) and Tsutsumida and Funada (2023) detected full bloom of cherry by applying a machine learning algorithm to geotagged photographs on Mapillary, a crowd-sourcing mapping project (https://www.mapillary.com/) and their own geotagged photographs, and then mapped the geographical distribution of full bloom dates in Aizuwakamatsu and Saitama, Japan. This method suggests that we might facilitate the detection of cherry flowering phenology by integrating the visual inspection of photographs without the full geotag and machine learning applied to geotagged photographs. To work within the limitations imposed by Japanese copyright law, we are first required to base machine learning algorithms on data published under a CC-BY License (i.e., approved for analysis) and on our own photographs and videos, and then apply the algorithms to photographs on Flickr and videos on YouTube.
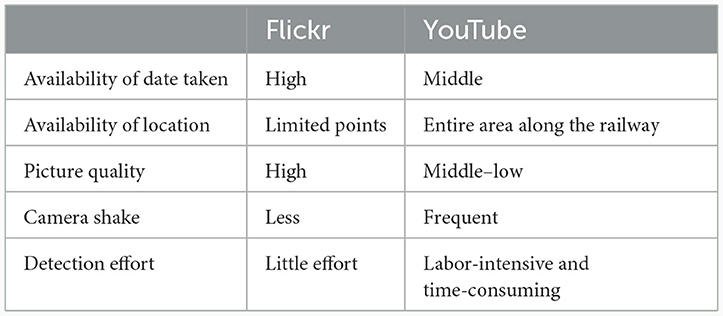
Table 2. Limitation and bias of the visual inspection of photographs on Flickr and videos on YouTube.
On both Flickr and YouTube, in popular viewing spots such as Kochibora and Tanigumiguchi stations, where many C. ×yedoensis trees grow, we could detect the flowering phenology on several dates within a year (Table 1). This fact suggests that we can estimate the full bloom period even if we cannot exactly identify the first full bloom (FFB) date. Although C. ×yedoensis is a clonal species, Shin et al. (2022a) found a difference of 2–6 days in the FFL and FFB dates among individual blossoms. To examine the year-to-year variability of cherry flowering at the catchment scale and for assessing cultural ecosystem services, the full bloom date is more suitable than the FFL date, which accounts for <1% of full bloom (Katsuki, 2015) and is strongly affected by the difference among individual cherry trees. It is likely that there were few photographs and videos before the FFL and FFB dates and after the last full bloom date because the photographers are interested only in trees in full bloom. Many photographers may visit these viewing spots only after they confirm the dates of full bloom.
Differences between monthly average temperatures in March, which significantly affect the flowering process (Nagai et al., 2019, 2020b), between the Ogaki weather station, about 2.2 km south of Ogaki Station (35°20′52.1″N, 136°37′13.9″E; 6 m a.s.l.), and the Tarumi weather station were 2.3°C in daily maximum, 3.1°C in daily mean, and 3.3°C in daily minimum (during 1992, 2004–2006, and 2011–2023; 2010 was excluded because of missing data; https://www.data.jma.go.jp/obd/stats/etrn/). These differences are larger than the climatological difference between Ogaki and Tarumi stations, of about 1°C, as estimated from the rate of lapse of air temperature (0.65°C per 100 m) and the difference in elevation between the stations (159 m). This difference indicates that the two weather stations are strongly affected by microclimate. On the other hand, they are close to the climatological differences between the Tokyo weather station (35°41′22.1″N 139°41′30.1″E; 35 m a.s.l.) and the Utsunomiya weather station (36°33′18.4″N 139°52′57.5″E; 114 m a.s.l.), about 100 km north of Tokyo in March, of 0.8°C in daily maximum, 2.0°C in daily mean, and 2.9°C in daily minimum (1991–2020). The difference in the average FFB date of C. ×yedoensis between Tokyo (31 March) and Utsunomiya (6 April) was 6 days (1991–2020; https://www.data.jma.go.jp/sakura/data/sakura_mankai.html). These facts suggest a difference of about 6 days in full bloom dates in C. ×yedoensis and C. jamasakura between Ogaki and Tarumi stations. However, despite no or few retrieved records before 2009, full bloom dates of both species between those stations tended to correspond with those in Neodani Usuzumi-zakura (Figures 2, 3). The full bloom period of each individual blossom (a few days to a week) is similar to the difference of FFB date among individual blossoms (2–6 days; Shin et al., 2022a) and the difference in full bloom dates along the elevational gradient (~6 days). For this reason, the full bloom period of individual cherry blossoms detected from Flickr and YouTube overlapped. On the other hand, C. itosakura flowered a few days earlier than C. ×yedoensis and C. jamasakura (Ishii, 1990; Katsuki et al., 2011). The full bloom period of Neodani Usuzumi-zakura lasted 2–8 days (Figure 2). Thus, we consider that the full bloom dates in C. ×yedoensis and C. jamasakura between Ogaki and Tarumi stations overlapped with that of Neodani Usuzumi-zakura.
These results suggest that we can estimate the year-to-year variability of full bloom dates along the Tarumi railway before the advent of Flickr and YouTube from the records of the flowering phenology of Neodani Usuzumi-zakura. For instance, Neodani Usuzumi-zakura was in full bloom from 8 to 12 April 1997, from 1 to 7 April 1998, and from 6 to 11 April 2004 (https://www.city.motosu.lg.jp/category/2-18-2-0-0-0-0-0-0-0.html; Figure 2). According to photo books of the Tarumi railway (Adachi, 2004), C. ×yedoensis was in full bloom on 6 April 1997 (between Yokoya and Jyukujyo stations; between Kochibora and Tanigumiguchi stations; at Tanigumiguchi Station), 12 April 1997 (between Oribe and Kochibora stations), 4 April 1998 (between Yokoya and Jyukujyo stations), 1 April 2004 (between Yokoya and Jyukujyo stations), 5 April 2004 (at Tanigumiguchi Station), 8 April 2004 (at Tanigumiguchi Station), and 10 April 2004 (at Tarumi Station). On these dates, we found good correspondence between full bloom dates along the Tarumi railway and in Neodani Usuzumi-zakura. However, in some years, the full bloom dates detected from photographs on Flickr and videos on YouTube were several days earlier than those of Neodani Usuzumi-zakura (Figure 2). These dates tended to be recorded around Hinata and Ogaki stations (roughly speaking, in downstream and suburban areas; Supplementary Tables 1, 2). We need to focus more on microclimate and deepen our understanding of the relationship between cherry flowering phenology and the temperature at the catchment scale.
We could detect full bloom of C. ×yedoensis and C. jamasakura at multiple points in multiple years along the Tarumi railway from photographs on Flickr and videos on YouTube. These dates corresponded well with the full bloom period of the nearby Neodani Usuzumi-zakura, for which detailed records are held. Although we could not always identify the date and location in the photos and videos, nevertheless we found data in enough photographs and videos to allow us to evaluate the year-to-year variability of full bloom at cherry blossom viewing spots around some of the train stations. YouTube videos additionally allowed us to detect full bloom in the distant landscape along the railway. By applying our method to other railways and plant species, we expect to collect multi-year records of flowering phenology at multiple points that cannot be collected on site.
The original contributions presented in the study are included in the article/Supplementary material, further inquiries can be directed to the corresponding author.
NS: Conceptualization, Data curation, Formal analysis, Funding acquisition, Investigation, Methodology, Validation, Visualization, Writing – original draft. TS: Validation, Writing – review & editing. NT: Validation, Writing – review & editing.
The author(s) declare financial support was received for the research, authorship, and/or publication of this article. This research was supported by the KAKENHI grant (21H05178) from the Japan Society for the Promotion of Science.
We are grateful to the Flickr and YouTube users who uploaded photographs and videos. We also thank the editor and three reviewers for their constructive comments.
The authors declare that the research was conducted in the absence of any commercial or financial relationships that could be construed as a potential conflict of interest.
All claims expressed in this article are solely those of the authors and do not necessarily represent those of their affiliated organizations, or those of the publisher, the editors and the reviewers. Any product that may be evaluated in this article, or claim that may be made by its manufacturer, is not guaranteed or endorsed by the publisher.
The Supplementary Material for this article can be found online at: https://www.frontiersin.org/articles/10.3389/frsut.2024.1280685/full#supplementary-material
Supplementary Table 1. List of used photographs on Flickr related to cherry flowering. Cy: C. ×yedoensis; Cj: C. jamasakura; Csp: Cerasus sp.
Supplementary Table 2. List of watched videos on YouTube related to cherry flowering with date information. Cy: C. ×yedoensis; Cj: C. jamasakura; Csp: Cerasus sp.
Adachi, K. (2004). Usuzumi Train: Photographic Album of Tarumi Railway. Gifu: Gifu Newspaper Company (in Japanese).
Aono, Y., and Kazui, K. (2008). Phenological data series of cherry tree flowering in Kyoto, Japan, and its application to reconstruction of springtime temperatures since the 9th century. Int J Climatol. 28, 905–914. doi: 10.1002/joc.1594
De Frenne, P., Van Langenhove, L., Van Driessche, A., Bertrand, C., Verheyen, K., and Vangansbeke, P. (2018). Using archived television video footage to quantify phenology responses to climate change. Methods Ecol. Evol. 9, 1874–1882. doi: 10.1111/2041-210X.13024
El Qadi, M. M., Dyer, A. G., Vlasveld, C., and Dorin, A. (2021). Monitoring photogenic ecological phenomena: social network site images reveal spatiotemporal phases of Japanese cherry blooms. bioRxiv [Preprint]. doi: 10.1101/2021.09.13.460016
El Qadi, M. M., Dyer, A. G., Vlasveld, C., and Dorin, A. (2023). The spatiotemporal signature of cherry blossom flowering across Japan revealed via analysis of social network site images. Flora 304:152311. doi: 10.1016/j.flora.2023.152311
Fujita, K. (2015). Search for the Invisible—That's Bayes. Hands-on Bayesian Statistics with Tools. Tokyo: Omu-Sha, 248. (in Japanese).
Funada, S., and Tsutsumida, N. (2022a). Mapping cherry blossoms from geotagged street-level photos. bioRxiv [Preprint]. doi: 10.1101/2022.01.18.476550
Funada, S., and Tsutsumida, N. (2022b). “Mapping cherry blossoms from geotagged street-level photos,” in IGARSS 2022 – 2022 IEEE International Geoscience and Remote Sensing Symposium (Kuala Lumpur: IEEE), 5645–5647. doi: 10.1109/IGARSS46834.2022.9884256
Ishii, Y. (1990). Studies on the flowering duration of various Japanese cherry species planted in the Tama Forest Science Garden. Bull. For. For. Prod. Res. Inst. 357, 95–152. (in Japanese).
Iwasaki, F. (2018). Cultural History of the Japanese Flowering Cherries. Tokyo: Hokuryukan, 480. (in Japanese).
JMA (2023). Climate Change Monitoring Report 2022. Japan Meteorological Agency, 114. Available online at: https://www.data.jma.go.jp/cpdinfo/monitor/2022/pdf/ccmr2022_all.pdf (accessed January 29, 2024).
Katsuki, T., Iwamoto, K., and Ishii, Y. (2011). The observation of flowering dates in the Cherry preservation forest at the Tama Forest Science Garden over a 30 year period. Bull. FFPRI 10, 7–48. (in Japanese with English summary). Available online at: https://www.ffpri.affrc.go.jp/pubs/bulletin/418/documents/418-2.pdf (accessed Janunary 29, 2024).
Matsumoto, F., Mikami, T., and Fukuoka, Y. (2006). Effects of heat island on the flowering dates of Prunus yedoensis: case study in the wards of Tokyo. Geogr Rev. Jpn 79, 322–334. (in Japanese with English summary). doi: 10.4157/grj.79.6_322
Nagai, S., Saitoh, T. M., and Miura, T. (2020a). Peak autumn leaf colouring along latitudinal and elevational gradients in Japan evaluated with online phenological data. Int. J. Biometeorol. 64, 1743–1754. doi: 10.1007/s00484-020-01953-6
Nagai, S., Saitoh, T. M., and Morimoto, H. (2020b). Does global warming decrease the correlation between cherry blossom flowering date and latitude in Japan?. Int. J. Biometeorol. 64, 2205–2210. doi: 10.1007/s00484-020-02004-w
Nagai, S., Saitoh, T. M., and Yoshitake, S. (2019). Cultural ecosystem services provided by flowering of cherry trees under climate change: a case study of the relationship between the periods of flowering and festivals. Int. J. Biometeorol. 63, 1051–1058. doi: 10.1007/s00484-019-01719-9
Ohashi, Y., Kawakami, H., Shigeta, Y., Ikeda, H., and Yamamoto, N. (2012). The phenology of cherry blossom (Prunus yedoensis “Somei-yoshino”) and the geographic features contributing to its flowering. Int. J. Biometeorol. 56, 903–914. doi: 10.1007/s00484-011-0496-4
Sato, M. (2014). Long-term variations of budding and flowering in trees of the botanical garden of University of Tsukuba, Japan. Tsukuba J. Agric. For. 2, 41–55. (in Japanese with English summary).
Shin, N., Kotani, A., Tei, S., and Maruya, Y. (2022a). Record mining of cherry flowering phenology in Tokyo during the Meiji and Taisho eras from Atomi Kakei's diary. Jpn. J. Biometeorol. 59, 89–99. (in Japanese with English summary).
Shin, N., Kotani, A., Tei, S., and Tsutsumida, N. (2022b). Monitoring of cherry flowering phenology with Google Trends. PLoS ONE 17, e0271648. doi: 10.1371/journal.pone.0271648
Tsutsumida, N., and Funada, S. (2023). Mapping cherry blossom phenology using a semi-automatic observation system with street level photos. Ecol. Infor. 78:102314. doi: 10.1016/j.ecoinf.2023.102314
Keywords: big data, Cerasus ×yedoensis, Cerasus jamasakura, ecosystem service, tourism
Citation: Shin N, Saitoh TM and Tsutsumida N (2024) Retrieval of cherry flowering phenology on Flickr and YouTube: a case study along the Tarumi railway, Gifu, Japan. Front. Sustain. Tour. 3:1280685. doi: 10.3389/frsut.2024.1280685
Received: 21 August 2023; Accepted: 19 January 2024;
Published: 07 February 2024.
Edited by:
Wei-Ching Wang, Nanfang College of Sun Yat-sen University, ChinaReviewed by:
Yi-Shiang Shiu, Feng Chia University, TaiwanCopyright © 2024 Shin, Saitoh and Tsutsumida. This is an open-access article distributed under the terms of the Creative Commons Attribution License (CC BY). The use, distribution or reproduction in other forums is permitted, provided the original author(s) and the copyright owner(s) are credited and that the original publication in this journal is cited, in accordance with accepted academic practice. No use, distribution or reproduction is permitted which does not comply with these terms.
*Correspondence: Nagai Shin, bmFnYWlzQGphbXN0ZWMuZ28uanA=
Disclaimer: All claims expressed in this article are solely those of the authors and do not necessarily represent those of their affiliated organizations, or those of the publisher, the editors and the reviewers. Any product that may be evaluated in this article or claim that may be made by its manufacturer is not guaranteed or endorsed by the publisher.
Research integrity at Frontiers
Learn more about the work of our research integrity team to safeguard the quality of each article we publish.