 Ahmed M. Abed1,2*
- 1Industrial Engineering Department, Engineering College, Prince Sattam bin Abdulaziz University, Al-Kharj, Saudi Arabia
- 2Department of Industrial and System Engineering, Zagazig University, Zagazig, Egypt
Supply chains (SCs) serve many sectors that are, in turn, affected by e-commerce which rely on the make-to-order (MTO) system to avoid a risk in following the make-to-stoke (MTS) policy due to poor forecasting demand, which will be difficult if the products have short shelf life (e.g., refrigeration foodstuffs). The weak forecasting negatively impacts SC sectors such as production, inventory tracking, circular economy, market demands, transportation and distribution, and procurement. The forecasting obstacles are in e-commerce data types that are massive, imbalanced, and chaotic. Using machine learning (ML) algorithms to solve the problem works well because they quickly classify things, which makes accurate forecasting possible. However, it was found that the accuracy of ML algorithms varies depending on the SC data sectors. Therefore, the presented conceptual framework discusses the relations among ML algorithms, the most related sectors, and the effective scope of tackling their data, which enables the companies to guarantee continuity and competitiveness by reducing shortages and return costs. The data supplied show the e-commerce sales that were made at 47 different online stores in Egypt and the KSA during 413 days. The article proposes a novel mechanism that hybridizes the CatBoost algorithm with Dingo Optimization (Cat-DO), to obtain precise forecasting. The Cat-DO has been compared with other six ML algorithms to check its superiority over autoregressive integrated moving average (ARIMA), long short-term memory (LSTM), deep neural network (DNN), categorical data boost (CatBoost), support vector machine (SVM), and LSTM-CatBoost by 0.52, 0.73, 1.43, 8.27, 15.94, and 13.12%, respectively. Transportation costs were reduced by 6.67%.
1 Introduction
One of the main elements contributing to the success of contemporary businesses, especially e-commerce, is effective and efficient supply chain management, which is beyond the obstacles that stand in the way of supply and demand by using outstanding machine learning (ML) methods in their compatible sectors.
Supply chain management (SCM) discovers the strengths and weaknesses in the decentralized business, which do not achieve optimum utilization of resources due to many obstacles that resist continuous performance improvement. The weakness of SC is due to its quick, massive, chaotic, and uncertain data, lack of communication, and prediction in tracking consumer behavior, which inhibits the rapid handling of all SC issues parallelly and affects negatively meeting the SDG 9 objective (Cho and Gerchak, 2005; Garfamy, 2011; Wenzel et al., 2019). The necessity of machine learning (ML) to raise communication to a reliable level guarantees the sustainability of the working of all SC sectors. It helps researchers save time in choosing preferable algorithms that suit their issues to gain high accuracy in a short time, according to Huber and Stuckenschmidt (2020).
Large volumes of dynamic data are regularly generated, gathered, and stored in various process businesses in the big data era, which is considered the backbone growth of the business. Data are vital for enhancing operational activities and its design. Making intelligent use of this data, together with the extraction of information and the formation of knowledge to facilitate experience exchange, has many potential benefits. It has become necessary to gain sustainability via a business that joins many engineering edges such as the supply chain because it is interested in optimizing seven edges, namely, production, inventory management, circular economy, demand forecasting, transportation and distribution, procurement and supply management, sustainable development, and supply chain improvement. The question is as follows: how can these edges join and manipulate their data? The answer is in using Internet of things (IoT) manipulated by machine learning (ML) algorithms to gain system optimization. The ML is superior to the traditional decision-support system as discussed by Ben-Daya et al. (2019), facing massive data satisfactorily to meet smart supply chain management (SSCM). Machine learning algorithms can find previously unidentified trends in data, producing fresh perspectives and pointing researchers in the right direction. Many industries, such as operations, manufacturing, healthcare, and dwellings, can benefit from the application of ML techniques as discussed by Darvazeh et al. (2020). This article is an answer to the main question for a published paper on the conceptual framework that integrates the IoT by ML algorithms to improve its performance. First and the foremost, the IoT is used to visualize missions via data in the real place (Genjutsu) to predict future situations monitored, to maximize the desirable objective. Although there is no standard definition for artificial intelligence (AI), most researchers define it as the ability of machines to do what humans do in decision-making based on professional data classification, to discover specific behaviors of data to present precise forecasting guides to prevent the recurrence of problems. In the last decade, applications of AI have increased rapidly in many sectors, especially the industrial sector, as organizations considered it as a perfect solution for end-to-end SC activities, and it promises value for organizations. Pournader et al. (2021) address that AI is divided into three main branches, namely, sending and interacting (vision and speech recognition), learning (ML), and decision-making (simulation, planning, and scheduling). Zekhnini et al. (2021) define ML algorithms as having the ability to discover the hidden and complex relationships of data that humans are not able to observe. Therefore, Ni et al. (2020) consider ML as a learning technique concerning the application of computer procedures that can learn according to self-aware to be smart and have experiences which can be managed through a controller unit to make appropriate and reliable decisions. System configuration is shown in Figure 1 (Sharma et al., 2020).
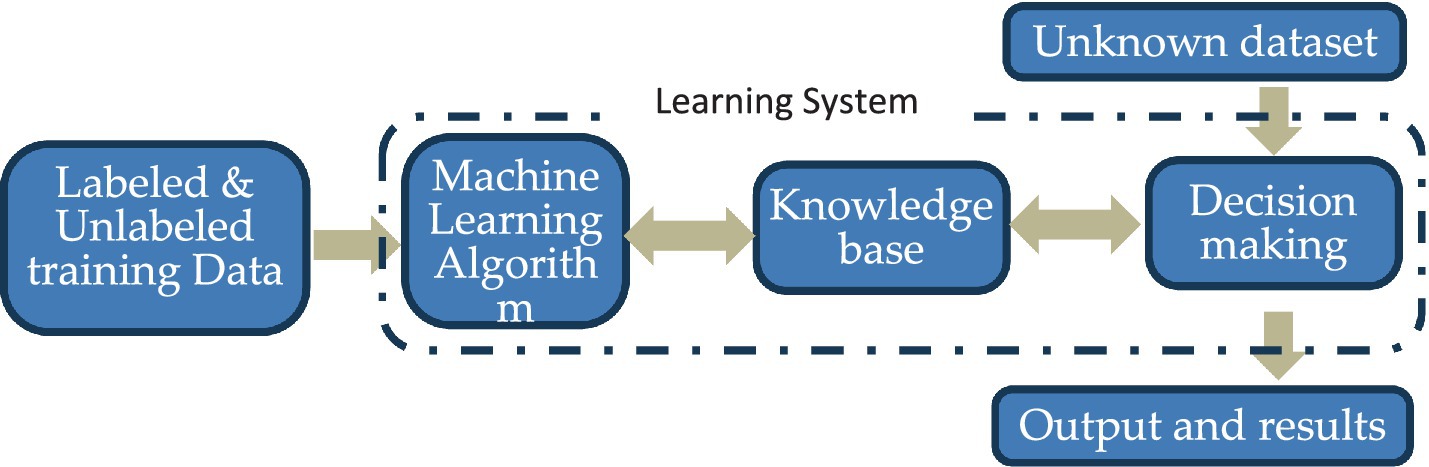
Figure 1. ML system configuration (Sharma et al., 2020).
According to Jordan and Mitchell (2015), Traore et al. (2017), and Sharma et al. (2020) discuss three main types of ML, namely, supervised, unsupervised, and ensemble learning, as shown in Table 1. In addition, many researchers can handle the data through semi-supervised learning algorithms in the case of using labeled and unlabeled data in classification data with high precision. Unlike previous training methods, reinforcement learning algorithms are based on the last outcomes to decide whether to continue or stop. Machine learning applications in demand forecasting focus on balancing the SCM sectors. Therefore, many researchers compete to meet high accuracy to reduce losses. Izadyar et al. (2015) applied artificial neural networks to operate genetic propagation algorithms and compare them with extreme machine learning algorithms that produce more accurate results for heat demand forecasting, as discussed by Prifti et al. (2024). The performance of SCM in the digital transformation of emerging organizations is impacted by demand forecasting, which sounds negative in many sectors if accuracy is low. With current circumstances being complicated, dynamic, and uncertain, it may mark the biggest shift in integrated SCM significance. Ranking-wise, the RF classifier performs better on this particular forecasting of demand challenge than the artificial neural network, which trails in the investigated category. Bayesian neural network forecasts show that the log price and volatility of e-commerce sales follow a consistent trend, as cited in Klar et al. (2023), which may not be logical to perceive as chaotic behavior. SVMs and perceptron-learning algorithms are flexible and effective in handling non-linear relationships and high-dimensional data for both supervised and unsupervised data, especially in identifying the exact hyperplane dividing the many classes present in the intended attribute. How well a perceptron classifies newly acquired data inputs serves as a measure of its effectiveness. Sheth et al. (2022) discuss how ANN and SVM provide 100% accuracy for 80% of the forecasting process, while according to Cannas et al. (2023) provide the 67.2% highest forecasting accuracy, which outperformed over DNN used by Sin and Wang (2017) who gained 50.43% accuracy and proved by Cao et al. (2016). Feedforward ANNs are effective at categorizing data and recognizing straightforward patterns, two basic issue types. However, more difficult duties may prove difficult for them. However, because algorithms that use deep learning have several underlying layers of abstraction, they can handle and analyze large amounts of data. Two well-liked recurrent RNN long-term memory versions are long short-term memory (LSTM) networks and gated recurrent unit (GRU) networks. Using the identical database to track specific sales for products, GRU processes it 29.29% quicker than LSTM. The accuracy ratio, recall ratio, and F1 ratio of GRU are, respectively, 23.45, 27.69, and 26.95% greater than those of LSTM while considering the two performance and processing power cost aspects. Ji et al. (2019) demonstrate that dynamic systems are effective if tracked via ARIMA to achieve a minimum reported residual of less than 0.002. The main obstacle to tracking the e-commerce data is that it is quickly updated, massive, chaotic, and imbalanced, which pushes Pant et al. (2018) to make a classification stage before the forecasting process. Wu et al. (2018) gets benefited by presenting a new forecasting framework that is considered the basis for the proposed framework in this article. Sharma et al. (2023) tackle the fluctuation of demand by deducing the correlation among different product sales on e-commerce using polynomial regression that achieves an accuracy of approximately 66.66%. Forecasting energy consumption using machine learning methods was also covered by Huang et al. (2019). Support vector regression was determined by Huang’s team to be the most effective method after comparing it with CatBoost, extreme ML, linear regression, and various other algorithms. CatBoost leverages decision trees to determine the most significant variables and construct models, making it more effective when working with massive data sets and capable of producing more precise findings, balancing the data inputs, and meeting regularization to avoid overfitting. However, there is a chance that ANNs will cost more to compute and take longer to train. Ibrahim (2021) discusses using binary classified-vector-prediction, Naive Bayes, SVM, and logistic regression that are superior to previous methods to gain an accuracy in forecasting of approximately 72% when hybridized with the CatBoost algorithm. Yani et al. (2019) took the lead in presenting a hybrid revolutionary forecasting methodology that combines a non-linear autoregressive neural network with discrete wavelet decomposition (DWD) as a part of their suggested new method. The suggested approach demonstrated a high level of proficiency in enhancing the efficacy of demand-side management initiatives. Synchronize Aljojo et al. (2021) develop the Nonlinear-AutoRegressive-with-eXogenous (NARX) inputs method and achieve a breakthrough in forecasting accuracy of 96%. SC managers have used NARX to forecast e-commerce demand to control inventory levels. The NARX is perfect for discovering how the intricate linkages and dynamics observed in supply chains may be captured by its simulations, which makes it an invaluable tool for optimization and decision-making. The NARX is used to enhance algorithms when the prediction timestamp influence is valuable in e-commerce. The best result was given by LightGBM during forecasting in the procurement sector, which had the lowest training time of 0.92 s and the highest accuracy of 95.02%. The computing work needed to provide the LightGBM model was minimal when compared with the inelastic structural evaluations as discussed by Sun et al. (2020). Mitra et al. (2023) rely on the CatBoost algorithm which outperforms RF and gradient boosting in accuracy for forecasting and mimics the NARX method. Therefore, this article is based on improving the works of Wu et al. (2018), Aljojo et al. (2021), and Mitra et al. (2023) to enhance the proposed framework and working mechanism that deal with speed, massive, imbalanced, and chaotic data of e-commerce sales (i.e., demands) by classifying to make dimension reduction to tackle the imbalance and chaotic features and then forecasting using the CatBoost algorithm that is enhanced by hybridizing with Dingo optimization and comparing the results with most published algorithms of machine learning that focus on forecasting a fluctuating demand. The classification relies on meet dimension reduction, which is based on feature selection to treat the imbalance in the data input and struggle with multicollinearity. Therefore, researchers resorted to using Lasso Regression, which is effective at feature selection, or Ridge Regression, which is better suited for handling multicollinearity. Classification of supervised data learning and clustering of unsupervised data learning are based on dimension reduction techniques such as PCA, LDA, and t-SNE, which enhance ML mechanisms’ work and preserve essential features by increasing generalization when reducing the number of predictor variables. The main role of dimension reduction is to eliminate redundant features that are noisy and control the attainable variables. The LDA and PCA maximize data projection points in the tree regression, and t-SNE makes the separation mechanism visualize. Generative adversarial network (GAN), a type of deep-learning mechanism, deals with the problem of data imbalance as a result of data loss in database rows, which works in the reverse direction of dimension reduction methods, by generating hypothetical intermediate data not existing in the training dataset, reaching a novelty rate of 92.53% when generating 2 million observations, as discussed by Liu et al. (2019) and Shrestha et al. (2021). An autoencoder works on unsupervised data learning and aims to reduce the number of dimensions using latent space and rebuild the optimal cost matrix through 83% training. The mean squared error (MSE) loss function is used for 90% validation accuracy, which relies on reconstructing the input data as manipulated by Chong et al. (2017), Gao and Lee (2019), and Aamer et al. (2020). An effective agglomerative clustering technique uses a heap to keep track of the distances between each pair of clusters in the root node of the tree. Therefore, researchers resorted to clustering of unsupervised data learning to pave the way for forecasting mechanisms via k-means and mean-shift algorithms. They found that K-means works quicker and more robustly in terms of efficiency if the clusters are over 10 and less than 15 while using mean-shift if bandwidth h lies in the range of 0.03 to 0.06. When it comes to tiny data sets, the FP growth method is the fastest; nevertheless, when it comes to generating frequent item collections, the ECLAT and Apriori algorithms perform better. If hybridized by random forest, BayesNet, sequential minimal optimization (SMO), random gradient descent (SGD), and multinomial logistic regression (MLR), the accuracy values are 100, 96.75, 98.25, and 95.75%, respectively as discussed by Prifti et al. (2023). Predicting the sales and returns of merchandize is a crucial component of procurement management that affects inventory and production sectors. A persistent problem, particularly in online grocery and other foo, shops embedded in the Hunger Station application, is estimating market demand and determining inventory supply levels by using nine regression models (i.e., RF, linear regression, logistic regression, SVM, ANN, SVM, ARIMA, NARX, and decision tree), which hybridize with Adaboost algorithms through a fuzzification model. Minimal deviations between predicted and actual values characterize an exceptional performance of the Random Forest model, as discussed by Vairagade et al. (2019) and Prifti et al. (2023). Based on the estimation features (specificity, accuracy, and sensitivity), the RF approach yielded the most accurate predictions according to Hamming distances, which aid in giving the closest predictions larger weights.
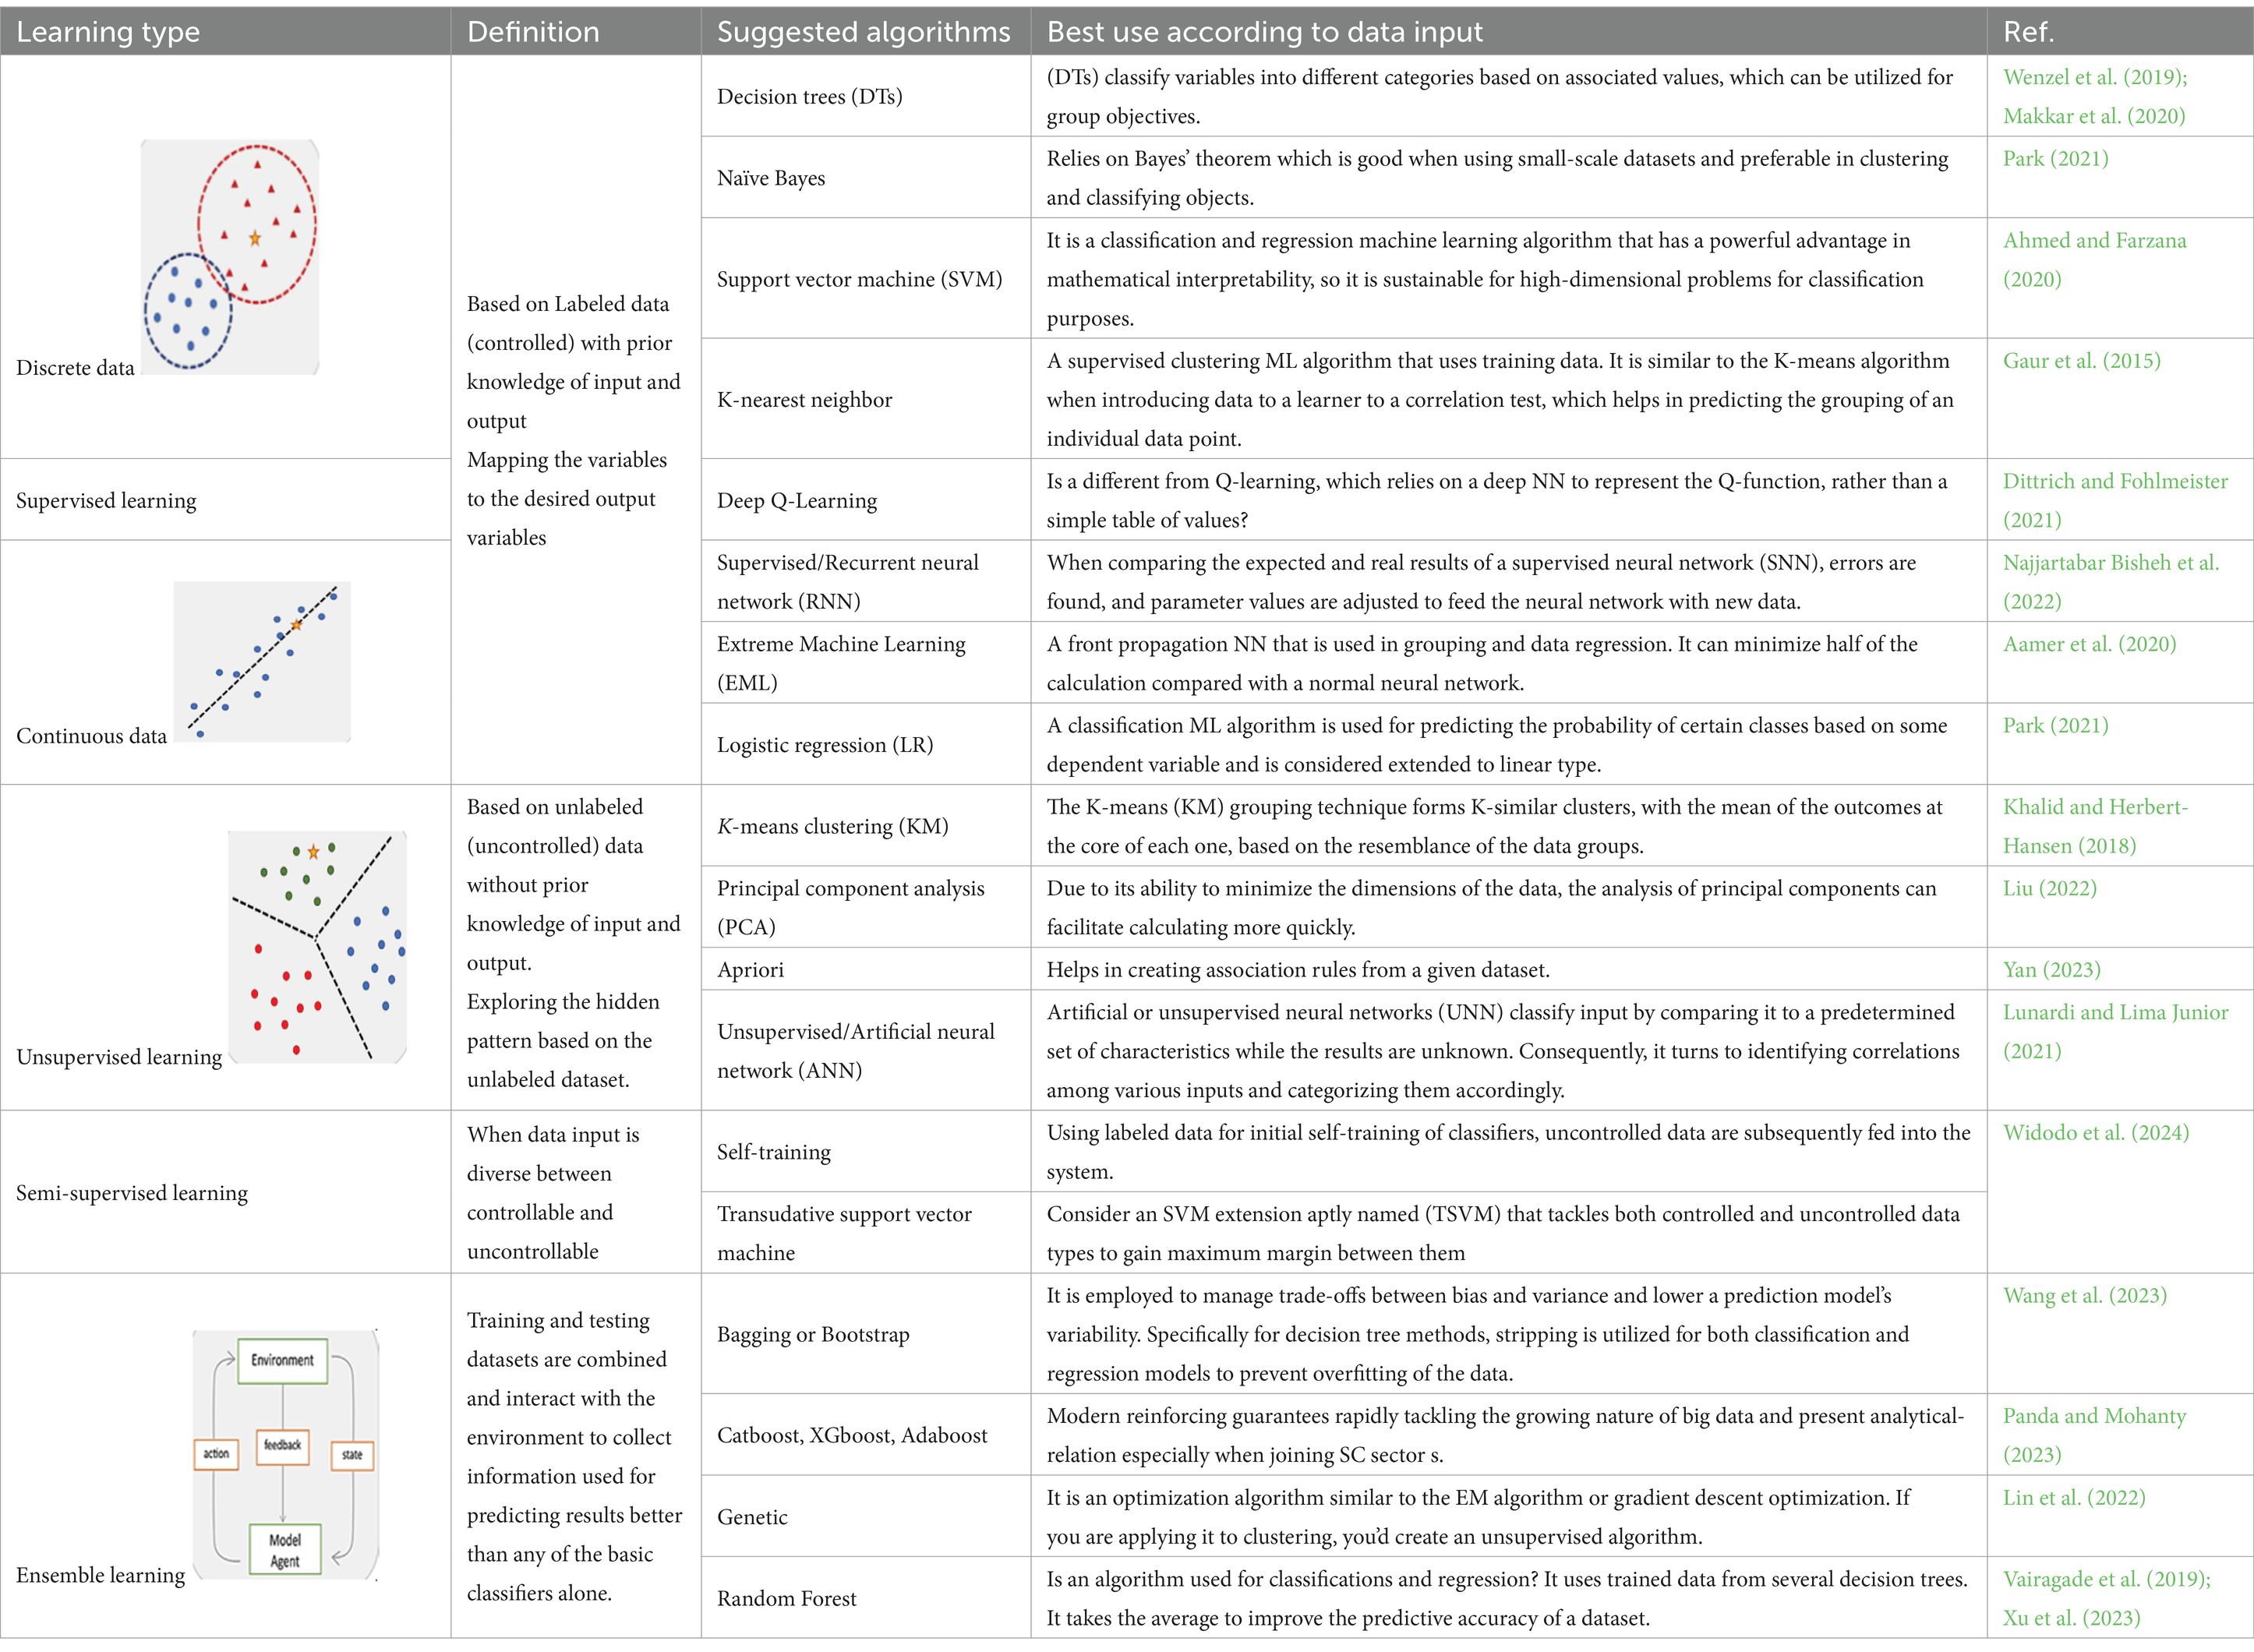
Table 1. ML categories and most common algorithms work on supply chain sectors.
The success of the SC is to satisfy the customer’s demand at a suitable time with the required quality at a minimum cost. Managing sector parts between supply chain parts is a significant part of achieving this success via eliminating non-value-added activities across the chain to make it more agile, as discussed by Yu Lin and Hui Ho (2008); Kovács and Kot (2016); Yan et al. (2019); Pournader et al. (2020b). Any organization aims to satisfy the customers’ requirements with the minimum cost as observed in the study by Abed et al. (2023). Figure 2A illustrates the number of most common ML algorithms used in 89 published papers obtained from the Taylor & Francis, Emerald, and ScienceDirect libraries and focuses on the interval during 2016–2024. Many researchers are keen to use GA and unsupervised neural networks, and there is a poor use of CatBoost and Apriori algorithms, despite their efficiency and modernity. There are 10 sectors of SCM as shown in Figure 2B, where many researchers focus on circular economy that touches on its importance in sustaining the SC cycle, 17 of them tackle inventory problem, while 15 are interested in forecasting the demand that affects transportation and distribution to set inventory dimensions. In addition, little researchers are interested in using sustainable development in supply chain issue, therefore focus on the causes of the lack of research in this area. The authors believe in sustainable development based on one strong motivation between common sectors, which is the circular economy.

Figure 2. (A) The most ML algorithms used in supply chain management. (B) Classification based on the SCM interest.
Moreover, organizations need to implement new approaches and new technologies to meet these challenges. ML and IoT technologies represent the main pillars of industry 4.0 transformation. In this research, Sec. (1) and its subsection give a detailed review of ML applications in SCM and how SCM can be benefited from it. Sec. (1.2) illustrates a Workflow for building an ML model via common algorithms. Sec. (2) discusses the research gap to pave to hybridize the optimization algorithms with ML algorithms to gain enhancement in its mechanism behavior and present its pseudocode. Sec. (3) presented a conceptual framework for applying ML applications in SCM and some limitations of applying it. Sec. (4) illustrates an illustrative example of how to apply ML in a circular economy and discusses the proposed mathematical model of the proposed technique. Finally, conclusion is presented in Sec. (5), and future work is suggested in Sec. (6).
1.1 Taxonomy relationship between SCM and ML
The number of research that has been published about the use of algorithms based on ML in SCM is insufficient, even though there are many papers in the fields of ML and SCM independently, as discussed by Bertolini et al. (2021) who derived his study from Ciresan et al. (2012) and Leung et al. (2014). However, there is a lack of communication in this field between scholars and practitioners. It may result from practitioners’ lack of understanding of the capabilities and benefits of ML algorithms for handling SCM issues. This section provides an overview of how the most well-known algorithms that use machine learning are used to manage supply chain-related challenges, such as risk related to suppliers, supplier classification, and choosing suppliers.
1.1.1 Ml applications in SCM
The resistance to diseases via human immunity power that based on healthy foods produced from vegetables or fruits. These products have a low life cycle and entail spoilage if the producer presents more than customer demand requirements. Therefore, accurate forecasting is a suitable solution for tackling online historical massive data. Food goods are perishable; hence, Ni et al. (2020) showed in their research by finding that the food and grocery businesses dominate the usage of ML approaches in their SCM to get accurate demand forecasts. Sharma et al. (2020) examined research articles that use machine learning (ML) in the agriculture supply chain (ASC). They looked at 93 studies that addressed the advantages of using ML algorithms in various SC sectors to ensure a profit on this investment. Therefore, the researchers have been directed to a circular economy that is based on prediction to be able to use all product components. In addition, they believed that ML could improve the performance and efficiency of ASC and solve various challenges such as low life-cycle, customer management, and environmental effects. Ciresan et al. (2012), Leung et al. (2014), and Tirkolaee et al. (2021) created a conceptual framework to highlight how ML approaches help with supply chain risks, production, demand forecasting, and supplier selection, among other SCM tasks. Based on the data amount and major variable behavior, the significance of selecting an appropriate ML method is acknowledged throughout the text. The authors conclude that there are significant gaps in supply chain design and optimization between ML and the mathematical optimization model. Wamba et al. (2017) and Priore et al. (2019) presented a system that demonstrates the implementation of machine learning (ML) in a dynamic supply chain context with large, dynamic data sets impacted by contemporary internet applications such as the Internet of things. The policies in effect quicken the SC. According to Perera et al. (2020), the suggested framework is regarded as a guide for managers to comprehend complicated inventory scenarios and how managers may choose replenishment plans efficiently. An order-up-to-replenishment policy’s stock level is contingent upon the vendor’s lead time on item delivery. Abed and Seddek (2022) based on the study by Singh et al. (2018), suggest that periodic order-up-to systems are the most appropriate for small businesses with little inventory spread across many warehouses as discussed by Singh et al. (2018), where their model proved its efficiency in decreasing operation costs as it reduced time for replenishment by 88% using support vector machine (SVM) to analyze data from social media (twitter), as shown in Figure 3. In 2013, the ML algorithm was used to analyze people’s sentiments about mobiles, electronic products, and laptops from tweeters’ posts, which divided people’s opinions associated with their products into two satisfaction categories (positive or negative) according to Neethu and Rajasree (2013), proving its efficiency in improving the supply chain especially that associated with their customer feedback. The new feature vector was proposed to face the problem of handling misspellings and slang words by doing feature extraction in two procedures. The first one is to make a summary of specific features from tweets and add it to the feature vector. The second step is to remove these features from tweets, extract them again, and then add them to the feature vector. The proposed vector approved its accuracy in the electronic products domain compared with other feature vectors. The second inquiry is about risks facing supply chains and requires techniques to help detect, evaluate, and lessen different types of risk. The term supply chain risk management (SCRM) is interested in routine occurrences to extraordinary disruptions.
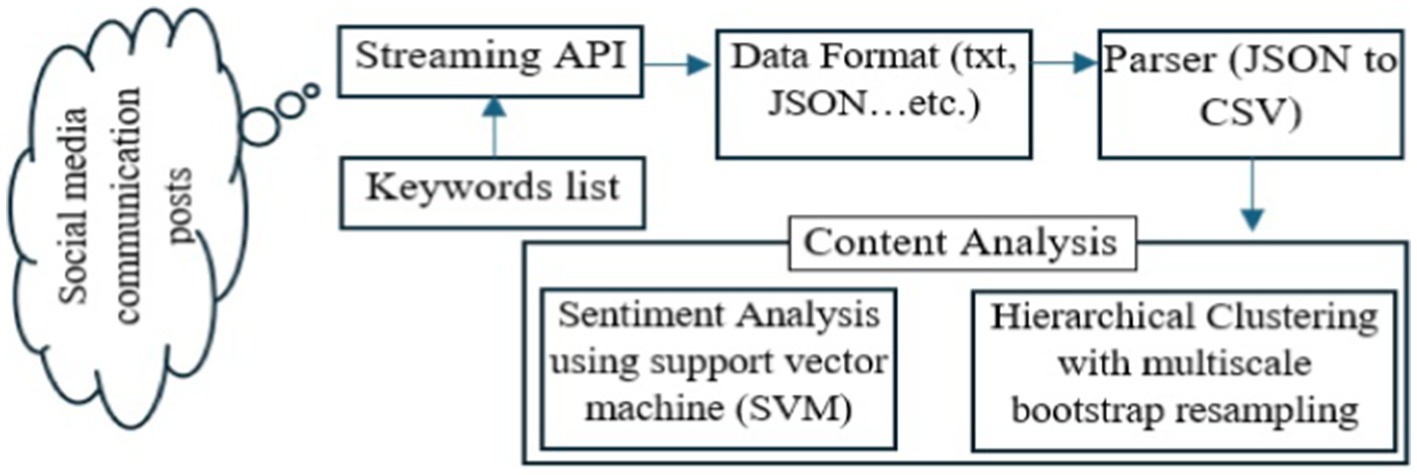
Figure 3. Analyzing data from Twitter (Singh et al., 2018).
Montufar et al. (2014), Ma et al. (2015), and Han and Zhang (2021) illustrate the way for using ML algorithms to effectively manage risks in the supply chain. They built a model based on the neural network and then they used MATLAB to simulate their model and validate it with examples. The results showed that the model proposed is applicable and has a feasible effect in managing supply chain risks. This study illustrates the approach that pushed Salama et al. (2023) to present its results, which is based their study by Aburto and Weber (2007), Raina et al. (2009), Kraus et al. (2020), and Abed and Al-Attar (2018), streamlining when presenting a hybrid system for estimating demand that can be used for the retail industry. In case of the auto-combined regressive integrated moving average (ARIMA) models and neural networks, the proposed model approved its value in improving accuracy for a short-term forecast, improving service quality and reducing sales failures that increase competitiveness. Nie et al. (2012), Sameh Ibrahim et al. (2011), and Baecke et al. (2017) presented a model for forecasting demand they integrated the SVM algorithm with the moving average for estimating linear and non-linear basic part of load, then authors tried the proposed model on large sample estimation, and approved its ability in improving forecast accuracy. Wang and Zhang (2020) introduced a framework, a statistical approach, based on multiple costing frameworks for power control by applying ML model for power optimization and cost reduction, as discussed by Furian et al. (2021).
Then, they presented a general model to solve the problem of idleness and explored techniques to increase the profitability and efficiency of organizations and achieve sustainability, as discussed by Vandchali et al. (2021) and Vandchali et al. (2021). DuHadway et al. (2019) used ML algorithms for the automatic detection of RFID readings in a real-world factory to help in risk detection. They used three classifiers named logistic regression, SVM, and DTs, which combined to classify RFID readings more effectively. The results showed that logistic regression provided the lowest accuracy (92.75%), DTs provided accuracy of 92.85% and SVM provided the highest accuracy (95.3%). Generally, ML algorithms provide a significant solution for identifying and tracking goods overall in the supply chain. In the Healthy sector, Haq et al. (2018) and Malviya et al. (2021) used ML algorithms for the forecasting of heart disease, and backorders for healthy supplies, seven ML algorithms were used. Dzogbewu et al. (2023) investigated supply chain disturbances during the COVID-19 pandemic in South Africa’s industrial sector, and the application of technology for additive manufacturing to mitigate those disruptions relies on Han and Zhang (2021), but they adopted a qualitative research approach. A company’s supply chain robustness is its capacity to recover from adversity. Supply chain endurance describes the ability of the system to adapt and withstand transient disturbances. Previous research has shown that for businesses to increase their supply chain resilience capability while dealing with other vendors, design information portability and substitutability were necessary, as discussed by Belhadi et al. (2022). Based on lean techniques to control waste elimination in SCM activities and sustain SC on the green side to respect the environment, the success of SCM relies on the perspective of Friedman (2008). This objective is the best resistance to poverty and considers the health of people because many people share in these chains to save their income and achieve social welfare. Therefore, securing the supply chain of risks via understanding the supply chain risk management (SCRM) is the most important safeguard for the safety and sustainability of living life. The different algorithms of machine learning prove successful SCM, especially in reducing cost and delivering parcels in minimum time in the right agreed place. The ML is a real embodiment of the objectives of Industrial Revolution I4.0 through artificial intelligence superiority.
1.1.2 Supply chain risk management
Several risks affect the success of the enterprises and are managed via aptly named SCRM, which aims to identify, assess, and mitigate unexpected risks, which involve both negative and positive outcomes. SC research and SCRM are two areas where AI approaches have not received much attention, according to Zhang et al. (2014). Massive amounts of data, more powerful computers, and the effectiveness of machine learning methods have all contributed to the recent rebirth of artificial intelligence (AI). Scientists have used it as an opportunity to utilize AI techniques in SCRM for tasks such as risk identification, evaluation, reaction, and forecasting, according to Yang and Sudharshan (2019) and Toorajipour et al. (2021) (Azar and Dolatabad, 2019; Baryannis et al., 2019; Pournader et al., 2020a). SCRs are the most important supply chain sector that must be framed through two sequential steps:
A. Risk identification: The first activity in SCRM, which is based on classification action for risk causes, must be labeled. Therefore, the organization identifies risk drivers, which are massive and dynamic via supervised learning and focuses on SVM, RF, and DTs, which help the organization measure their risks and suggest some activities to mitigate the consequences.
B. Risk measurement and evaluation: The risk caused by forming massive data needs continuous analysis via suitable ML algorithms; the authors found that the artificial neural networks (ANNs) in both types of SNN or RNN based on Bayesian networks are the two most acceptable potentials in modeling risk assessment that summarized by Mikolov et al. (2011), Dauphin et al. (2014); Tompson et al. (2014), and Wichmann et al. (2020).
Baryannis et al. (2019) presented a comprehensive review of papers that used artificial intelligence (AI) techniques in facing supply chain risks; the result showed that the researchers tend to explore mathematical programming instead of exploring other AI techniques. The benefits of modern artificial intelligence are not being reached yet; many areas need more exploration, such as prediction and learning, decision-making and applicability, big data, and hybridization. Abed et al. (2023) hybridize a mathematical model based on an ML algorithm to enhance heuristic techniques called mat-heuristic and achieve effective output, but the risk management is considered a main obstacle to gain hopeful performance. Figure 4 illustrates seven main types of global supply chain risks, as discussed by Chu et al. (2020), García et al. (2009), and Kamble et al. (2020), each of them have several factors that affect the performance in all supply chain networks such as demand, inventory, shortage, overstock, and supplier, in addition to the factors of supply and demand risks. In addition, the second is political risk factors, such as terrorism, wars, policy, traffic, and pandemic diseases and third is the system risk, such as network, transparency, uncertainty, and trust, as discussed in the third theory of corruption by Abed (2023). The fourth is logistic risks, such as transportation, distribution, warehouse, bullwhip,1 and storage (Traore et al., 2017), while fifth type is financial risks, such as profit, accounting, and finance (Abdel-Basset et al., 2019; Chen, 2022), and the sixth type is operational risks, such as utilization, capacity, schedule, cost, and quality, as discussed by Kamble et al. (2022). The last is environmental risks, such as flood, fire, weather, sustainability, and disasters. All of these factors must be taken into consideration when managing supply chain risks. The lifeline of SCM is combating risks that threaten its sustainability while encouraging a circular economy that ensures the greatest occupancy of means of transportation in the chain to reduce its costs and increase utilization.

Figure 4. Seven main types of global supply chain risks.
The previous research emphasizes that there is no unified definition for SCRM, but any internal or external activities affect the performance negatively of receiving or delivering the parcel at the right time for the right customer in the right place forming risk, leading to a cut in the chain as Singh et al. (2019) prove. Many researchers defined it as the integration between all supply chain partners in taking many actions to avoid risks that may face the success of the organization. These actions could be summarized in three procedures, the first one is to identify, evaluate, and mitigate risks as discussed by Ho et al. (2015), DuHadway et al. (2019), and Baryannis et al. (2019), where the base references of many researchers were seeking to optimize SCM. In addition, one conclusion can be drawn from many researchers, which is that machine learning is the direct way to help in succeeding the SCM and increase its performance.
1.2 Workflow for building a suitable ML model
Figure 5 illustrates six steps for building a general ML model, according to Kamble et al. (2019b) and Kamble et al. (2019a). SC must resort to collecting data quickly and precisely for speed change data system and advocates to integrate IoT in this stage using a controller unit and following the preparation, as discussed by Salama et al. (2023), to train the data according to most training percentages of 30–70% or 20–80% to validate the model.
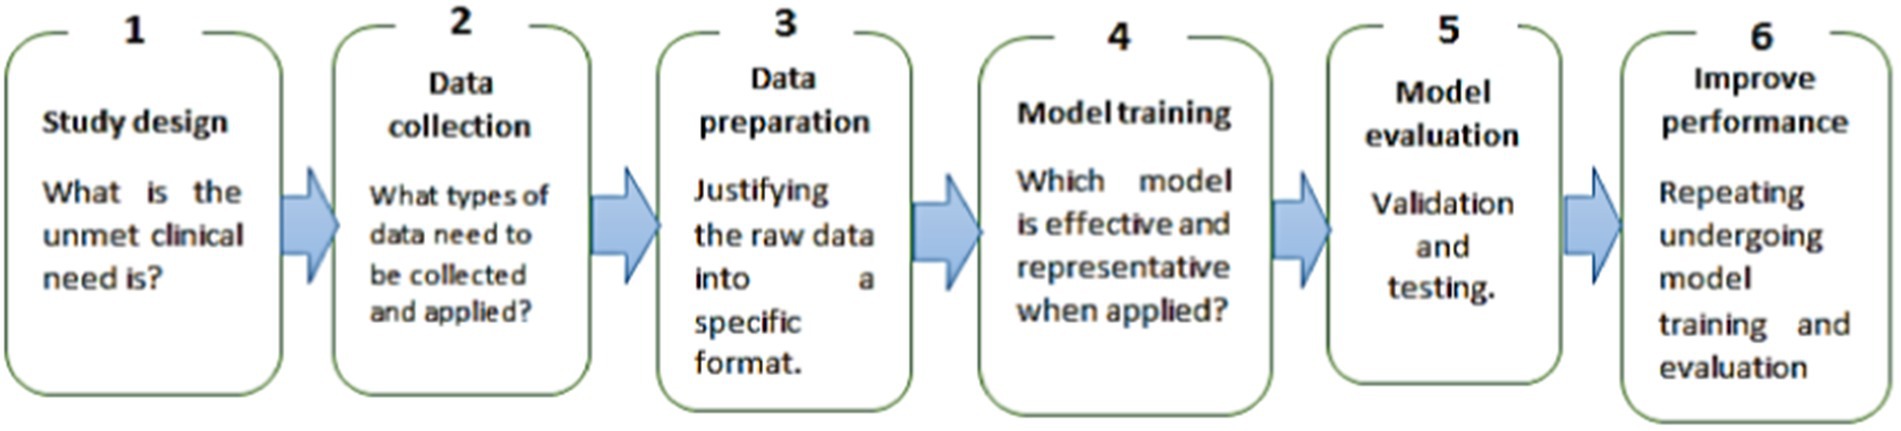
Figure 5. Workflow for building the ML model.
Finally, try to enhance the performance of supply chain system by mitigating expected risks via adopting optimization algorithms such as Dingo, Arithmetic, etc. Therefore, becomes vital to see the effect of AI on optimizing the algorithms of the ML when tackling the SCM sector discussed above and their risks.
1.2.1 Artificial intelligence
Pelletier and Tyedmers (2010), and Sameh Ibrahim, et al. (2011) predicted that more intelligent chains of business would use search and pattern recognition algorithms to analyze real-time data to check product quality. These algorithms are now hierarchical rather than merely predictive, and they will allow supply networks to respond to machine-generated artificial intelligence while offering immediate insight and transparency. Three requirements are needed for smart supply chain management (SSCM) (aptly called instruments, interconnection, and intelligent). ML is a type of AI that makes machines able to simulate the way that humans learn through learning from historical data, as discussed by Goodfellow et al. (2016). There are three main categories of ML illustrated briefly in Figure 6, as expressed by Pournader et al. (2021) and pave the way to Peng et al. (2021) and Bousqaoui et al. (2017), which classified into unsupervised, reinforcement learning affect in supervised learning and used for regression, classification, clustering, and association tasks.
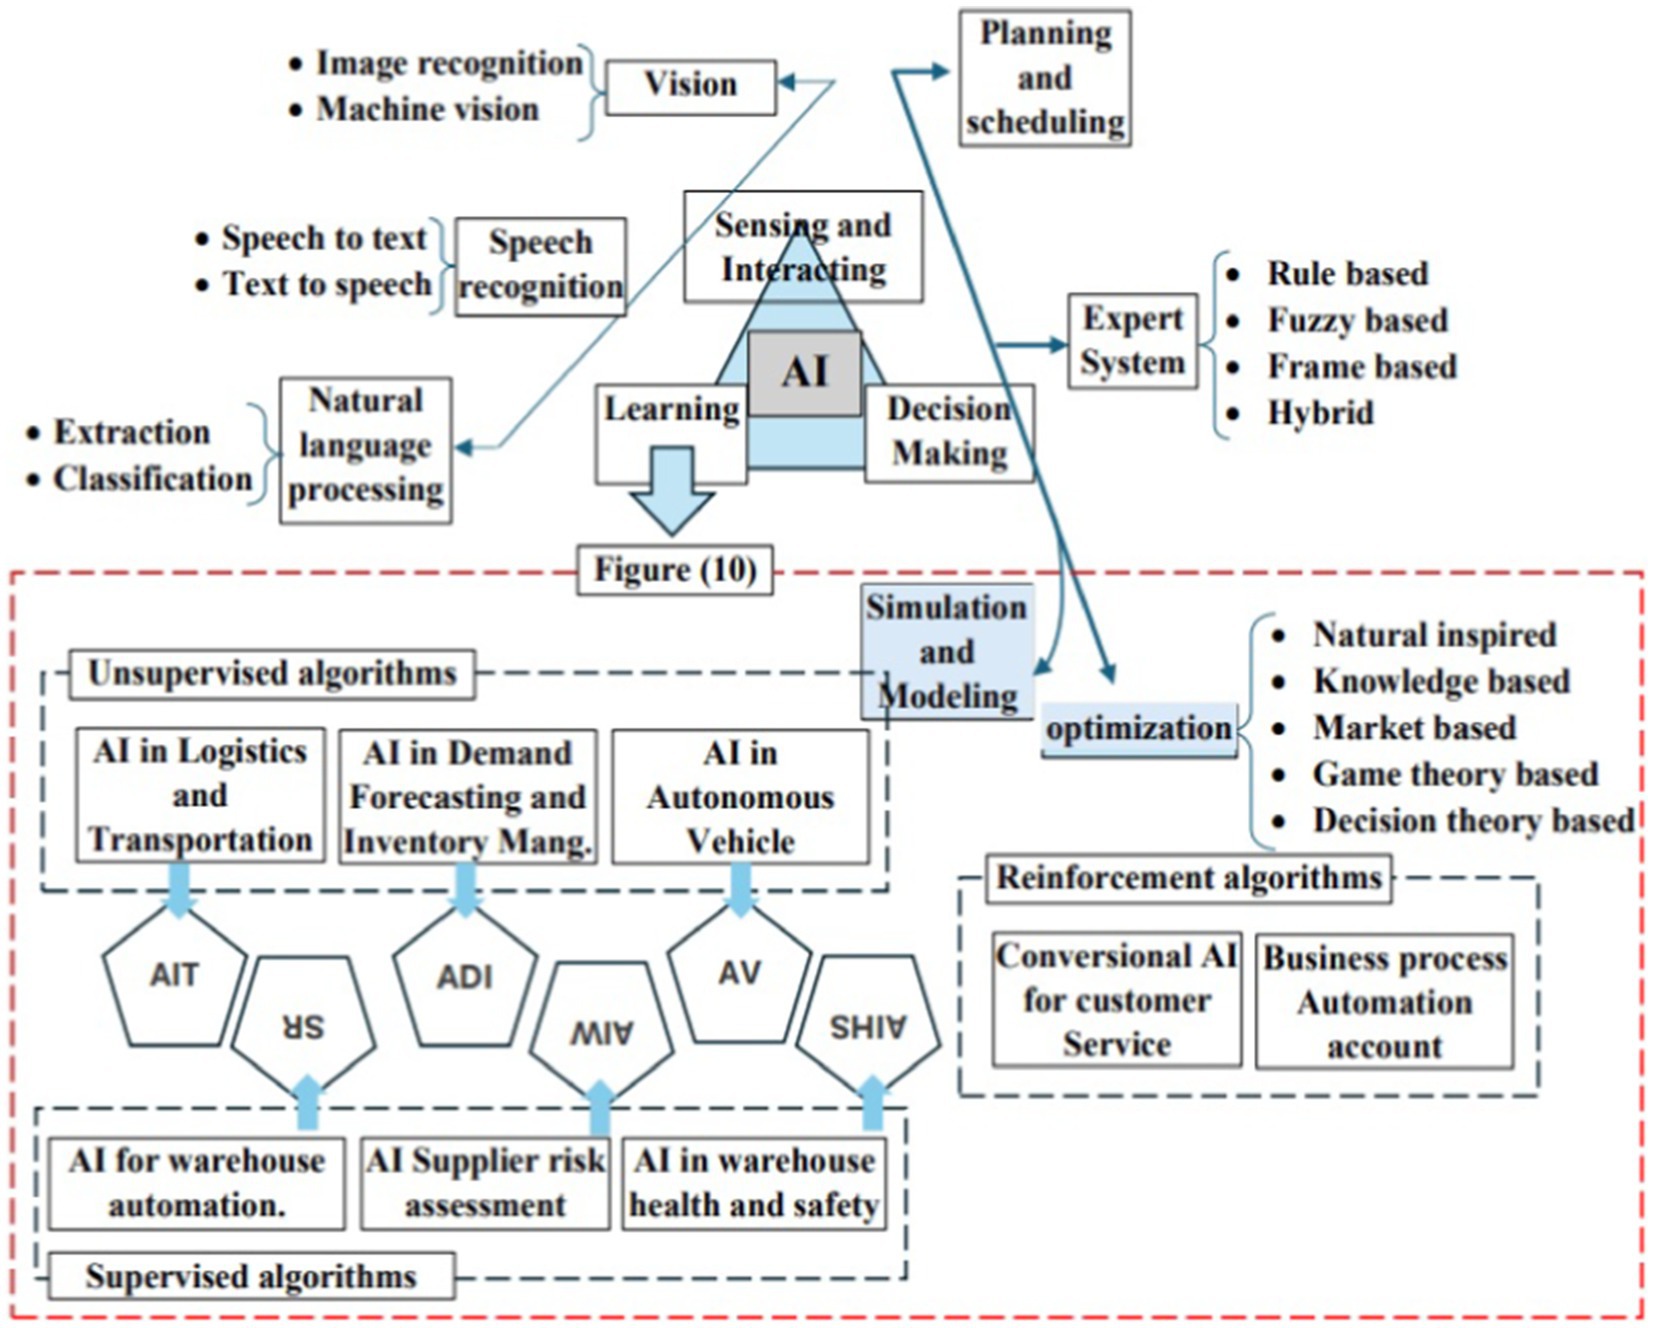
Figure 6. AI taxonomy for ML algorithms in SCM (Pournader et al., 2021).
1.2.2 Ml algorithms used in SCM based on AI intervention
The digital simulator network that tackles the online e-commerce data architecture is presented in Figure 7. A methodology for hybridizing AI to track SCRM activities is shown in Figure 8 to form a conceptual two-way framework to help in risk cause prediction and is acceptable by many scientists in the field (Lee et al., 2018; Giri et al., 2019; Dhamija and Bag, 2020; Peres et al., 2020; Yang et al., 2021). The AI experts’ decisions are contingent upon the inputs whether labeled or unlabeled according to the SC sector, and the developed models and results must be comprehensible to enable making choices based on them or their influence on SCRM decision-making. Although there are 32 commonly used algorithms for ML.
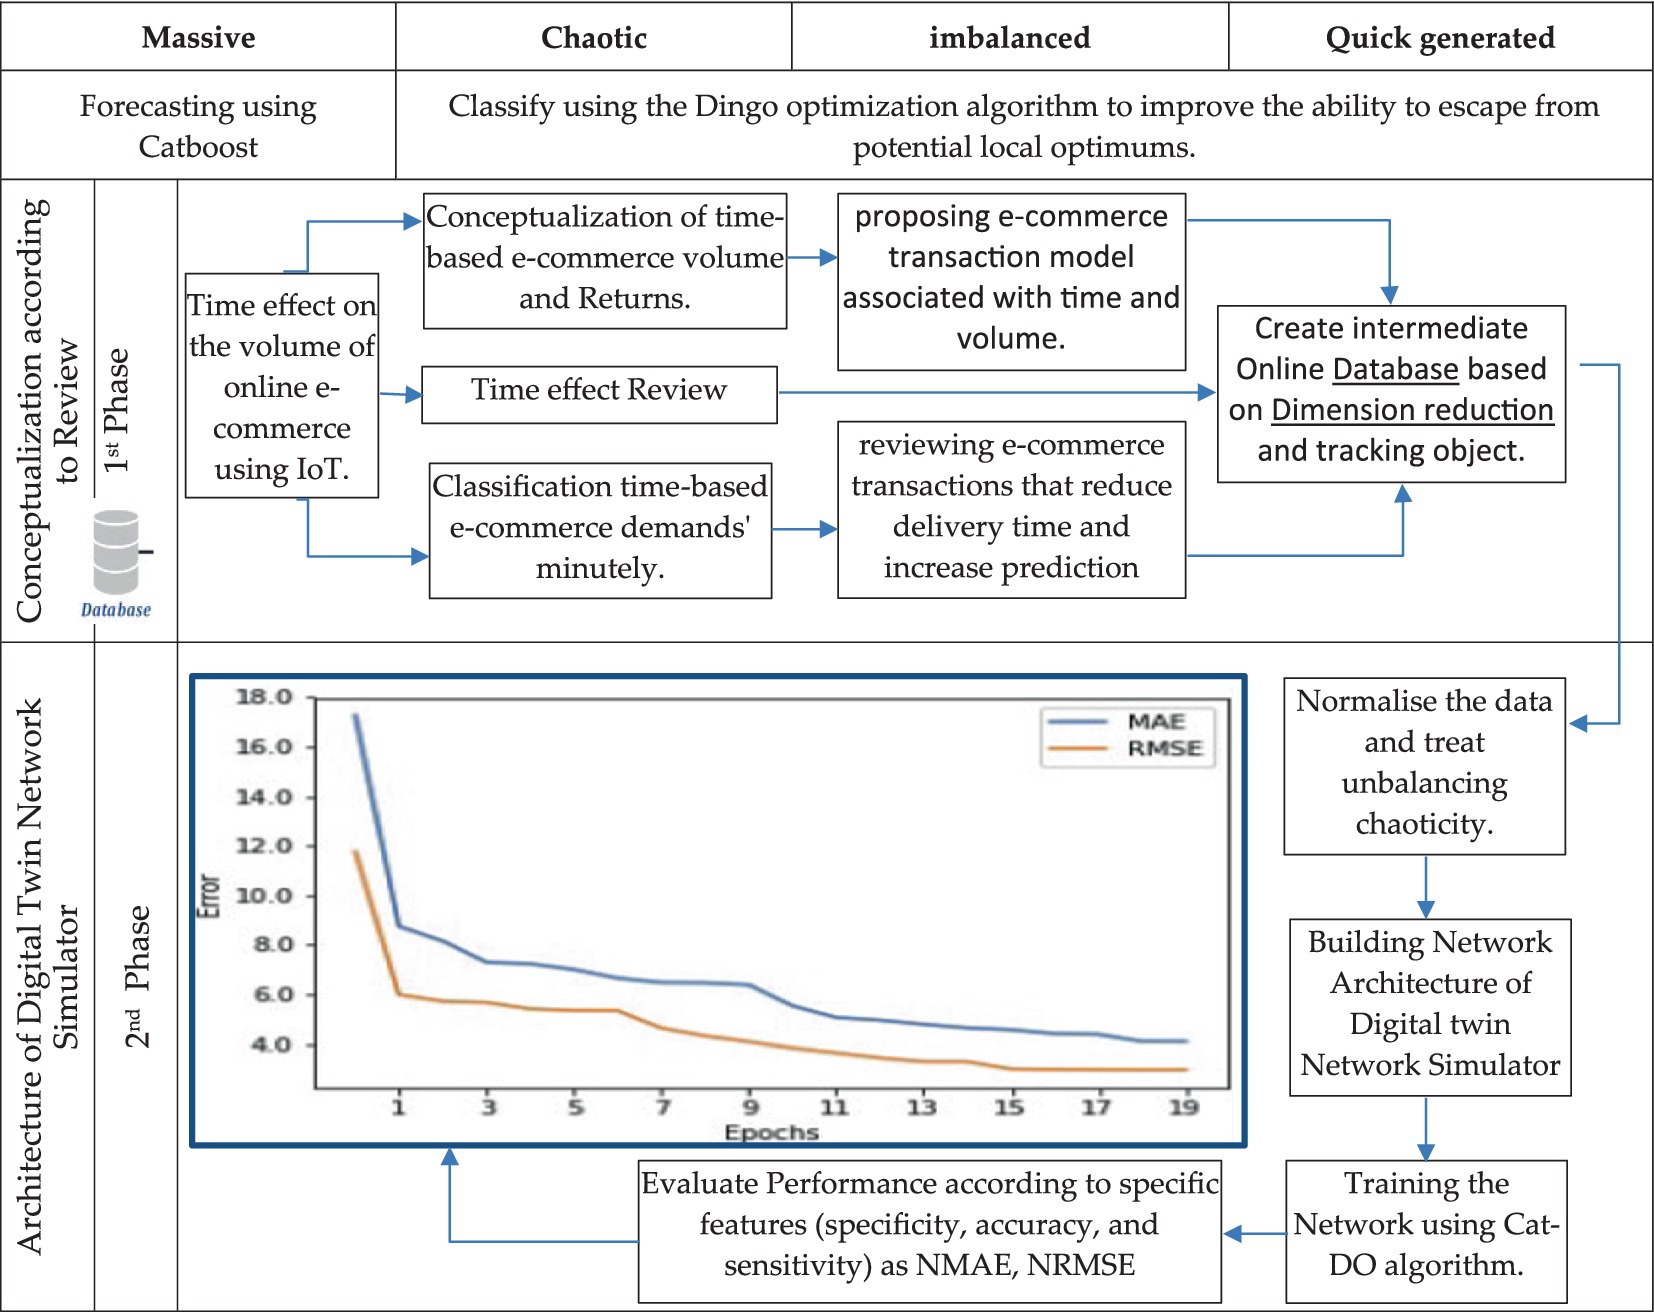
Figure 7. Architectural Framework for Cat-DO controlling digital simulator network.
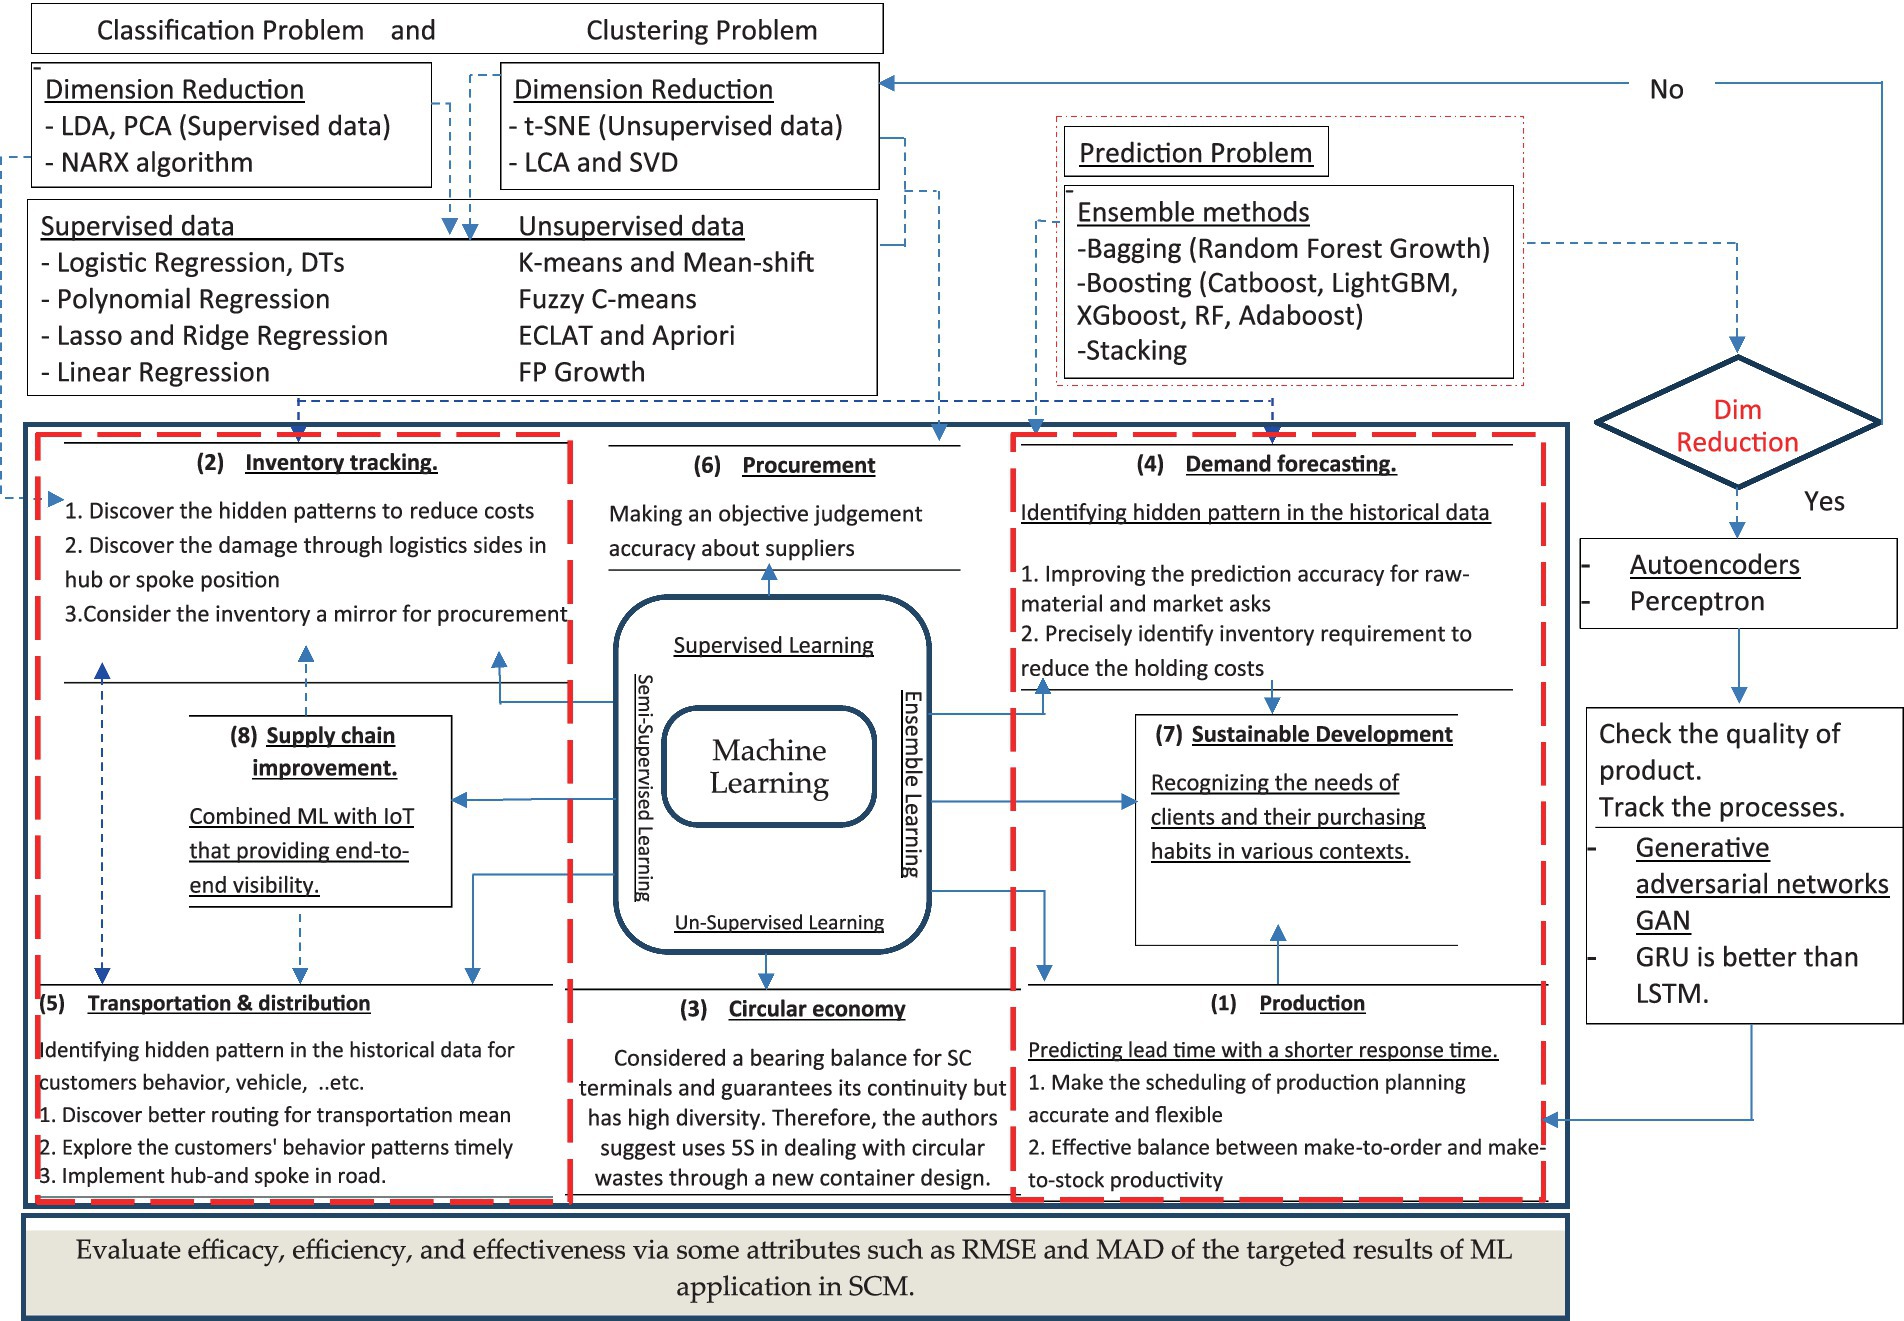
Figure 8. Taxonomy conceptual framework for ML terminals in SSCM.
Although supply chains can gain a lot of benefits from applying ML, There are some limitations to implementing it, such as the ML algorithm’s lack of explanation in detail for how to implement and benefits from applying it, high error-susceptibility, and the ability to accurately interpret the results generated by the algorithm; so it is very critical to choose the correct algorithm for the purpose needed as discussed by Dave and Choudhary, (2014), Nagar et al. (2021), and Hamdy et al. (2022).
2 Research gap and problem statement
The supply chain management improvement idea originated from data analysis capabilities that enable decision-makers to take beneficial actions. The challenge with e-commerce data is its massive, quick, imbalanced, and chaotic nature. Therefore, using ML algorithms is suitable for tackling this challenge and presenting an answer about the core sector among SCM sectors that control the success of the whole sector framework. The answer is demanding forecasting. The failure of forecasting accuracy negatively affects safety stocks and creates extra holding costs in finished goods inventory, and the bullwhip effect reveals supplier unreliability and creates a crisis in transport network unpredictability. E-commerce is a timestamp-dynamic system that must update every short interval to meet accurate forecasting values and avoid losses in SC sectors. The framework has been modified for Wu et al. (2018), and the forecasting is a natural development for the review statements for Altan et al. (2019) and compared with many of them to study the interval of superiority that achieves minimum error. The forecasting that is related to timestamp data behavior has been discussed by Altan et al. (2019), to reduce unfavorable conditions and improve accuracy based on an LSTM neural network when improving the Cuckoo search (CS) algorithm.
Marketing Healthy food products must follow the make-to-order (MTO) system, and it is difficult to follow the make-to-stoke (MTS) method due to the difficulty in storing them for long periods due to the lack of preservatives. Therefore, supply chain logistics suffered from not meeting customer requests promptly, which created difficulty in competing in markets far from the production source. Therefore, it has become necessary to accurately forecast customer demand for this type of product so that the company does not incur financial losses. These products are sold through both physical and electronic sales outlets (e-commerce) that do not close their gates. The difficulty was that the electronic platforms are available for 24 h a day, which accumulates orders that must be addressed to the customer immediately after production. For us to be able to order quickly, it was necessary to make forecasts continuously and quickly for the massive and chaotic data collected. Due to the abundance of data and the need for quick decision-making, the research resorted to making the use of machine learning (ML) algorithms.
Through previous research, we were able to handle the largest amount of transported inventory via increased packing (Ibrahim, 2021), another application studies the shortest path, and another application reduces the waiting time of customers and serves the largest number of customers during a work shift. Now, with this research, we are examining the forecasting process to speed up the process of withdrawing from stock and providing the product with special specifications. The article compares a variety of ML algorithms and proposes the CatBoost algorithm, which uses Dingo optimization to catch the smallest forecasting error. The order characteristics are different according to the customers’ age and sex. Therefore, the study tackles the data according to both factors. The hybridization between the CatBoost algorithm and Dingo Optimization (DO) is called Cat-DO. We compare the suggested method with the six other methods, including long short-term memory (LSTM), autoregressive integrated moving average (ARIMA), additive boost (Ada-boost), extreme gradient boosting (CatBoost), support vector machine (SVM), and deep neural network (DNN). The data types are chaotic and imbalanced, pushing us to track the accuracy via normalized root mean square error (NRMSE), and program the proposed method via Python software.
3 A conceptual framework for applying ML applications in SCM
According to the review section, the ML algorithms provide massive advantages to enhance the SCM, what if IoT for it. Kazemi (2019) and Misic and Perakis (2020) suggest integrating ML algorithms as a manager to IoT, to enable the components of the system to talk to each other that provide traceability, real-time monitoring, and visibility overall the supply chain sectors. Figure 9 illustrates a proposed framework for applying ML algorithms in several parts of SCM and its function in each sector (production, inventory management, circular economy, demand forecasting, transportation and distribution, procurement or supplier selection, sustainable development, and supply chain risks resistance, supplier segmentation, and supply chain improvement). The outputs must be monitored and controlled by supply chain experts based on the perspective of Liu et al. (2012) and the implementation of Eladly et al. (2023) (Deif, 2011; Pan et al., 2021; Abed et al., 2024).
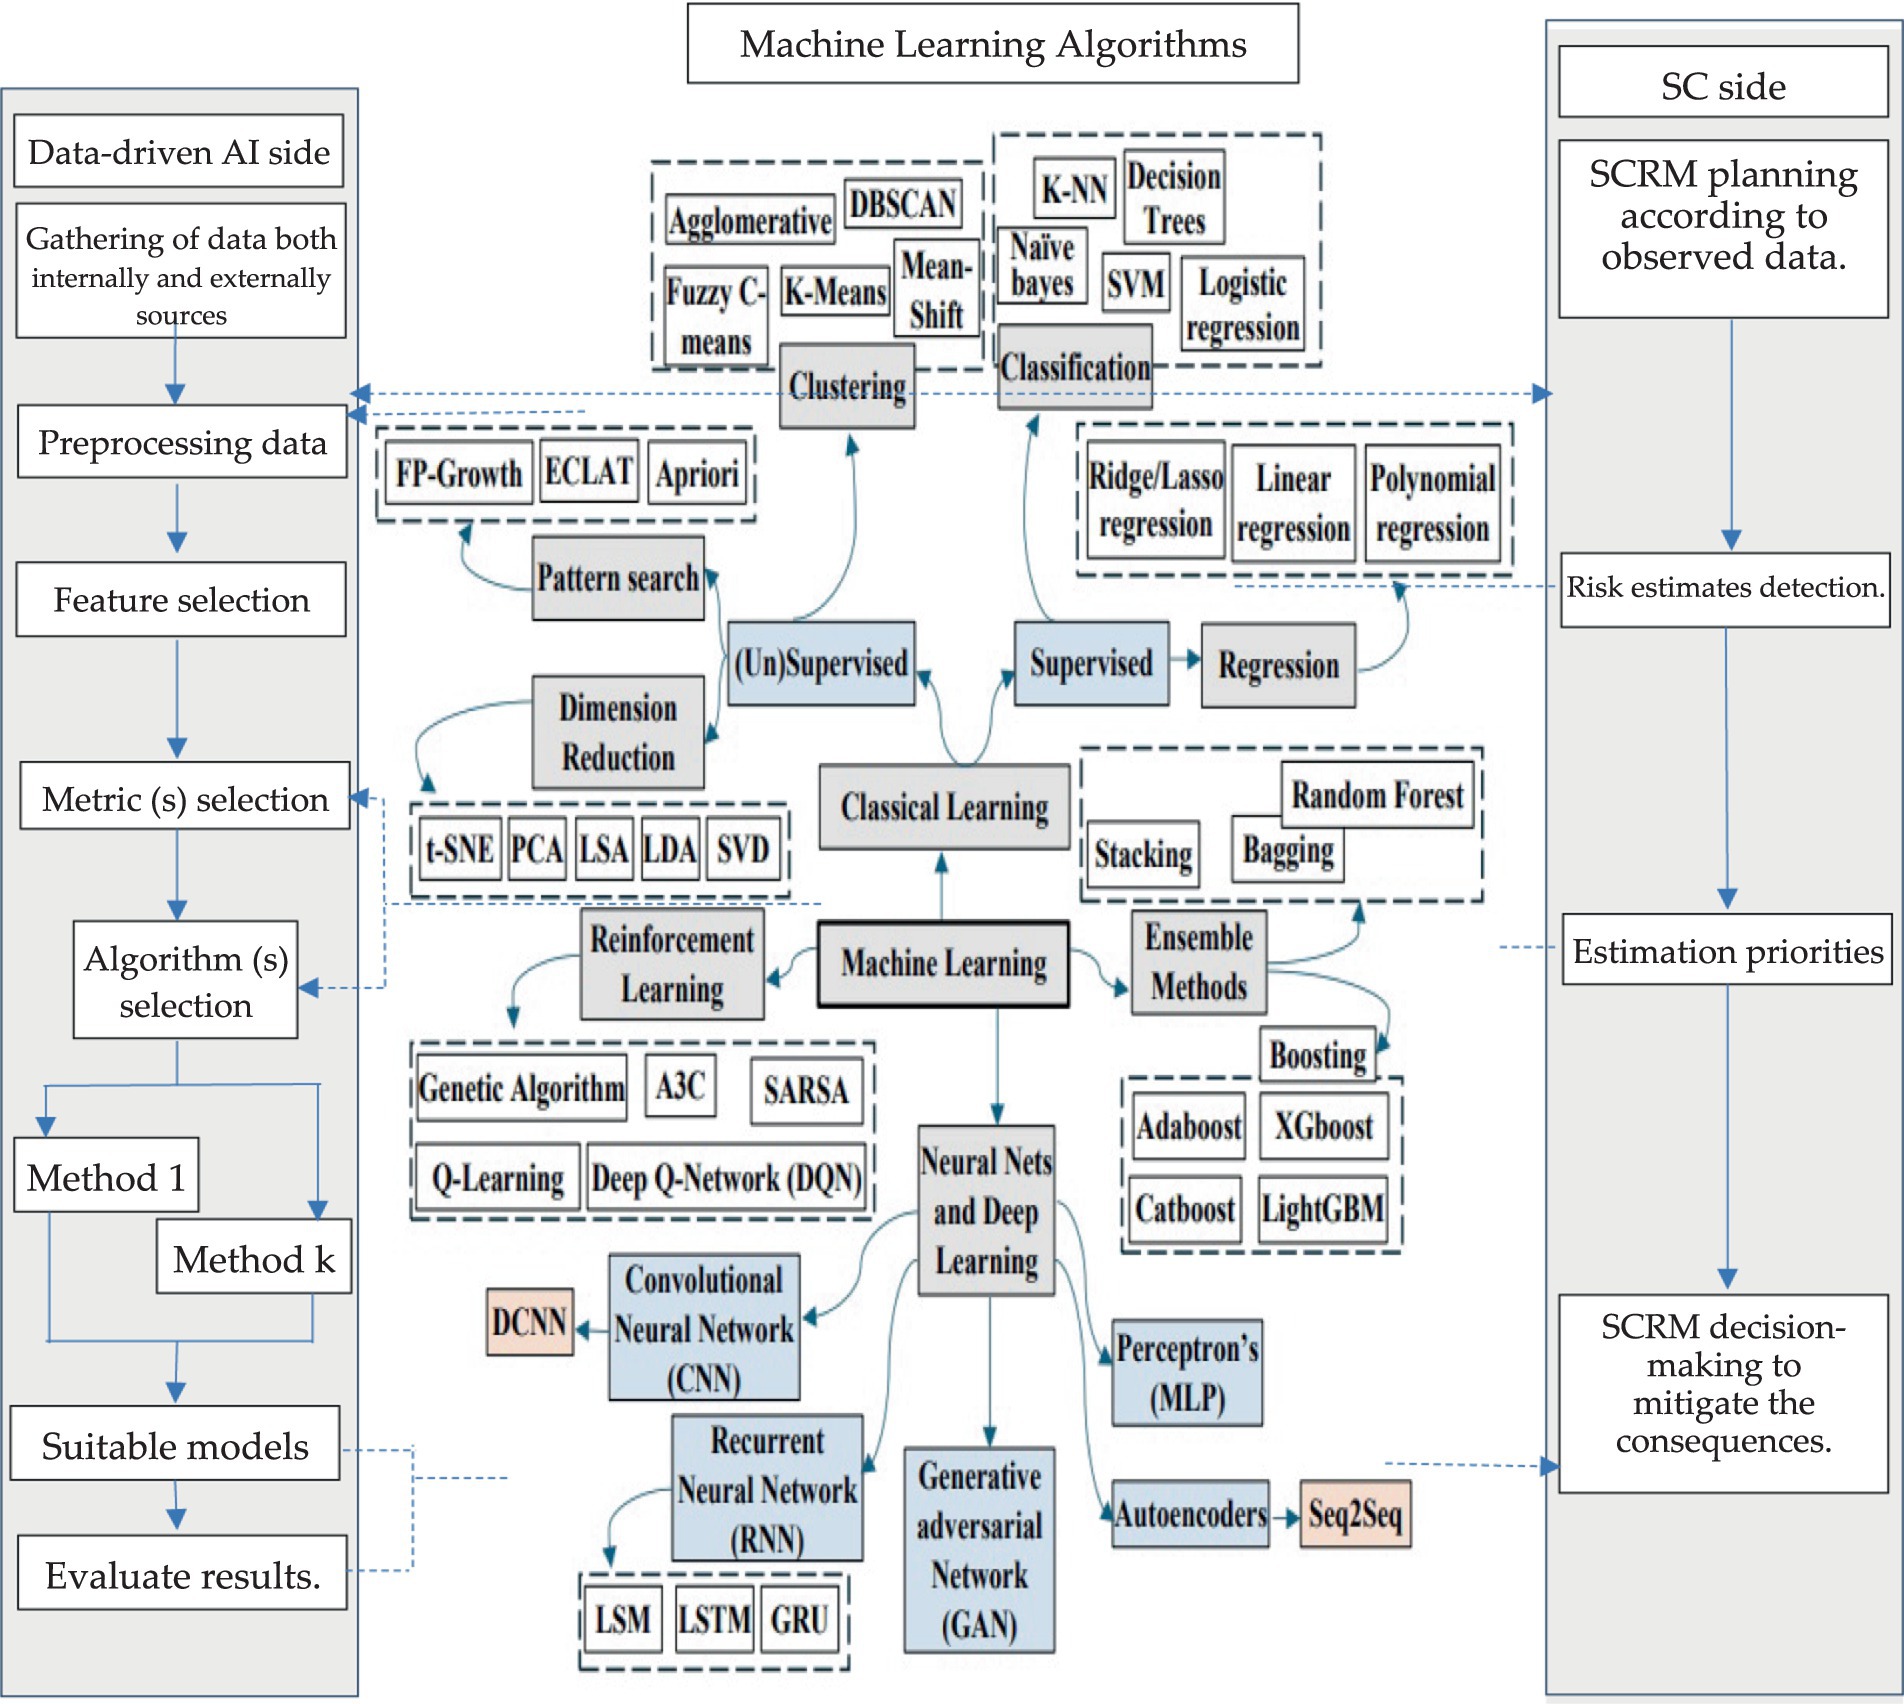
Figure 9. Data-driven framework for many commonly used ML algorithms in SSCM.
4 Illustrative example of how to apply ML in demand forecasting
This example is based on a conceptual framework presented in Figure 7, which shows how SSCM applications succeed by using suitable ML algorithms that match the data and mitigate the risks. The proposed mechanism relies on the IoT for supply chain data collection. The illustrative case study for the food industry, which has many diverse products, discusses how ML is useful in forecasting market demand for many finished products. The IoT is an effective AI tool that gives the mechanism the power of real-time data, which must be based on a high-speed algorithm to tackle this type of data. Therefore, the article settled on using the CatBoost technique, to tackle data after being enhanced by an optimization Dingo algorithm.
It helps in preserving resource usage, remanufacturing, recycling, repairing, and refurbishment as discussed by Abdel-Basset et al. (2019), Gao et al. (2019), and Trappey et al. (2020), which implemented effectively by Eladly et al. (2023) in textile fabrication and by Rico-Fernández et al. (2019) and Rehman et al. (2019) in agriculture. The circular economy must sustain TBL elements (environmental, people, and profit) via control wastes to be suitable resource usage to guarantee its sustainability without affecting the quality of the products requested by the customer, as the main purpose of any industry is to gain customer satisfaction. The purpose is to trace back the generation of waste to its upstream to generate useful waste as discussed by Read and Muth (2021), and Saghaei et al. (2020) are interested in recycling the biomass waste via (re)chemical, and Chen (2022) suggest hybridizing ML and IoT based on image processing, as implemented by Eladly et al. (2023) and Salama et al. (2023).
Because food manufacturers produce many comparable items, there is a fierce rivalry among them. Therefore, it is critical to retain customers so that they do not locate another supplier. As a result, precise demand forecasting is crucial, particularly when taking into account the quantity of online orders—a factor that has been highlighted in I4.0. Because of the massive and chaotic nature of e-commerce, the quantity of historical data used to construct projections from sales sources (hyperstores, minimarkets, grocery shops, food outlets, etc.) is erroneous. The prompt reaction will bolster the precision of the demand forecast for a wide range of food goods. Accelerating the supply chain begins with accelerating inventory sales, which leads to the speed of meeting customer demand, which depends on the accuracy of forecasting customer requests. However, forecasting is a double-edged sword. The first is that if the forecast leads to an increase in inventory, the organization will incur financial burdens, while the second is the case of a shortage in inventory, which will expose the organization to financial losses. Given that the e-commerce requests are made through multiple sources speedly in receiving multiple orders from companies and individuals requesting through online sites, which is estimated at an order volume of more than 35% as cited by Konovalenko and Ludwig (2019) of total orders, which in the study case exceeds an average of 2,416 requests per minute, and to ensure the accuracy of the forecast, the speed must be in line with the requested speed. Therefore, machine learning techniques are suitable to tackle this type of data. Dingo optimization focuses on fixing centers C of data to identify the catwalk through the created groups (clusters for unsupervised data and classes for supervised data), to avoid loss of time and cost. The number of groups was , where select a value for parameter ‘m’ and thereafter initialize the partition matrix U(0). Each step in this algorithm will be labeled as ‘r,’ where r = 0, 1, 2 …
The center of groups forms vector { } as expressed in equation (1), and the distance of the CatBoost expressed in equation (2) creates a walk matrix.
4.1 The proposed mechanism of Cat-Do pseudocode
To improve data classification via optimized feature selection for a deep neural network (DNN) classifier and prevent the premature convergence problem—which is the foundation of forecasting—as well as resist stagnation in local optimal conditions, this article proposes a novel version of the CatBoost algorithm based on the Dingo Optimization Algorithm (DOA). The steps needed to train a proposed mechanism structure are written in the pseudocode of the CatBoost technique that is supported by Dingo Optimization. These steps include importing the training data, changing the hyperparameters, starting up the methodology, and saving the finished file. The Dingo Optimization is a metaheuristic algorithm that draws inspiration from how dingoes hunt for prey. Therefore, it is used to enhance the efficiency of CatBoost in forecasting missions by initializing the population, establishing the parameters, identifying dingo locations, updating the objective function, updating alpha, beta, and delta dingoes, carrying out exploration and exploitation, and updating the step size in the dingo optimization method. Dingoes follow a strategy to identify the optimum points of hunting prey in the whole search area through a plan, which has three steps using their sounds:
1. Set the dingo population’s starting placements and speed at random.
2. Determine each dingo’s level of fitness within the community.
3. Assign the rank and endurance of the dingo with the greatest fitness level among the community as the worldwide best.
4. Continue doing so until a halting requirement is satisfied, which is the minimum NRMSE can be achieved:
a. Update the rank and speed of each dingo using the following equations:
speed = speed + cat1 * rand () * (global_best_location - current_location) + cat2 * rand () *
(local_best_location - current_location) location = location + speed.
#Hint: rand() produces a random number between 0 and 1, and cat1 and cat2 are constants that represent the mental and relational parts of the method.
import Catboost
# Load the training data from the dataset (e-commerce dataset)
n=10001;
x_train, y_train = load_training_data( )
# Set the hyperparameters for the CatBoost model
params = {
'iterations': 1000,
'learning_rate': 0.12,
'depth': 6,
'loss_function': 'NRMSE'
}
# Initialize the CatBoost model
model = catboost.CatBoost(params)
# Train the CatBoost model
model.fit(x_train, y_train)
Min_Order_capacity = MiOC;
Max_ Order _capacity = MxOC;
Fixed_location = FL;
Variable_location = VL;
demand=[MiOC: MxOC];
Cat_location = FL + VL * demand;
for k=1:1309
cum_NRMSE_saves=0;
for j=1 : z
request = floor (rand*( MxOC - MiOC)+ (MxOC - MiOC)+1);
if request >= demand(k)
partial_ NRMSE_saves = efficiency * demand(k);
else
efficiency = X;
losses= Y;
partial_ NRMSE_saves= X * request + ((X-Y)) *(demand(k)- request);
end
saves = partial_ NRMSE_saves-losses(k);
cum_ NRMSE_saves = cum_ NRMSE_saves+saves;
end
expected_ NRMSE_saves=cum_ NRMSE_saves/z;
p(i,1)=demand(k);
p(i,2)=expected_ NRMSE_saves;
end
plot (p( :,1),p( :, 2),'+',p( :, 1),p( :, 2),'o'), xlabel (‘time intervals during one day), ylabel (‘Amount of demand’)
Input: , number of evolution epochs, is the number of odds in the population, represent the bits of invisible neurons, while and is the allowable limit of them.
Input: , //where is accuracy, is total amount of datasets trained // L the length of cluster radius difference among fueled data by e-commerce applications
and random Mode center
Number of learning rounds T;
// hyperparameter values
// the Total dataset tested
// , is the set of selected parameters that control the hopeful process and is the set of total significant parameters.
// back to tuning the hyper-parameters to precise the neurons
// if , where is tree branches
; // specific tree
end;
end;
Set as all tested parameters;
end;
// pick image X and analysis it
// image of leaf is data of disease shape and area
end;
end;
end;
end; # Save the trained model to a file model.save_model(‘trained_model.cbm’)
b. Assess each dingo’s level of fitness within the community.
c. If a dingo is more fit than the current world best, update the global best location and fitness.
5. Return the global best location and fitness as the solution.
4.1.1 The mathematical model of proposed technique
The solution plan consists of five steps discussed that are implemented and programmed via four sequential strategies.
Strategy#1: Attack sound plan: The Dingoes can modify their communication during agreeing through this strategy to construct a unique tree of choices working on categories boosting called (CatBoost), which is a member of the gradient booster algorithm family works on the dataset in the specific database, as discussed in equations 3–5 (i.e., e-commerce; ). This step hybridizes the Dingo technique communication with CatBoost methods to tackle the data candidate in the dataset
The main concept is to construct an ensemble of weak forecast choice trees to generate an efficient model, where the learning stage is focused on training a fitness function to minimize the losses for a specific dataset .
Strategy #2: The gradient step: The gradient step called expressed in equation 6 is selected as estimates to
Strategy #3: Persecution Sound plan: The strategy of hunting after surrounding the prey via a sketch of two intersection regions is based on harmony between the alpha and beta in the Dingo pack. This behavior can be formulated as expressed in equations 7.1–7.3, 8:
The position must be updated, otherwise the hunting process is over. The value expressed in equation 9 is linearly decreased with several iterations. The values lie in the range .
Strategy #4: Avoid the scavenge solution plan: This strategy works when a poor solution (i.e., easily accessible carrion) is encountered in the search path, which initially starts randomly and guides the Dingoes to choose the path that leads to survival , as represented in Eq. (10), when facing difficulty finding a solution. It involves using the residuals from previous steps, and these pathways are continuously interconnected, as described in the pseudocode. The method prioritizes the better carrion and is based on the fitness function described in equations 11.1, 11.2, which consider the movement and direction of the Dingoes to anticipate the best route for making optimal decisions.
Because of this, the model’s classification accuracy gradually improves over time paving the way to precise the prediction using CatBoost technique and employs CatBoost to reduce the losses and treat the imbalance in the dataset via controlling the loss function when it comes to binary classification, presenting the prediction formula as expressed in equation (12):
where is the predicted value of the significant classes discussed in this study such as age, sex, and time of order through the day, and each have many variables for identifying the product requirements, such as the amount of orders, date in Now(), expiration date, delivery place, delivery lead-time, are the intercepts, and to are the regression coefficients for the independent variables to . There are multiple input features in the code, so is a vector of features at each time step The gradient step of movement for each predicted variable can expressed in equations 13.1, 13.2.
The inventory sector has a strong relation with demand risk estimation that the candidate’s logistic regression to pick highly accurate expectations. Also affects inventory management where the costs are reduced when resorted to ML algorithms that hybridize by optimization such as Dingo, Genetic and Arithmetic algorithms with Random Forest as supervised learning and two kinds of neural networks whether artificial or recurrent that save from 15 to 35% of total costs (Leung et al., 2014). The inventory has also a direct relation with the distribution sector, and the researchers prefer logistic regression, SNN, and DTs in managing this sector by using simulated annealing or the Dingo algorithm to optimize the results as discussed by Attari et al. (2021). The inventory also has a direct effect on supplier selection which must care green supply chain objective as discussed by Hosseini (2007), Srivastava (2007), Holt and Gobadian (2009), Mudgal et al. (2009), and Dashore and Sohani (2013), especially in discovering minimum route length (Abed and Elattar, 2020; Abed et al., 2024). The inventory field is the key Libra pomegranate balance and guarantees the success of SCM if supported by modern ML algorithms, such as DTs and SNN in supervised learning and Apriori or ANN in the case of unsupervised learning, while candidate TSVM as semi-supervised learning advice researchers to use CatBoost with Random Forest in ensemble learning. The challenge in SCM is to retreat in the amount of transport due to high expenses after the war of Ukraine and China exporting policies (container transportation cost). The SSCM meets SDG 9.5 (enhance research and upgrade industrial technologies), which encourages developing countries like Egypt via scientific research to overcome this challenge, where supporting domestic technology to be smart using highly accurate ML algorithms supported by AI techniques and respect industrial diversification, and value addition to commodities to meet SDG 9. b. Also, encourage activating IoT technologies to make the SCM more usable, reliable, and economical to meet SDG9.c.
4.1.2 Digital Simulator controller results and discussion
Finding the estimated predicted market demand for various items rapidly is a difficult challenge. The SSCM improves the way IoT is handled by using ANN structures to pick the right data instantly and using CatBoost to get rid of instances that are not normal. It can take binary values as input. The fact that the artificial neural network’s weights are really valued explains why the invisible integer neurons in Figure 10 match so many different parameters, as discussed in Table 2, to describe how the NN operates as discussed by Xiao et al. (2014). Table 3 displays the market demand functions for certain food items according to the age of clients. One popular method in ML for assessing a model’s performance is 20–80 cross-validation, where the picked data are divided into five equal sections (folds) and four folds (80%), to train the model and the remaining data for testing. These items need a precise forecast of market demand to avoid losses because their life cycles are short. We tested our proposed optimization method on 26 different types of regression algorithms and found that it worked best with the tree (hyper-parameter option) and the tree (optimizable tree) in 80% of the records.
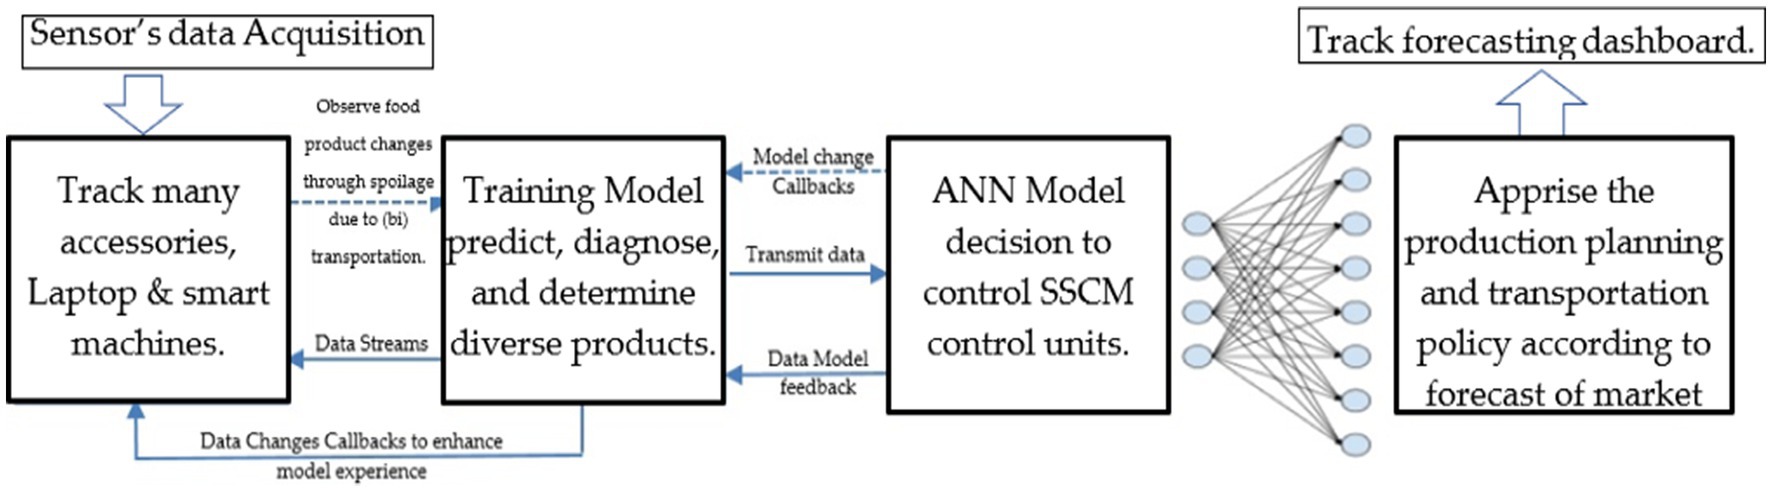
Figure 10. The fully DNN connected layer manages SCM [production, inventory, transportation, and procurement sectors] eight output neurons.
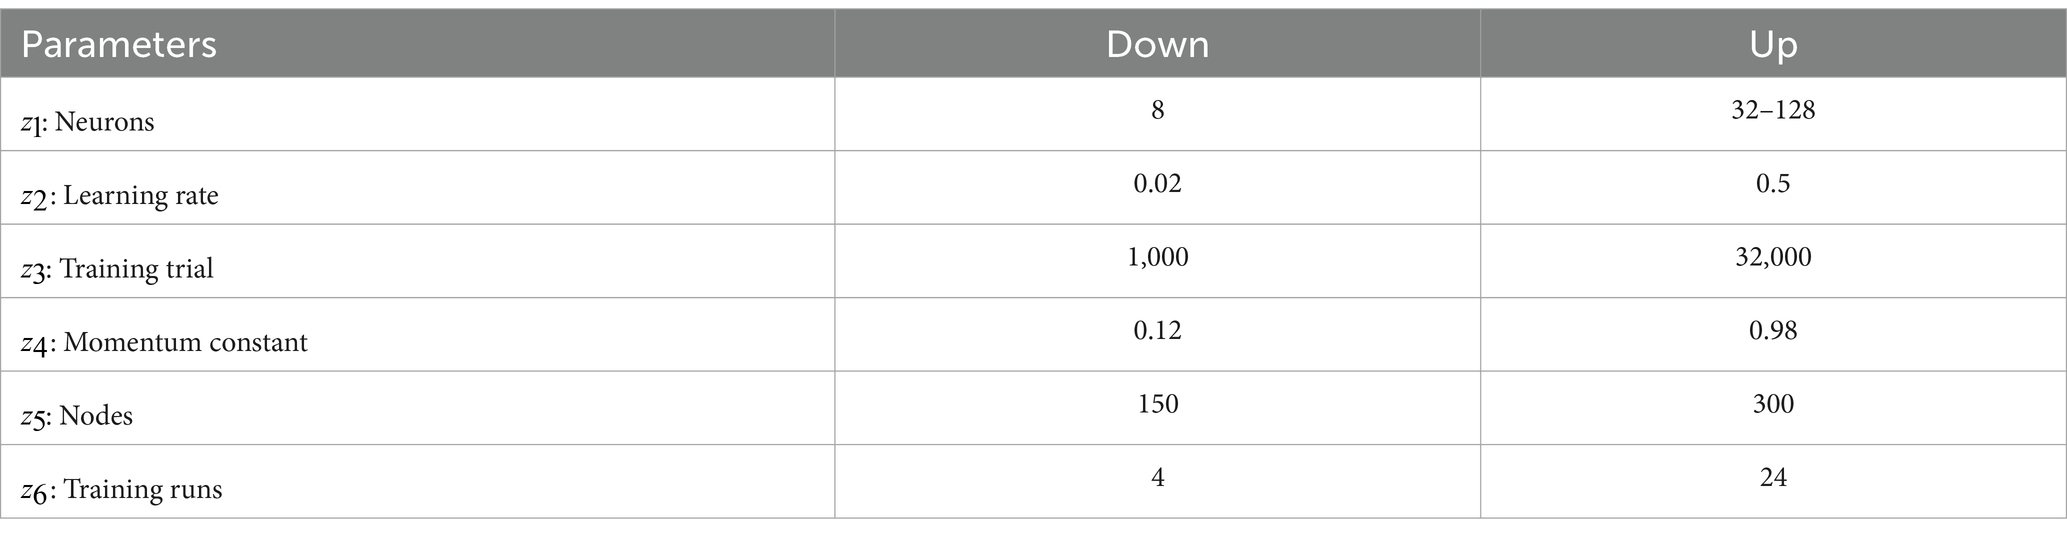
Table 2. Variables of the neural network model manage SSCM.
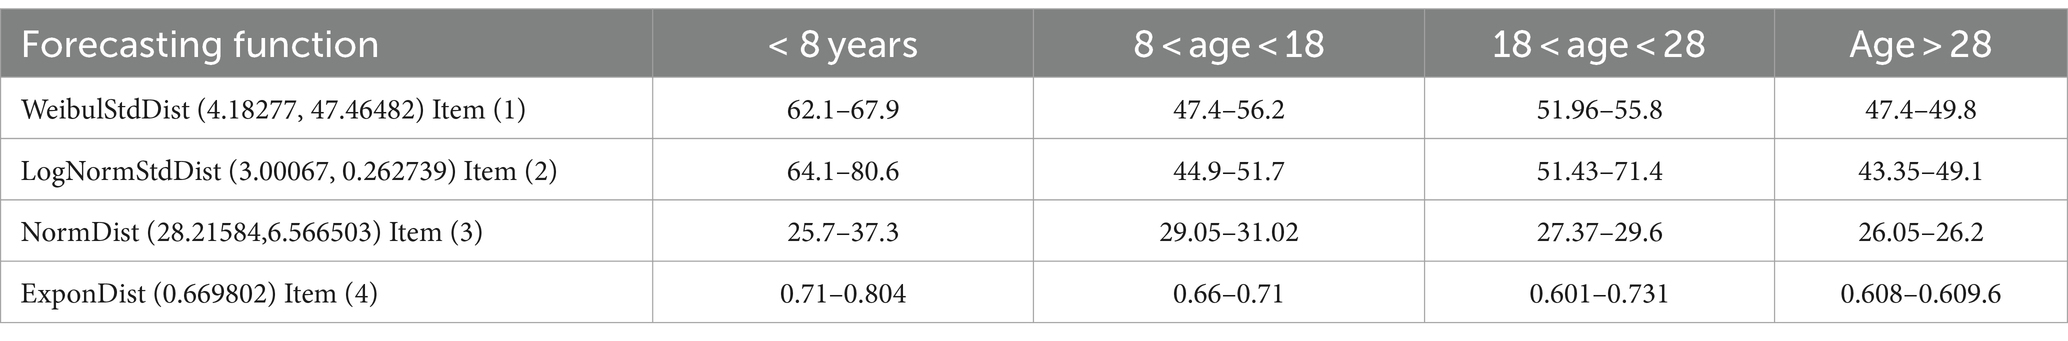
Table 3. The optimum forecasting parameter values according to age for four food products.
Age and sex are the two most important factors that affect how well demand forecasting works and how much it depends on the SSCM response to cut down on losses, as shown in Figure 11. Therefore, a quick response is important to meet the demand for using ML algorithms called CatBoost, which are enhanced by an optimization method called Dingo in decision-making. The normalized mean absolute error (NMAE) expressed in equation 14 and the normalized root mean square error (NRMSE) expressed in equation 15 are the assessment metrics used in this study for demand prediction because they are imbalanced. Of these, NMAE uses the average error as the assessment criterion, whereas NRMSE computes the square of the error to amplify the larger wrong share. The two assessment indicators were computed using the following methods:
where is the observed value, is the forecasted value, 𝐶𝑎𝑝 is the inventory capacity of the related production line, and is the number of sampling points. Table 4 highlights the superiority of the improved CatBoost algorithm by Dingo optimization as the training time is in line with the acceleration of data given by input sources. A response time of less than 1.6 s (NRMSE 0.12387) demonstrates that classification is completed promptly to satisfy genuine market expectations.
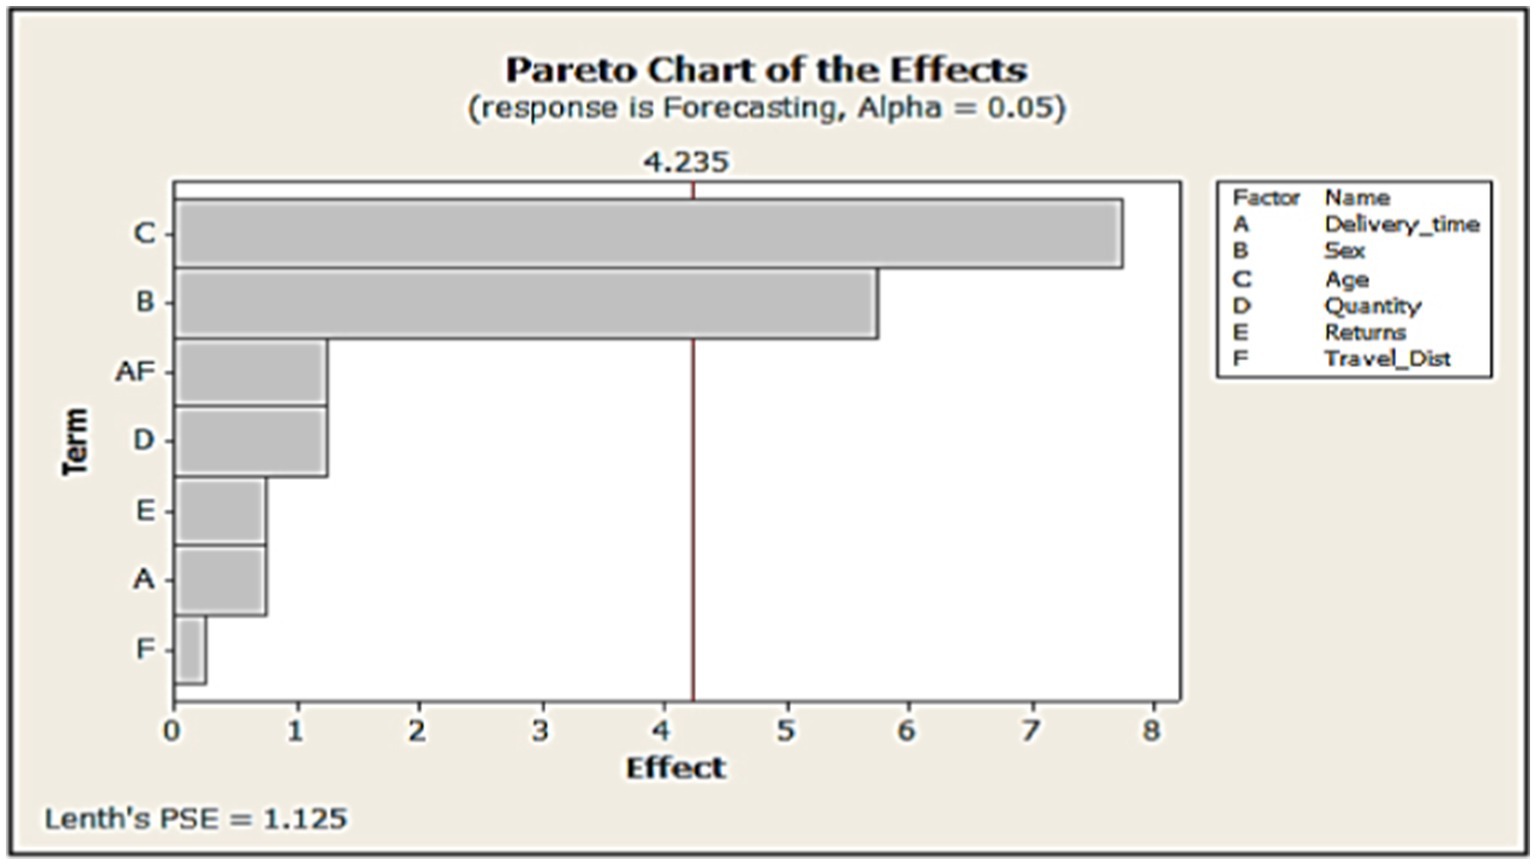
Figure 11. Demand forecasting significant parameters.
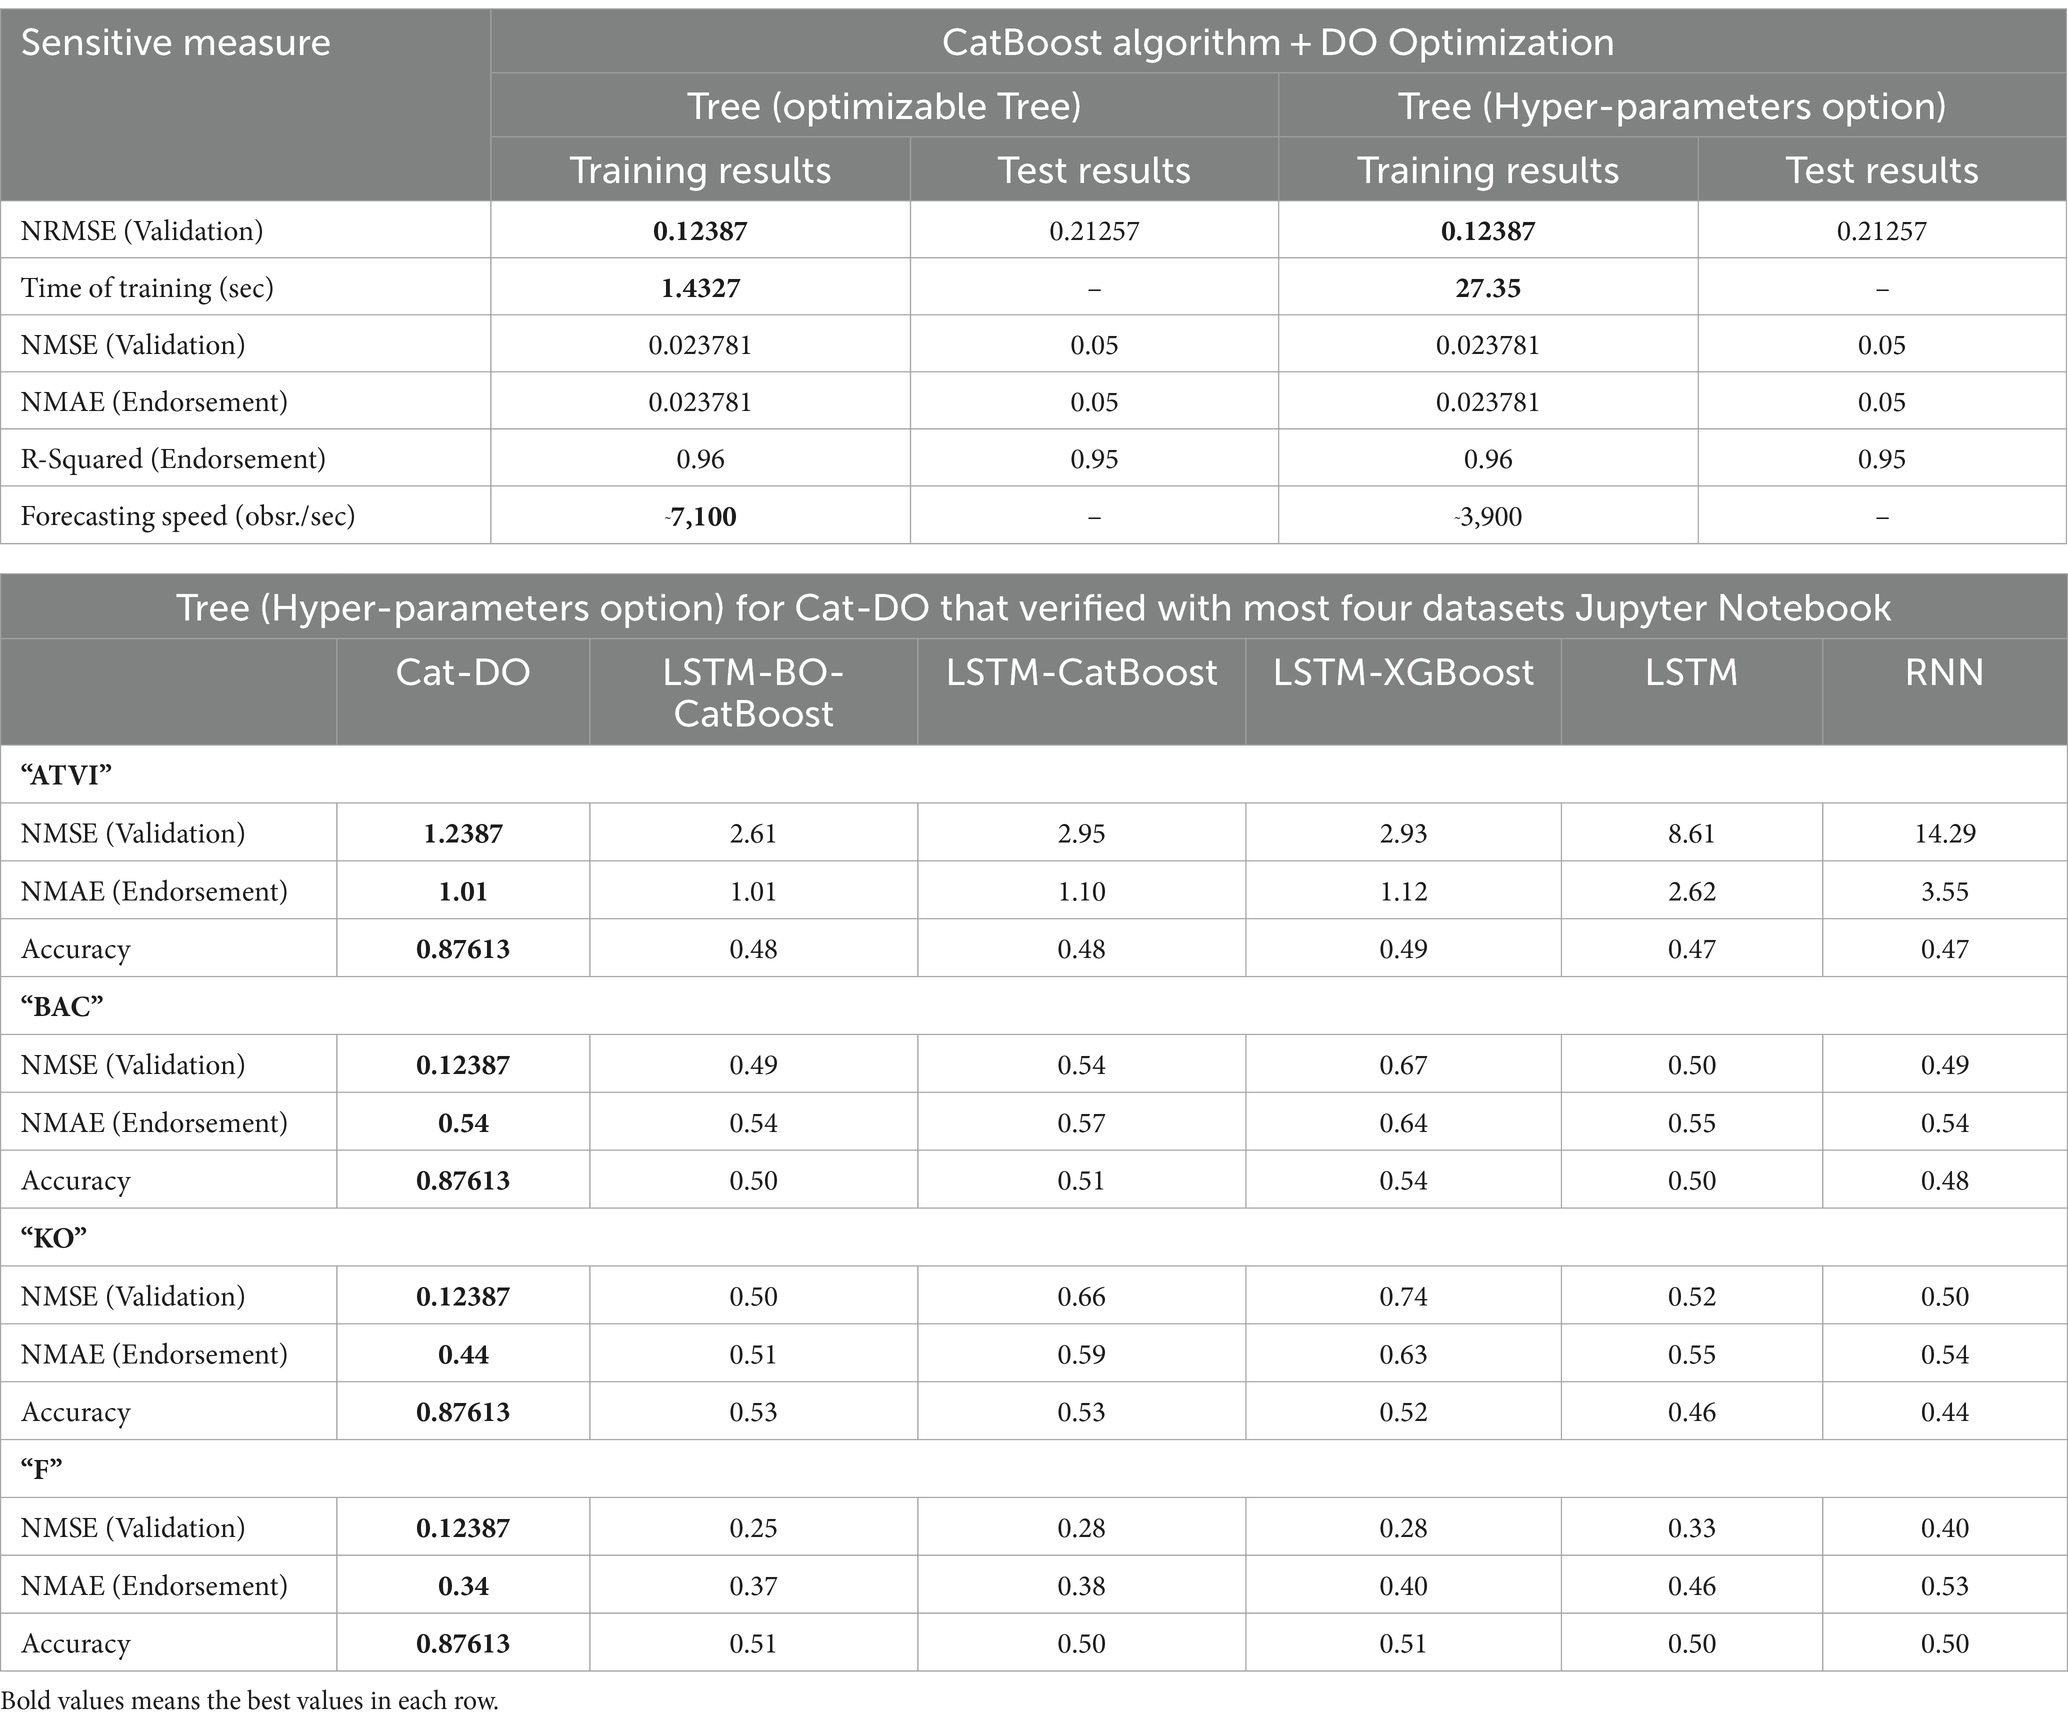
Table 4. Comparison between the best two hybridized algorithms CatBoost technique and Dingo optimization for four datasets (Sun and Tian, 2023).
To improve data classification via optimized feature selection for a deep neural network (DNN) classifier and prevent the premature convergence problem—which is the foundation of forecasting—as well as resist stagnation in local optimal conditions, this study proposes a novel version of the CatBoost algorithm based on the Dingo Optimization Algorithm (DOA). Figure 12A illustrates the coverage ratio according to a number of nodes in the suggested DNN architecture. The ensemble methods set its parameters as follows: The CatBoost has n_estimators = 77 groups, each of them has eight embedded experiments, max_depth = 2, min_samples_split = 2, min_samples_leaf = 4, mini_impurity_decrease = 0.12, criterion = ‘gini’, boostrap = Ture, oob_score = False, max_leaf_node = None, while CatBoost set their parameters as loss_function = ‘Logloss’, eval_metric = ‘AUC’, task_type = ‘CPU’, learning_rate = 0.02, iterations = n_h, depth = 4, l_leaf_reg = 4, boosting_type = ‘Ordered’, random_seed = ‘1000’. Therefore, Figure 12B illustrates the quick response time to decision-making when adopting the CatBoost algorithm. For scientific integrity, the CatBoost algorithm presents a highly accurate prediction like the XG-boost algorithm, especially when tackling imbalanced and chaotic data. Figure 13 illustrates the forecasting behavior according to age for males. The peak of purchasing for kids of younger than 8 years old is at 12:00 p.m., while the customers of younger than 18 years old become avid at 8:00 p.m. The adults prefer the purchase at 3:00 p.m., as do those who are older than 28 years old with little skewness. This figure gives a roadmap for advertisers to be oriented to specific ages and sexes during the day and enables them to prepare their logistic plan. The following are the primary steps in training a CatBoost classifier.

Figure 12. (A) The coverage ratio analysis for different prediction algorithms and (B) the most training time response.
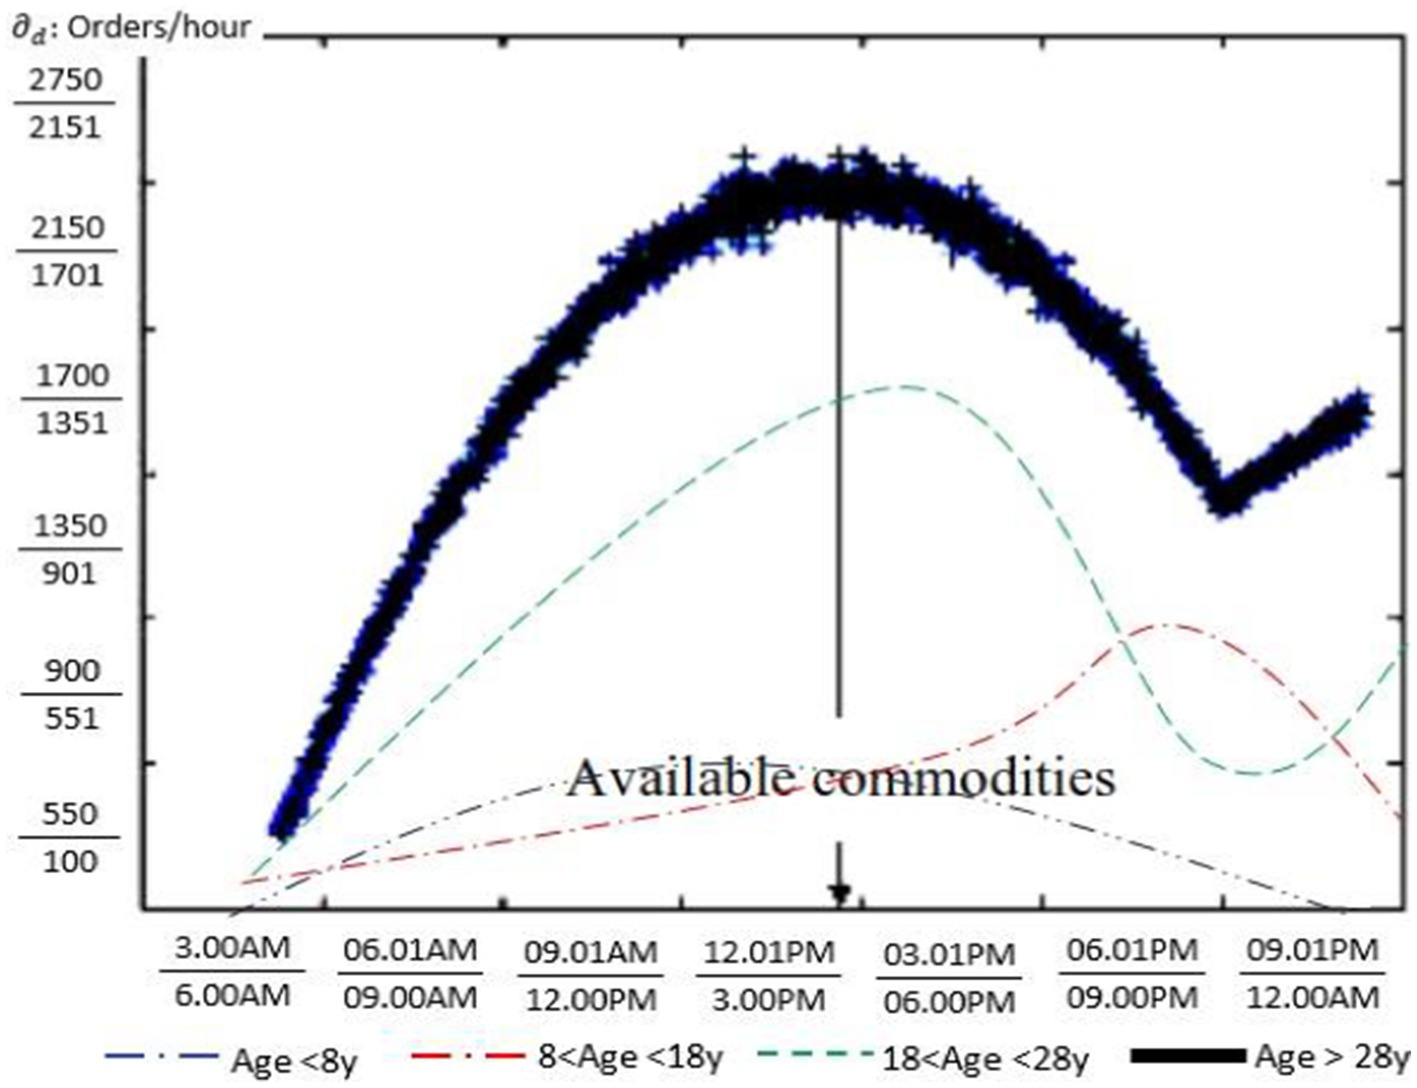
Figure 13. The forecasting function of Table 3.
This study presents modern key gradient boosting known as the CatBoost technique toolkit and enables to gain high-quality solutions when hybridized with the Dingo Optimization mechanism, which leads to outperforming other available behaviors of machine learning ensemble groups and other predictive modeling groups, as shown in Figure 14. The proposed Cat-DO mechanism is the tree (𝑋𝑖) constructed sequentially and repeatable, and each tree aims to correct the errors of the previous ones to precise the prediction value for a given input 𝑋𝑖, according to Sun and Tian (2023). The comparing experiment dataset follows Jupyter Notebook, which was downloaded2 to obtain the historical time series data of most four stocks like our problem named “ATVI,” “BAC,” “KO,” and “F.” The four stocks start on 30 May 2022 and end on 12 December 2023 for 388 time series data for each variable of four different intervals of ages to gather 6,208 rows. The average comparisons of the three measures of NRMSE, NMSE, NMAE, and accuracy for 10 stocks with 10 times predicted results are shown in Table 4.
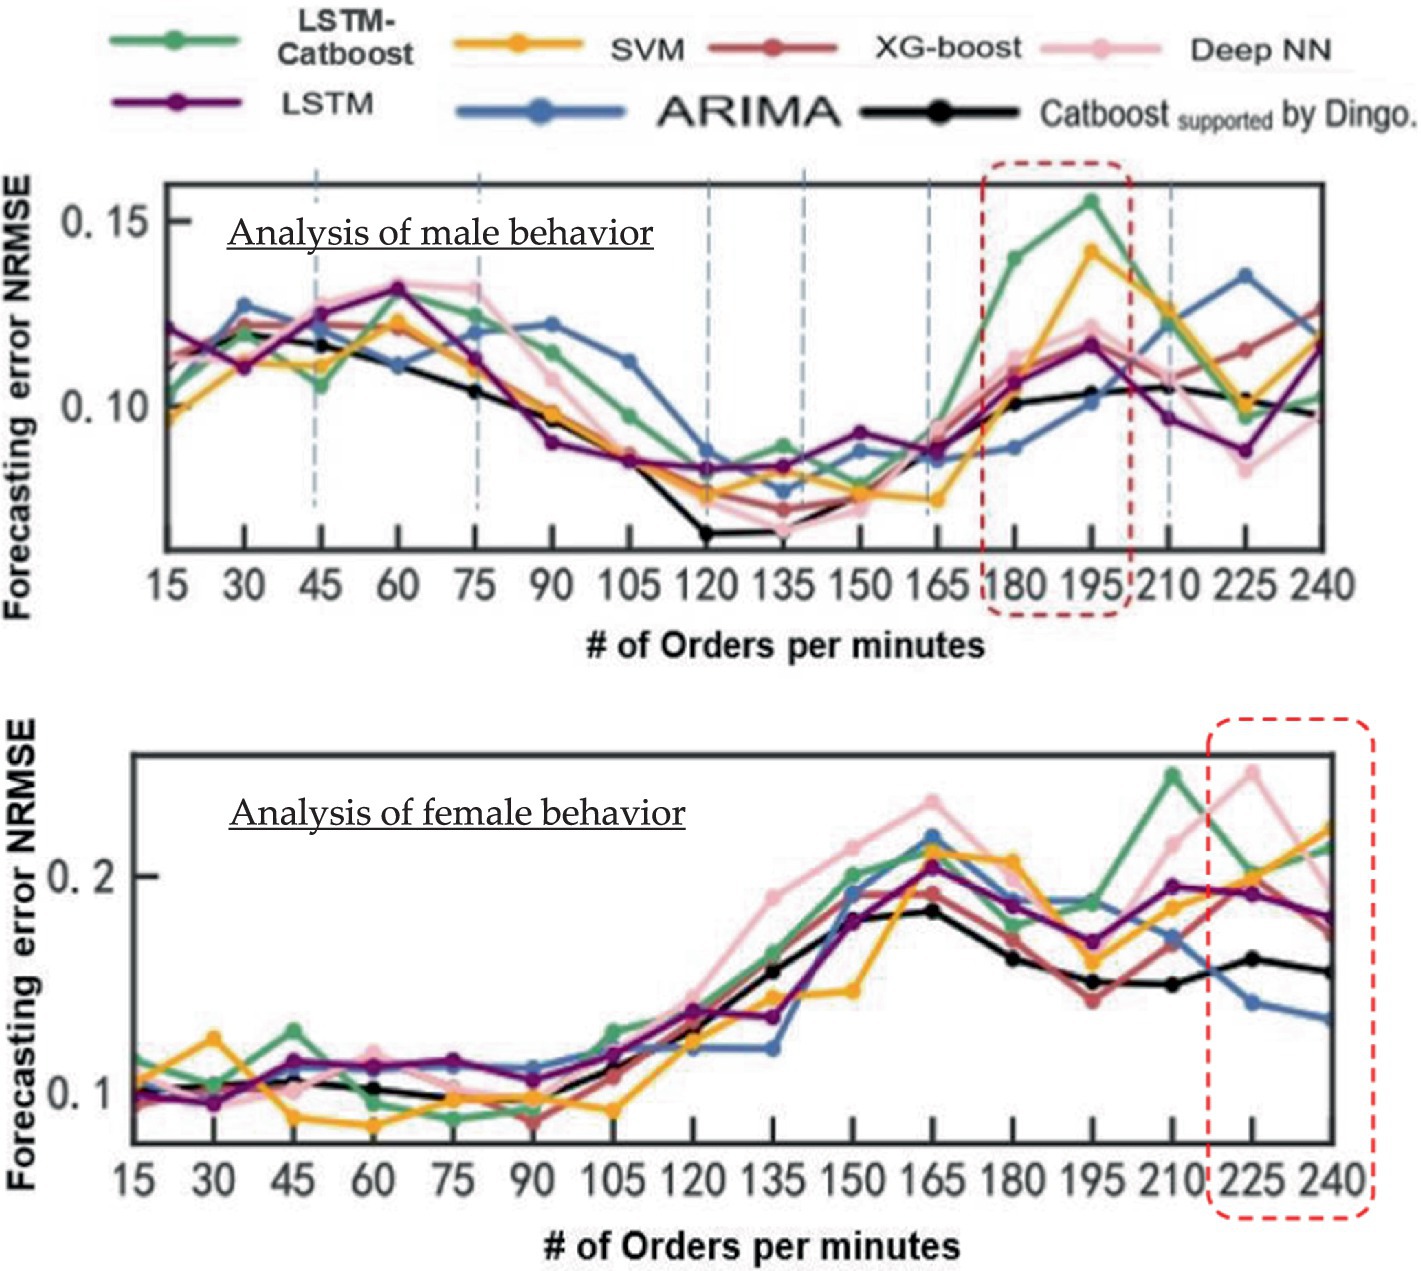
Figure 14. The forecasting error for male and female demands.
4.1.3 Evaluation indicators and comparison of experimental results
All of the algorithms for deep learning used in this study were created using Python (version 3.7.9) language. The historical data collected from an Egyptian food factory from January 2023 to December 2023 are the source of the data set used. Initially, the upper and lower quartile values of the collected data distribution are computed to identify the outliers and replace the outliers and missing values to address the issues of missing data and abnormal data in the data. The process of substituting data is based on a moving average calculation. Figure 14 illustrate the NRMSE for online forecasting of the proposed method (Cat-DO) and other six ML algorithms for male and female customers for only adults (18 < Age < 28). Table 5 indicate the NRMSE for the year 2023, divided into four quarters, and show the behavior of demands for women that increase while those for men are jerky. The proposed method is superior to others in some intervals of demands, according to the actual year 2023. Therefore, the benefit of this comparison is that we are responsible for choosing the algorithm that presents the minimum error at the size of the demand.
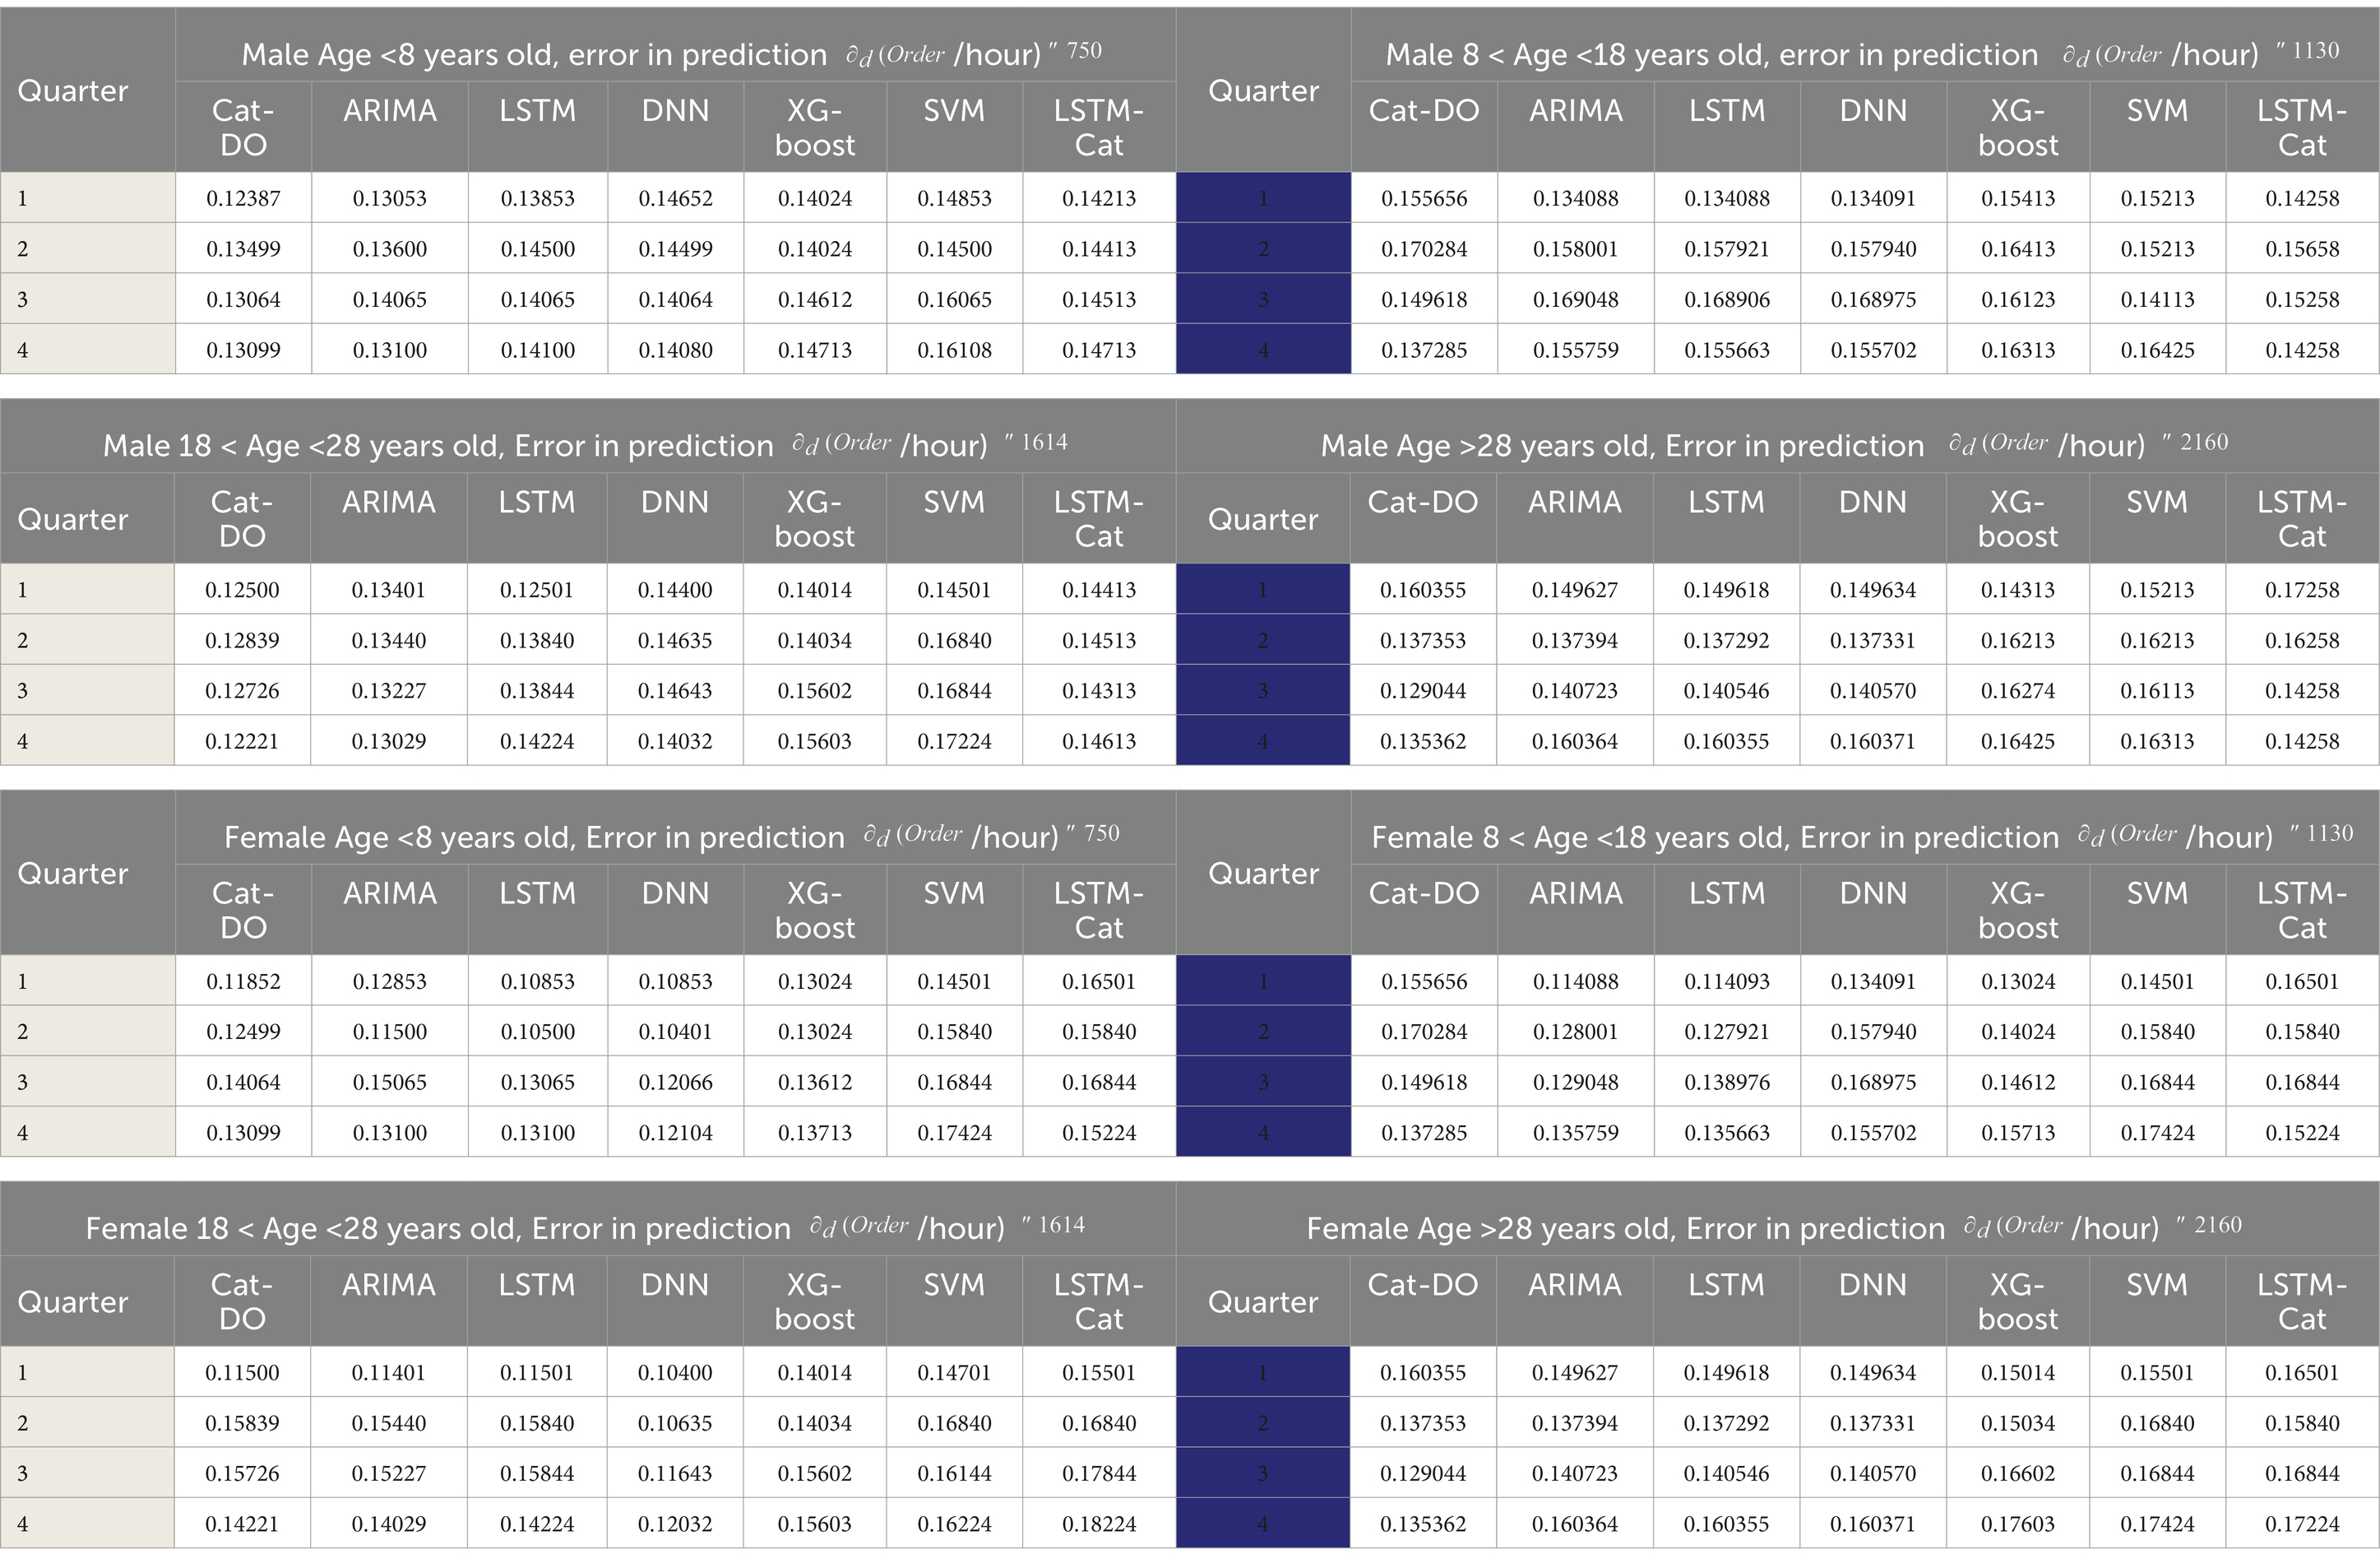
Table 5. The NRMSE of demand forecasting according to client age and sex (male and female), order per quarter according to actual data.
Figure 14 shows that SVM works best for orders less than 45 per min. The proposed algorithm Cat-DO is then used for orders between 46 and 90 per min, even though LSTM is better for orders between 91 and 105 per min. However, back to the proposed Cat-DO to show the least amount of error between 106 and 135 orders, and then back SVM, ARIMA, LSTM, and Cat-DO. Also, the male purchasing behavior and superiority at medium and high purchasing orders per minute and presents accurate forecasting, while the purchasing behavior for women, where ARIMA and proposed Cat-DO are accurate. The Dingo with chaotic data is useful because it generates a high degree of variation in the algorithm, enhancing its capacity to break out from any local optimums. To start the search process toward the global optima, the weight factor is added in the second place.
5 Conclusion
Health food marketing lacks accurate forecasting for demand during the four seasons for men and women through four age intervals. It needs to be quick because the demands via e-commerce are chaotic, massive, and imbalanced. The study conducts a comprehensive review to explore the relationship between machine learning algorithms and their behavior based on input data (labeled or unlabeled) within various supply chain sectors. This analysis aims to optimize processes within these sectors when determining the suitable ML algorithm to hybridize with suitable AI optimization technique and compare with benchmarking data (Sun and Tian, 2023) to authorize in implementing on real data. The study’s methodology focused on using a multi-method bibliometric approach to create a taxonomy for ML studies in SC themes, as shown in Figures 1, 2. According to data inputs, this taxonomy divided the sectors of SC into four categories, namely, supervised, unsupervised, semi-supervised, and ensemble learning. This technique helps in making choices and enhances the efficiency of SC performance, as shown in Table 1. Certainly, the hybridization between ML and AI in its (IoT at e-commerce) aspect can alleviate concerns about any cause of risk and increase SC adaptively to guarantee continuity. Therefore, the article presents Figures 6–9 to help researchers in determining the best algorithm according to problem nature. Machine learning (ML) models are considered effective tools for managing supply chains. They provide automation and visualization, which make the connections between supply chain sectors more intelligent. This is especially helpful when analyzing massive amounts of data to discover patterns or relationships. Figure 11 illustrates that demand forecasting is based on age and sex factors in this case study. Figure 12 proves that the proposed algorithm has more coverage than others, and Figure 13 indicates the order behavior according to age for aggregated demands of men and women. The analysis of the data from Figure 14 shows that male demand is erratic, whereas female demand is on the rise. This suggests that different machine-learning methods may be needed for different batches of orders per hour. Table 5 show the details of NRMSE for both men and women and different age intervals, which enable the company to improve the product according to age. The proposed algorithm was found to be superior to others at 180–195 orders per minute for men, while CatBoost presents the best forecasting for women’s behavior. In addition, the proposed method is good for women at orders of 225–240 per min. The Cat-DO has been compared with other six ML algorithms to test its superiority over ARIMA, LTSM, DNN, CatBoost, SVM, and LSTM- CatBoost by 0.52, 0.73, 1.43, 8.27, 15.94, and 13.12%, respectively. Transportation costs have been reduced by 6.67%, which grows the ROI of companies as cited in the study mentioned in the reference (Abed and Seddek, 2024).
6 Future work
Demand forecasting is the backbone of the management of supply chain sectors, which appears in other related sectors, such as inventory, transportation, production planning, and purchasing. Therefore, the extension of this study depends on following up on customers’ requirements by relying on data classified in the local databases of the food department through deep analysis of their purchases and accurately identifying the items to remind them of their needs during the usual time of purchase (specifying customer registration data) and talking to them through a picture of their favorite products using an ensemble algorithms aims to conventional AI for customer service as shown in Figure 6. Achieving this goal depends on classification datasets precisely to meet public awareness management for reading customers’ ideas and requirements. Like model-based clustering, which is based on Gaussian distributions that handle numeric and categorical data considering the importance and correlation of features and produce groups that have different shapes and sizes, each of them forms the best population for forecast demand.
Data availability statement
The original contributions presented in the study are included in the article/supplementary material, further inquiries can be directed to the corresponding author.
Author contributions
AMA: Conceptualization, Data curation, Formal analysis, Funding acquisition, Investigation, Methodology, Project administration, Resources, Software, Supervision, Validation, Visualization, Writing – original draft, Writing – review & editing.
Funding
The author(s) declare that financial support was received for the research, authorship, and/or publication of this article. The author is thankful for the support of the Deanship of Scientific Research at Princess Sattam bin Abdulaziz University through the Research Groups Program grant no. (PSAU/2023/01/24933).
Conflict of interest
The author declares that the research was conducted in the absence of any commercial or financial relationships that could be construed as a potential conflict of interest.
Publisher’s note
All claims expressed in this article are solely those of the authors and do not necessarily represent those of their affiliated organizations, or those of the publisher, the editors and the reviewers. Any product that may be evaluated in this article, or claim that may be made by its manufacturer, is not guaranteed or endorsed by the publisher.
Supplementary material
The Supplementary material for this article can be found online at: https://www.frontiersin.org/articles/10.3389/frsus.2024.1388771/full#supplementary-material
Footnotes
1. ^The bullwhip effect is a phenomenon in which little variations in retail demand led to corresponding swings in wholesale, distributor, and manufacturer demand. This phenomenon causes inefficiencies and disarray across the whole logistical chain.
References
Aamer, A., Yani, L. P. E., and Priyatna, I. M. A. (2020). Data analytics in supply chain management: review of machine learning applications in demand forecasting. Oper. Supply Chain Manage. Int. J. 14, 1–13. doi: 10.31387/oscm0440281
Abdel-Basset, M., Gunasekaran, M., Mohamed, M., and Chilamkurti, N. (2019). A framework for risk assessment, management, and evaluation: economic tool for quantifying risks in supply chain. Fut Generat Comput Syst 90, 489–502. doi: 10.1016/j.future.2018.08.035
Abed, A. M. (2023). The resistance of the third organizational efficiency theory for depravity on socio-economic? Eur. Chem. Bull 12, 3147–3171. doi: 10.48047/ecb/2023.12.12.2142022.11/10/2023
Abed, A. M., AlArjani, A., and Seddek, L. F. (2023). Optimization of the working parameters with digital Jidoka twin by hybridizing the WSPA and HS methods to keep products within standard specifications. J. Adv. Manuf. Syst. 23, 1–33. doi: 10.1142/S021968672450001X
Abed, A. M., AlArjani, A., Seddek, L. F., and El Attar, S. (2024). Reduce the delivery time and relevant costs in a chaotic requests system via lean-Heijunka model to enhance the logistic Hamiltonian route. Results Eng. 21:101745. doi: 10.1016/j.rineng.2023.101745
Abed, Ahmed M., and Al-Attar, Samia A., (2018). “Sustainable quality boosts emission reduction using ARIMA to forecast the malfunction behavior,” in The 2nd International Conference on new trends for sustainable energy ICNTSE'18, Alex, Nov. 5–6, 2018, Pharos university, Egypt. pp. 62.
Abed, A. M., and Elattar, S. (2020). Minimize the Route Length using heuristic method aided with Simulated Annealing to reinforce Lean management sustainability. PRO 8:495. doi: 10.3390/pr8040495
Abed, A. M., and Seddek, L. F. (2022). The lean-branch-and-bound structure effectiveness in enhancing the logistic stowage methodology for the regular shapes. PRO 10:2252. doi: 10.3390/pr10112252
Abed, A. M., and Seddek, L. F. (2024). Discuss the effect of the third organizational efficiency theory on society and economic growth via corruption axes frustration by a non-linear model corruption aspects benefit. Egyptian Int. J. Eng. Sci. Technol. 47. doi: 10.21608/eijest.2024.225347.1241
Abed, A. M., Seddek, L. F., and AlArjani, A. (2023). Enhancing two-phase supply chain network distribution via three meta-heuristic optimization algorithms subsidized by mathematical procedures. J. Adv. Manuf. Syst. 23, 445–476. doi: 10.1142/S0219686723500221
Aburto, L., and Weber, R. (2007). Improved supply chain management based on hybrid demand forecasts. Appl. Soft Comput. 7, 136–144. doi: 10.1016/j.asoc.2005.06.001
Ahmed, N., and Farzana, F. (2020). Forecasting supply chain sporadic demand using support vector machine approaches. Fuzzy Sets Syst. 10, 87–102.
Aljojo, N., Alshutayri, A., Aldhahri, E., Almandeel, S., and Zainol, A. (2021). A nonlinear autoregressive exogenous (NARX) neural network model for the prediction of timestamp influence on bitcoin value. IEEE Access 9, 148611–148624. doi: 10.1109/ACCESS.2021.3124629
Altan, A., Karasu, S., and Bekiros, S. (2019). Digital currency forecasting with chaotic meta-heuristic bio-inspired signal processing techniques. Chaos, Solitons Fractals 126, 325–336. doi: 10.1016/j.chaos.2019.07.011
Attari, M. Y. N., Torkayesh, A. E., Malmir, B., and Jami, E. N. (2021). Robust possibilistic programming for joint order batching and picker routing problem in warehouse management. Int. J. Prod. Res.. 59, 4434–4452. doi: 10.1080/00207543.2020.1766712
Azar, A., and Dolatabad, K. M. (2019). A method for modelling operational risk with fuzzy cognitive maps and Bayesian belief networks. Expert Syst. Appl. 115, 607–617. doi: 10.1016/j.eswa.2018.08.043
Baecke, P., de Baets, S., and Vanderheyden, K. (2017). Investigating the added value of integrating human judgement into statistical demand forecasting systems. Int. J. Prod. Econ. 191, 85–96. doi: 10.1016/j.ijpe.2017.05.016
Baryannis, G., Validi, S., Dani, S., and Antoniou, G. (2019). Supply chain risk management and artificial intelligence: state of the art and future research directions. Int. J. Prod. Res. 57, 2179–2202. doi: 10.1080/00207543.2018.1530476
Belhadi, A., Kamble, S. S., Venkatesh, M., Jabbour, C. J. C., and Benkhati, I. (2022). Building supply chain resilience and efficiency through additive manufacturing: an ambidextrous perspective on the dynamic capability view. Int. J. Prod. Econ. 249:108516. doi: 10.1016/j.ijpe.2022.108516
Ben-Daya, M., Hassini, E., and Bahroun, Z. (2019). Internet of things and supply chain management: a literature review. Int. J. Prod. Res. 57, 4719–4742. doi: 10.1080/00207543.2017.1402140
Bertolini, M., Mezzogori, D., Neroni, M., and Zammori, F. (2021). Machine learning for industrial applications: a comprehensive literature review. Expert Syst. Appl. 175:114820. doi: 10.1016/j.eswa.2021.114820
Bousqaoui, Halima, Achchab, Said, and Tikito, Kawtar. (2017). “Machine learning applications in supply chains: an emphasis on neural network applications.” in 2017 3rd international conference of cloud computing technologies and applications (CloudTech), pp. 1–7. IEEE, 2017.
Cannas, V. G., Ciano, M. P., Saltalamacchia, M., and Secchi, R. (2023). Artificial intelligence in supply chain and operations management: a multiple case study research. Int. J. Prod. Res. 62, 3333–3360. doi: 10.1080/00207543.2023.2232050
Cao, J., Jiang, Z., and Wang, K. (2016). Customer demand prediction of service-oriented manufacturing using the least square support vector machine optimized by particle swarm optimization algorithm. Eng. Optim. 49, 1197–1210. doi: 10.1080/0305215X.2016.1245729
Chen, X. (2022). Machine learning approach for a circular economy with waste recycling in smart cities. Energy Rep. 8, 3127–3140. doi: 10.1016/j.egyr.2022.01.193
Cho, R. K., and Gerchak, Y. (2005). Supply chain coordination with downstream operating costs: coordination and investment to improve downstream operating efficiency. Eur. J. Oper. Res. 162, 762–772. doi: 10.1016/j.ejor.2003.08.064
Chong, E., Han, C., and Park, F. (2017). Deep learning networks for stock market analysis and prediction: methodology, data representations, and case studies. Expert Syst. Appl. 83, 187–205. doi: 10.1016/j.eswa.2017.04.030
Chu, D. K., Akl, E. A., Duda, S., Solo, K., Yaacoub, S., Schünemann, H. J., et al. (2020). Physical distancing, face masks, and eye protection to prevent person-to-person transmission of SARS-CoV-2 and COVID-19: a systematic review and meta-analysis. The Lancet, 395, 1973–1987.
Ciresan, D., Meier, U., Masci, J., and Schmidhuber, J. (2012). Multi-column deep neural network for traffic sign classification. Neural Netw. 32, 333–338. doi: 10.1016/j.neunet.2012.02.023
Darvazeh, S. S., Vanani, I. R., and Musolu, F. M. (2020). Big data analytics and its applications in supply chain management, in new trends in the use of artificial intelligence for the industry 4.0. London, UK: IntechOpen.
Dashore, K., and Sohani, N. (2013). Green supply chain management: a hierarchical framework for barriers. Int. J. Eng. Trends Technol. (IJETT) 4, 2172–2182.
Dauphin, Y. N., Pascanu, R., Gulcehre, C., Cho, K., Ganguli, S., and Bengio, Y. (2014). Identifying and attacking the saddle point problem in high-dimensional non-convex optimization. Adv. Neural Inf. Proces. Syst. 27.
Dave, D., and Choudhary, V. (2014). Barriers to implement green supply chain management in transmission tower manufacturing industry using interpretive structural modelling technique. Int. J. Eng. Res. Technol. 3, 2063–2073.
Deif, A. M. (2011). A system model for green manufacturing. J. Clean. Prod. 19, 1553–1559. doi: 10.1016/j.jclepro.2011.05.022
Dhamija, P., and Bag, S. (2020). Role of artificial intelligence in operations environment: a review and bibliometric analysis. TQM J. 32, 869–896. doi: 10.1108/TQM-10-2019-0243
Dittrich, M. A., and Fohlmeister, S. (2021). A deep q-learning-based optimization of the inventory control in a linear process chain. Prod. Eng. 15, 35–43. doi: 10.1007/s11740-020-01000-8
DuHadway, S., Carnovale, S., and Hazen, B. (2019). Understanding risk management for intentional supply chain disruptions: risk detection, risk mitigation, and risk recovery. Ann. Oper. Res. 283, 179–198. doi: 10.1007/s10479-017-2452-0
Dzogbewu, T. C., Koranteng-Fianko, S., Jnr, S. A., Amoah, N., Imdaadulah, A., and Johan, D. (2023). Supply chain disruptions and resilience in manufacturing industry during Covid-19: additive manufacturing intervention in perspective. J. Industrial Eng. Manag. JIEM 16, 509–520. doi: 10.3926/jiem.4526
Eladly, A. M., Abed, A. M., Aly, M. H., and Salama, W. M. (2023). Enhancing circular economy via detecting and recycling 2D nested sheet waste using Bayesian optimization technique based-smart digital twin. Results Eng. 2023:101544. doi: 10.1016/j.rineng.101544
Friedman, P. (2008). Leaning toward green: Green your supply chain with lean practices. Outsourced Logistics. 1, 16–17.
Furian, N., O’Sullivan, M., Walker, C., and Çela, E. (2021). A machine learning-based branch and price algorithm for a sampled vehicle routing problem. OR Spectr. 43, 693–732. doi: 10.1007/s00291-020-00615-8
Gao, Q., Guo, S., Liu, X., Manogaran, G., Chilamkurti, N., and Kadry, S. (2019). Simulation analysis of supply chain risk management system based on IoT information platform. Enterp. Inf. Syst. 14, 1354–1378. doi: 10.1080/17517575.2019.1644671
Gao, X., and Lee, G. (2019). Moment-based rental prediction for bicycle-sharing transportation systems using a hybrid genetic algorithm and machine learning. Comput. Ind. Eng. 128, 60–69. doi: 10.1016/j.cie.2018.12.023
García, S., Fernández, A., Luengo, J., and Herrera, F. (2009). A study of statistical techniques and performance measures for genetics based machine learning: accuracy and interpretability. Soft. Comput. 13, 959–977. doi: 10.1007/s00500-008-0392-y
Garfamy, R. M. (2011). Supplier selection and business process improvement: an exploratory multiple case study. Int. J. Operational Res. 10, 240–255. doi: 10.1504/IJOR.2011.038586
Gaur, M., Goel, S., and Jain, E. (2015). “Comparison between nearest Neighbours and Bayesian network for demand forecasting in supply chain management,” in 2015 2nd international conference on computing for sustainable global development (INDIACom) (pp. 1433–1436). IEEE.
Giri, C., Jain, S., Zeng, X., and Bruniaux, P. (2019). A detailed review of artificial intelligence applied in the fashion and apparel industry. IEEE Access 7, 95376–95396. doi: 10.1109/ACCESS.2019.2928979
Hamdy, W., Al-Awamry, A., and Mostafa, N. (2022). Warehousing 4.0: a proposed system of using node-red for applying internet of things in warehousing. Sustainable. Futures 4:100069. doi: 10.1016/j.sftr.2022.100069
Han, C., and Zhang, Q. (2021). Optimization of supply chain efficiency management based on machine learning and neural network. Neural Comput. & Applic. 33, 1419–1433. doi: 10.1007/s00521-020-05023-1
Haq, A. U., Li, J. P., Memon, M. H., Nazir, S., and Sun, R. (2018). A hybrid intelligent system framework for the prediction of heart disease using machine learning algorithms. Mob. Inf. Syst. 2018, 1–21. doi: 10.1155/2018/3860146
Ho, W., Zheng, T., Yildiz, H., and Talluri, S. (2015). Supply chain risk management: a literature review. Int. J. Prod. Res. 53, 5031–5069. doi: 10.1080/00207543.2015.1030467
Holt, D., and Gobadian, A. (2009). An empirical study of green supply chain management practices amongst UK manufacturers. J. Manuf. Technol. Manag. 20, 933–956. doi: 10.1108/17410380910984212
Hosseini, A. (2007). Identification of green management of system’s factors: a conceptualized model. Int. J. Manag. Sci. Eng. Manag. 2, 221–228. doi: 10.1080/17509653.2007.10671022
Huang, Y., Yuan, Y., Chen, H., Wang, J., Guo, Y., and Ahmad, T. (2019). A novel energy demand prediction strategy for residential buildings based on ensemble training. Energy Procedia 158, 3411–3416. doi: 10.1016/j.egypro.2019.01.935
Huber, J., and Stuckenschmidt, H. (2020). Daily retail demand forecasting using machine learning with an emphasis on calendric special days. Int. J. Forecast. 36, 1420–1438. doi: 10.1016/j.ijforecast.2020.02.005
Ibrahim, A. (2021). “Forecasting the early market movement in bitcoin using twitter's sentiment analysis: an ensemble-based prediction model,” in 2021 IEEE international IOT, electronics and mechatronics conference (IEMTRONICS) (pp. 1–5). IEEE.
Izadyar, N., Ong, H., Shamshirband, S., Ghadamian, H., and Tong, C. (2015). Intelligent forecasting of residential heating demand for the district heating system based on the monthly overall natural gas consumption. Energ. Buildings 104, 208–214. doi: 10.1016/j.enbuild.2015.07.006
Ji, L., Zou, Y., He, K., and Zhu, B. (2019). Carbon futures price forecasting based with ARIMA-CNN-LSTM model. Procedia Computer Sci. 162, 33–38. doi: 10.1016/j.procs.2019.11.254
Jordan, M. I., and Mitchell, T. M. (2015). Machine learning: trends, perspectives, and prospects. Science 349, 255–260. doi: 10.1126/science.aaa8415
Kamble, S. S., Gunasekaran, A., and Gawankar, S. A. (2020). Achieving sustainable performance in a data-driven agriculture supply chain: a review for research and applications. Int. J. Prod. Econ. 219, 179–194. doi: 10.1016/j.ijpe.2019.05.022
Kamble, S. S., Gunasekaran, A., Parekh, H., and Joshi, S. (2019a). Modeling the internet of things adoption barriers in food retail supply chains. J. Retail. Consum. Serv. 48, 154–168. doi: 10.1016/j.jretconser.2019.02.020
Kamble, S. S., Gunasekaran, A., Parekh, H., Mani, V., Belhadi, A., and Sharma, R. (2022). Digital twin for sustainable manufacturing supply chains: current trends, future perspectives, and an implementation framework. Technol. Forecast. Soc. Chang. 176:121448. doi: 10.1016/j.techfore.2021.121448
Kamble, S. S., Gunasekaran, A., and Sharma, R. (2019). Modeling the blockchain-enabled traceability in agriculture supply chain. Int. J. Inf. Manag. 52:101967. doi: 10.1016/j.ijinfomgt.2019.05.023
Kazemi, Y. (2019). AI, big data & advanced analytics in the supply chain. Available at: https://www.forbes.com/sites/yasamankazemi/2019/01/29/ai-big-data-advanced-analytics-in-the-supply-chain/#75db62f4244f.
Khalid, W., and Herbert-Hansen, Z. N. L. (2018). Using k-means clustering in international location decision. J. Global Operations and Strategic Sourcing 11, 274–300. doi: 10.1108/JGOSS-11-2017-0056
Klar, M., Glatt, M., and Aurich, J. C. (2023). Performance comparison of reinforcement learning and metaheuristics for factory layout planning. CIRP J. Manuf. Sci. Technol. 45, 1755–5817. doi: 10.1016/j.cirpj.2023.05.008
Konovalenko, I., and Ludwig, A. (2019). Event processing in supply chain management–the status quo and research outlook. Comput. Ind. 105, 229–249. doi: 10.1016/j.compind.2018.12.009
Kovács, G., and Kot, S. (2016). New logistics and production trends as the effect of global economy changes. Pol. J. Manag. Stud. 14, 115–126. doi: 10.17512/pjms.2016.14.2.11
Kraus, M., Feuerriegel, S., and Oztekin, A. (2020). Deep learning in business analytics and operations research: models, applications and managerial implications. Eur. J. Oper. Res. 281, 628–641. doi: 10.1016/j.ejor.2019.09.018
Lee, J., Davari, H., Singh, J., and Pandhare, V. (2018). Industrial artificial intelligence for industry 4.0-based manufacturing systems. Manufacturing letters 18, 20–23. doi: 10.1016/j.mfglet.2018.09.002
Leung, M. K., Xiong, H. Y., Lee, L. J., and Frey, B. J. (2014). Deep learning of the tissue-regulated splicing code. Bioinformatics 30, i121–i129. doi: 10.1093/bioinformatics/btu277
Lin, H., Lin, J., and Wang, F. (2022). An innovative machine learning model for supply chain management. J. Innov. Knowl. 7:100276. doi: 10.1016/j.jik.2022.100276
Liu, C. (2022). Risk prediction of digital transformation of manufacturing supply chain based on principal component analysis and backpropagation artificial neural network. Alex. Eng. J. 61, 775–784. doi: 10.1016/j.aej.2021.06.010
Liu, T., Xu, C., Guo, Y., and Chen, H. (2019). A novel deep reinforcement learning based methodology for short term HVAC system energy consumption prediction. Int. J. Refrig. 107, 39–51. doi: 10.1016/j.ijrefrig.2019.07.018
Liu, X., Yang, J., Qu, S., Wang, L., Shishime, T., and Bao, C. (2012). Sustainable production: practices and determinant factors of green supply chain management of Chinese companies. Bus. Strateg. Environ. 21, 1–16. doi: 10.1002/bse.705
Lunardi, A. R., and Lima Junior, F. R. (2021). Comparison of artificial neural networks learning methods to evaluate supply chain performance. Gestão & Produção 28:e5450. doi: 10.1590/1806-9649-2021v28e5450
Ma, J., Sheridan, R. P., Liaw, A., Dahl, G. E., and Svetnik, V. (2015). Deep neural nets as a method for quantitative structure-activity relationships. J. Chem. Inf. Model. 55, 263–274. doi: 10.1021/ci500747n
Makkar, S., Devi, G. N. R., and Solanki, V. K. (2020). “Applications of machine learning techniques in supply chain optimization” in ICICCT 2019–system reliability, quality control, safety, maintenance and management: Applications to electrical, electronics and computer science and engineering. Eds. V. Gunjan, V. Garcia Diaz, M. Cardona, V. Solanki, and K. Sunitha (Singapore: Springer), 861–869.
Malviya, L., Chittora, P., Chakrabarti, P., Vyas, R. S., and Poddar, S. (2021). Backorder prediction in the supply chain using machine learning. Materials Today: Proceed. 2021:558. doi: 10.1016/j.matpr.2020.11.558
Mikolov, T., Deoras, A., Povey, D., Burget, L., and Cernocky, J. (2011). Strategies for training large scale neural network language models. Proc. Automatic Speech Recog. Understand., 196–201. doi: 10.1109/ASRU.2011.6163930
Misic, V. V., and Perakis, G. (2020). Data analytics in operations management: a review. Manuf. Serv. Oper. Manag. 22, 158–169. doi: 10.1287/msom.2019.0805
Mitra, A., Jain, A., Kishore, A., and Kumar, P. (2023). “A comparative study for machine learning models in retail demand forecasting” in Human-centric smart computing. Smart innovation, systems and technologies. eds. S. Bhattacharyya, J. S. Banerjee, and M. Köppen, vol. 316 (Singapore: Springer).
Montufar, G. F., Pascanu, R., Cho, K., and Bengio, Y. (2014). On the number of linear regions of deep neural networks. Proc. Adv. Neural Inf. Proces. Syst. 27, 2924–2932.
Mudgal, R. K., Shankar, R., Talib, P., and Raj, T. (2009). Greening the supply chain practices: an Indian perspective of enablers’ relationship. Int. J. Adv. Oper. Manag. 1, 151–176. doi: 10.1504/IJAOM.2009.030671
Nagar, D., Raghav, S., Bhardwaj, A., Kumar, R., Singh, P. L., and Sindhwani, R. (2021). Machine learning: Best way to sustain the supply chain in the era of industry 4.0. Materials Today: Proceed.. 47, 3676–3682. doi: 10.1016/j.matpr.2021.01.267
Najjartabar Bisheh, M., Nasiri, G. R., Esmaeili, E., Davoudpour, H., and Chang, S. I. (2022). A new supply chain distribution network design for two classes of customers using transfer recurrent neural network. Int. J. Syst. Assur. Eng. Manag. 13, 2604–2618. doi: 10.1007/s13198-022-01670-w
Neethu, M. S., and Rajasree, R. (2013). "Sentiment analysis in twitter using machine learning techniques," in 2013 fourth international conference on computing, communications and networking technologies (ICCCNT), (Tiruchengode, India: IEEE Access) pp. 1–5.
Ni, D., Xiao, Z., and Lim, M. K. (2020). A systematic review of the research trends of machine learning in supply chain management. Int. J. Mach. Learn. Cybern. 11, 1463–1482. doi: 10.1007/s13042-019-01050-0
Nie, H., Liu, G., Liu, X., and Wang, Y. (2012). Hybrid of ARIMA and SVMs for short-term load forecasting. Energy Procedia 16, 1455–1460. doi: 10.1016/j.egypro.2012.01.229
Pan, S., Zhang, L., Thompson, R. G., and Ghaderi, H. (2021). A parcel network flow approach for joint delivery networks using parcel lockers. Int. J. Prod. Res.. 59, 2090–2115. doi: 10.1080/00207543.2020.1856440
Panda, S. K., and Mohanty, S. N. (2023). Time series forecasting and modelling of food demand supply chain based on regressors analysis, vol. 11. IEEE Access, 42679–42700.
Pant, D. R., Neupane, P., Poudel, A., Pokhrel, A. K., and Lama, B. K. (2018). “Recurrent neural network-based bitcoin price prediction by twitter sentiment analysis,” in 2018 IEEE 3rd international conference on computing, communication and security (ICCCS) (pp. 128–132). IEEE.
Park, K. J. (2021). Determining the tiers of a supply chain using machine learning algorithms. Symmetry 13:1934. doi: 10.3390/sym13101934
Pelletier, N., and Tyedmers, P. (2010). Forecasting potential global environmental costs of livestock production 2000–2050. Proc. Natl. Acad. Sci. 107, 18371–18374. doi: 10.1073/pnas.1004659107
Peng, J., Jury, E. C., Dönnes, P., and Ciurtin, C. (2021). Machine learning techniques for personalised medicine approaches in immune-mediated chronic inflammatory diseases: applications and challenges. Front. Pharmacol. 12:720694.
Perera, N., Fahimnia, B., and Tokar, T. (2020). Inventory and order decisions: a systematic review on research driven through behavioral experiments. Int. J. Oper. Prod. Manag. 40, 997–1039. doi: 10.1108/IJOPM-05-2019-0339
Peres, R. S., Jia, X., Lee, J., Sun, K., Colombo, A. W., and Barata, J. (2020). Industrial artificial intelligence in industry 4.0-systematic review, challenges and outlook. IEEE Access 8, 220121–220139. doi: 10.1109/ACCESS.2020.3042874
Pournader, M., Ghaderi, H., Hassanzadegan, A., and Fahimnia, B. (2021). Artificial intelligence applications in supply chain management. Int. J. Prod. Econ. 241:108250. doi: 10.1016/j.ijpe.2021.108250
Pournader, M., Kach, A., and Talluri, S. (2020a). A review of the existing and emerging topics in the supply chain risk management literature. Decis. Sci. J. 51, 867–919. doi: 10.1111/deci.12470
Pournader, M., Shi, Y., Seuring, S., and Koh, S. C. L. (2020b). Blockchain applications in supply chains, transport and logistics: a systematic review of the literature. Int. J. Prod. Res. 58, 2063–2081. doi: 10.1080/00207543.2019.1650976
Prifti, V., Sinoimeri, D., Lazaj, A., Dini, B., and Luniku, K. (2024). “Using ‘machine learning’ techniques in increasing the efficiency of sales forecasting in Albania,” In: G. Guxho, T. Kosova Spahiu, V. Prifti, A. Gjeta, E. Xhafka, and A Sulejmani. (eds) Proceedings of the joint international conference: 10th textile conference and 4th conference on engineering and entrepreneurship. ITC-ICEE 2023. Lecture Notes on Multidisciplinary Industrial Engineering. Springer, Cham.
Prifti, V., Sinoimeri, D., Lazaj, A., and Keci, J. (2023). Impact of the information systems and technology on enterprises. J. Integr. Eng. Appl. Sci. 1, 23–31. doi: 10.5281/zenodo.10655748
Priore, P., Ponte, B., Rosillo, R., and de la Fuente, D. (2019). Applying machine learning to the dynamic selection of replenishment policies in fast-changing supply chain environments. Int. J. Prod. Res. 11, 3663–3677. doi: 10.1080/00207543.2018.1552369
Raina, R., Madhavan, A., and Ng, A. Y. (2009). “Large-scale deep unsupervised learning using graphics processors,” in Proc. 26th annual international conference on machine learning. 873–880.
Read, Q. D., and Muth, M. K. (2021). Cost-effectiveness of four food waste interventions: is food waste reduction a “win–win?”. Resour. Conserv. Recycl. 168:105448. doi: 10.1016/j.resconrec.2021.105448
Rehman, T. U., Mahmud, M. S., Chang, Y. K., Jin, J., and Shin, J. (2019). Current and future applications of statistical machine learning algorithms for agricultural machine vision systems. Comput. Electron. Agric. 156, 585–605. doi: 10.1016/j.compag.2018.12.006
Rico-Fernández, M. P., Rios-Cabrera, R., Castelán, M., Guerrero-Reyes, H. I., and Juarez-Maldonado, A. (2019). A contextualized approach for segmentation of foliage in different crop species. Comput. Electron. Agric. 156, 378–386. doi: 10.1016/j.compag.2018.11.033
Saghaei, M., Ghaderi, H., and Soleimani, H. (2020). Design and optimization of biomass electricity supply chain with uncertainty in material quality, availability and market demand. Energy 197:117165. doi: 10.1016/j.energy.2020.117165
Salama, W. M., Aly, M. H., Abed, A. M., and Eladly, A. (2023). Efficiency marker evaluation based on optimized deep learning supported by Bayesian optimization technique. Textile Res. J. (TRJ). 93, 4273–4289. doi: 10.1177/00405175231171720
Sameh Ibrahim, M., Mansour, M. A. R., and Abed, A. M. (2011). Improve six-sigma management by forecasting production quantity using image verification quality tool. Int. J. Advan. Eng. Technol. (IJAET) 1, 332–342.
Sharma, R., Kamble, S. S., Gunasekaran, A., Kumar, V., and Kumar, A. (2020). A systematic literature review on machine learning applications for sustainable agriculture supply chain performance. Comput. Oper. Res. 119:104926. doi: 10.1016/j.cor.2020.104926
Sharma, M., Mittal, N., Mishra, A., and Gupta, A. (2023). Machine learning-based electricity load forecast for the agriculture sector. Int. J. Software Innovation (IJSI) 11, 1–21. doi: 10.4018/IJSI.315735
Sheth, V., Tripathi, U., and Sharma, A. (2022). A comparative analysis of machine learning algorithms for classification purpose. Procedia Computer Sci. 215, 422–431. doi: 10.1016/j.procs.2022.12.044
Shrestha, Y. R., Krishna, V., and von Krogh, G. (2021). Augmenting organizational decision-making with deep learning algorithms: principles, promises, and challenges. J. Bus. Res. 123, 588–603. doi: 10.1016/j.jbusres.2020.09.068
Sin, E., and Wang, L. (2017). “Bitcoin price prediction using ensembles of neural networks,” in 2017 13th international conference on natural computation, fuzzy systems and knowledge discovery (ICNC-FSKD) (pp. 666–671). IEEE.
Singh, A., Shukla, N., and Mishra, N. (2018). Social media data analytics to improve supply chain management in food industries. Transportation Res. Part E: Logistics and Transportation Rev. 114, 398–415. doi: 10.1016/j.tre.2017.05.008
Singh, P. L., Sindhwani, R., Dua, N. K., Jamwal, A., Aggarwal, A., Iqbal, A., et al. (2019). “Evaluation of common barriers to the combined lean-green-agile manufacturing system by two-way assessment method” in Advances in industrial and production engineering (Singapore: Springer), 653–672.
Srivastava, S. K. (2007). Green supply chain management: a state-of-the-art literature review. Int. J. Manag. Rev. 9, 53–80. doi: 10.1111/j.1468-2370.2007.00202.x
Sun, X., Liu, M., and Sima, Z. (2020). A novel cryptocurrency price trend forecasting model based on LightGBM. Financ. Res. Lett. 32:101084. doi: 10.1016/j.frl.2018.12.032
Sun, Y., and Tian, L. (2023). “Research on stock prediction based on LSTM and CatBoost algorithm,” in Proceedings of the 2nd International Conference on Bigdata Blockchain and Economy Management, ICBBEM 2023, May 19–21, 2023, Hangzhou, China.
Tirkolaee, E. B., Sadeghi, S., Mooseloo, F. M., Vandchali, H. R., and Aeini, S. (2021). Application of machine learning in supply chain management: a comprehensive overview of the main areas. Math. Probl. Eng. 2021, 1–14. doi: 10.1155/2021/1476043
Tompson, J., Jain, A., LeCun, Y., and Bregler, C. (2014). Joint training of a convolutional network and a graphical model for human pose estimation. In Proc. Adv. Neural Inf. Proces. Syst. 27, 1799–1807.
Toorajipour, R., Sohrabpour, V., Nazarpour, A., Oghazi, P., and Fischl, M. (2021). Artificial intelligence in supply chain management: a systematic literature review. J. Bus. Res. 122, 502–517. doi: 10.1016/j.jbusres.2020.09.009
Traore, B. B., Kamsu-Foguem, B., and Tangara, F. (2017). Data mining techniques on satellite images for discovery of risk areas. Expert Syst. Appl. 72, 443–456. doi: 10.1016/j.eswa.2016.10.010
Trappey, A. J. C., Trappey, C. V., Wu, J.-L., and Wang, J. W. C. (2020). Intelligent compilation of patent summaries using machine learning and natural language processing techniques. Adv. Eng. Inform. 43:101027. doi: 10.1016/j.aei.2019.101027
Vairagade, N., Logofatu, D., Leon, F., and Muharemi, F. (2019). “Demand forecasting using random Forest and artificial neural network for supply chain management” in Computational collective intelligence. ICCCI 2019. eds. N. Nguyen, R. Chbeir, E. Exposito, P. Aniorté, and B. Trawiński, Lecture Notes in Computer Science, Vol. 11683 (Cham: Springer).
Vandchali, H. R., Cahoon, S., and Chen, S. L. (2021). The impact of power on the depth of sustainability collaboration in the supply chain network for Australian food retailers. Int. J. Procurement Manag. 14, 165–184. doi: 10.1504/IJPM.2021.113487
Vandchali, H. R., Cahoon, S., and Chen, S.-L. (2021). The impact of supply chain network structure on relationship management strategies: an empirical investigation of sustainability practices in retailers. Sustain. Production Consump. 28, 281–299. doi: 10.1016/j.spc.2021.04.016
Wamba, S. F., Gunasekaran, A., Akter, S., Ren, S. J. F., Dubey, R., and Childe, S. J. (2017). Big data analytics and firm performance: effects of dynamic capabilities. J. Bus. Res. 70, 356–365. doi: 10.1016/j.jbusres.2016.08.009
Wang, L., Jia, F., Chen, L., and Xu, Q. (2023). Forecasting SMEs’ credit risk in supply chain finance with a sampling strategy based on machine learning techniques. Ann. Oper. Res. 331, 1–33. doi: 10.1007/s10479-022-04518-5
Wang, D., and Zhang, Y. (2020). Implications for sustainability in supply chain management and the circular economy using machine learning model. IseB 21, 1–13. doi: 10.1007/s10257-020-00477-1
Wenzel, H., Smit, D., and Sardesai, S. (2019). Artificial intelligence and digital transformation in supply chain management: innovative approaches for supply chains. Proceed. Hamburg Inst. 27, 413–441. doi: 10.15480/882.2460
Wichmann, P., Brintrup, A., Baker, S., Woodall, P., and McFarlane, D. (2020). Extracting supply chain maps from news articles using deep neural networks. Int. J. Prod. Res. 58, 5320–5336. doi: 10.1080/00207543.2020.1720925
Widodo, C. E., Adi, K., and Gernowo, R. (2024). A support vector machine approach for identification of pleural effusion. Heliyon 10:e22778. doi: 10.1016/j.heliyon.2023.e22778
Wu, C. H., Lu, C. C., Ma, Y. F., and Lu, R. S. (2018). “A new forecasting framework for bitcoin price with LSTM,” in 2018 IEEE international conference on data mining workshops (ICDMW) (pp. 168–175). IEEE.
Xiao, G., Guo, J., Da Xu, L., and Gong, Z. (2014). User interoperability with heterogeneous IoT devices through transformation. IEEE Trans. Industr. Inform. 10, 1486–1496. doi: 10.1109/TII.2014.2306772
Xu, Z., Ni, W., Liu, S., Wang, F., and Li, J. (2023). Logistics supply chain network risk prediction model based on intelligent random Forest model. IEEE Trans. Eng. Manag. 71, 9813–9825. doi: 10.1109/TEM.2023.3317922
Yan, M. (2023). “Simulation of financial risk prediction model based on Apriori optimization algorithm,” in 2023 international conference on networking, informatics and computing (ICNETIC) (pp. 511–515). IEEE.
Yan, W., He, J., and Trappey, A. J. C. (2019). Risk-aware supply chain intelligence: AI-enabled supply chain and logistics management considering risk mitigation. Adv. Eng. Inform. 42:100976. doi: 10.1016/j.aei.2019.100976
Yang, Z., and Sudharshan, D. (2019). Examining multicategory cross purchases models with increasing dataset scale–an artificial neural network approach. Expert Syst. Appl. 120, 310–318. doi: 10.1016/j.eswa.2018.11.038
Yang, T., Yi, X., Lu, S., Johansson, K. H., and Chai, T. (2021). Intelligent manufacturing for the process industry driven by industrial artificial intelligence. Engineering 7, 1224–1230. doi: 10.1016/j.eng.2021.04.023
Yani, L. P. E., Priyatna, I. M. A., and Aamer, A. M. (2019). Exploring machine learning applications in supply chain management. In 9th international conference on operations and supply chain management (pp. 161–169).
Yu Lin, C., and Hui Ho, Y. (2008). An empirical study on logistics services provider, intention to adopt green innovations. J. Technol. Manag. Innov. 3, 17–26.
Zekhnini, K., Cherrafi, A., Bouhaddou, I., Benghabrit, Y., and Garza-Reyes, J. A. (2021). Supply chain management 4.0: a literature review and research framework. Benchmarking Int. J. 28, 465–501. doi: 10.1108/BIJ-04-2020-0156
Zhang, L., Wu, X., Skibniewski, M. J., Zhong, J., and Lu, Y. (2014). Bayesian-network-based safety risk analysis in construction projects. Reliab. Eng. Syst. Saf. 131, 29–39. doi: 10.1016/j.ress.2014.06.006
Glossary
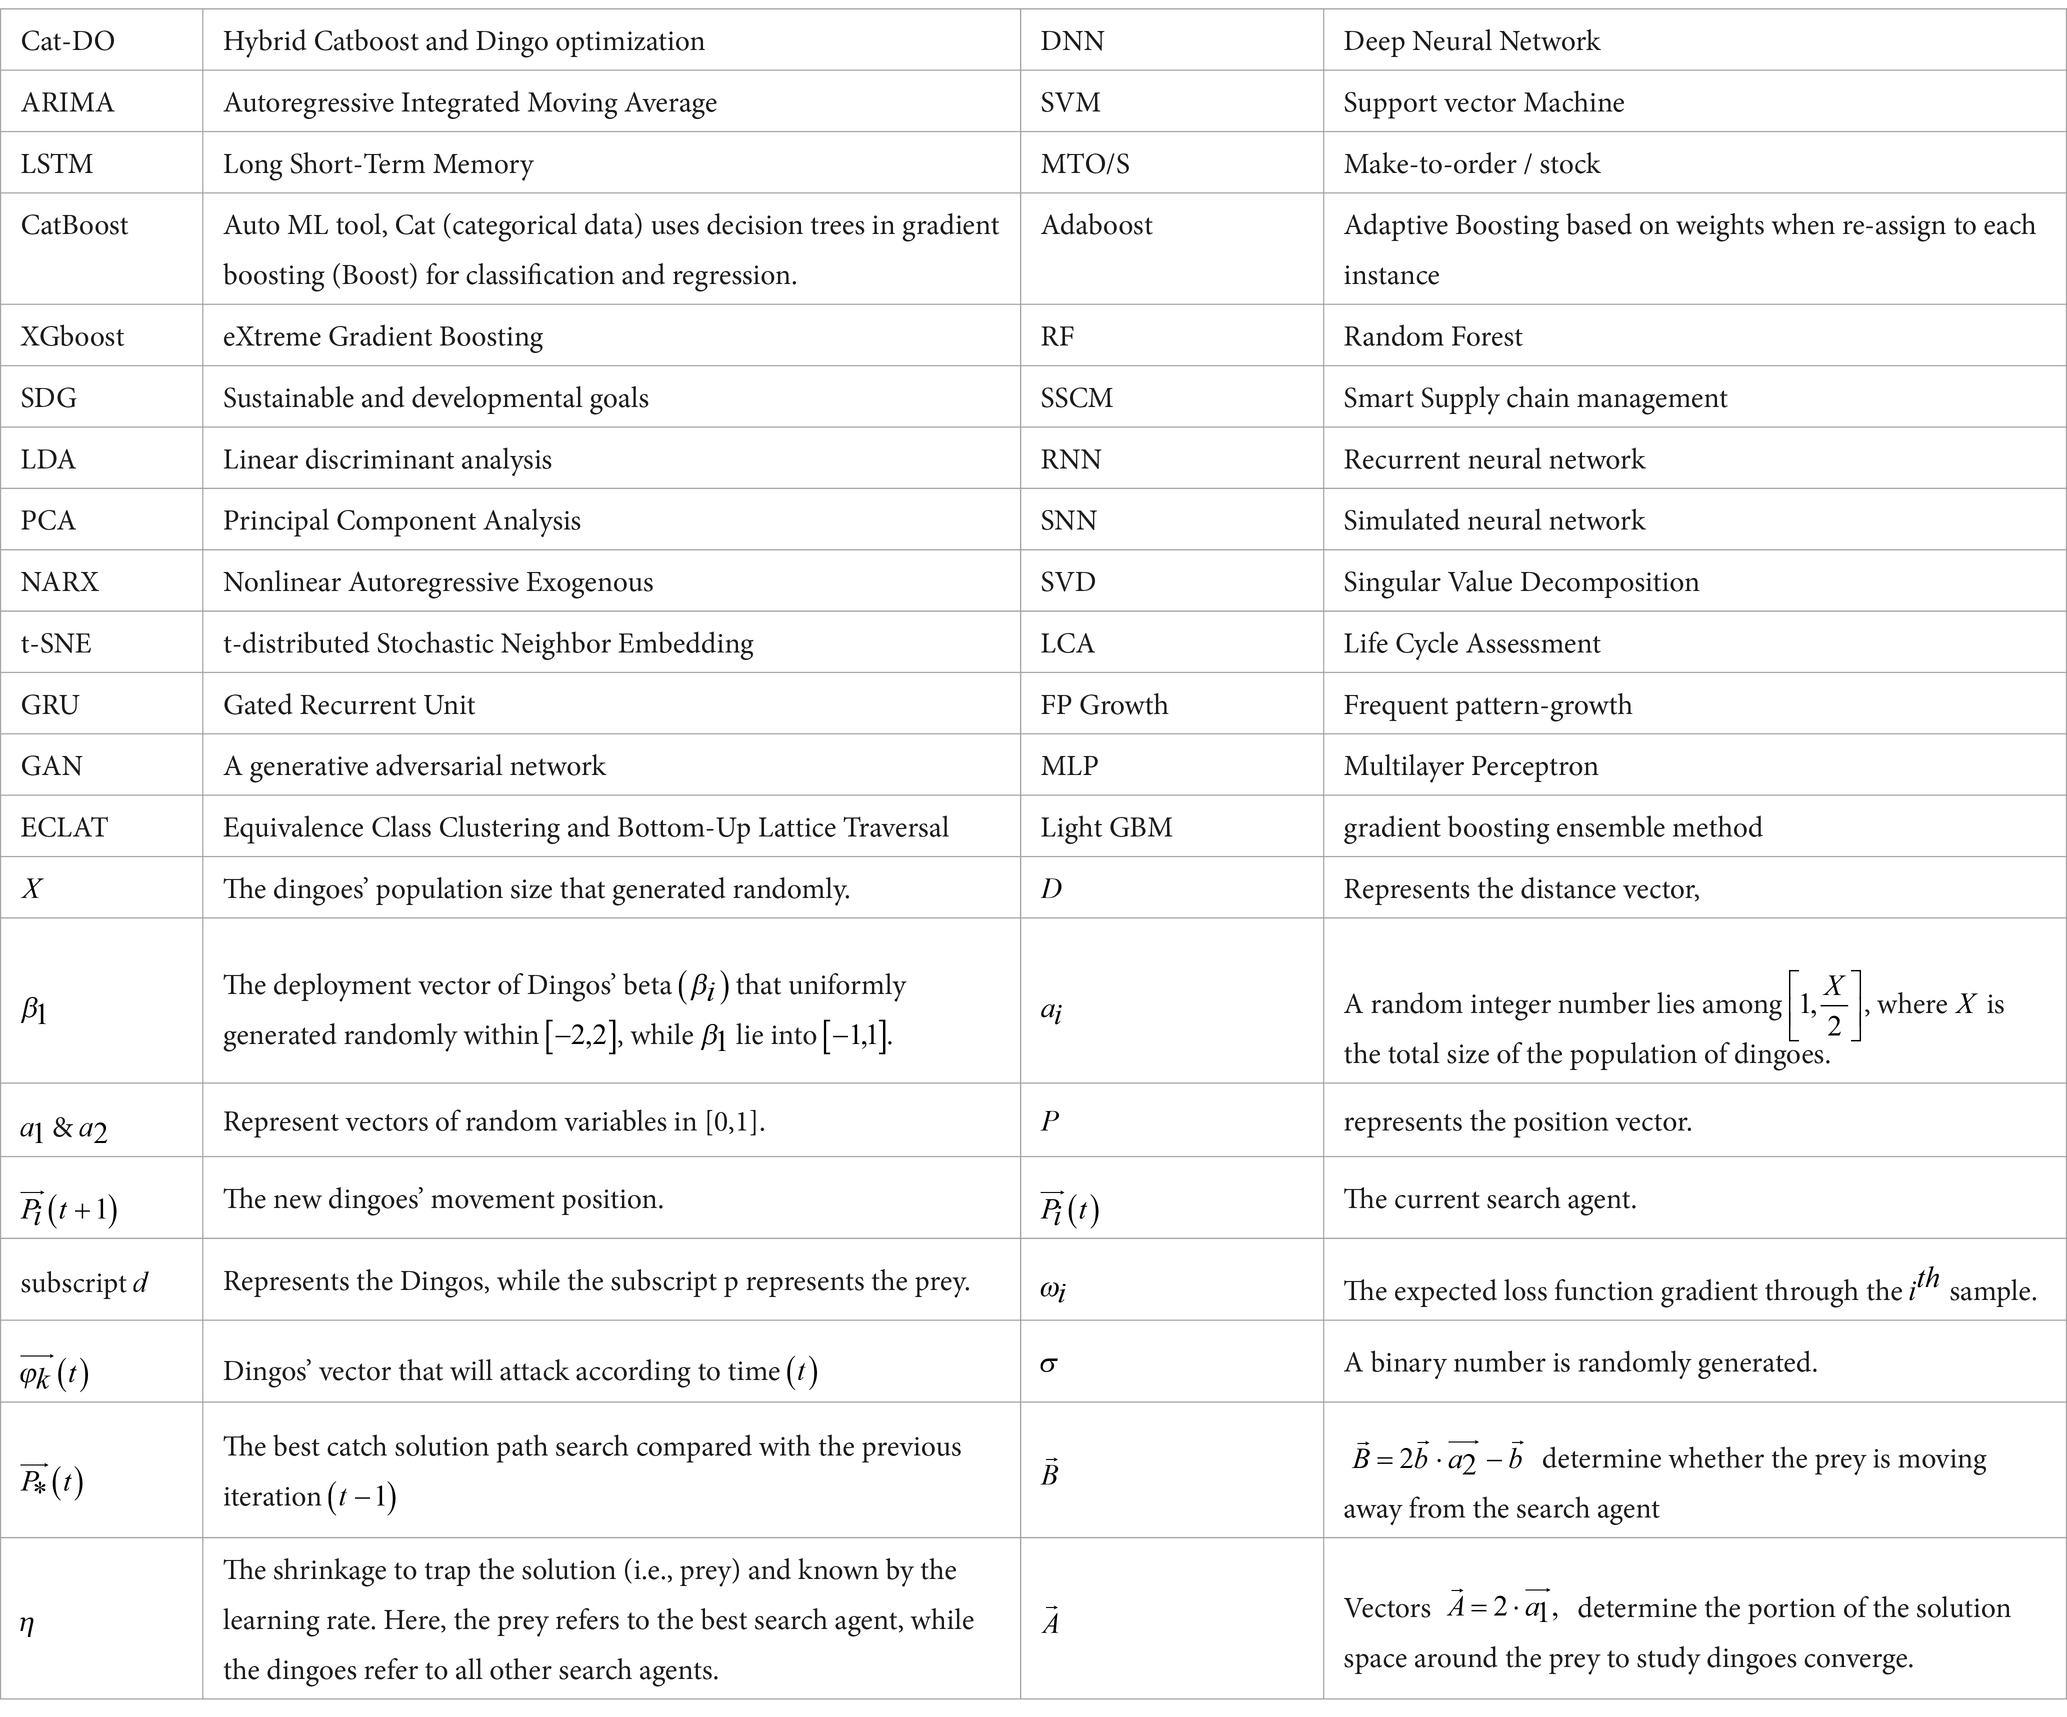
Keywords: machine learning, e-business, supply chain intelligence management, inventory control, hybridize algorithms
Citation: Abed AM (2024) Accelerate demand forecasting by hybridizing CatBoost with the dingo optimization algorithm to support supply chain conceptual framework precisely. Front. Sustain. 5:1388771. doi: 10.3389/frsus.2024.1388771
Edited by:
Pourya Pourhejazy, UiT The Arctic University of Norway, NorwayReviewed by:
Bikash Koli Dey, Hongik University, Republic of KoreaRekha Guchhait, Yonsei University, Republic of Korea
Copyright © 2024 Abed. This is an open-access article distributed under the terms of the Creative Commons Attribution License (CC BY). The use, distribution or reproduction in other forums is permitted, provided the original author(s) and the copyright owner(s) are credited and that the original publication in this journal is cited, in accordance with accepted academic practice. No use, distribution or reproduction is permitted which does not comply with these terms.
*Correspondence: Ahmed M. Abed, YS5hYmVkQHBzYXUuZWR1LnNh; YWhtZWQtYWJlZEB6dS5lZHUuZWc=