- 1Department of Mechanical Engineering, Khalifa University, Abu Dhabi, United Arab Emirates
- 2Department of Renewable and Sustainable Energy, University of Sharjah, Sharjah, United Arab Emirates
In this study, the co-gasification of sewage sludge and petroleum coke is assessed with equilibrium and numerical modeling. The gasification process of these binary wastes provides a potential pathway for waste management and environmental sustainability. First, the thermodynamic equilibrium approach is used to calculate the maximum cold gasification efficiency (CGE) at different mixture ratios in an attempt to narrow down and focus on the appropriate composition of the two kinds of feedstock within the entrained flow gasifier. Furthermore, a parametric study is conducted to show the gasification metrics, i.e., CGE and feedstock conversion, and the syngas composition at different gasification conditions. The equilibrium model is based on eight unknowns in the gasification product, namely, H2, CO, CO2, H2O, CH4, O2, Csolid, and the temperature, under variable O2 and H2O molar ratios. Using three elemental mass balances, four equilibrium (Csolid) constant relations, and energy balance, the mathematical model is developed. The model incorporates the solid unburnt carbon in the product species. The temperature of gasification is determined through an iterative process. Using the result of the equilibrium model, a high-fidelity reactive flow model that accounts for the reactor geometry and the devolatilization kinetics is developed. This model accounts for an extended set of reactions covering the char combustion, water and gas shifts, Boudouard and devolatilization. Finally, economic analysis is carried out to assess the conditions when such a process can be deemed to be profitable. The result of the model shows that the maximum CGE is achieved when all the solid carbon is converted into carbon monoxide with nearly all hydrogen present in the feedstock converted into hydrogen gas. The maximum conversion was attained with sewage sludge and petroleum coke ratio of 1 at 1,200°C. The mole fraction of the syngas species obtained is XH2 = 0.4227 and XCO = 0.5774 and a small fraction of XCH4 = 0.0123. Moreover, the cold gasification efficiency (CGE) measures 87.02% for the H2 and CO syngas species and reached 91.11% for the three species, including CH4. The gasification of the sewage sludge and petroleum coke at 50:50 is economically viable at temperatures higher than 950°C. A peak net gain of 0.16 $/kg of fuel blend was achieved at 1,250°C. At temperatures lower than 950°C, net losses were realized. This could be associated with less product gas yield, which is not significant enough to counteract the input costs. For instance, the net losses were −0.03 and −0.17 $/kg of feedstock at 950 and 800°C, respectively.
1. Introduction
Persistent sewage sludge production and disposal from wastewater treatment plants continue to pose serious socioeconomic and environmental concerns. There has been a consistent trend of widespread and rising sewage sludge production worldwide (Gao et al., 2020; Wei et al., 2020; Bagheri et al., 2023). For instance, the annual global production of dry sewage sludge was estimated to be about 45 million tons in 2017 (Werle and Wilk, 2010; Lombardi et al., 2017), and this production rate continues to rise. It is estimated that this would increase to 127.5 million tons in 2030 (Mateo-Sagasta et al., 2015). Considering the potential significant hazards that are often associated with sewage sludge, the tremendous generation elicits an urgent efficient and effective management portfolio. Sewage sludge often consists of organic pollutants in the form of furans, dioxins, and polycyclic aromatic hydrocarbons, as well as heavy metals, bacteria, pathogens, viruses, pharmaceutical hormones, etc. (Atienza-Martínez et al., 2013; Wei et al., 2020). Moreover, the management of sludge incurs a significant economic penalty. For instance, in Europe, about half of the operating cost of sewage sludge treatment plants is linked to their disposal and handling (Ragazzi et al., 2015; Gao et al., 2020). The mean disposal cost ranges from 160 to 310 euros per ton of dry sludge (Kacprzak et al., 2017; Ferrentino et al., 2023). In addition to the economic burden, the traditional methods of treatment of waste sludge encounter obstacles in meeting the requirements of stringent regulations (Furness et al., 2000; Lu et al., 2019). Methods such as incineration, landfilling, anaerobic digestion, and composting for agriculture are common in the utilization and treatment of waste sludge, and despite the regulations and management efforts, the poor handling of this hazardous waste remains a cumbersome challenge. The United States was reported to landfill ~28% in 2021 (Bagheri et al., 2023), China was estimated to landfill 20.1% in 2013 (Wei et al., 2020; Bagheri et al., 2023), European Nation states handle ~9% with landfilling (Brusselaers and Van Der Linden, 2020), and several other nations, treat most of their sludge waste with landfilling (Spinosa, 2011; Chen et al., 2022).
Due to the tremendous drawbacks of processing sewage sludge with incineration, landfilling, and anaerobic digestion, there is a need for the exploration of potential alternatives. Although these waste management methods have some benefits, their numerous limitations continue to impede their deployment. Landfilling and incineration could lead to detrimental impacts on human health and the environment. For example, incineration produces a broad range of pollutants that includes heavy metals, sulfur oxides, nitrogen oxides, acidic oxides, dioxins, furans, and particulate matter (Linak and Wendt, 1993; Mukherjee et al., 2016). These substances could contribute to respiratory complications, cancer, and hormonal defects. Likewise, landfills have been reported to produce toxic chemicals and leachates that can contaminate groundwater and soil (Weber et al., 2011; Wijekoon et al., 2022). Furthermore, anaerobic digestion provides limitations with huge space requirements, large waste retention time, low product flexibility, and high capital investments (Gao et al., 2020). Thus, there is a need for further exploration and evaluation of potential substitutes to conventional waste sludge treatment pathways. Gasification is one such alternative solution that has been widely adopted for waste treatment because of the numerous advantages the technology provides. Gasification technology is versatile with various gasifier technologies (Janajreh et al., 2021), i.e., moving/fixed bed (Carlos, 2005), fluidized or bubbling bed (Reed and Das, 1988; Knoef, 2005), and the entrained flow gasifier that is characterized by complete carbon conversion (E4Tech, 2009). It is already demonstrated in hundreds of power plants throughout the world totaling a capacity of over 10 GW essentially using coal, but also co-gasified with other carbonaceous streams, such as biomass, and even with some fraction wastes including municipal solid waste (MSW). Moreover, gasification could provide benefits to the environment through the removal of sulfur compounds and particulate recycling, and the capture of carbon dioxide via the usage of integrated gasification combined cycle (IGCC).
Because of the feedstock flexibility and product versatility of gasification technologies, it has been assessed by different studies for the treatment of sewage sludge (Schabauer, 2009; Akkache et al., 2016; You et al., 2016; Hantoko et al., 2018; Niu et al., 2018; Alves et al., 2019; Szwaja et al., 2019; Zhang et al., 2023). The gasification of sewage sludge as a standalone feedstock is challenging due to its high water and ash content. Hence, sewage sludge is often co-gasified with different kinds of feedstock such as biomass (Akkache et al., 2016; Niu et al., 2018; Alves et al., 2019; Szwaja et al., 2019), agricultural wastes (You et al., 2016; Ongen et al., 2022), shiitake substrate (Ongen et al., 2022), and coal (Hantoko et al., 2018; Zhang et al., 2023). In one study, Akkache et al. (2016) conducted the gasification of fuel blends consisting of either digested or secondary wastewater sewage sludge. Five different biomass materials (plastic, solid recovered fuel, paper, olive pomace, waste wood, and reed) were assessed for their feasibility for co-gasification with sewage sludge. Gasification experiments were conducted with steam in a laboratory-scale semi-batch gasifier with a 1 m height and 0.1 m diameter. They highlighted that plastic and paper exhibit the potential for reduced ammonia release, lowered slagging, and good conversion. For instance, plastic and paper showed a slagging index of 0 and 0.5, respectively. These are significantly lower in comparison with secondary (2.1) and digested (5.7) sewage sludge. Olive pomace and waste wood formed ash slags and possess fouling tendencies. Hence, they were discarded as potential blends with sewage sludge. Challenges with sewage sludge co-gasification with wood have been described in various studies as well (Webber and Daigle, 2017; Alves et al., 2019). In one study, Alves et al. (2019) gasified sewage sludge of blend percentage of 0–25 wt% with wood in a downdraft gasifier with 38 cm diameter and 50 cm height. They reported agglomeration and blockage due to elevated char formation. However, less tar, improved syngas yield, and increased cold gasification efficiency were observed at sewage sludge inclusion of 12.5 wt%. Zhang et al. (2023) examined the gasification of Zhundong coal with sewage sludge in a fluidized bed gasifier with a chamber size of 4 cm diameter and 1.4 m height. The gasification was performed with carbon dioxide at a flow rate of 1 L/min and a feedstock flow rate of 1 g/min. The maximum gasification performance was noted at a sewage sludge blending ratio of 0.4. However, there are little to no assessments of the co-gasification of sewage sludge and petroleum coke.
Petroleum coke is a hard carbon-rich product of heavy by-products of crude oil and oil sand refinery processes (being atmospheric or vacuum distillation or catalytic cracking) that has been produced since the 1930s. It is a valuable commercial product that is used directly in manufacturing aluminum, steel, glass, paint, and fertilizers, as well as a fuel in power generation, cement kilns, and other industries. It comprises 90–97% of carbon, 1.5–8% of hydrogen, 0.5–3.0% of sulfur, 0.3–0.5% of ash, and traces of nitrogen and chlorine with potential vanadium and toxic metal. The availability of petroleum coke is expected to increase due to decreasing demand for residual oil usage in the shipping sector driven by tighter emission regulations in this sector. Nearly a quarter of the US petroleum coke stockpile went to India, with a production increase in Unites States from 8 MT in 2010 to 160 MT in 2017 according to the associated press release (Webber and Daigle, 2017). Based on the assessment of the studies in the reported literature, there is little to no study on the gasification of sewage sludge and petroleum coke blends in an entrained flow reactor. These two kinds of feedstock constitute significant burdens for waste management. The high operating temperature of entrained flow reactors is a potential technology to accommodate and convert these waste streams to added-value syngas. Hence, in this study, the technical feasibility of gasifying different fuel blends of sewage sludge and petroleum coke was evaluated through equilibrium and high-fidelity modeling. Sewage sludge blend ratios of 10, 25, and 50% with petroleum coke were evaluated. The equilibrium model is based on elemental mass and energy conservation. The effect of fuel blend, gasification temperature, and equivalence ratio on the gasification efficiency was evaluated. The numerical model consists of the gasification reaction kinetics and the impact of the reactor dimension. In addition, economic analysis is carried out to assess the conditions when such a process can be deemed to be profitable.
2. Materials and methods
2.1. Analytical and experimental analysis
Two sets of samples for petroleum coke and sewage sludge were subjected to thermogravimetric analysis (TGA) and elemental analysis as well as bomb calorimetry. The petroleum coke is distilled from crude oil in our Thermofluidic laboratory at KU, which is obtained locally [source: Abu Dhabi National Oil Company, Abu Dhabi (ADNOC)] using the ASTM D86 distillation apparatus. The distillation started from 50 ml of crude until reaching a solid residual of nearly 10% of the initial 50 ml of volume. The local crude oil is characterized as light crude, which has a high concentration of naphtha upper distillates and a low concentration of residuals. As a by-product of wastewater treatment, sewage sludge is composed of both organic and inorganic components. Different mixtures of petroleum coke and sewage sludge, such as 10% of the sludge and 90% of petroleum coke, 25% of the sludge and 75% of petroleum coke, and 50% of the sludge and 50% of petroleum coke, were subjected to proximate analysis using TGA. TA Thermo-scientific STDQ600 TGA analytical instrument was used to conduct the TGA with several crucibles that each weighed around 30 g. Similar to Shabbar et al. (2011), the TGA studies were carried out at room temperature with air flowing at a 100 ml/min flow rate. The moisture and volatile fraction could be obtained with nitrogen. However, the air was utilized to determine the fixed carbon content as well as the left-over ash after the consumption of the fixed carbon under combustion conditions. A similar proximate analysis approach with air can be observed in the studies by Folgueras et al. (2003), Garcia-Ibanez et al. (2006), and Donahue and Rais (2009). Using calcium oxalate monohydrate, the TGA machine was calibrated for temperature measurement. The sample crucibles were preheated to 750°C at a constant rate of 15°C/min after being equilibrated at 30°C for 2 min. The samples were allowed to remain in isothermal conditions after reaching 750°C for 5 min before being air-cooled to ambient temperatures.
The method created by Channiwala and Parikh (2002) as shown in Equation (1) can be used to estimate the enthalpy of formation based on the mass fraction of organic elements in the absence of these data utilizing the elemental values obtained from the FLASH analysis and empirical correlations.
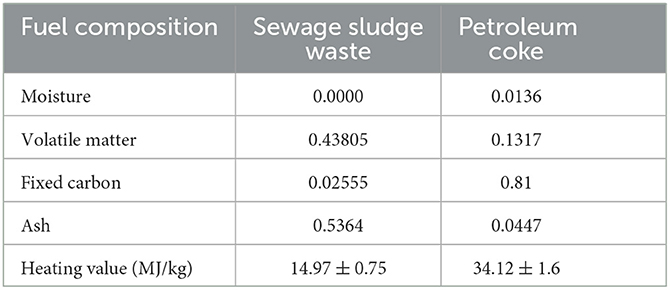
where YC, YH, and YO are the percentile mass fraction of C, H, and O elements, respectively. The study includes using a TGA, ASTM D240, and a Parr1000 bomb calorimeter to examine the samples' elemental composition and high heating value. In order to establish the consistency of the data, the experiments were at least repeated in triplicates. The findings revealed repeatability within standard errors of ±1°C for TGA, ~1.0% deviation for elemental measurements, and ~1.5% errors for viscosity and specific gravity. Based on the observed composition, the molecular formula was established, and Table 1 summarizes the obtained experimental data. The elemental analysis data was obtained for petroleum coke from Gong et al. (2010) and sewage sludge from Deviatkin et al. (2019) as shown in Table 2.

Table 2. Properties of petroleum coke and sewage sludge measured by flash, viscosity, hydrometers, and bomb.
2.2. Equilibrium modeling
The process of co-gasifying petroleum coke and sewage sludge is different from solid coal gasification because of the change in composition. Evidently, petroleum coke and sludge lack moisture on a dry basis when compared to bituminous coal. The petroleum coke also has lower volatile contents (from nil to 13%) than the sludge (43.8%), but at larger fixed carbon (81%) content compared with the sludge (2.55%). Petroleum coke typically contains a small fraction of ash (0.44%), which is much lower than the sludge that holds more than 50% of its weight. Complete oxidation of either petroleum coke or waste sludge based on the inferred molecular formal in Equations (2) and (3) required 1.1384 and 1.3665 moles of O2, respectively, that is, based on burning 1 mole of petroleum coke and sludge. Equation (4) describes a variety of potential gasification species using Gibbs energy minimization. Despite the complexity of the gasification process inside the reactor comprising high temperatures, tiny particle sizes (tens of microns), and long enough residence time a quasi-steady equilibrium behavior most likely is eminent. The quasi-steady equilibrium is more restricted to occurring in the entrained flow gasifier due to their operating conditions. At equilibrium conditions, the gasification can be more represented by the main species following the stoichiometric of Equation (5) under the main and limited number of species such as CO, CO2, H2, H2O, CH4, SO2, and N2.
where CHxNySpOz is the feedstock, m O2 is the oxidizer, nH2O is the moderator, x1CO + x2H2 is the syngas, x3CH4 is a hydrocarbon, and are the combustion products.
Stoichiometric equilibrium analysis can be used to break down the setup of the gasification system problem, specifically Equation (5), into a subset of several equilibrium reactions, which are represented in Table 3 and include Equations (5.a) through (5.e). An energy balance Equation (5) and three elemental balance equations for C, H, and O define the gasification system configuration. The reaction temperature, moles of the moderator and oxidizer [m and n in Equation (4)], and the mole numbers of seven species—CO, H2, CH4, H2O, CO2, C(s), and O2–are among the system's nine unknowns. When equilibrium equations for NH3 generation, sulfur combustion/SOx, and NOx formation are involved, additional unknowns might be added. Due to enthalpy and specific heat temperature () dependence, a non-linear system of equations is generated with a solution sought iteratively. It should be noted that by relaxing the less frequent participating species, such as SOx and NOx, and assuming the depletion of O2 and chars/C(s), two equilibrium equation systems are possible. Using this approach renders a less complicated equation system and reduces the number of unknowns.
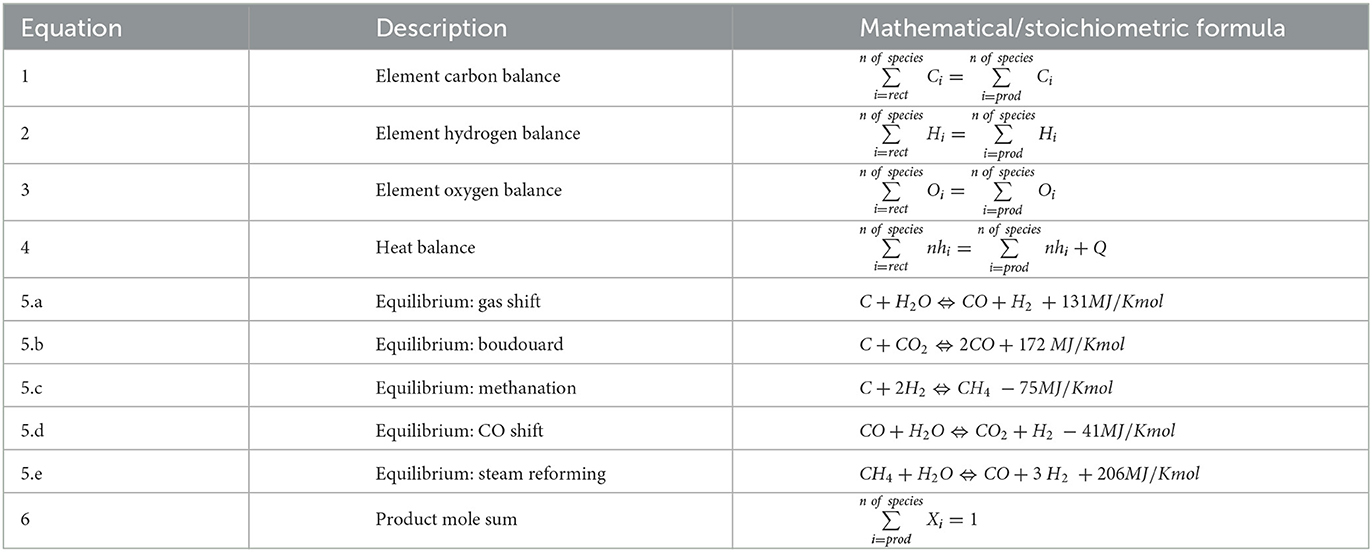
Table 3. The governing system of equations and their descriptions to evaluate the main gasification species with enthalpy of formation values at STP.
The gasification efficiency can be determined as a ratio of the heating value of the product syngas (which H2 and CO, and potentially CH4) to that of feedstock. This calculation can be expressed using Equation (5) as follows:
where N is the total number of product moles and xH2, xCO, and xCH4 are the mole fractions of the syngas species H2, CO, and CH4, and the adjacent values, 283.8, 283.24, and 889 are their molar heating values in kJ/mol, respectively.
2.3. High-fidelity modeling
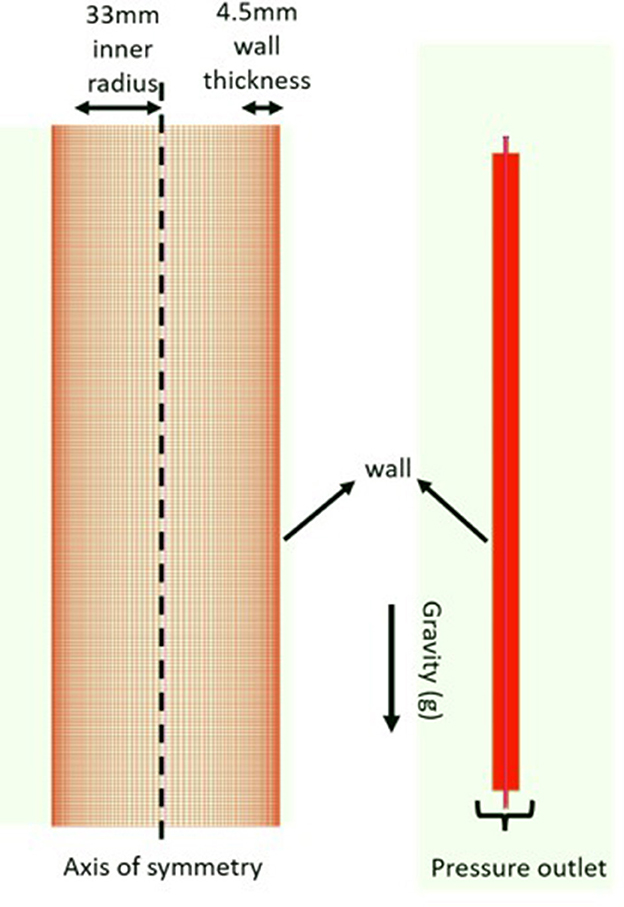
The current high-fidelity reactive flow gasification model moves away from assuming a homogenized plug flow mechanism and instead utilizes a practical 3D tubular reactor. This reactor considers spatial and intrinsic/temporal variations of the reactive flow along the gasifier, following the most pronounced set of reactions and their kinetics. As a result, it provides a more realistic gasification efficiency than the equilibrium-based model, accounting for heat losses to the surroundings, turbulence kinetics, and flow dynamics that reflect the actual behavior of the species rather than ideal mixing. The reactor geometry, shown in Figure 1, consists of two concentric centers of the reactor tube that move the feedstock in the form of particles at high pressure, causing particle inert heating, devolatilization, and thermal degradation. This chosen baseline geometry is identical to the drop tube reactor detailed in the study by Hampp and Janajreh (2011). The reactor is 1.5 m long, with a 6.6 cm radius and a 4.5 mm thick resilient and insulated stainless steel wall. Heating of the reactor occurs at the tube wall through nichrome wires with insulated ceramic housing of the metal stainless steel tube. The domain is discretized using finite volume quadrilateral cells following multi-blocking that facilitates meshing, comprising 120,500 cells representing the interior fluid and solid wall, as depicted in Figure 1.
A high-fidelity method that incorporates the conservative laws of mass, momentum, energy, and species transport in a chemically reacting two-phase (liquid and gas) environment is utilized to precisely represent the gasification phenomena. This is accomplished by injecting the solid particle into the continuous gas-filled domain, which is governed by the turbulent Navier–Stokes flow regime, utilizing a coupled Eulerian continuous and discrete Lagrangian flow formulation. The particles are exposed to a two-way mass and heat transfer coupling with the surrounding gases via reactive species transport, and the commonly used SST k-model is utilized to represent the turbulence. Devolatilization, which is the first step in the gasification process, is controlled by the Kobayashi two-competing rate model. Radiation is modeled using the P1 model, with its dispersion dictated by the cloud tracking model, while droplet dispersion is modeled using the stochastic discrete random walk model. The conservation of mass is represented by Equation (6), while the conservation of momentum in the axial and radial directions is governed by Equations (7) and (8), respectively.
The governing energy equation is written in the form of the total internal energy according to Equation (9), which is thermodynamically dependent on the enthalpy and is written as follows:
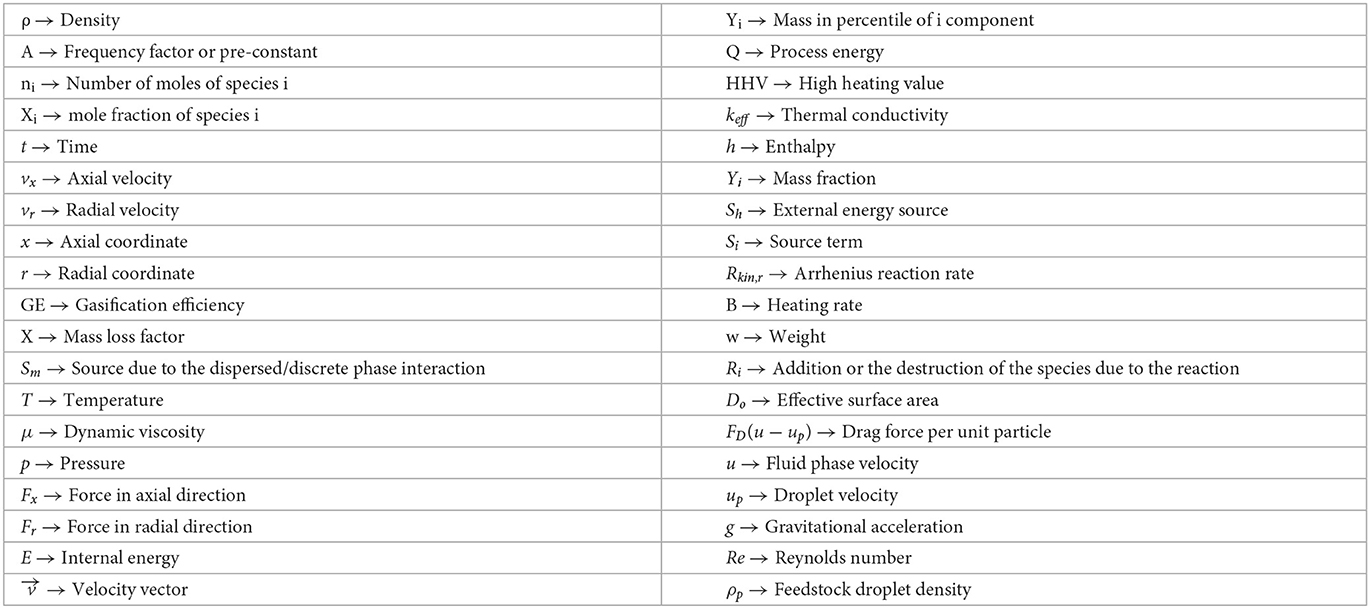
where ρ is the density and Sm is the source term due to the discrete phase interaction. The ρui is the density velocity multiple, T is the temperature, p is the pressure, μ is the fluid viscosity, and Fx is the present body forces in the form of gravitational force. E is the internal energy (), h is the enthalpy (), keff is the effective conductivity, and Yi is the mass fraction. The Sh is any unaccounted source of external energy. These equations constitute a multiple species system, and accordingly, the conservation of species comes into effect to close the system, which is represented in Equation (10) as follows:
where Ri is the addition/destruction of the species due to the reaction following Arrhenius reaction, which can be described in Equations (11) and (12):
where Do is the effective droplet surface area, which is a function of the localized temperature and droplet diameter following Equation (13) as follows:
The fuel blend droplet is governed by the Lagrangian equation and is written based on Equation (14) as follows:
where and Re is the droplet Reynolds number described as . The FD (u − up) in Equation (14) is the drag force per unit droplet mass; u is the fluid phase velocity; up is the droplet velocity; ρ is the gas phase density while ρp is the droplet density. The numerical model of the gasification processes in an entrained flow gasifier was done with ANSYS Fluent. The model implements the Eulerian scheme for the resolution of the conservation of mass, species, momentum, and energy in the gas phase while using the Lagrange scheme to obtain the fuel blend droplet position, velocity, and temperature. A mesh sensitivity study has been performed by Adeyemi et al. (2017) to assess mesh discretization independence, allowing for the tradeoff between refined meshes and computational time. A steady-state solution for the flow is sought without recirculation. The devolatilization kinetics of the fuel mixture was inferred from the TGA mass-conversion curve as described in the kinetic modeling section.
2.4. Kinetics modeling
The kinetics of thermal degradation of the different kinds of feedstock is important, not only in obtaining the thermography behavior under different heating rates but also in simplifying its complex degradation process that involves a large number of reactions. These involve random chain scission, dehydration, and cleaving. As gasification takes place beyond 1,000°C, the preceded lower temperature pyrolysis events are important in representing the basic short-chained species and enabling an accurate choice of their corresponding equilibrium stoichiometric representation/equations. Inspecting the TGA of the two petroleum coke and waste sludge highlights the absence of the devolatilization events in the petroleum coke while it only appears in the waste sludge and their mixtures. It is the goal of this study to capture and quantify the devolatilization kinetics of the mixtures. Specifically, TGA and DSC techniques are used extensively to evaluate reaction kinetics, including devolatilization, pyrolysis, and combustion. The techniques offer the advantage of using a small sample size; reproducible results of a few samples; and can be done over a long process temperature range (Aboulkas et al., 2007; Chanda and Roy, 2007). The thermal degradation is typically represented by the two main devolatilization reactions based on the successive and independent reaction of Equation (15). The equation is constrained by the conservation of elemental mass and energy balance.
where C1 and C2 are the hydrocarbon traces; and α1 through α6 are coefficients of the stoichiometry. Using the TGA/DTG experimental data, the overall devolatilization reaction can be modeled following Equation (16). The mass loss fraction is described in ratio form as follows: X = (wO − w)/( wO − wf) and is written in derivative form as follows:
where dt/dT = β is the heating rate, wo is the initial weight of the sample, wf is its weight at the end, A is the pre-exponential factor that measures the frequency of molecules collisions, t is the time, E is the activation energy (kJ/mole), R is the universal gas constant, T is the temperature, n is the reaction order, and β is the heating rate. Different approaches based on integral and differential methods were used to determine E and A values. These include the Arrhenius, Coats-Redfern, Ingraham-Marrier, and Horowits Metzger methods (Almazrouei and Janajreh, 2019). The influence of β on the onset of pyrolysis temperature and in shifting the decomposition to a higher temperature was highlighted by the same authors. When the heating rate increases, the sensitivity of the undergoing reaction decreases and shifts up to a lower mass loss amount during the event, thereby causing an increase in the activation energy (Chen et al., 2015).
Each of the pyrolysis events/mass loss and endothermic reaction of feedstock can be described by first-order reaction. These events result in breaking the long viscous oil chain into smaller monomers that are successively partially combusted and gasified as the stipulated oxidizer amount is provided. The results of the integration of Equation (16) from initial concentrations Xo to the final Xf and from initial temperatures To to the final Tf give the integral function of conversion (Shabbar et al., 2011) as follows:
The Arrhenius method is fairly simple and from the slope of the linear fit of log [dw/dT/w] and 1/T plot, the activation energy (E) and rate constant A can be inferred according to Equation (18) as follows:
On the other hand, the Coats and Redfern integral form implements a presumed reaction for F(x) with first order (F(x) = 1–x), second order (F(x) = (1–x) 2), power (F(x)=2x1/2), as well as diffusion (F(x)=0.5x or F(x) = −1/ln (1—x)) as shown in the study by Kök and Pamir (1998) and Mamleev et al. (2004). The activation energy (E) is inferred from the semi-log plots of the heating rate and the temperature ratio taking place at the highest conversion. The E is determined from the slope of ln (g(x)/T2) vs. 1/T plot as described in Equation (19).
Besides devolatilization, other reactions occur concurrently including the heterogeneous soot or the traces of char reactions and the total/partial gaseous combustion of CO and H2. The kinetic data for these reactions, CO and H2 combustion, are reported elsewhere. Table 4 summarizes the studied kinetic data of Watanabe and Otaka (2006).

Table 4. Kinetic data for the homogeneous and heterogeneous gasification reactions reported by Watanabe and Otaka (2006).
3. Results and discussion
3.1. Gasification phenomena
Petroleum coke and sludge mixture go through a different gasification process than other feedstock as they contain low moisture content and possess different compositions. When petroleum coke is injected into a hot gasifier environment, it undergoes pyrolysis and devolatilization, which is the first step in the process. Due to the absence of ash or fixed carbon, pyrolysis occurs more quickly, and radical components are created that are destroyed during combustion. To keep the reaction going and maintain the high gasifier temperature needed, oxygen is used during the process. Figure 2 illustrates the results of the gasification species of the sludge mixed with petroleum coke based on three distinct equilibrium reactions. When 50% of the sludge blends with another 50% of pet coke are heated to 1,200°C, the best conversion occurs, and the mole fraction of the syngas species is found as XH2 = 0.4227, XCO = 0.5774, and a small fraction of XCH4 = 0.0123. According to Figure 2C, the cold gasification efficiency (CGE) measures 87.02% for the H2 and CO syngas species and reached 91.11% for the three species, including CH4. It is crucial to take note of the O2 oxidizer's rising trend and the H2O moderator's declining trend in relation to the rising gasifier temperature. The amount of moles of O2 and H2O per mole of 50% of sludge blended with petroleum coke are 1.59 and 1, respectively, at the highest CGE efficiency. The amount of oxidizer and moderator required for gasification varies on the reactor temperature, with higher temperatures requiring more O2 and less H2O. However, compared to the 50% of the blend, the 10 and 25% of sludge blends need frequently more of these components, which lead to a decrease in efficiency and additional sensible heat penalty. Based on the two syngas components, the highest gasification efficiency for the 10 and 25% of sludge mixed with 90 and 75% of petroleum coke is attained at temperatures of approximately 1,150 and 1,200°C, respectively. This efficiency is ~9.5% lower than the 50% of sludge blend with petroleum coke, which generates syngas with a lower composition of XH2 at about 0.379 and XCO at about 0.577. This implies that the 50% of sludge blend has the potential for higher conversion metrics than the conventional 10 and 25% of sludge blends.
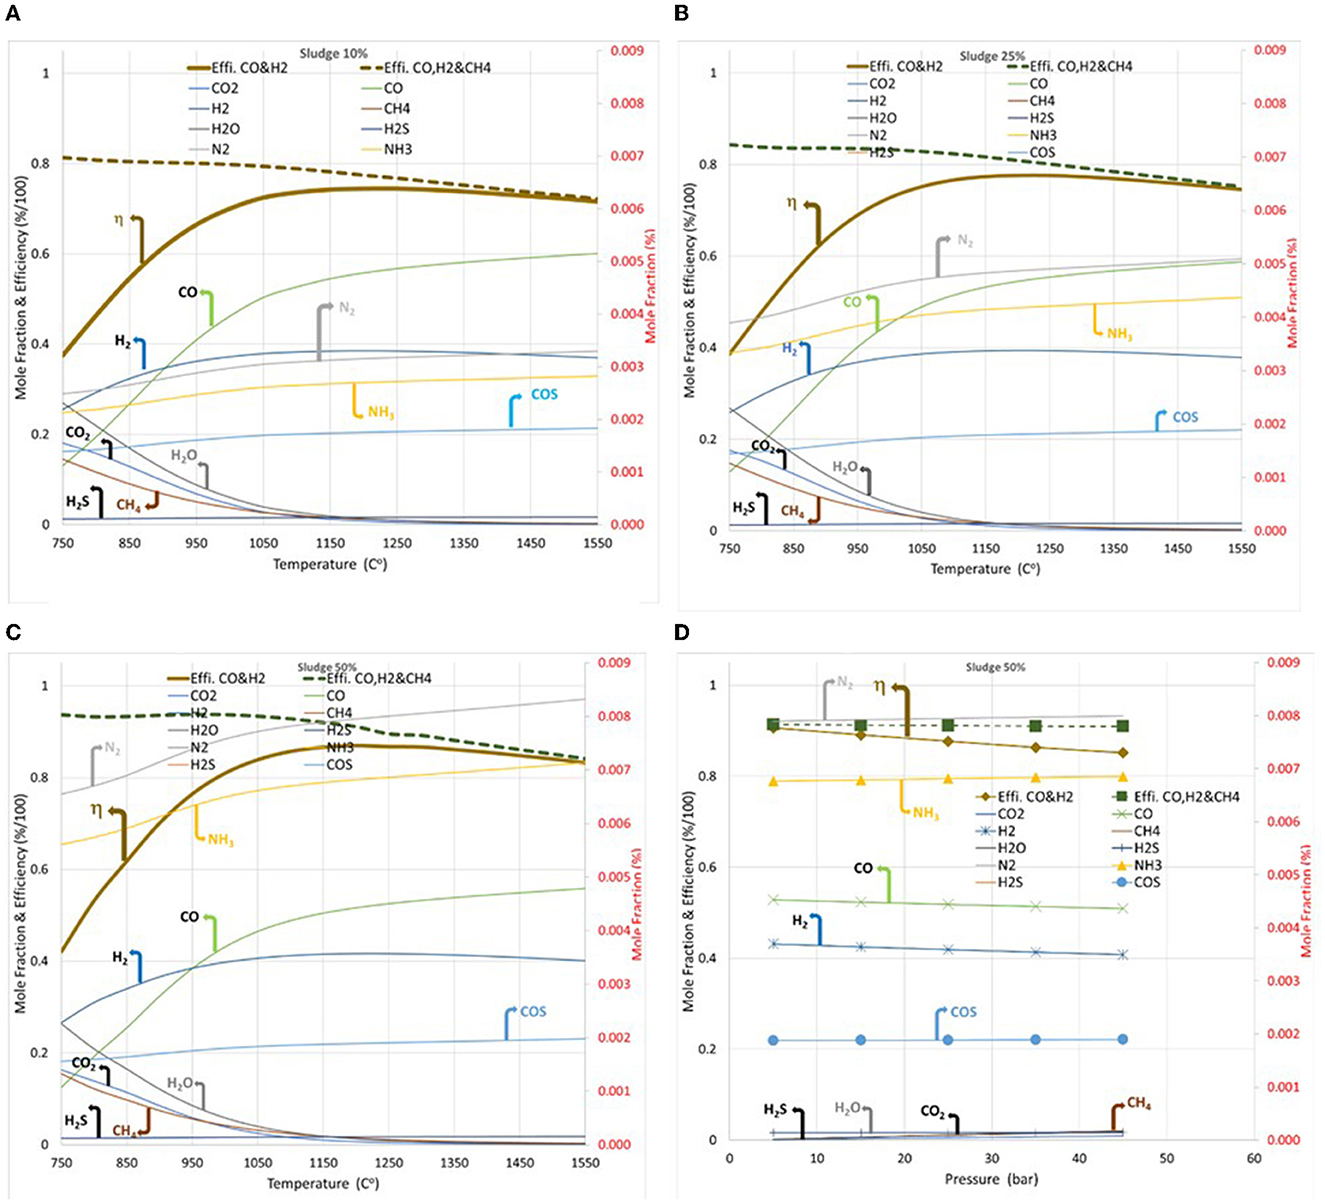
Figure 2. The equilibrium gasification molar fraction and gasification efficiency vs. output temperature of the petroleum coke and sludge using only two independent reactions: (A) sludge 10%; (B) sludge 25%; and (C) sludge 50%. (D) The effect of pressure variation on the 50% sludge at 1,200°C.
It has been observed that the maximum efficiency was achieved with 50% of the sludge at a temperature of 1,200°C. Figure 2D shows the effect of pressure variation on the sample at the highest observed efficiency percentage. By utilizing equilibrium analysis, the pressure was varied from 5 to 45 bar. At 5 bar, the efficiency based on CO and H2 was found to be 90.6%. However, as the pressure increased from 5 to 45 bar, the efficiency decreased to 85.5%. This demonstrates that pressure has an impact on the efficiency and concentration of H2 and CO, which is in line with Le Chatelier's principle as far as the stated reaction in Table 4 (H2, H3, H5, and H6 and H7) where the reversal of syngas producing reactions gives off lower moles, with the exception of the water gas shift (H4), which is pressure-insensitive reaction. The product gases obtained are determined by the complex interactions from multiple reactions (H1–H7). The char gasification reactions (H5–H7) involve the heterogeneous interaction between solid carbon and O2, CO2, and H2O. Thus, higher pressure would tend to produce less CO and H2, which would result in lower efficiency (Gungor et al., 2012; Faraji and Saidi, 2022). Furthermore, the CGE depends significantly on the gasification temperature. Increasing the reactor temperature tends to favor the production of more CO and H2 and less CO2 and H2O. This can be associated with the utilization of the heat from higher temperatures in the endothermic char reactions. For instance, the Boudouard reaction would favorably proceed with the consumption of CO2 by the solid carbon to form CO. Likewise, the other char gasification reactions would be enhanced at elevated temperatures. This is consistent with several reports on the gasification behavior of different feedstock at varying temperatures (Lu et al., 2012; Acelas et al., 2014; Wu et al., 2017; Song et al., 2021; Chen et al., 2022). However, the impact of temperature diminishes after attaining a certain threshold. Hence, peak CGE was achieved at 1,150, 1,200, and 1,200°C for sludge compositions of 10, 25, and 50%, respectively.
Generally, ammonia production increased with rising temperatures. This is reasonable because more H2 and N2 are produced at elevated temperatures. Thus, the inclusion of more reactants drives the forward reaction, which generates NH3. However, the quantity of ammonia produced is small and does not have a significant effect on H2 usage and CGE. For instance, a mole fraction of 7.2 × 10⁻³ was formed at 1,550°C with a sewage sludge composition of 50%. The production of ammonia is favored by higher temperature, pressure, and sludge content. The mole fractions of ammonia at 10, 25, and 50% of sewage sludge are 2.8 × 10⁻³, 4.4 × 10⁻³, and 7.2 × 10⁻³, respectively. Sewage sludge contains more nitrogen and hydrogen contents than petroleum coke, which could drive the production of ammonia.
3.2. Kinetics of devolatilization
Thermogravimetric analysis (TGA) findings for samples of petroleum coke and sludge at a heating rate of 15°C/min are shown earlier in Figure 3. Higher heating rate shifts the thermograph slightly to the left indicating a rise of the degradation temperature, yet resulting in compounds that are pyrolytically similar. This is because an equivalent sample would not be sufficiently devolatilized by a shorter residence period at a similar temperature. Inspecting the TGA for the sludge and petroleum coke shows the earlier appearance of the devolatilization event in the former, which stretches from 200°C to near 400°C, while its disappearance in the latter. This emphasizes the near zero volatility of petroleum coke and the advantages of synergetic gasification with volatile contained feedstock like sludge. The reaction of a single species of solid char as in the case of petroleum coke is extremely slow and possesses limiting reaction kinetics that doubt the gasification. The volatilization kinetics results for the single sludge feedstock are shown in Figure 4 where the four different kinetics are evaluated, namely, the Arrhenius, Coat–Redfern first, second, and third order.
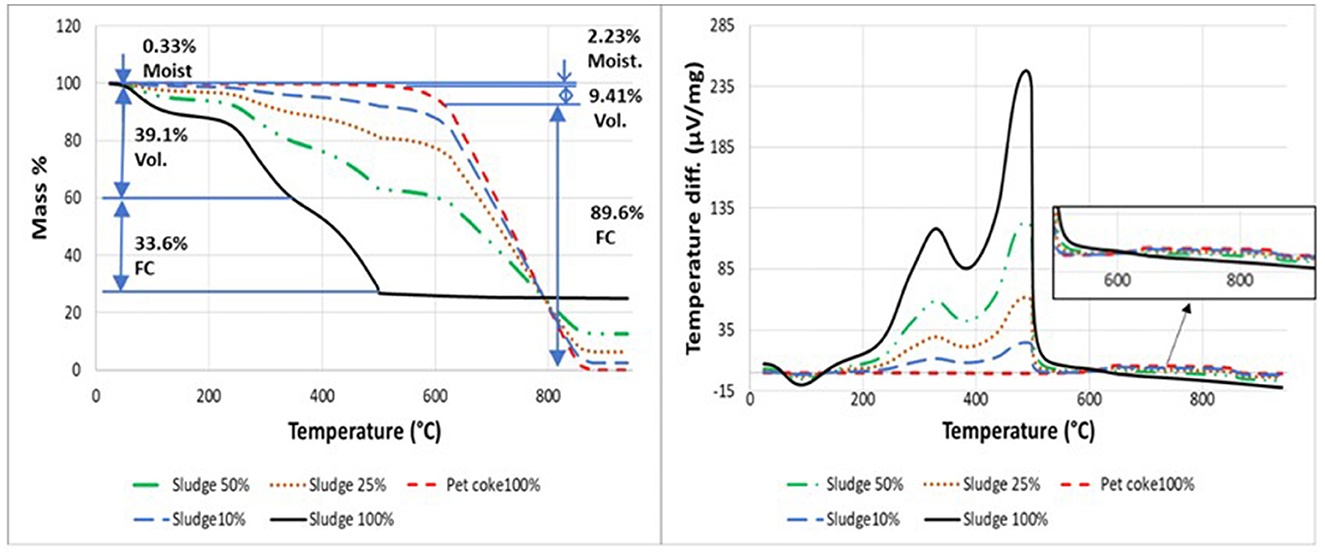
Figure 3. Thermographs of the weight and temperature difference evolution of the petroleum coke, sludge, and their mixtures.
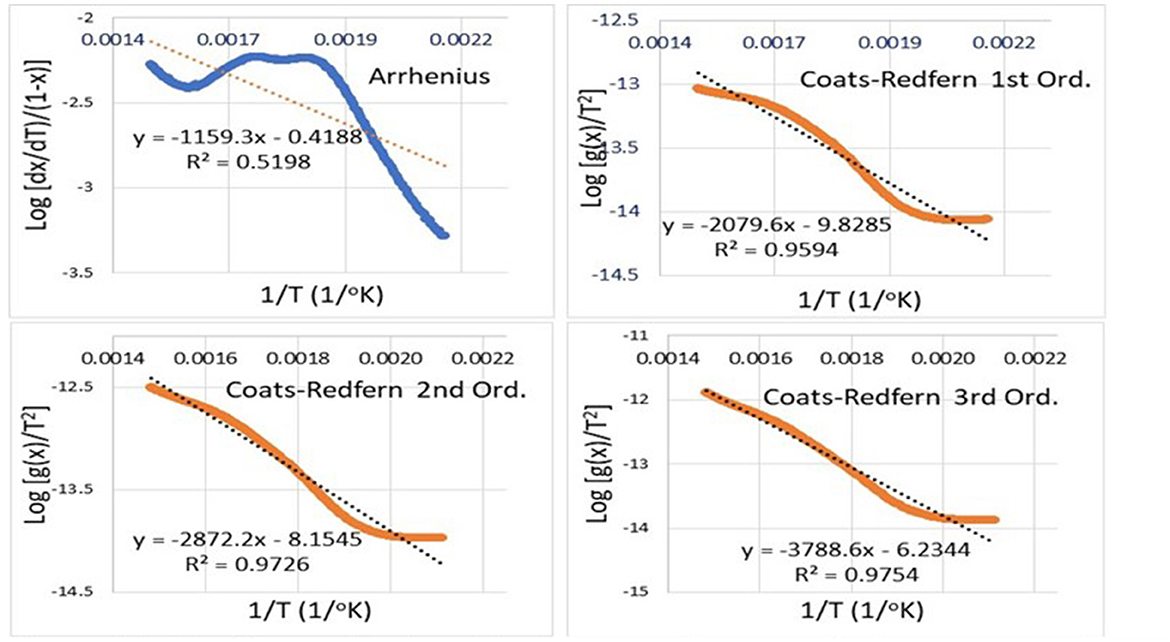
Figure 4. Evaluated sludge devolatilization kinetics according to Arrhenius, Coat–Redfern first-, second-, and third-order models.
The measured TGA data are processed to generate each of the model kinetic trend for the four considered models. The processed kinetic data then are approximated with a linear trendline to evaluate both the slope and intercept and to infer their pair kinetics, i.e., activation energy and pre-constant as depicted in Table 5. A large discrepancy between Arrhenius and model data is very specious in Figure 4; this is also clearly captured by the low R2 = 0.52 compared with those obtained by Coat–Redfern (CR) R of >0.95. Figure 4 also shows the well-behaved trend of the CR model with increasing its order. A high value of Es but lower values of A suggest slower reaction kinetics. Focusing on the third-order CR model, suggesting an activation energy of 40.08, 10.70, and 26.29 KJ/mole, and pre-constant (or frequency factor) of 4.17E-13, 2.13E-19, and 3.10E-16 1/s for the 50, 25, and 10% of sludge–petroleum coke mixtures, respectively. This suggests that based on activation energy 25% of sludge–petroleum coke mixture is a better feedstock recipe than higher (50%) or lower (10%) ratios. The frequency factor, however, more naturally behaves as higher sludge contents (50%) resulted in higher devolatilization activities. Thus, overall, the kinetics is in favor of the mixing yet the synergetic activity of the mixture may put upper ratio limits on the mixtures. It is noteworthy to add that the devolatilization of the sludge is rather non-uniform, indicating that the larger component of the sludge mixture's non-uniform composition, which contained components, such as asphaltene, xylene, and toluene, was not evenly distributed. This non-uniformity was particularly noticeable in the observed thermograph trends and also in multiple but smaller heat release peaks.
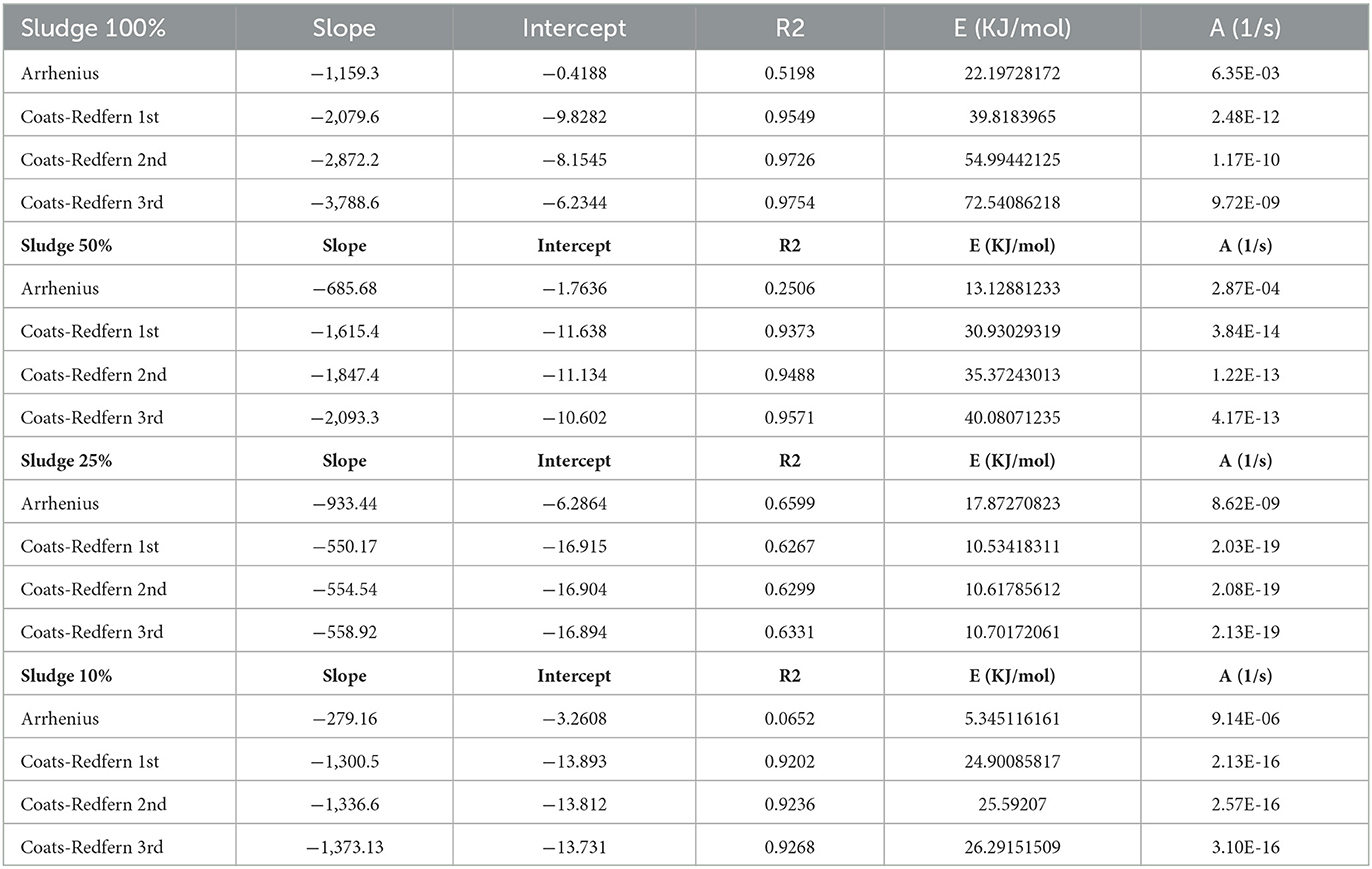
Table 5. Evaluated kinetic data for the devolatilization reaction for the sludge and its petroleum coke mixtures.
3.3. High-fidelity reactive flow
The co-gasification of sewage sludge and petroleum coke in a drop tube reactor was examined using a computational fluid dynamics (CFD) model. Specifically, 10, 25, and 50% of petroleum coke were included with sewage sludge in the feedstock mixture. A fixed wall temperature near the 1,250°C level of maximum efficiency was imposed by the model. At the reactor intake, the oxidizer and moderator were added to allow for gasification equivalence ratios. The mixture of sewage sludge and petroleum coke was introduced as injections at the inlet using the discrete phase model (DPM). The study found that the fuel blend undergoes heat exchange with the continuous phase and the tube wall when it is introduced into the drop tube reactor as droplets with a temperature lower than the tube environment. The droplets release mass to the continuous phase when they approach the devolatilization temperature, starting homogenous processes that change the amount and composition of the syngas generated. The endothermic reactions of devolatilization and water gas shift reactions were driven by the high wall temperature of the drop tube reactor. Figures 5–7 of the study depict the distribution of species molar fraction and static temperature as solid contours. The early conversion was limited because of a lower temperature near the tube's entry caused by heating the cold feedstock for devolatilization. However, the ideal temperature for homogeneous reactions, essential for complete conversion, was reached as the volatile substance got close to filling up one-third of the tube. The temperature increased as the volatile substances progressed down into the middle region as a result of subsequent exothermic reactions. This temperature pattern conforms to findings from earlier studies (Ong et al., 2015). Thereafter, the temperature stayed at its highest point. Based on the results, it could be observed that the drop tube reactor's high wall temperature facilitated the devolatilization and water gas shift reactions. The optimal temperature for homogenous reactions was attained halfway through the tube, and the temperature distribution was critical in enabling the processes. The findings from this study offer insightful understandings of the behavior of these reactions and can be used to improve the design of reactors with a similar function. Figure 5 shows the contour plots of the mole fractions of CO for petroleum coke combined with sewage sludge percentages of 10, 25, and 50%, respectively. The contour showed that the CO fraction for a 10% (by mass) blend of sewage sludge in petroleum coke was the highest of the three mixtures assessed. Near the center of the tube, where the mixture of petroleum coke and 10, 25, and 50% of sewage sludge is almost completely converted, approximately 0.789, 0.6, and 0.51 moles of CO were reached, respectively. The fluctuations at positions close to the injector can be attributed to the significant transient nature of the flow in the region. Similar observations have been mentioned for other kinds of feedstock (Zhang et al., 2023).
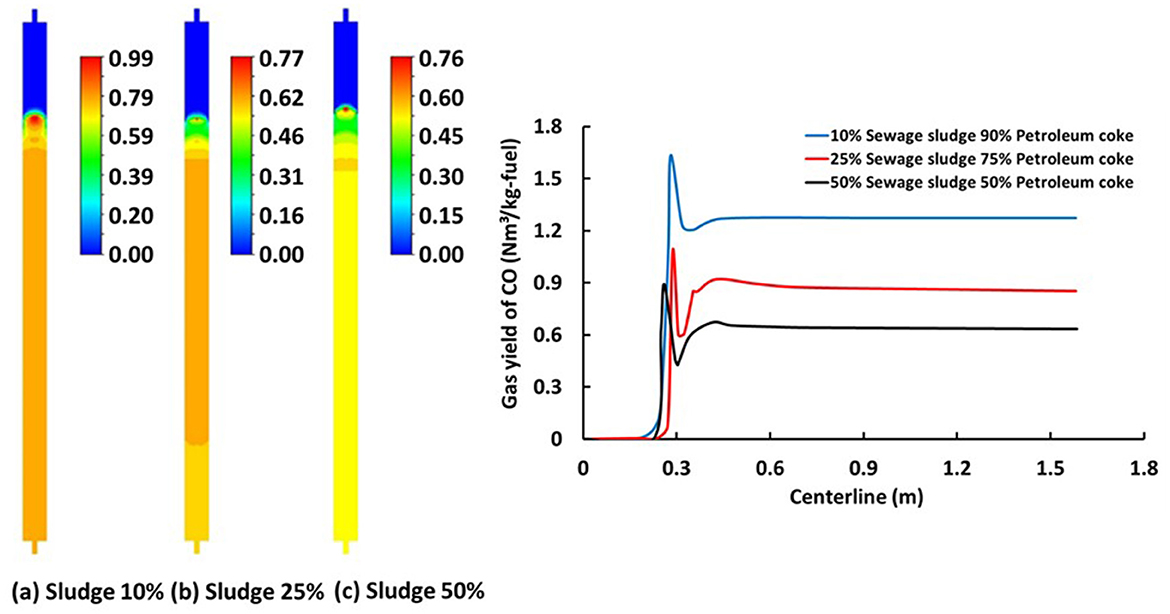
Figure 5. (Left) Contour plots inside the drop tube gasifier for the mole fraction of CO for the gasification of the sewage sludge 10, 25, and 50% blended with petroleum coke. (Right) Centerline values of the gas yield of CO for the three fuel blends.
With an increase in the mass proportion of sewage sludge, the CO concentration falls. This is consistent with the empirical observation of the proximate and ultimate analysis. Sewage sludge is known to contain significantly lower carbon content in comparison with petroleum coke. For instance, the petroleum coke utilized contains 87.42% of carbon, while the sewage sludge is composed of 55.17% of carbon. Hence, increased sewage sludge in the fuel blend would tend to produce less carbon dioxide. Moreover, sewage sludge has a significant amount of ash (53.64%) as compared to petroleum coke (4.47% of ash). This further inhibits the production of carbon monoxide. Similar observations have been reported in experimental studies on co-gasification with sewage sludge (Zhang et al., 2023). In one study, Czerski et al. (2023) conducted the co-gasification of waste tire char blended with sewage sludge in thermo-volumetric equipment. The mixture containing 10% of sludge produced carbon monoxide of 5.7, 14.6, and 17.2% as compared to the blend with 33% of sludge with 0.8, 5.7, and 14.7% at 800, 850, and 900°C, respectively. The sewage sludge feedstock contained 11.1 and 62.7% of carbon and ash, respectively. In contrast, the tire char had 74.6 and 21.3% of carbon and ash, respectively. In another study, Alves et al. (2019) gasified a mixture of waste wood and sewage sludge in a downdraft gasifier. They noted that as the sewage sludge was increased from 12.5 to 25%, there was a reduction in the production of carbon monoxide. In addition, the cold gasification efficiency dropped from 86.1 to 83.3% with the different sludge compositions. Figure 6 shows the contour of the mole fraction of CO2. The contour shows the higher concentration of CO2 for 50% of the sewage sludge blended with petroleum coke. The mole fraction of CO2 at the middle of the tube is 0.1, 0.28, and 0.21 for the 10, 25, and 50% of the sewage sludge blended with petroleum coke. Figure 7 shows the contour of the mole fraction of H2. Similar to the trend for CO2, the contour shows a higher concentration of H2 for 50% of the sewage sludge blended with petroleum coke. The mole fraction of H2 at the gasifier centerline is 0.06, 0.13, and 0.125 for the mixture containing 10, 25, and 50% of the sewage sludge blended with petroleum coke. The increment in the hydrogen fraction with the inclusion of more sewage sludge in the feedstock could be attributed to the higher composition of hydrogen in the sludge. While sewage sludge contains 8.86% of hydrogen, petroleum coke is composed of 3.35% of hydrogen. However, there was no significant increase in H2 when the sewage sludge increased beyond 25%.
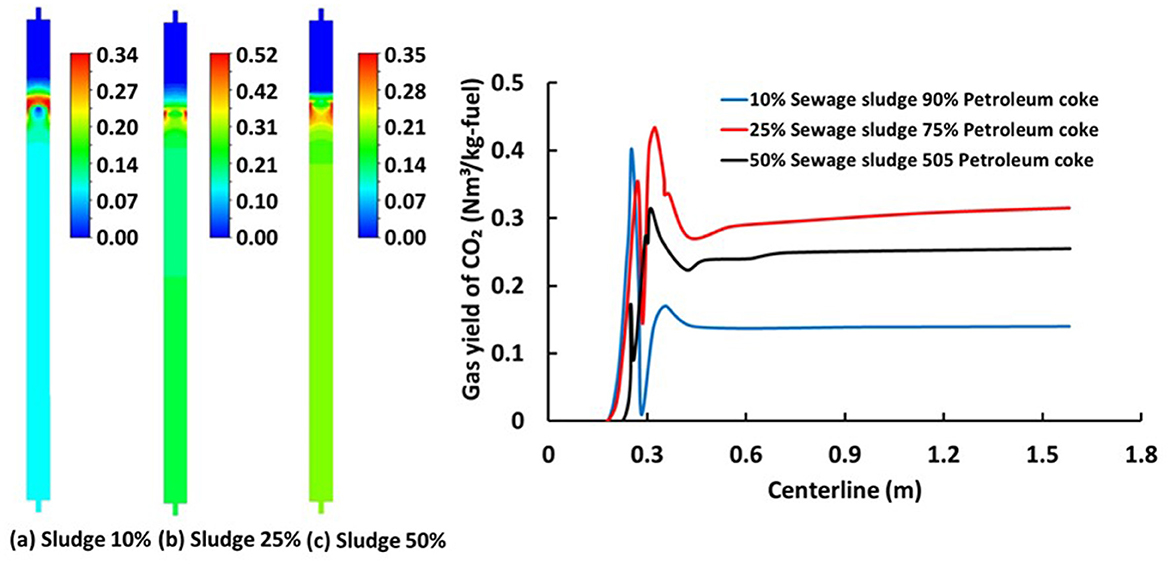
Figure 6. (Left) Contour plots inside the drop tube gasifier for the mole fraction of CO2 for the gasification of the sewage sludge 10, 25, and 50% blended with petroleum coke. (Right) Centerline values of the gas yield of CO2 for the three fuel blends.
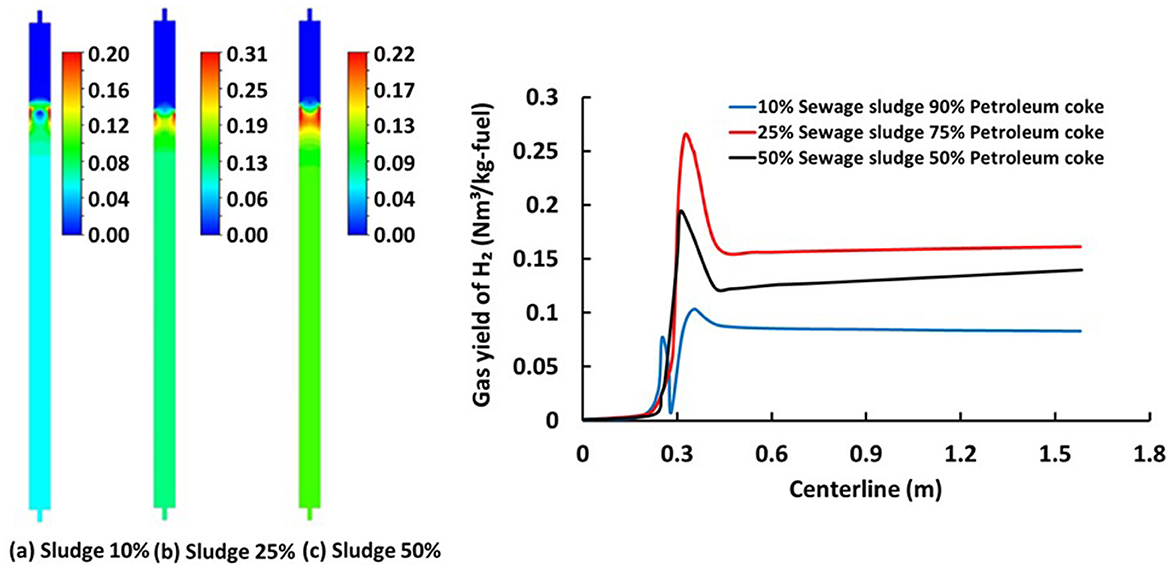
Figure 7. (Left) Contour plots inside the drop tube gasifier for the mole fraction of H2 for the gasification of the sewage sludge 10, 25, and 50 blended with petroleum coke. (Right) Centerline values of the gas yield of H2 for the three fuel blends.
A high H2O proportion in the combustion species, especially in the range of 0.3, denotes low activity in the water gas shift process. This is due to the fact that there is barely any CO2 present. Due to the gas shift reaction's initial preference for lower temperatures, this occurs frequently. Figure 7 displays a visualization of the spatial distribution of the species along the central axis, which amply demonstrates that the gasification reaction is not instantaneous as suggested by lower fidelity models, but rather takes a certain length of residence time. Asymptotic and steady species formation was seen around halfway downstream of the drop tube reactor, and the temperature curve shows a growing trend toward the center. Lower syngas output results in reduced performance at lower temperatures (<<1,000°C), and higher temperatures (1,550°C) were unfavorable because more heat was needed to get the gasifier wall up to the desired temperature. The maximum gas yield ratio of CO to CO2 ranges between 7.55 and 9.74. Furthermore, the peak gas yield ratio of H2 to CO2 is between 0.66 and 0.75.
3.4. Economic feasibility assessment
The feasibility of the gasification of a mixture of petroleum coke and sludge was assessed in the production temperature range of 1,073–1,773 K. Generally, the monetary value of the syngas is combined from the price of the CO and H2 in which their prices are set at 0.27 and 2 $/kg, respectively. These two fractions have also different heating values, 10.16MJ/kg for CO and 142MJ/kg for H2. Therefore, syngas price also depends on the syngas proportion. Petroleum coke is traded globally, and it comes in different sizes, calcinated, and sulfur content grades. In general, all these grades are suited for gasification following crushing and possible amine sulfur stripping as well as slurry preparation. The average cost of petroleum coke is nearly $250 per metric ton (0.25 cent/kg). It is stated earlier that the integration of petroleum coke gasification in the refinery is the best solution due to the supply of the feedstock, availability of the needed infrastructure (chiefly air separation unit), direct use of the syngas, and avoiding additional costs such as pressurizing/liquefaction and transport. As for the sludge, it is waste with a negative value that is typically accommodated in the landfill with small gate fees, and thus, the cost of its transport can offset this negative cost and it can be assumed at zero cost. Given these assumptions, cost analysis of 50% of petroleum coke and 50% of sludge gasification is considered because its technical analysis provides the best efficiency. Figure 8 presents the monetary value of the syngas from the combined CO and H2 components based on 1 kg of a mixture of petroleum coke and sewage sludge as feedstock. The price estimates follow the trend of the generation of syngas components with CO almost double the value of the H2. As with the rising gasification temperature, more syngas is produced and consequently, higher monetary.
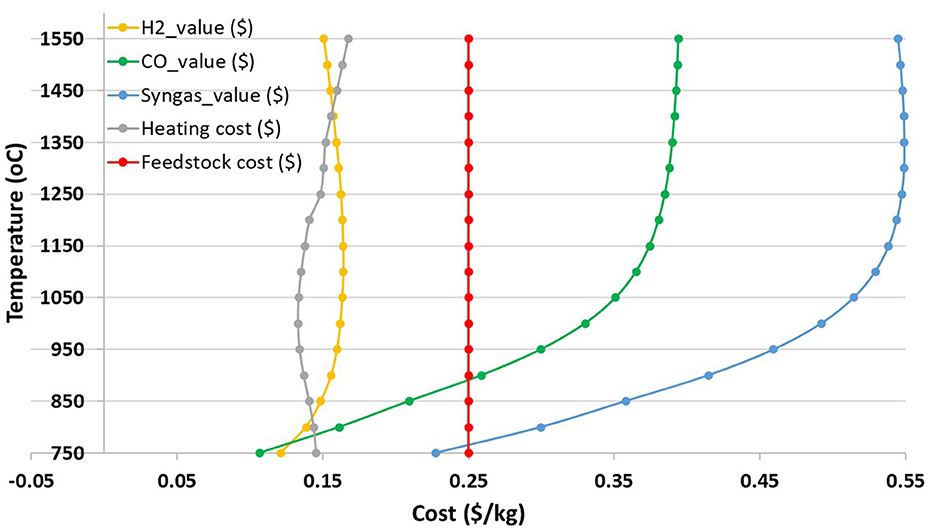
Figure 8. Assessment of the generated syngas price by summing the CO, H2, and heating costs individually and comparing it to the baseline cost of the petroleum coke on the bases of 1 kg of petroleum coke.
In addition, the quantities and price of H2 are nearly fixed, but the value of CO is more compared to H2 as the temperature increases. Based on the cost estimations for the CO and H2, the monetary value of the syngas was determined. As expected, the price of the syngas increases with increasing temperature. It peaks, however, when the gasification temperature reaches 1,350°C with a value of $0.55/kg of the mixture of 50% petroleum coke and 50% sludge and then starts to decrease slowly due to additional sensible heat without a noticeable change in the product syngas fraction. The initial increment in temperature enables the enhanced rates of the endothermic gasification reactions until 1,350°C. Additionally, the amount and cost of syngas produced increased until that temperature (1,350°C) remained nearly constant. This is consistent with the fact that although H2 has a relatively more significant cost compared with CO, the increase in CO mass is significant.
Using the current petroleum coke prices of $250/ton ($0.25/kg) and accounting for the sensible energy in the United States, i.e., $0.11/kWh, one can make these two remarks. First, the positive gain is only produced when gasifying above 950°C as depicted in Figure 9. Second, while higher temperatures than 1,250 still give a positive gain they are less economically favorable for the gasification of petroleum coke/sludge mixture. This can be associated with lower syngas production in the former and higher sensible energy in the latter remark. It is not surprising however when ignoring the cost of petroleum coke to see that it is still economically feasible to gasify the mixture under lower and higher temperature conditions. These results provide insight into the economic optimization of the petroleum coke/sludge mixture gasification process.
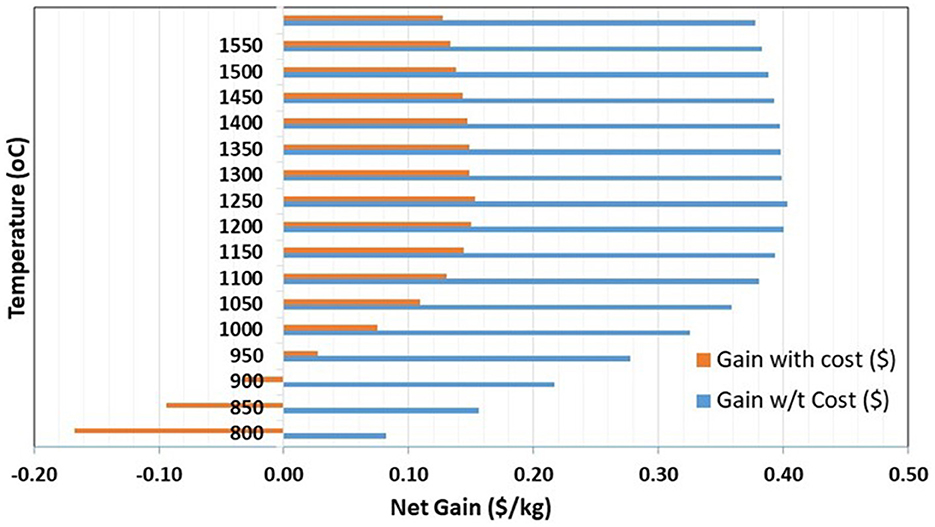
Figure 9. Comparative assessment of the net gain ($) vs. temperature for petroleum coke/sludge mixture by considering the petroleum coke and sensible heating cost using current market petroleum coke cost ($250/ton).
4. Conclusion
Due to the steady generation and disposal of sewage sludge, the annual global production has been estimated to reach about 127.5 million tons in 2030. These wastes are usually landfilled and pose tremendous hazards to the environment and humans. Hence, equilibrium and numerical modeling were utilized to examine the co-gasification of sewage sludge and petroleum coke for waste management and sustainability. The thermodynamic equilibrium provides the maximum cold gasification efficiency (CGE) for various mixtures, with a focus on appropriate feedstock mixing. The composition of syngas under various gasification circumstances is conducted through a parametric investigation of CGE, feedstock conversion, and syngas. The equilibrium model incorporates varying O2 and H2O molar ratios and eight unknowns in the gasification product: H2, CO, CO2, H2O, CH4, O2, Csolid, and temperature. This method includes solid, unburned carbon in the product species and uses an iterative procedure to determine the gasification temperature. Four elemental mass balances, three equilibrium constant relations, and an energy balance are used to build this model. In addition, an economic study is undertaken to determine the process profitability under various scenarios. The equilibrium model based on the two syngas components shows that the maximum efficiency was achieved with 50% of the sludge at a temperature of 1,200°C. The efficiency of the mixtures of 10 and 25% sludge is ~9.5% less efficient than the mixture of 50% sludge and petroleum coke, which generates syngas with a lower composition of XH2 at about 0.379 and XCO at about 0.577 and mole fractions. This implies that the 50% of sludge blend has the potential for higher conversion metrics than the conventional 10 and 25% of sludge blends. The volatilization kinetics results for the single sludge feedstock suggest that based on activation energy 25% of sludge–petroleum coke mixture is a better feedstock recipe than higher (50%) or lower (10%) ratios. The frequency factor, however, more naturally behaves as higher sludge contents (50%) resulted in higher devolatilization activities. Thus, the kinetics is generally in favor of the mixing yet the synergetic activity of the mixture may put upper ratio limits on the mixtures. The numerical model showed that asymptotic and steady species formation was seen approximately halfway downstream of the drop tube reactor, and the temperature curve shows a growing trend toward the center. Lower syngas output results in reduced performance at lower temperatures (<<1,000°C), and higher temperatures (1,550°C) were unfavorable because more heat was needed to get the gasifier wall up to the desired temperature. Furthermore, the economic analysis revealed that positive gain is only produced when gasifying above 950°C. While higher temperatures than 1,250°C still give a positive gain, they are less economically favorable for the gasification of petroleum coke/sludge mixture. This can be associated with lower syngas production in the former and higher sensible energy in the latter remark.
Data availability statement
The original contributions presented in the study are included in the article/supplementary material, further inquiries can be directed to the corresponding author.
Author contributions
IA and HK: formal analysis, methodology, software, writing—original draft, and writing—review and editing. CG: methodology. IJ: conceptualization, formal analysis, methodology, and writing—review and editing. All authors contributed to the article and approved the submitted version.
Funding
This publication is based on the study supported by the Khalifa University of Science and Technology under Award No. RC2-2018-009.
Conflict of interest
The authors declare that the research was conducted in the absence of any commercial or financial relationships that could be construed as a potential conflict of interest.
Publisher's note
All claims expressed in this article are solely those of the authors and do not necessarily represent those of their affiliated organizations, or those of the publisher, the editors and the reviewers. Any product that may be evaluated in this article, or claim that may be made by its manufacturer, is not guaranteed or endorsed by the publisher.
References
Aboulkas, A., El Harfi, K., El Bouadili, A., Benchanaa, M., Mokhlisse, A., and Outzourit, A. (2007). Kinetics of co-pyrolysis of Tarfaya (Morocco) oil shale with high-density polyethylene. Oil Shale 24, 15–33 doi: 10.3176/oil.2007.1.04
Acelas, N. Y., López, D. P., Brilman, D. W., Kersten, S. R., and Kootstra, A. M. J. (2014). Supercritical water gasification of sewage sludge: gas production and phosphorus recovery. Bioresour. Technol. 174, 167–175. doi: 10.1016/j.biortech.2014.10.003
Adeyemi, I., Janajreh, I., Arink, T., and Ghenai, C. (2017). Gasification behavior of coal and woody biomass: validation and parametrical study. Appl. Energy 185, 1007–1018. doi: 10.1016/j.apenergy.2016.05.119
Akkache, S., Hernández, A. B., Teixeira, G., Gelix, F., Roche, N., and Ferrasse, J. H. (2016). Co-gasification of wastewater sludge and different feedstock: feasibility study. Biomass Bioenergy 89, 201–209. doi: 10.1016/j.biombioe.2016.03.003
Almazrouei, M., and Janajreh, I. (2019). Thermogravimetric study of the combustion characteristics of biodiesel and petroleum diesel. J. Therm. Anal. Calorim. 136, 925-935. doi: 10.1007/s10973-018-7717-6
Alves, O., Calado, L., Panizio, R. M., Santos, S. M., Gonçalves, M. M., Monteiro, E., et al. (2019). Co-gasification of sewage sludge mixed with waste wood in different proportions. Multidiscip. Dig. Pub. Inst. Proc. 38, 9. doi: 10.3390/proceedings2019038009
Atienza-Martínez, M., Fonts, I., Ábrego, J., Ceamanos, J., and Gea, G. (2013). Sewage sludge torrefaction in a fluidized bed reactor. Chem. Eng. J. 222, 534–545. doi: 10.1016/j.cej.2013.02.075
Bagheri, M., Bauer, T., Burgman, L. E., and Wetterlund, E. (2023). Fifty years of sewage sludge management research: mapping researchers' motivations and concerns. J. Environ. Manage. 325, 116412. doi: 10.1016/j.jenvman.2022.116412
Brusselaers, J., and Van Der Linden, A. (2020). Bio-waste in Europe – Turning Challenges Into Opportunities. (EEA Report; Vol. 2020, No. 4). European Environment Agency. Available online at: https://www.eea.europa.eu/publications/bio-waste-in-europe
Carlos, L. (2005). High Temperature Air/Steam Gasification of Biomass in an Updraft Fixed Bed Type Gasifier (Ph. D. thesis). Stockholm: Royal Institute of Technology, Energy Furnace. and Technology (2005).
Chanda, M., and Roy, S. (2007). “Characteristics of polymers,” in Plastics Technology Handbook (CRC Press), 1–67. doi: 10.1201/9781420006360
Channiwala, S., and Parikh, P. (2002). A unified correlation for estimating HHV of solid, liquid and gaseous fuels. Fuel 81, 1051–1063. doi: 10.1016/S0016-2361(01)00131-4
Chen, G. B., Wu, F. H., Lin, S. P., Hsu, Y. T., and Lin, T. H. (2022). A study of sewage sludge co-gasification with waste shiitake substrate. Energy 259, 124991. doi: 10.1016/j.energy.2022.124991
Chen, S., Meng, A., Long, Y., Zhou, H., Li, Q., and Zhang, Y. (2015). TGA pyrolysis and gasification of combustible municipal solid waste. J. Energy Inst. 88, 332–343. doi: 10.1016/j.joei.2014.07.007
Czerski, G., Spiewak, K., Makowska, D., and Grycova, B. (2023). Study on steam co-gasification of waste tire char and sewage sludge. Energies 16, 2156. doi: 10.3390/en16052156
Deviatkin, I., Lyu, L., Chen, S., Havukainen, J., Wang, F., Horttanainen, M., et al. (2019). Technical implications and global warming potential of recovering nitrogen released during continuous thermal drying of sewage sludge. Waste Manag. 90, 132–140. doi: 10.1016/j.wasman.2019.04.031
Donahue, C. J., and Rais, E. A. (2009). Proximate analysis of coal. J. Chem. Educ. 86, 222. doi: 10.1021/ed086p222
E4Tech. (2009). Review of Technologies for Gasification of Biomass and Wastes. NNFCC project 09/008. Available online at: https://www.e4tech.com/uploads/files/NNFCC_final_report_E4tech_090609.pdf
Faraji, M., and Saidi, M. (2022). Process simulation and optimization of groundnut shell biomass air gasification for hydrogen-enriched syngas production. Int. J. Hydrogen Energy 47, 13579–13591. doi: 10.1016/j.ijhydene.2022.02.105
Ferrentino, R., Langone, M., Fiori, L., and Andreottola, G. (2023). Full-scale sewage sludge reduction technologies: a review with a focus on energy consumption. Water 15, 615. doi: 10.3390/w15040615
Folgueras, M. B., Diaz, R. M., Xiberta, J., and Prieto, I. (2003). Thermogravimetric analysis of the co-combustion of coal and sewage sludge. Fuel 82, 2051–2055. doi: 10.1016/S0016-2361(03)00161-3
Furness, D. T., Hoggett, L. A., and Judd, S. J. (2000). Thermochemical treatment of sewage sludge. Water Environ. J. 14, 57–65. doi: 10.1111/j.1747-6593.2000.tb00227.x
Gao, N., Kamran, K., Quan, C., and Williams, P. T. (2020). Thermochemical conversion of sewage sludge: a critical review. Progr. Energy Combust. Sci. 79, 100843. doi: 10.1016/j.pecs.2020.100843
Garcia-Ibanez, P., Sanchez, M., and Cabanillas, A. (2006). Thermogravimetric analysis of olive-oil residue in air atmosphere. Fuel Process. Technol. 87, 103–107. doi: 10.1016/j.fuproc.2005.08.005
Gong, S., Zhu, X., Kim, Y., Song, B., Yang, W., Moon, W., et al. (2010). A kinetic study of steam gasification of low rank coal, wood chip and petroleum coke. Korean Chem. Eng. Res. 48, 80–87. Available online at: https://api.semanticscholar.org/CorpusID:98475451
Gungor, A., Ozbayoglu, M., Kasnakoglu, C., Biyikoglu, A., and Uysal, B. Z. (2012). A parametric study on coal gasification for the production of syngas. Chem. Papers 66, 677–683. doi: 10.2478/s11696-012-0164-0
Hampp, F., and Janajreh, I. (2011). Development of a drop tube reactor to test and assist a sustainable manufacturing process. Adv. Sustain. Manufa. 141–148. doi: 10.1007/978-3-642-20183-7_21
Hantoko, D., Kanchanatip, E., Yan, M., Lin, J., and Weng, Z. (2018). Co-gasification of sewage sludge and lignite coal in supercritical water for H2 production: a thermodynamic modelling approach. Energy Proc. 152, 1284–1289. doi: 10.1016/j.egypro.2018.09.183
Janajreh, I., Adeyemi, I., Raza, S. S., and Ghenai, C. (2021). A review of recent developments and future prospects in gasification systems and their modeling. Renew. Sustain. Energy Rev. 138, 110505. doi: 10.1016/j.rser.2020.110505
Kacprzak, M., Neczaj, E., Fijałkowski, K., Grobelak, A., Grosser, A., Worwag, M., et al. (2017). Sewage sludge disposal strategies for sustainable development. Environ. Res. 156, 39–46. doi: 10.1016/j.envres.2017.03.010
Knoef, H. A. M. (2005). Handbook of Biomass Gasification. Meppel: BTG Biomass Technology Group B. V.
Linak, W. P., and Wendt, J. O. (1993). Toxic metal emissions from incineration: mechanisms and control. Progr. Energy Combust. Sci. 19, 145–185. doi: 10.1016/0360-1285(93)90014-6
Lombardi, L., Nocita, C., Bettazzi, E., Fibbi, D., and Carnevale, E. (2017). Environmental comparison of alternative treatments for sewage sludge: an Italian case study. Waste Manag. 69, 365–376. doi: 10.1016/j.wasman.2017.08.040
Lu, J. Y., Wang, X. M., Liu, H. Q., Yu, H. Q., and Li, W. W. (2019). Optimizing operation of municipal wastewater treatment plants in China: the remaining barriers and future implications. Environ. Int. 129, 273–278. doi: 10.1016/j.envint.2019.05.057
Lu, Y., Guo, L., Zhang, X., and Ji, C. (2012). Hydrogen production by supercritical water gasification of biomass: explore the way to maximum hydrogen yield and high carbon gasification efficiency. Int. J. Hydrog. Energy 37, 3177–3185. doi: 10.1016/j.ijhydene.2011.11.064
Mamleev, V., Bourbigot, S., Bras, M. L., and Lefebvre, J. (2004). Three model-free method for calculation of activation energy in TG. J. Therm. Anal. Calorimet. 78, 1009–1027. doi: 10.1007/s10973-005-0467-0
Mateo-Sagasta, J., Raschid-Sally, L., and Thebo, A. (2015). “Global wastewater and sludge production, treatment and use,” in Wastewater: Economic Asset in an Urbanizing World. p. 15–38.
Mukherjee, A., Debnath, B., and Ghosh, S. K. (2016). A review on technologies of removal of dioxins and furans from incinerator flue gas. Proc. Environ. Sci. 35, 528–540. doi: 10.1016/j.proenv.2016.07.037
Niu, M., Jin, B., Huang, Y., Wang, H., Dong, Q., Gu, H., et al. (2018). Co-gasification of high-ash sewage sludge and straw in a bubbling fluidized bed with oxygen-enriched air. Int. J. Chem. React. Eng. 16, 20170044. doi: 10.1515/ijcre-2017-0044
Ong, Z., Cheng, Y., Maneerung, T., Yao, Z., Tong, Y. W., Wang, C. H., et al. (2015). Co-gasification of woody biomass and sewage sludge in a fixed-bed downdraft gasifier. AIChE J. 61, 2508–2521. doi: 10.1002/aic.14836
Ongen, A., Ozcan, H. K., Ozba,ş, E. E., Aydin, S., and Yesildag, I. (2022). Co-gasification of oily sludge and chicken manure in a laboratory-scale updraft fixed bed gasifier. Clean Technol. Environ. Policy 24, 2229–2239. doi: 10.1007/s10098-022-02315-z
Ragazzi, M., Rada, E. C., and Ferrentino, R. (2015). Analysis of real-scale experiences of novel sewage sludge treatments in an Italian pilot region. Desalin. Water Treat. 55, 783–790. doi: 10.1080/19443994.2014.932717
Reed, T. B., and Das, A. (1988). Handbook of Biomass Downdraft Gasifier Engine Systems. Golden, CO: Solar Energy Research Institute. Available online at: https://www.osti.gov/servlets/purl/5206099
Schabauer, A. (2009). Co-gasification of sewage sludge and wood in a dual fluidized bed steam gasifier (Diploma Thesis). Technische Universität Wien, Vienna, Austria. Available online at: https://resolver.obvsg.at/urn:nbn:at:at-ubtuw:1-32244
Shabbar, S., Qudaih, R., Talab, I., and Janajreh, I. (2011). Kinetics of pyrolysis and combustion of oil shale sample from thermogravimetric data. Fuel 90, 1631–1637. doi: 10.1016/j.fuel.2010.10.033
Song, Y., Tian, Y., Zhou, X., Liang, S., Li, X., Yang, Y., et al. (2021). Simulation of air-steam gasification of pine sawdust in an updraft gasification system for production of hydrogen-rich producer gas. Energy 226, 120380. doi: 10.1016/j.energy.2021.120380
Szwaja, S., Poskart, A., Zajemska, M., and Szwaja, M. (2019). Theoretical and experimental analysis on co-gasification of sewage sludge with energetic crops. Energies 12, 1750. doi: 10.3390/en12091750
Watanabe, H., and Otaka, M. (2006). Numerical simulation of coal gasification in entrained flow coal gasifier. Fuel 85, 1935–1943 doi: 10.1016/j.fuel.2006.02.002
Webber, T., and Daigle, K. (2017). US Exporting Dirty Fuel to Pollution-Choked India. San Jose Mercury-News; Bay Area News Group; Associated Press. Available online at: https://apnews.com/article/77273861e393412a913fa332054ab2d7#:~:text=NEW%20DELHI%20(AP)%20%E2%80%94%20U.S.,and%20burns%20hotter%20than%20coal
Weber, R., Watson, A., Forter, M., and Oliaei, F. (2011). Persistent organic pollutants and landfills-a review of past experiences and future challenges. Waste Manag. Res. 29, 107–121. doi: 10.1177/0734242X10390730
Wei, L., Zhu, F., Li, Q., Xue, C., Xia, X., Yu, H., et al. (2020). Development, current state and future trends of sludge management in China: Based on exploratory data and CO2-equivaient emissions analysis. Environ. Int. 144, 106093. doi: 10.1016/j.envint.2020.106093
Werle, S., and Wilk, R. K. (2010). A review of methods for the thermal utilization of sewage sludge: the Polish perspective. Renew. Energy 35, 1914–1919. doi: 10.1016/j.renene.2010.01.019
Wijekoon, P., Koliyabandara, P. A., Cooray, A. T., Lam, S. S., Athapattu, B. C., and Vithanage, M. (2022). Progress and prospects in mitigation of landfill leachate pollution: risk, pollution potential, treatment and challenges. J. Hazard. Mater. 421, 126627. doi: 10.1016/j.jhazmat.2021.126627
Wu, Z., Meng, H., Luo, Z., Chen, L., Zhao, J., and Wang, S. (2017). Performance evaluation on co-gasification of bituminous coal and wheat straw in entrained flow gasification system. Int. J. Hydrog. Energy 42, 18884–18893. doi: 10.1016/j.ijhydene.2017.05.144
You, S., Wang, W., Dai, Y., Tong, Y. W., and Wang, C. H. (2016). Comparison of the co-gasification of sewage sludge and food wastes and cost-benefit analysis of gasification-and incineration-based waste treatment schemes. Bioresour. Technol. 218, 595–605. doi: 10.1016/j.biortech.2016.07.017
Zhang, Z., Zhang, L., Liu, Y., Lv, M., You, P., Wang, X., et al. (2023). Co-gasification synergistic characteristics of sewage sludge and high-sodium coal. ACS Omega 8, 6571–6583. doi: 10.1021/acsomega.2c06962
Nomenclature and abbreviation
Keywords: sewage sludge, petroleum coke, gasification, pollutant control, equilibrium modeling, numerical simulation
Citation: Adeyemi I, Khan H, Ghenai C and Janajreh I (2023) Techno-economic analysis of the co-gasification of sewage sludge and petroleum coke. Front. Sustain. 4:1234760. doi: 10.3389/frsus.2023.1234760
Received: 05 June 2023; Accepted: 17 July 2023;
Published: 09 August 2023.
Edited by:
Sohaib Mohammed, Cornell University, United StatesReviewed by:
Prince Ochonma, Cornell University, United StatesGhassan Abdullah, University of Tikrit, Iraq
Copyright © 2023 Adeyemi, Khan, Ghenai and Janajreh. This is an open-access article distributed under the terms of the Creative Commons Attribution License (CC BY). The use, distribution or reproduction in other forums is permitted, provided the original author(s) and the copyright owner(s) are credited and that the original publication in this journal is cited, in accordance with accepted academic practice. No use, distribution or reproduction is permitted which does not comply with these terms.
*Correspondence: Isam Janajreh, SXNhbS5KYW5hanJlaEBrdS5hYy5hZQ==
 Idowu Adeyemi
 Haider Khan
 Chaouki Ghenai
 Isam Janajreh