 Mike Ssempa Mulindwa
 Jackson Akor
 Mary Auta2
 Elke Nijman-Ross
 Moses Onyango Ogutu
- 1International Business and Trade Department, African Leadership University, Kigali, Rwanda
- 2Entrepreneurship Department, African Leadership University, Kigali, Rwanda
- 3School of Wildlife Conservation, Circular Economy Program, African Leadership University, Kigali, Rwanda
A high quantity of waste is generated from industrial activities by manufacturers across metropolitan cities compared to smaller cities with fewer industrial activities. Adopting Circular Economy principles in waste management has the potential for sustainable waste management to reduce the quantity of waste at dumpsites and harmful emissions from wastes. The study was conducted to assess circularity status and challenges for attaining higher circularity by Kigali’s manufacturing, waste collection, and waste recycling companies using the 10-R framework. The study also sought to build estimates for industrial solid waste quantity and methane emissions for the next 10 years (2020–2030) in Rwanda. A mixed method approach was utilized where primary data was collected from manufacturing, waste collection, and waste recycling companies using a validated questionnaire and an in-depth interview guide. Thematic, descriptive analysis and First Order Decay methods were used to analyze the qualitative, quantitative, and secondary data. Results show that adopting the 10-R principles of circular economy was low and varies across manufacturing, waste collection and recycling companies. There were instances of high adoption of R3-Reuse and R8-Recycle with a mean score of 7.17 and 7.21 among manufacturing companies. R7-Repurpose (8.80) recorded a high adoption rate among waste collection companies and a medium level of adoption for R7-Repurpose (3.50) and R9-Recover (3.00) among recycling companies. The overall low adoption toward attaining circularity was attributed to various economic, institutional, infrastructural, operational, attitudinal, and technological challenges. In 2030, it is projected that 922 Gg of industrial waste will be deposited in solid waste disposal sites in Rwanda; with an estimated methane emission of 157 Gg Carbon dioxide equivalence. It was recommended among others, that human resource capacity development should be prioritized to drive the adoption of the 10-R principles across manufacturing, waste collection, and waste recycling companies in Kigali, which can reduce the quantity of wastes that ends at dumpsites and methane emissions that contribute significantly to global warming.
1 Introduction
In many developing countries, circularity in waste management is critical for municipal solid waste management. Much municipal solid waste can be avoided, reduced, recycled, refurbished, recovered, and reused or repurposed. Rwanda has made significant efforts toward waste management through a 2019 legislative bill banning single-use plastic (SUP) such as plastic carrier bags, bottles, and straws (Green Peace Africa, 2020) and efficient solid waste collection in Kigali. However, the 2012–2015 Performance Audit Report on the Management of Waste in the city of Kigali by the Office of Auditor General revealed that improvements must be made to current waste management practices in order to attain higher levels of circularity.
The creation of waste is a consequence of the linear economy that is focused on “take-make-dispose” of products, materials, and resources. An alternative to the linear economy is the circular economy (CE), which aims to use resources in a way that eliminates waste, keeps materials in use, and regenerates natural systems (Ellen MacArthur Foundation, 2023). After analyzing 114 CE definitions of the Kirchherr et al. (2017) concluded that the most prominent and employed definition of the CE is formulated by the Ellen MacArthur Foundation (EMF). Ellen MacArthur Foundation (2013, p.7) defines CE as the following “an industrial system that is restorative or regenerative by intention and design. It replaces the end-of-life concept with restoration, shifts toward to use of renewable energy, eliminates the use of toxic chemicals, which impair reuse, and aims for the elimination of waste through the superior design of materials, products, systems and within this, business models.” Waste reduction/elimination has been highlighted by 35–38 percent of 221 definitions analyzed by Kirchherr et al. (2023) as one of the important CE dimensions. The elimination of waste can be achieved by transitioning to a CE (Ellen MacArthur Foundation, 2022). A waste management system depicts the collection, transport, processing or recycling, disposal, and monitoring of waste materials to reduce harm to the environment and human health in a community. In Rwanda, the National Institute of Statistics and Research (NISR) projected a population increase of 10.5 million in 2012 and 16.9 million in 2032 (high scenario). The rise in population is directly proportional to an increase in waste generation from commercial activities and households. With the current national population of 13 million people (The World Bank, 2022) and approximately 1.2 million in the city of Kigali, the quantity of waste collected in Kigali has proliferated from 180 tons per day in 2012 to more than 500–800 tons per day in 2016. This has even increased up to a cumulative of 232,870 tons per year in 2019. Unfortunately, an increase in waste generated has not translated to an increase in effective waste management in Rwanda (Kabera et al., 2019; Victoire et al., 2020).
There is a global movement toward an economic system that seeks to drastically reduce or ideally eliminate waste generation in tandem with the increase in the human population. This is one of the primary objectives of the CE.
The CE provides an alternative to the traditional linear economy, which is focused on take-make-dispose by eliminating waste, keeping materials in use, and regenerating natural systems through introducing sustainable business models (Ellen MacArthur Foundation, 2022), which provides a positive impact on biodiversity and contribute to climate change adaptation (Ellen MacArthur Foundation, 2021). Circularity emphasizes innovative resource management to make planet Earth useful to the current generation while preserving a bountiful reservoir of resources for future generations (Velenturf and Purnell, 2021).
Globally, the annual sum of waste generated is approximately 1.3 billion tons, and this exceeds the current processing and recycling capacity of recycling companies. The direct consequences include pollution of water bodies, environmental degradation, and emission of Green greenhouse gases (GHGs) and tension across geographic territories as governments struggle to find sites for waste disposal. These sites are the end destination of most solid wastes. The accumulation of these solid wastes over several years becomes a source of emission of GHGs such as methane (CH4) to the atmosphere. Methane contributes significantly to global warming, it is reported to have about 24 times the global warming power of CO2 (Stocker, 2014). This further explains why many economies are adopting CE value chain processes. Governments across the world, from the EU to China, Japan, Latin America, and Africa, are adopting circular strategies as part of their environmental action plans (ACEA, 2021; The Circle Economy, 2021).
Rwanda, with its green city agenda, is one of the African countries at the forefront of transitioning from a Linear Economy to a Circular Economy in Africa. Against this background, the study is conducted to assess the current circularity status of waste management by manufacturers, waste collection, and recycling companies in Kigali, Rwanda. There is a direct need to unpack the activities of these companies to determine the extent of circularity using the 10-R Framework to recommend clear pathways for driving circularity in Kigali, Rwanda. This study aims to arm decision-makers in private businesses and public institutions with relevant data and insights to improve circularity in waste management. The study is underpinned by the following specific objectives:
1. To assess the extent to which manufacturing, waste collection, and recycling companies have adopted circularity principles using the 10-R framework.
2. Identify challenges that impede the adoption of circularity by manufacturing, waste collection, and recycling companies and recommend solutions to overcome such challenges.
Estimate methane (CH4) emission from solid waste disposal sites (SWDS) in Rwanda for 2021–2030. The contributions of the research are as follows. First, to our best knowledge, this study is the first academic study that provides an in-depth understanding of the state of circularity of waste management by manufacturers, waste collection and recycling companies in Kigali, Rwanda. Secondly, this research provides evidence for scholars on the status quo and provides an important baseline for future CE research beyond existing waste management research. Lastly, the research provides important insights for CE practitioners and scholars, which can be used for future research and innovation.
The rest of the article is structured as follows. Section 2 summarizes the existing literature on the CE and waste management relevant to the scope of this study, while section 3 gives a short overview of the CE concept. Section 4 provides an overview of the methodology used for conducting this study, followed by section 5, which presents the research findings. Section 6 discusses the research findings, followed by section 7, which summarizes our main conclusions of this study and recommendations for governments, businesses, educational institutions, and consumers.
2 Literature review
2.1 Challenges of adopting the circular economy and circularity in waste management
The transition from a linear to a CE is a fundamental change. Therefore, it is important to understand the challenges and drivers that hamper the CE transition. A study by de Jesus and Mendonça (2018) highlights that globally, the CE transition is especially driven by soft factors such as social, regulatory, or institutional factors. The study emphasizes the important role of public agencies in the role of institutions framing from infrastructures to the legal framework. An example is the study of Geng and Doberstein (2008) conducted in China, which highlights the significant lack of human and institutional capacities to encourage public participation in the CE partly due to limited environmental management programs and facilities. A study conducted in Europe, suggests that education and young-age dependency are important drivers to change behavior and adopt the circular economy (Neves and Marques, 2022). Given the fact that African countries have a young population with a medium age of 18.7 in 2022 (Statista, 2023), this could indicate that the population in African countries would be open to adopting circular practices. Also, the study emphasizes that higher educated people tend to be more proactive in environmentally friendly behavior. Therefore, the study recommends that policymakers need to develop policies that can reach the lower-educated population (Neves and Marques, 2022). Therefore, this study selectively uses 10-R framework (Table 1).
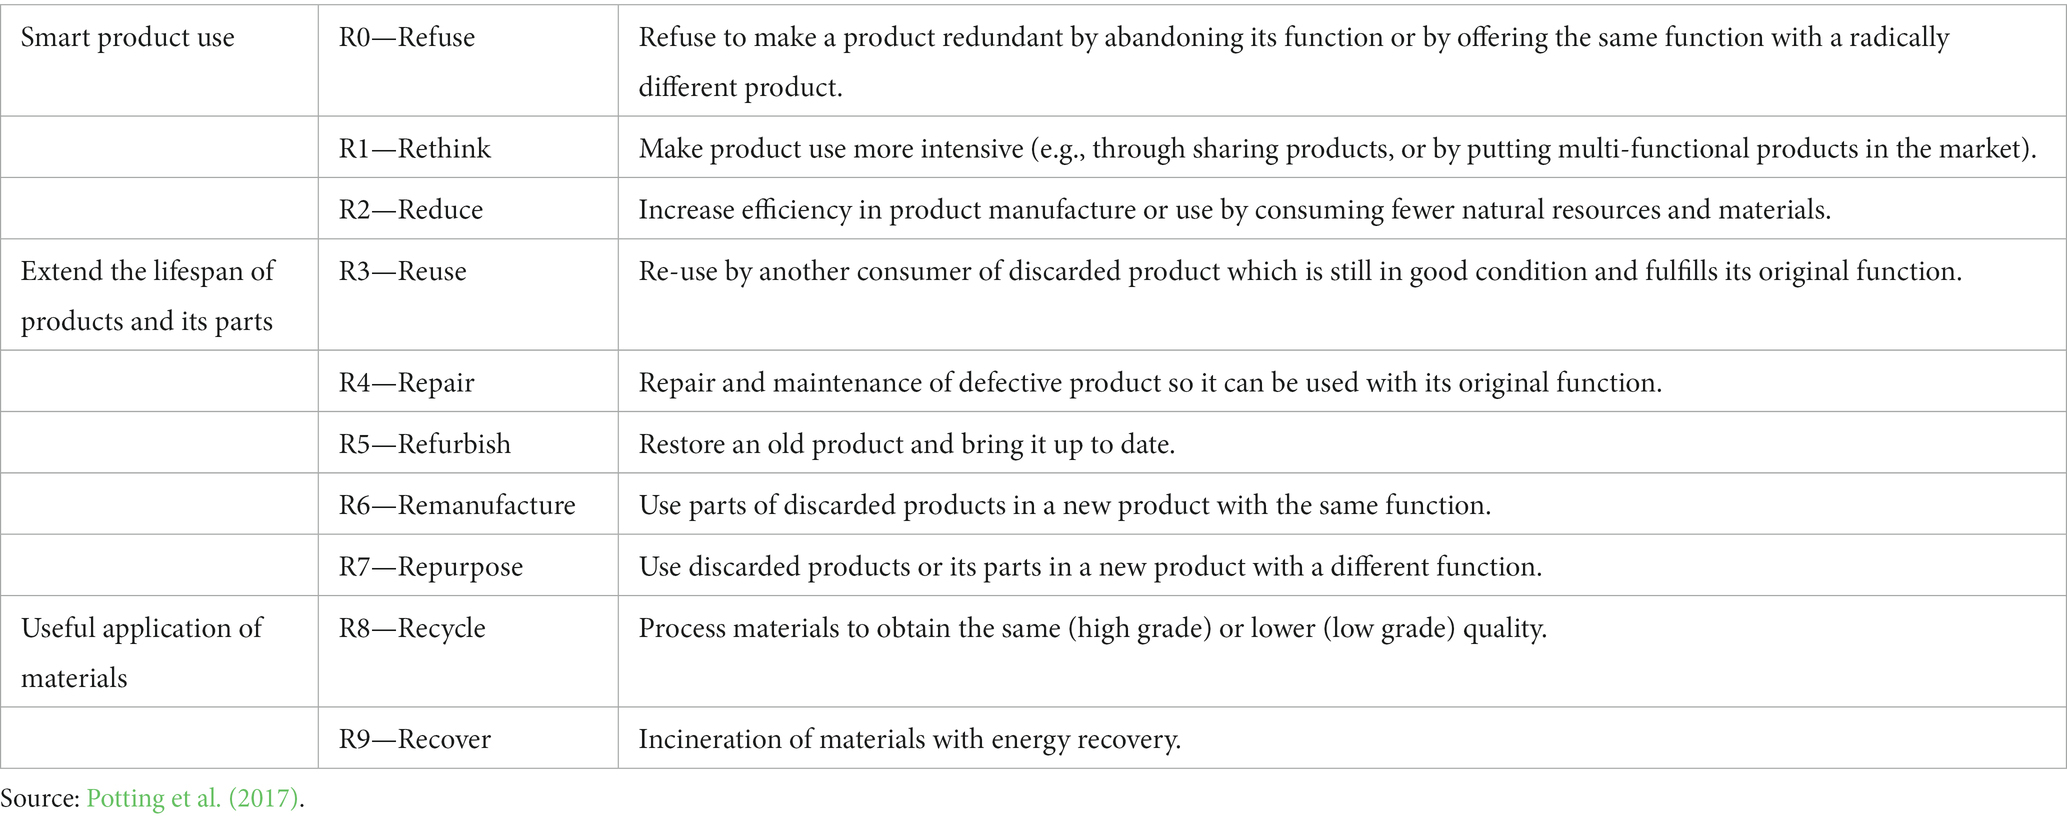
Table 1. 10-R circular economy framework categorization.
Furthermore, (de Jesus and Mendonça, 2018), highlight the need to create awareness and investment in research and development. A similar conclusion has been made in a study by Nijman-Ross et al. (2023), which also emphasizes the importance of investing in research to accelerate the adoption of CE in African countries due to limited available funds. Globally, hard barriers such as the availability of technical and financial solutions can hamper the development toward the CE. Even though technical solutions can be present, they can still be limited by economic and market limitations. From the literature, it can be concluded a holistic and multi-stakeholder approach is needed, whereby technical innovation, but also institutional change in public policies, markets, and practices are required (de Jesus and Mendonça, 2018).
2.2 Waste management by manufacturers, waste collection, and recycling companies
Kabera et al. (2019) conducted a benchmarking performance study in the city of Kigali with respect to solid waste management and recycling systems. City profiling methodology developed by the UN-Habitat, was deployed to analyze indicators for sustainable waste management. The data analysis shows that in the city of Kigali, approximately 232,870 tons of Municipal Solid Waste (MSW) is generated annually. MSW collection is carried out by private companies; however, the dumpsites in Kigali are managed and controlled by the government (City of Kigali-CoK). Based on location and social class, residents pay these waste collection companies to pick up their waste. The study also found out that there is an official recycling company in the city of Kigali, other activities are performed by private companies and plastic bottle waste is also transported to neighboring Tanzania and Uganda for recycling (Kabera et al., 2019).
For this study, we also analyzed the existing waste management policies, legislation, and regulations in Rwanda, which are included in the Supplementary Material (Supplementary data).
A benchmark indicators analysis assessed the adequacy of the national solid waste management framework, which includes the degree of their implementation. Kabera et al. (2019) stated that the overall assessment is medium, with a score of 58%; wherein despite the prohibition of manufacturing, importation, use, and sale of polythene bags in Rwanda, people still use plastic bags illegally entered into Rwanda.
2.3 Waste emissions
Among several economic sectors that contribute to Green House Gas (GHG) emissions is the waste sector. Methane emissions (CH4) from waste are notable for contributing to Global warming more than carbon dioxide (CO2). Over the last few years, methane emissions have become the focus of climate change conversations worldwide. This is due to increasing concentration in the atmosphere. Stocker (2014) highlighted that between 1750 and 2020, GHG CH4 emission has increased by 158%. The rise in human population and activities has significantly increased the CH4 emission level. The global estimation shows that the concentration of CH4 in the atmosphere, which stood at 6.88 Gt CO2-eq increased 8.59 Gt CO2-eq by 2020 (U.S. EPA, 2012; Singh et al., 2018).
A study conducted in Nigeria used national-specific waste data from the government to calculate through First Order Methods (FOD) its methane emissions for 2023–2030 business as usual scenarios (BAU)—linear economy, whereby Nigeria would apply minimal efforts to recycle different types of waste, compared to a scenario whereby Nigeria would recycle its waste (R8; Bisong et al., 2021). A summary of this estimation for plastic waste in Nigeria shows that by 2030, under the business-as-usual scenario (linear economy), there will be methane emission of 16,569 Gg CO2-Eq, while recycling of plastic waste is prioritized, methane emission will reduce to 15,393 Gg CO2-Eq. This is a decline of 7.37%. Recycling (R8) under the R-10 Framework indicates low circularity, which means if Nigeria moves close to a higher level of circularity, its methane emission could significantly reduce at a level higher than the current estimation under recycling scenarios.
Another study in India observed that the net annual emission of CH4 from landfills in India increased from 404 Gg in 1999–2000 to 990 and 1,084 Gg in 2011 and 2015 (Singh et al., 2018). It was also found that CH4 emissions were highly correlated (R2 = 0.8) with the gross state domestic product (GSDP) of states and the gross domestic product (GDP) of the country.
3 Conceptual framework: the R-hierarchy framework
The study of circularity has been conceptualized by many studies in the R-framework, from 3R to 4R, 5R, and 10R. The Circle Economy (2021) identifies three core elements in the R framework: prioritize regenerative resources, stretch the lifetime of resources, and use waste as a basis to derive resource recycling strategies. Similarly, the Ellen MacArthur Foundation established three principles of the circular economy: regenerative natural systems, design out waste and pollution, and keep products in use (Ellen MacArthur Foundation, 2023).
The R-hierarchy framework has consistently been applied by numerous studies in assessing circularity. The 10-R framework is utilized to eliminate the inconsistencies in the R definition in the other hierarchies, such as the 3R, 4R, and 5R. Therefore, this study selectively uses the 10-R framework, focusing on the Rs in the framework that applies to only manufacturing, waste collection, and recycling businesses. The Rs-refuse, reduce, resell, and reuse apply to the manufacturers, while refurbish, recycle, recover, and re-mine apply to waste collectors and recyclers (Kirchherr et al., 2017). Studies indicate that in the circular economy: Refuse, Reduce, Resell, and Repair are the most preferred because they have high-value retention compared to the rest of the Rs. The above-mentioned four Rs significantly retain product value and extend the product’s lifetime. The last three Rs: Recycle, Recover, and Remine, are the least preferred by manufacturing companies as they significantly reduce the number of inputs and consumption of outputs. Even though businesses less frequently adopt these 3Rs, government regulatory policies tend to put much emphasis on them. This misalignment creates room for poor implementation of circularity. Therefore, a study suggested that to achieve a higher level of circularity, policymakers and businesses should focus their efforts on the realization of more desirable, shorter loop retention options like remanufacturing, refurbishing, and repurposing, with a view on feasibility and overall system effects (Reike et al., 2018). Hence, this study will recommend pathways for better alignment between manufacturers and government agencies. The study will provide suggestions for enhanced policy implementation leading to sustainable use of resources, reduction of waste, and higher levels of circularity.
Studies show that the 10-R circularity model is among the hierarchy frameworks applied in assessing circularity in waste management. However, upon close evaluation of the 3R, 4R, 5R, and 10R frameworks, it is clear that there is a lack of consistency in the meaning of the Rs. There are 38 different “re” words are used across various frameworks by different scholars (Kirchherr et al., 2017). Hence, this study will focus on the 10-R framework due to its improvement in consistently defining the Rs. Kirchherr et al. (2017) studied the 10-R framework from the product life cycle perspective, which includes different life cycles. There is a good agreement in the 10R framework between Kirchherr et al. (2017) and Bisong et al. (2021). However, there is a variation in how both studies order and categorize the hierarchy. Bisong et al. (2021) add more clarity to the framework by further aligning each R in the 10-R framework with respective circularity features and policy recommendations for integrating circularity in the waste management sector in Nigeria.
4 Methodology
4.1 Research design
This study adopted a mixed-method approach, where both qualitative and quantitative data were deployed to understand the circularity status of waste management practices of upstream (manufacturing companies) and downstream waste management value chain businesses (waste collection and recycling companies). A mixed method approach allows for triangulation of results and complementarity, where results from qualitative analysis are used to enhance, elaborate, or clarify results from quantitative analysis (Johnson and Onwuegbuzie, 2004).
4.2 Study population, sample, and sampling technique
The study population comprised manufacturing, waste collection, and waste recycling companies in Kigali, Rwanda. There are 11 registered waste collection companies in Kigali and each company covers different parts of Kigali.
4.2.1 Manufacturing companies
Companies were selected from six major industrial sectors in Rwanda where key waste streams are generated. These major industrial sectors include Mining and Quarrying, Beverages; Textiles and Clothing; Wood, Paper, and Printing; Chemicals, Rubber, and Plastics; and Construction and Furniture. In addition, these major industries are industrial sectors that fall under the big-five bet, which are industries with high potential for adopting circular economy principles by the African Circular Economy Alliance (ACEA, 2021). From a pool of companies in these six major industries, the largest company was selected proportionally to its manufacturing output/size. The proportionate sample was used again in selecting six manufacturing companies. For each company, one respondent was selected from the company’s senior management, and another respondent was selected from the mid-level production department, given their interaction in the production in the unit where waste is generated.
Out of the 18 identified registered manufacturing, mining, recycling, and waste collection companies, 16 participated in the study, spending on the availability and willingness to take part by the company leadership. Waste collection companies: six sampled companies were selected proportionally to the high ranking of the estimated quantity of waste the companies collect in the city. The companies with more coverage areas collect a higher quantity of waste. In each sampled company, one respondent was selected from senior management, and another respondent was selected from mid-level operations, given their experience of daily operations within the waste management company.
4.2.2 Recycling companies
The convenience sampling technique was adopted in the sample selection of three recycling companies. The inclusion criteria laid emphasis on currently being operational in the business of waste recycling in Kigali. This includes large-scale recycling and small-scale recycling. Similar to the waste collection companies, one respondent in each company has been selected from senior management and one respondent was selected from mid-level operation.
4.3 Instrument for data collection
Quantitative data were collected through a five-point Likert scale questionnaire. The questionnaire was divided into three sections. Section A collected demographic data of the company. Section B collected data that ranks the circularity status across the companies. The Section C of the questionnaire collected data on challenges companies face in attaining a higher circularity level in waste management. These challenges were grouped into seven categories: economic, institutional, infrastructural, operational, functional, attitudinal, and technological challenges. The questionnaire was subjected to a validity test using the Cronbach alpha reliability co-efficient. A reliability index of 7.0 was accepted for each segment of the questionnaire. A summary of the reliability analysis is presented in Table 2.
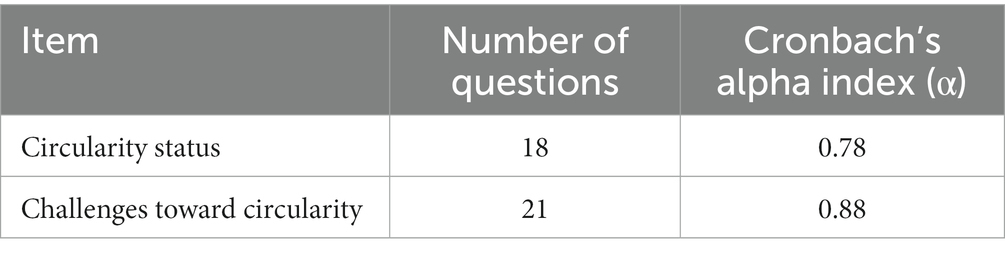
Table 2. Summary of Cronbach alpha reliability analysis.
Qualitative data for in-depth analysis were collected through an in-depth (IDI) interview with manufacturing, waste collection, and recycling companies. The IDI was divided into two sections. Section A raised relevant questions concerning the current circularity status of wastes in the company while section B raised questions about challenges faced by the companies in their journey toward attaining higher circularity.
Secondary data sets were collected from the Intergovernmental Panel on Climate Change (IPCC) to estimate methane (CH4) emission from solid waste disposal sites in Rwanda for 2020–2030 as a component of carbon accounting from the waste sector.
4.4 Data analysis
Quantitative data collected via questionnaire was coded, cleaned, and analyzed using descriptive analysis in SPSS. The descriptive statistics (means value) were determined and used to analyze the frequency of responses. This revealed the extent to which manufacturing companies, waste collection companies, and recycling companies are adopting circularity principles along the 10-R principles of the CE, as well as the challenges faced by these companies on their path to circularity. The mean score range of 7–10 revealed high adoption, 3–6 medium adoption, 1–3 low adoption, and < 1 revealed no existence of circularity adoption by the companies. More so, the same range was used to denote low levels of challenges, medium levels of challenges, and high levels of challenges.
For the qualitative data, the conducted interviews with the selected companies were transcribed, cleaned, and analyzed using thematic analysis.
For the secondary data, the First Order Decay (FOD) model is applied to estimate methane (CH4) emissions from SWDS because it produces more accurate estimates of annual emissions. This is done following the guidelines that have been established by the Intergovernmental Panel on Climate Change (IPCC) for carbon accounting. The FOD method operates under the presumption that the biodegradable organic carbon (DOC) present in solid waste disposal sites (SWDS) gradually deteriorates over time, resulting in the production of methane (CH4) and carbon dioxide (CO2). In addition, the FOD method assumes that methane (CH4) and carbon dioxide (CO2) emissions in SWDS are at their highest during the first few decades following the deposition of waste. Because the bacteria responsible for decay are consuming the biodegradable carbon in the waste, there is a steady decline in the amount of emissions produced over time. The amount of time it takes for various types of waste to reach half their original volume can range anywhere from a few years to several decades or even longer. For the FOD model to produce a result that can be considered tolerably accurate, it requires data spanning at least 50 years.
Tiers for estimating methane (CH4) emissions from SWDS: in order to calculate the amount of methane (CH4) emitted by SWDS, there are three (3) different tiers that are used, each of which is determined by the level of granularity of the country-specific data that is available:
1. In Tier 1, the factors for estimating methane (CH4) emissions are primarily based on the activity data and default parameters that are provided by the IPCC by default.
2. Emission accounting at the Tier 2 level requires data on activities that are country-specific and of a high quality. However, this level does permit the use of some default parameters.
3. Tier 3 estimates require high-quality country-specific activity data along with either nationally developed key parameters or measurements derived from parameters specific to the country being analyzed.
For the purpose of estimating the quantity of methane (CH4) emissions produced by SWDS in Rwanda between the years 1960 and 2030, the accounting results utilize the Tier 2 method. The study utilized Tier 2 because we are able to collect and estimate data of a high quality that is country-specific and pertains to both past and present waste disposal practices. As a result, this study was able to perform an estimate of Tier 2 emissions by utilizing the IPCC FOD method with the default parameters and activity data that is country-specific.
5 Results
The results of demographic data analysis show the year sampled businesses were established, the number of departments and the number of employees. For anonymity, the companies were coded into A–N. The company with the highest number of employees is in the mining sector, while the lowest number of employees is in the manufacturing of office furniture. The oldest company, which was established in 1999, is in the waste management category, while the most recently established company (2019) manufactures office furniture (Table 3).
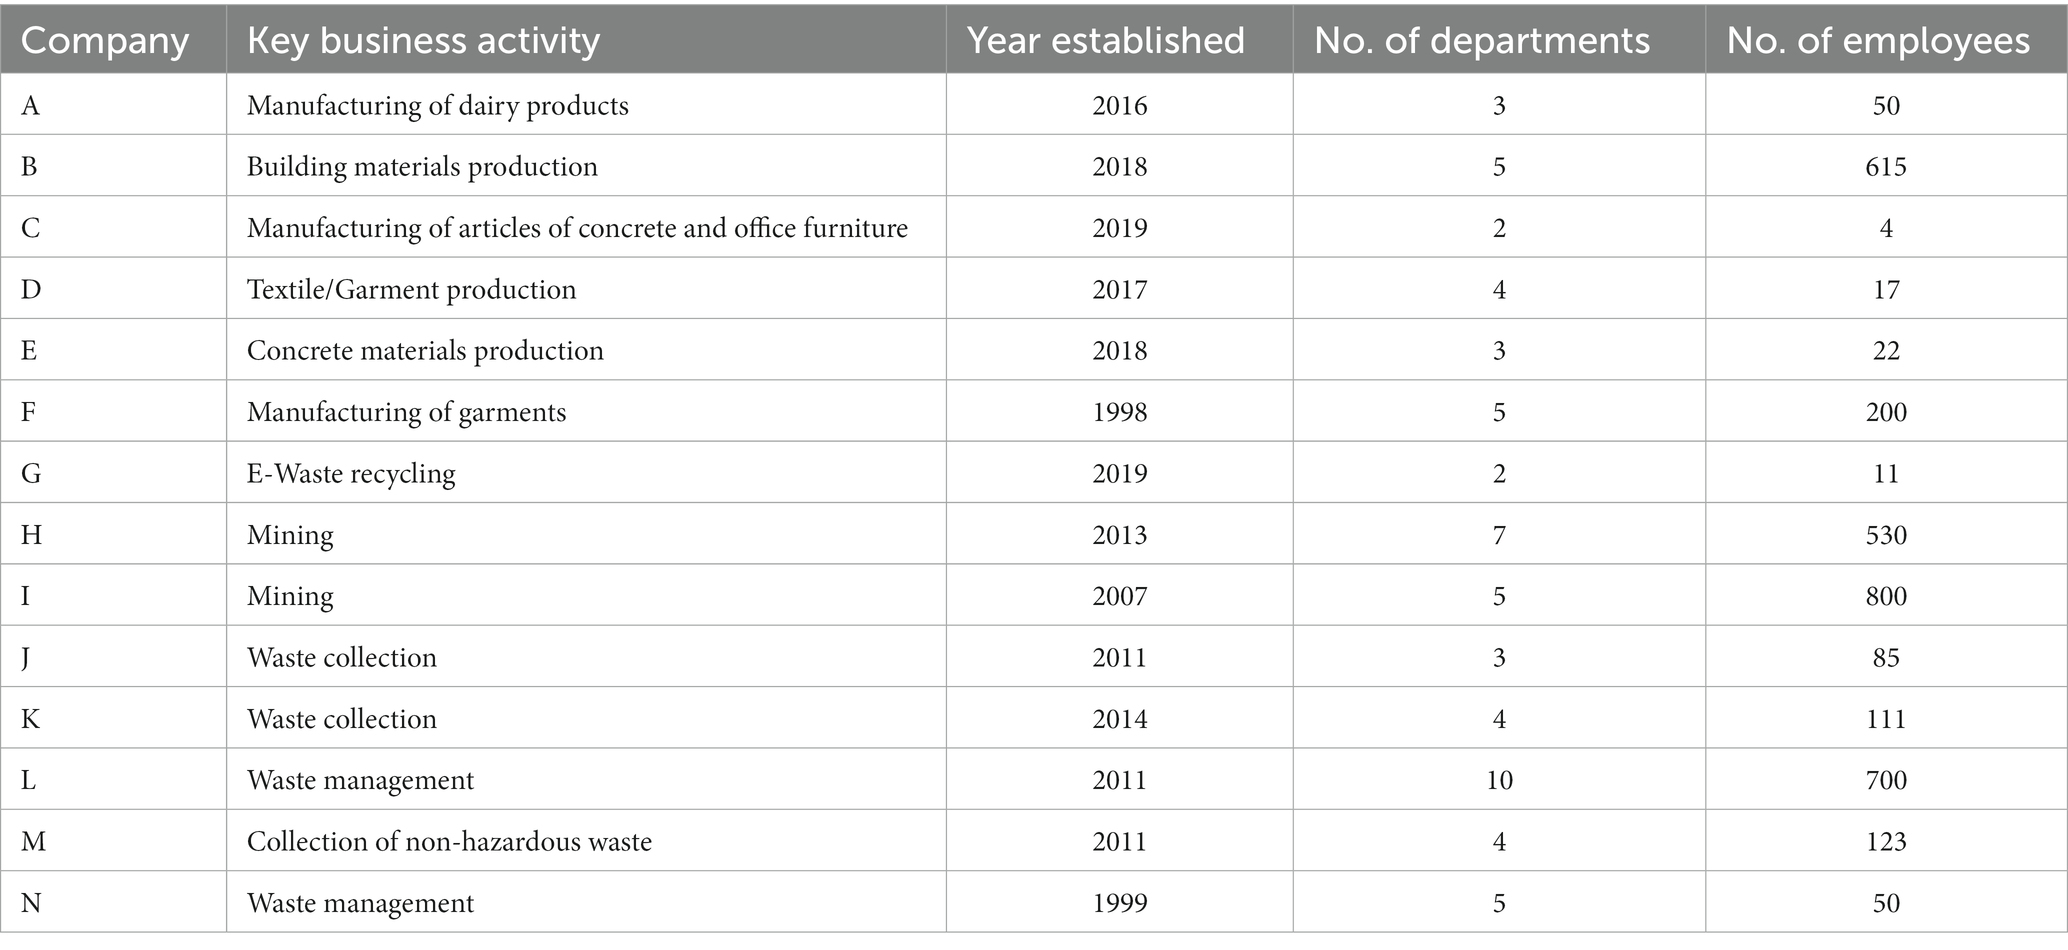
Table 3. Demographic characteristics of manufacturing, waste collection, and recycling companies.
5.1 Research question 1: what is the extent to which manufacturing, waste collection, and recycling companies have adopted circularity principles using the 10-R framework?
The results of descriptive data analysis show the various adoption levels of the 10-R Circular economy principles across upstream waste management (manufacturing companies) and downstream waste management (waste collection and recycling companies). Data were collected to measure R3-Reuse, R4-Repair, R5-Refurbish, R6-Remanufacture, R7-Re-purpose, R8-Recycle, and R9-Recover adoption in the handling of wastes by these companies. The adoption of the 10-R was ranked on four levels (No Adoption, Low Adoption, Medium Adoption, and High Adoption). Across manufacturing companies, R3-Reuse and R8-Recycle recorded high adoption with a mean score of 7.17 and 7.21, while other 10-R values recorded medium adoption levels. Across waste collection companies, data analysis showed a low level of adoption of R4-Repair (3.00), R5-Refurbish (2.20), and no adoption of R3-Reuse (0.00). However, R6-Remanufacture (6.20) and R7-Repurpose (8.80) recorded high adoption rates. Finally, recycling companies recorded a high adoption rate in R8 (Recycle), low adoption in R6-Remanufacture (2.50), and a medium level of adoption in R7-Repurpose (3.50) and R9-Recover (3.00). No adoption was recorded across R0 (Refuse), R1-Rethink and R2-Reduce for the manufacturing, waste collection and recycling companies. R3-Reuse, recorded a zero adoption level across recycling and waste collection companies. Furthermore, R4-Repair and R5-Refurbish by recycling companies were also not adopted. A summary analysis is presented in Table 4.
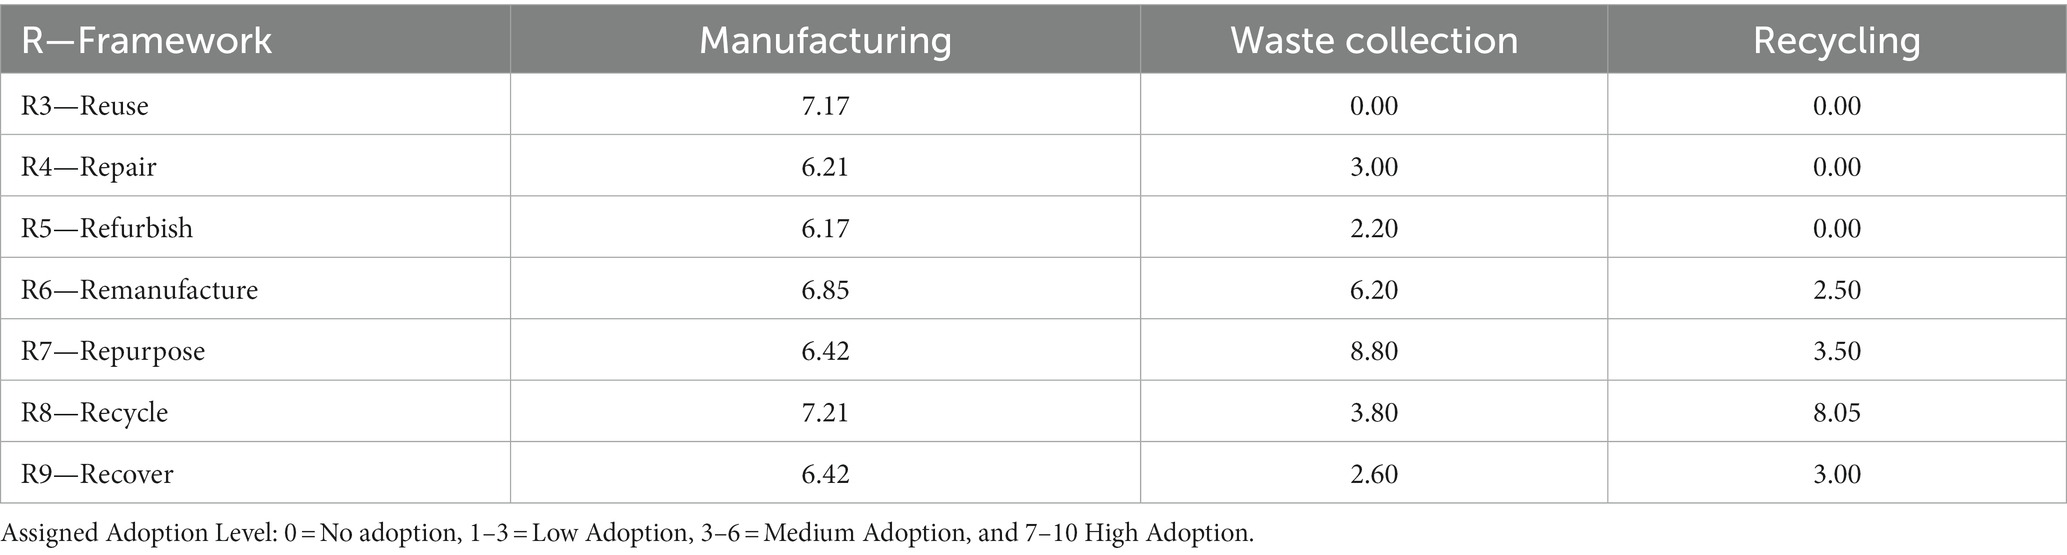
Table 4. 10-R adoption by manufacturing, waste collection, mining, and recycling companies.
Qualitative data analysis to triangulate the quantitative analysis reveals how the 10-R principle is being implemented across the three categories of companies.
5.1.1 Manufacturing companies
R3-Reuse: The small cut fabric we put together and make a huge fabric to make clothes,but these take a long time. Company C.
R6-Remanufacture: “‘People can bring their used clothes, and we can remake them into another cloth if it was a dress, we can turn them into a shirt or skirt” Company D.
R7–Repurpose: “For the product, when the yoghurt spoils, we take it to pig farmers as feed” Company A.
R8–Recycle: We are currently running a campaign with support from the government to sensitize waste separation before we collect it and we hope that by the end of this campaign, residents in Kigali should be able to separate their waste before they hand them over for collection.
5.1.2 Waste collection companies
R4-Repair: “I would say 30% of the wastes can be repaired especially the machinery and a few other appliances or even plastic materials which usually can be repaired and reused” Company K.
5.1.3 Recycling companies
R2-Reuse: “Currently we are planning to launch the second version of mobile app and in it we have the reusing aspect that allows households to sell secondhand devices. It does not necessarily have to be waste institutions or consumers who might need to reuse the electronics” Company G.
R5-Refurbish: “We have a facility with a processing capacity of 10,000 tons of E-waste annually and refurbish/recycle this E-waste to raw materials. The refurbished or recycled outputs can be used by local and regional plastic and metal manufacturers in the production of new products” Company G.
5.2 Research question 2: what are the challenges that impede the adoption of circularity principles by manufacturing, waste collection, and recycling companies?
Given the earlier results that show low adoption of the 10-R circular economy principles, data were collected to analyze the challenges of adopting the 10-R principles. The challenges were broadly classified into 7 broad categories and then ranked into low, medium, and high levels.
The economic challenge was high across Manufacturing, Waste collection, and Recycling companies with a mean score of 8.38, 9.00, and 7.80, respectively. The institutional challenges were ranked medium level in Manufacturing companies (6.66), albeit high in Waste collection (9.80), and Recycling companies (7.43). Infrastructural, Operational, Functional Challenges, Attitudinal and Technological challenges ranked high across the three categories of companies. A summary analysis is presented in Table 5.
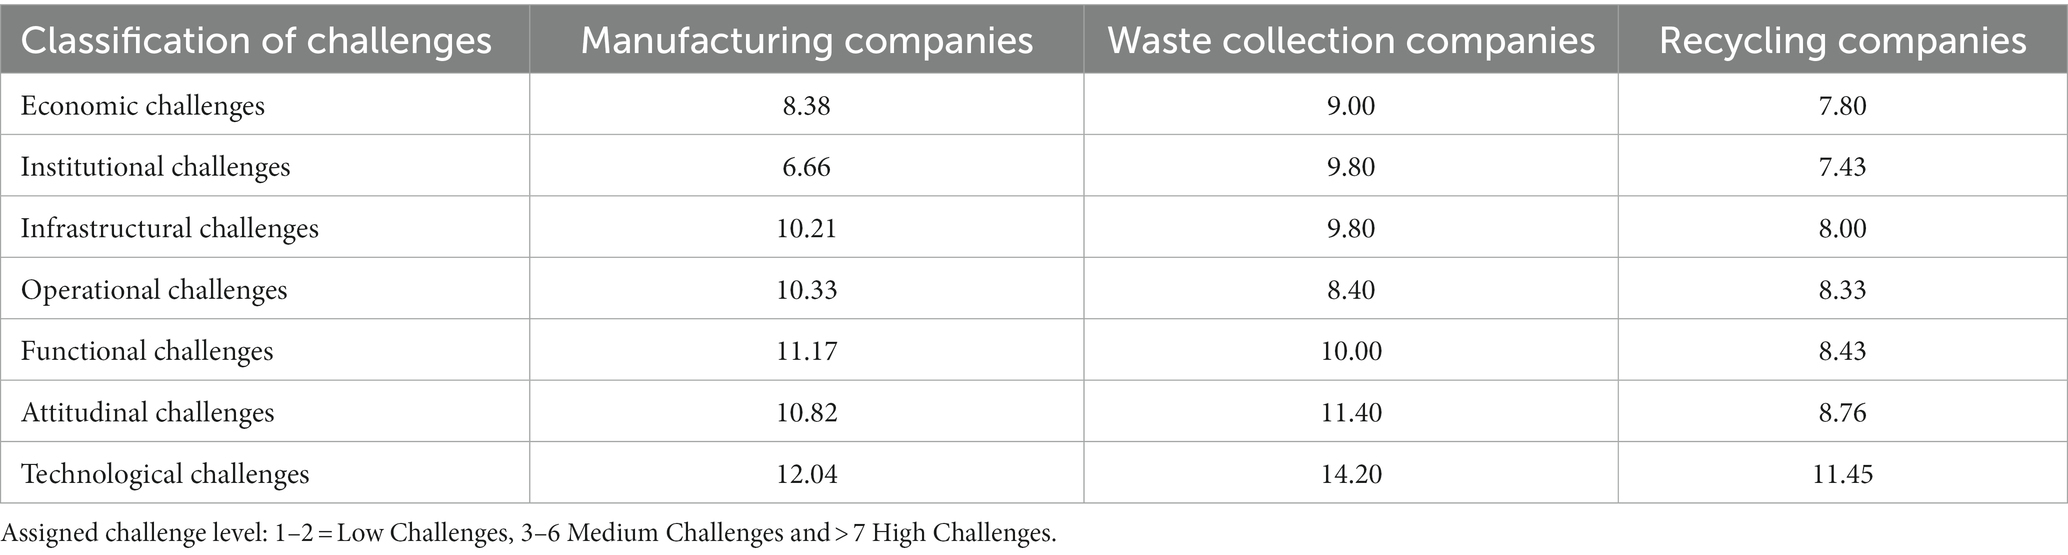
Table 5. Challenges that impede the adoption of the 10-R circular economy principles.
As earlier highlighted by Company C in the qualitative analysis, where the company demonstrated elements of R3-Reuse, albeit there exists the challenge of taking a long-time in producing products adopting the Reuse principle. Further thematic analysis of qualitative analysis shows a different aspect of the challenges that hinder companies from implementing the 10-R principles of a circular economy.
5.2.1 Institutional challenge
This challenge category focuses on limitations for adopting the 10-R principles linked with the institutional policy framework. An earlier review of the literature shows the existence of policies designed to drive the elements of the 10-R circularity principles. A recurring theme in the implementation of the institutional framework. For example, a respondent clearly stated that:
“Implementing a waste separation policy is ongoing. Recently, the government has started implementing waste segregation at source. This has started in some residential places where separate bins have been provided for compost and not biodegradable waste such as plastics. We await this policy drive among manufacturing businesses as well” Company H.
5.2.2 Operational challenge
This challenge is an internal challenge of the company linked to limitations of the system and processes that hinder the implementation of 10-R circular economy principles. A theme was with the human resources that can drive this implementation. This ranged from lack of knowledge for the segregation of wastes and the skills set to drive implementation. For instance, a company is quoted as follows:
“The skills that are lacking are material science skills, a core skill that informs on how you can redesign the product that can last long. Also, the sustainability design skills from hardware to software skills that enables changing the design thinking in making materials that last long. These two and other skills are lacking” Company M.
5.2.3 Attitudinal challenge
The attitudinal challenge is an external challenge linked to the buying behavior or attitude of customers/clients of these companies. Data analysis shows that clients’ buying behavior for products that integrate elements of 10-R principles is a major limitation.
“Few people buy refurbished clothes as people want new clothes” Company D.
5.2.4 Technological challenge
This challenge is tied to machinery and equipment that enables the adoption of the 10-R principle. Data analysis shows that there is a lack of machinery within the country to enable adoption. When an attempt is made to import, it is pretty expensive. “There is a lack of machinery that facilitates the collection process and not enough bags or capacity to facilitate the waste collection process” Company N.
5.2.5 Economic challenge
Emerging issues related to funding were categorized as under the economic challenge classification. Some of the emerging economic challenges were internal, while others were external. Access to funding opportunities for the companies was prevalent, and the high cost of eco-friendly production materials was quite expensive. In addition, the disposal income of potential customers for final products that embedded principles of circularity in their production is low. “The economic challenge in the circular economy sector is there is very limited funding with the most available funding available in the EU with the EU startups being the beneficiaries” Company D. High cost of production materials that is eco-friendly. Company C. “But I would say demand for recycled materials is almost non-existent in Rwanda” Company E.
5.2.6 Infrastructural challenge
This challenge is classified as the limitations underlying structures to drive the adoption of circular economy principles adoption. This challenge is categorized as an external challenge. The road that leads to the Nduba dumpsite is in very bad condition. “I would say the systems in place are not adequate” Company G. “Collaboration is still weak among all the stakeholders, and I would say the main focus, for now, is on waste collection” Company H, “We do not have access to recycling companies except the waste collectors who come on every Thursday to pick our waste” Company I.
5.3 Research question 3: what is the estimated methane (CH4) from Solid Waste Disposal Sites in Rwanda for 2020–2030
In order to estimate the methane emissions, the study estimated the amount of Municipal Solid Waste (MSW) for the period 1960–2030 and the industrial waste for the period 1960–2030.
Amount of Municipal Solid Waste (MSW) deposited in SWDS: This section accounts for the estimated amount of municipal solid waste (MSW) deposited in SWDS annually from 1960 to 2020 and the projections of waste to be deposited from 2021 to 2030.
From Figure 1, the results show that in 1960, 580 Gg of MSW was estimated to be deposited in SWDS. Whereas in 2021, 2,661 Gg of MSW was estimated to be deposited. In 1980, the amount of MSW deposited in SWDS was 1,041 Gg. In 2000, the amount of MSW being deposited increased to 1,581, and in the year 2020, 2,601 Gg of municipal solid waste was estimated to have been deposited. In 2030, the estimated amount of MSW to be deposited at SWDS in Rwanda will be 3,182 Gg.
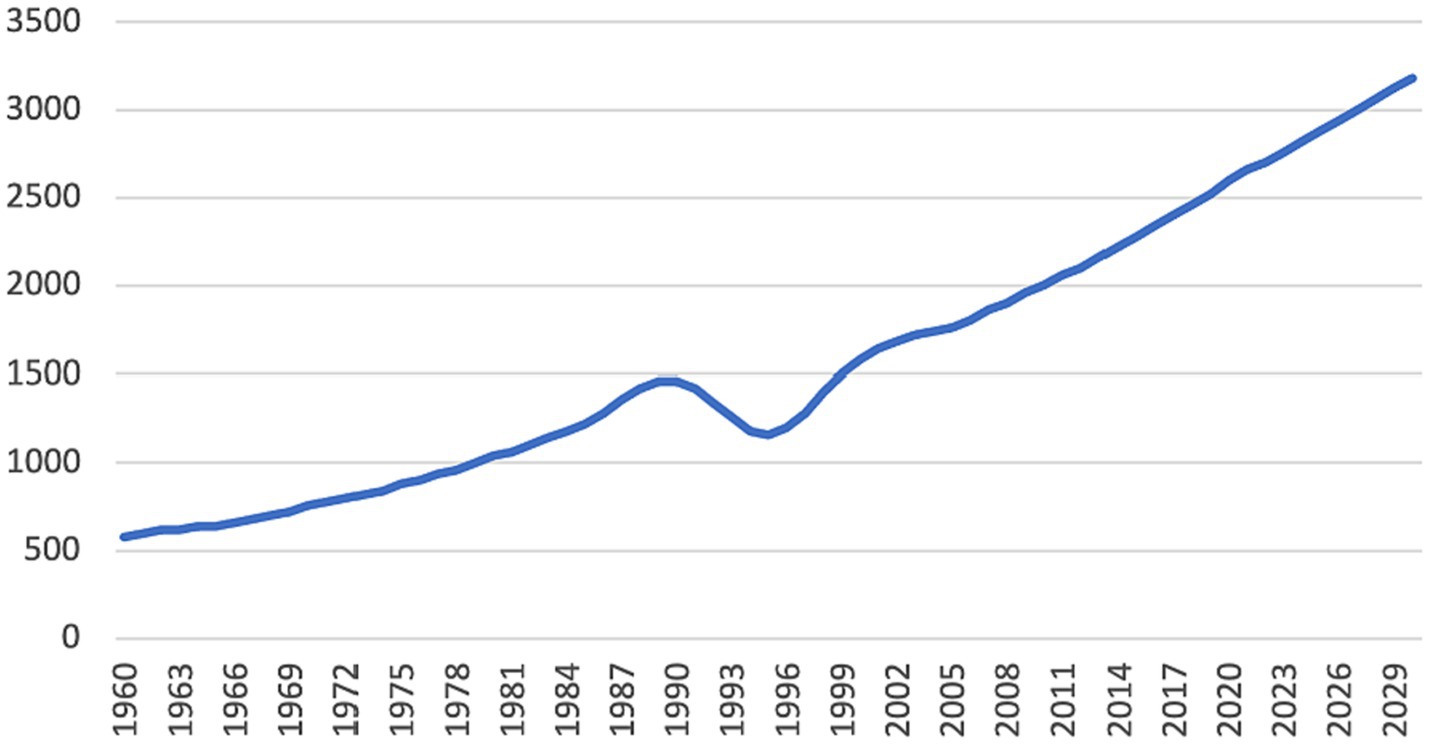
Figure 1. Amount of municipality solid waste (MSW) deposited in solid waste disposal sites (SWDS).
Amount of Industrial waste deposited in SWDS: This section accounts for the amount of industrial waste deposited in SWDS annually from 1960 to 2030. In 1960, the amount of industrial waste deposited was 168 Gg. This study observed that in 1980, industrial waste estimated to have been deposited in SWDS increased to 302 Gg. Figure 2 also shows that in 2000 and 2022, the estimated amount of industrial waste estimated to have been deposited in SWDS was 458 and 754 Gg. In 2030, it is projected that 922 Gg of industrial waste will be deposited in landfills in Rwanda.

Figure 2. Amount of industrial waste deposited in SWDS.
Annual methane emission from SWDS: this section reports Rwanda’s annual methane emissions from SWDS from 1960 to 2030. Using the FOD model, the study estimated the amount of methane emitted in 1965 was 28 Gg CO2-eq. In 1980, the study observed that the annual methane emissions from SWDS had increased to 49 Gg CO2-eq. The results also show that in 2000 and 2020 consecutively, 68 and 122 Gg CO2-eq of methane were estimated to be generated and emitted in SWDS. The results also show that in 2030, it is estimated that Rwanda’s methane emissions from SWDS will be 157 Gg CO2-eq (Figure 3).
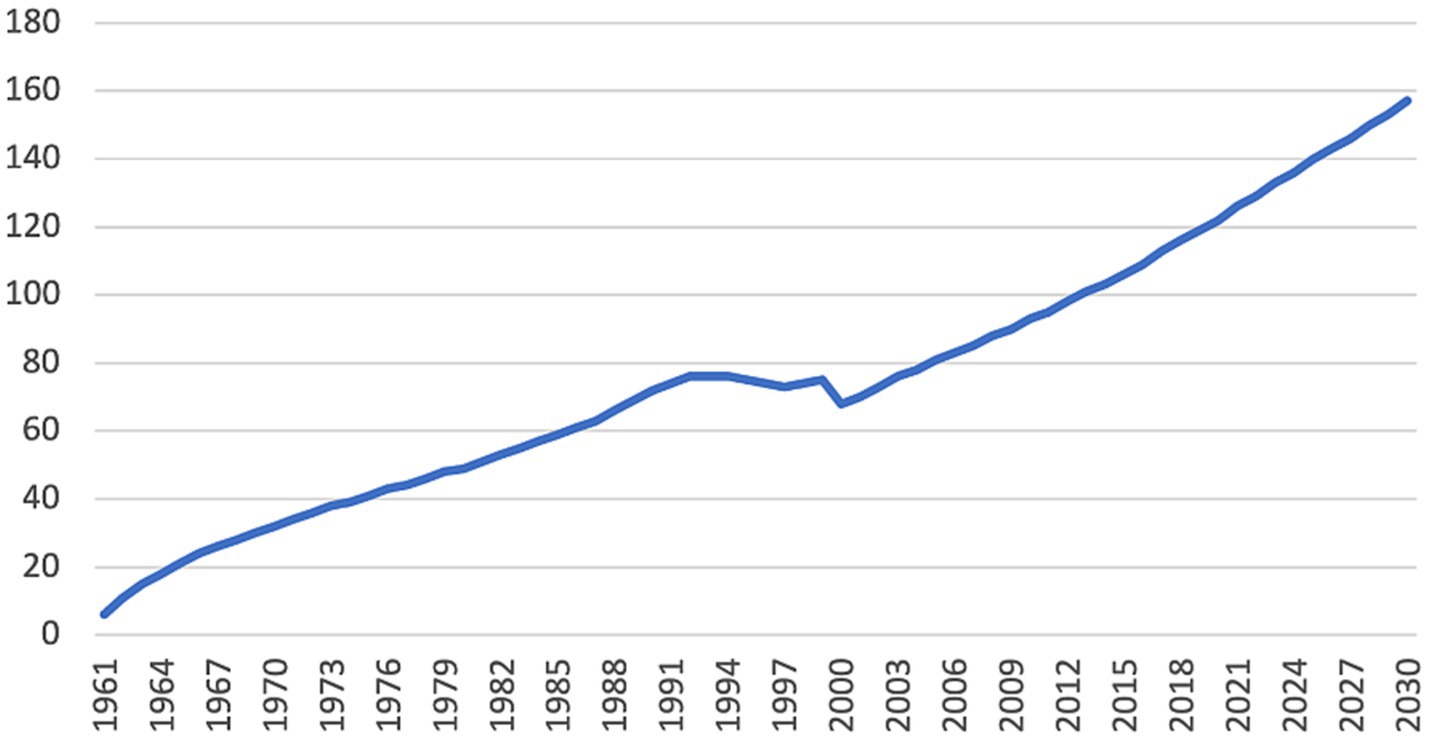
Figure 3. Annual methane emissions from SWDS from 1961 to 2030.
6 Discussion
Based on the 10-R hierarchy, the R-value of R0–Refuse, R1–Rethink and R2–Reduce are indicators that show higher circularity attainment. The results of the data analysis show that the waste management value chain across the upstream (manufacturers) and downstream companies (waste management and recycling) in Kigali needs to adopt a higher level of the 10-R principle of the circular economy. The results illustrate that there is low adoption of other indicators of the 10-R principles among manufacturing companies. Except for R3-Reuse and R8-Recycle, that was highly adopted by manufacturing companies. A study by Andersen et al. (2021) that was conducted among manufacturers in Kenya concluded that especially plastic and glass companies have a high rate of recovered content through recycling, while construction companies have a low recycling rate. Furthermore, the study also concluded that companies might score high on one of CE practices or resources but are struggling to adopt other circular economy practices for other resources. This could partially also explain why not all companies are performing well on all 10-R principles, which have been neglected (Andersen et al., 2021). In this study, R6-Remanufacture (6.20) and R7-Repurpose (8.80) recorded high adoption rates among the waste collection and recycling companies.
High levels of economic, institutional, infrastructural, operational, attitudinal, and technological challenges were prevalent as barriers to the adoption of the 10-R principles of a CE by manufacturing, waste management and recycling companies in Kigali. This result is consistent with the findings of Stanislaus (2018), who found that consumers have a high demand for single-use plastics (SUPs), poor collection patterns of waste, improper storage, poor recycling practices, and careless disposal of waste. Attitudinal challenges have been addressed by different studies, which indicated that there is a drastic need for the involvement of the general public in waste management plans and strategies to make efficient waste recovery a success in East Africa (Guerrero et al., 2013). This can be achieved, for instance, through education and awareness creation among the waste generators on the impact of the waste on the environment and living conditions (Aryampa et al., 2019). The lack of a proper waste management and recycling infrastructure has also been acknowledged by various studies as a significant barrier to adopting CE practices to reduce and reuse waste in African countries. For instance, Aryampa et al. (2019) highlight that the waste is collected according to the capacity of the trucks in the East African Community. According to Godfrey and Oelofse (2017), the lack of waste management infrastructure causes challenges, including access to transport waste, equipment or ways to sort and store recyclables and waste in South Africa. Also, operational challenges cause significant barriers to adopting a successful implementation due to difficulties in market access and the weak capability to operate a business in South Africa (Godfrey and Oelofse, 2017). Institutional barriers have also been identified by the literature. As important challenges to the adoption of the 10-R principles of CE. For instance, Okot-Okumu (2012) also identified that in East Africa, the challenges to proper waste management include weak implementation of waste management policies and poor financing due to low prioritization of waste management. In this study, we do not only recommend investing in (policy) strategies to reduce waste produced but also by identifying CE solutions to design out waste across the system, which can be piloted with the industry and also has been recommended by a study of Nijman-Ross et al. (2023).
The estimated methane (CH4) emission rise from solid waste disposal as indicated in the research findings is also consistent with the findings of Bisong et al. (2021) and Singh et al. (2018) for Nigeria and India. As long as waste generation increases and a lower level of circularity is found in its management, emission levels will continue to rise. However, if higher circularity adoption is attained worldwide in Waste Management, methane emission levels to the atmosphere will be reduced. Since Sub-Saharan Africa is expected to be the world’s fastest-growing region for waste by 2050 (Aryampa et al., 2019), there is an urgent need to adopt circular practices across the system in African countries and economies.
Study limitations
This study was conducted with a limited sample size and has a focus on the state of circularity among waste management among manufacturers, waste management and recycling companies. Building forward on this study, it is recommended to extend the scope of the research among different types of manufacturers and to study the circularity status beyond waste management, especially since an important part of CE research has been focused on waste management (Nijman-Ross et al., 2023) and more research is needed on the state of circularity among manufactures to unlock opportunities in African countries. The timing of the study inherently created a limitation in the terms of securing a significant number of companies in each industry that were willing to participate. Data collection was scheduled a few months after COVID-19 lockdowns. Most of the private sector companies were less willing to give time to any engagement that did not immediately impact profitability.
7 Conclusion and recommendations
This study has revealed the adoption levels of the 10-R circular economy principles by the upstream waste management (manufacturing companies) and downstream waste management (waste collection and recycling companies) are critical for sustainable waste management that ensures a reduction in global warming. The study could not explain the variability of adoption rates of the different R-10 frameworks across the various companies. Even though collection companies recorded a higher adoption rate in Repurpose, the qualitative data highly shows the infrastructure-related supersaturation at the source remains a challenge. To ensure higher circularity of waste management, the following recommendations are made:
7.1 Government
Low adoption of the 10 framework was partly a result of a lack of waste separation at source. Full implementation of waste separation components by manufacturing companies as stimulated by the National Sanitation policy (2016) so that waste disposal companies can separate waste at the source and disposal of the waste in various categories at the solid waste disposal sites (SWDS).
Tax incentives for businesses that adopt a higher level of circularity in waste management and their entire production process.
The implementation of government policies aimed at particularly encouraging recycling companies to reuse, repair, and refurbish.
7.2 Business
Investment in Research and Development for converting energy from waste (CH4) for sustainable energy generation.
Develop capacity building of existing employees to gain requisite skill sets for adopting the 10-R principles across manufacturing, waste collection, and waste recycling companies.
7.3 Educational institutions
In view of the move toward circular and green jobs and the clear indication of skill gaps for adopting circularity principles in this study, more educational institutions in Rwanda should incorporate circular economy programs to their curriculum. Currently, the African Leadership University (ALU) is at the forefront of embedding circular economy in its curriculum within Africa.
7.4 Consumers
Change in attitude and consumer preference for circular products needs to be attained via awareness creation by relevant stakeholders. Emphasis on strict waste separation at source at the household level. This would further be enhanced by a defined was collection regulation that requires waste collection companies to implement a strict solid waste collection system that separates organic and inorganic waste. The same should apply to the collection of recyclable and non-recyclable waste.
Data availability statement
The original contributions presented in the study are included in the article/Supplementary material; further inquiries can be directed to the corresponding author.
Ethics statement
Ethical review and approval was not required for the study on human participants in accordance with the local legislation and institutional requirements. Written informed consent from the participants was not required to participate in this study in accordance with the national legislation and the institutional requirements.
Author contributions
MM, JA, MA, and MO conceived the research project. MM and MA built the database of the literature. JA and MO analyzed the data and interpreted the results of the analysis. EN-R reviewed several drafts, offered valuable suggestions to improve the article, and provided editing support of the manuscript. All authors contributed to the article and approved the submitted version.
Funding
This research was undertaken as part of the Circular Economy Program at African Leadership University (ALU). We thank MAVA Foundation for their support to the program through their contribution to the ALU Circular Economy Program.
Acknowledgments
We thank our students from African Leadership University (Solomom Mutagoma and Pyllis Macharia) for their support in data collection.
Conflict of interest
The authors declare that the research was conducted in the absence of any commercial or financial relationships that could be construed as a potential conflict of interest.
Publisher’s note
All claims expressed in this article are solely those of the authors and do not necessarily represent those of their affiliated organizations, or those of the publisher, the editors and the reviewers. Any product that may be evaluated in this article, or claim that may be made by its manufacturer, is not guaranteed or endorsed by the publisher.
Supplementary material
The Supplementary material for this article can be found online at: https://www.frontiersin.org/articles/10.3389/frsus.2023.1215554/full#supplementary-material
References
ACEA (2021). Five Big Bests for the Circular Economy in Africa: African Circular Economy Alliance. Available at: https://www.weforum.org/reports/five-big-bets-for-the-circular-economy-in-africa-african-circular-economy-alliance/ (Accessed October 20, 2023)
Andersen, M. M., Ogallo, E., and Diniz Faria, L. G. (2021). Green economic change in Africa—green and circular innovation trends, conditions and dynamics in Kenyan companies. Innovat. Dev. 12, 231–257. doi: 10.1080/2157930X.2021.1876586
Aryampa, S., Maheshwari, B. L., Sabiiti, E. N., Bateganya, N. L., and Bukenya, B. (2019). Status of waste management in the east African cities: understanding the drivers of waste generation, collection and disposal and their impacts on Kampala City’s sustainability. Sustain. For. 11:5523. doi: 10.3390/su11195523
Bisong, F, Adetianbe, C, Bisong, E, Adediran, T, Bisong, C, and Akor, J. (2021). “Waste/circular economy (CE) analysis for the enhancement of Nigeria’s nationally determined contribution 2021-2025”. African Development Bank. Available at: https://agdf.eco/portfolio-item/pdf/GHG_Emissions_from_Waste_Management_in_Nigeria__Analyzing_Circular_Economy_Impacts.pdf (Accessed February 2022).
De Jesus, A., and Mendonça, S. (2018). Lost in transition? Drivers and barriers in the Ecoinnovation road to the circular economy. Ecol. Econ. 145, 75–89. doi: 10.1016/j.ecolecon.2017.08.001
Ellen MacArthur Foundation (2013). Towards the Circular Economy. Available at: https://www.ellenmacarthurfoundation.org/towards-the-circular-economy-vol-1-an-economic-and-business-rationale-for-an (Accessed October 15, 2023).
Ellen MacArthur Foundation (2021). The nature imperative: how the circular economy tackles biodiversity loss.
Ellen MacArthur Foundation (2023). Circular Economy Introduction. Available at: https://www.ellenmacarthurfoundation.org/topics/circular-economy-introduction/overview (Accessed November 10, 2023).
Ellen MacArthur Foundation (2022). Universal Circular Economy Policy Goals. Ellen MacArthur Foundation. Available at: https://www.ellenmacarthurfoundation.org/universal-policy-goals/examples#:~:text=The%20Universal%20Circular%20Economy%20Policy,value)%2C%20and%20regenerate%20nature
Geng, Y., and Doberstein, B. (2008). Developing the circular economy in China: challenges and opportunities for achieving “leapfrog development.”. Int J Sust Dev World 15, 231–239. doi: 10.3843/susdev.15.3:6
Godfrey, L. K., and Oelofse, S. H. (2017). Historical review of waste management and recycling in South Africa. Resources 6:57. doi: 10.3390/resources6040057
Green Peace Africa (2020). 34 plastic bans in Africa|a reality check. May 19. Available at: https://www.google.com/search?q=34+Plastic+Bans+in+Africa+%7C+A+Reality+Check&oq=34+Plastic+Bans+in+Africa+%7C+A+Reality+Check&aqs=chrome.0.69i59.737j0j7&sourceid=chrome&ie=UTF-8 (Accessed October 25, 2021).
Guerrero, L., Maas, G. G., and Hogland, W. (2013). Solid waste management challenges for cities in developing countries. Waste Manag. 33, 220–232. doi: 10.1016/j.wasman.2012.09.008
Johnson, R. B., and Onwuegbuzie, A. J. (2004). Mixed method research: a research paradigm whose time has come. Educ. Res. 33, 14–26. doi: 10.3102/0013189X033007014
Kabera, T., Wilson, D. C., and Nishimwe, H. (2019). Benchmarking performance of solid waste management and recycling systems in East Africa: comparing Kigali Rwanda with other major cities. Waste Manag. Res. 37, 58–72. doi: 10.1177/0734242X18819752
Kirchherr, J., Reike, D., and Herkket, M. (2017). Conceptualizing the circular economy: an analysis of 114 definitions. J. Conserv Recycl. 127, 221–232. doi: 10.1016/j.resconrec.2017.09.005
Kirchherr, J., Yang, N. N., Schulze-Spüntrup, F., Heerink, M. J., and Hartley, K. (2023). Conceptualizing the circular economy (revisited): an analysis of 221 definitions. Resour. Conserv. Recycl. 194:107001. doi: 10.1016/j.resconrec.2023.107001
Neves, S. A., and Marques, A. C. (2022). Drivers and barriers in the transition from a linear economy to a circular economy. J. Clean. Prod. 341:130865. doi: 10.1016/j.jclepro.2022.130865
Nijman-Ross, E., Umutesi, J. U., Turay, J., Shamavu, D., Atanga, W. A., and Ross, D. L. (2023). Toward a preliminary research agenda for the circular economy adoption in Africa. Front. Sustain. 4:e1061563. doi: 10.3389/frsus.2023.1061563
Okot-Okumu, J. (2012). Solid Waste Management in African Cities-East Africa. Waste Management-An Integrated Vision. Rijeka, Croatia: IntechOpen.
Potting, J, Hekkert, M.P., Worrell, E, and Hanemaaijer, A (2017). Circular Economy: Measuring Innovation in the Product Chain. Netherlands: PBL Netherlands Environmental Assessment Agency
Reike, D., Vermeulen, W. J. V., and Witjes, S. (2018). The circular economy: new or refurbished as CE 3.0?—exploring controversies in the conceptualization of the circular economy through a focus on history and resource value retention options. J. Resour. Conserv. Recycl. 195, 246–264.
Singh, C., Kumar, A., and Roy, S. (2018). Quantitative analysis of the methane gas emissions from municipal solid waste in India. Sci. Rep. 8:2913. doi: 10.1038/s41598-018-21326-9
Stanislaus, M. (2018). How we can effectively shift to a global circular economy. June 7. Available at: https://www.greenbiz.com/article/how-we-can-effectively-shift-global-circular-economy (Accessed October 25, 2021).
Statista (2023). Median age in Africa 2000–2030. Available at: https://www.statista.com/statistics/1226158/median-age-of-the-population-of-africa/ (Accessed November 4, 2023).
Stocker, T. (ed.) (2014). “Climate change 2013: The physical science basis: Working group I contribution to the fifth assessment report of the intergovernmental panel on climate change”. Cambridge University Press.
The Circle Economy (2021). The Key Elements of the Circular Economy Framework. Available at: https://www.circle-economy.com/resources/the-key-elements-of-the-circular-economy-framework (Accessed February 5, 2021).
The World Bank (2022). Rwanda: Overview. October 03. Available at: https://docs.google.com/document/d/1c_o7LwBKNhGezGYF_mj1pg9TgbDAND8NK1dzQ_doWsc/edit# (Accessed November 15, 2022).
U.S. EPA (2012). International Best Practices Guide for Landfill Gas Energy Projects. Available at:: http://wwwglobalmethaneorg/tools-resources/toolsaspx#three (Accessed October 28, 2022).
Velenturf, A. P. M., and Purnell, P. (2021). Principles for a sustainable circular economy. J. Sustain. Product. Consump. 27, 1437–1457. doi: 10.1016/j.spc.2021.02.018
Keywords: waste management, circular economy, 10-R framework, global warming, recycling, reuse, reduce, Rwanda
Citation: Mulindwa MS, Akor J, Auta M, Nijman-Ross E and Ogutu MO (2023) Assessing the circularity status of waste management among manufacturing, waste management, and recycling companies in Kigali, Rwanda. Front. Sustain. 4:1215554. doi: 10.3389/frsus.2023.1215554
Edited by:
Ioannis Vyrides, Cyprus University of Technology, CyprusReviewed by:
Flávio José Simioni, Santa Catarina State University, BrazilGiacomo Di Foggia, University of Milano-Bicocca, Italy
Copyright © 2024 Mulindwa, Akor, Auta, Nijman-Ross and Ogutu. This is an open-access article distributed under the terms of the Creative Commons Attribution License (CC BY). The use, distribution or reproduction in other forums is permitted, provided the original author(s) and the copyright owner(s) are credited and that the original publication in this journal is cited, in accordance with accepted academic practice. No use, distribution or reproduction is permitted which does not comply with these terms.
*Correspondence: Mike Ssempa Mulindwa, bXNzZW1wYUBhbHVlZHVjYXRpb24uY29t; Jackson Akor, YWtvci5qYWNrc29uQGdtYWlsLmNvbQ==