 Liesbeth De Wilde1*
 Lara Stas2,3
 Perseverence Savieri2,3Lieselot Vanhaverbeke4
 Imre Keserü1
 Cathy Macharis1
- 1Mobilise Mobility and Logistics Research Group, Department BUTO, Vrije Universiteit Brussel, Brussels, Belgium
- 2Core Facility - Support for Quantitative and Qualitative Research (SQUARE), Vrije Universiteit Brussel, Brussels, Belgium
- 3Department of Biostatistics and Medical Informatics (BISI), Vrije Universiteit Brussel, Brussels, Belgium
- 4Electromobility (MOBI) Research Centre, Department Business Technology and Operations (BUTO), Vrije Universiteit Brussel, Brussels, Belgium
Multiple issues are associated with company cars in the academic debate, such as excessive car use and welfare loss. Company cars, provided by organizations to their employees, are often seen as a subsidy for private car ownership throughout Europe, especially in Belgium. Belgium is the first country in Europe to develop a legal framework in which organizations can replace the company car system with alternative solutions such as a corporate mobility budget. The objective of this study was to gain insight into the intentions of employees to replace their company car with this mobility budget. We have carried out an online survey among 527 company car drivers to predict the financial compensation that is required to replace the company car with more sustainable transport modes. On average, respondents required €683 per month to give up their company car. A stepwise linear regression analysis identified familiarity with alternative transport modes, environmental concern, accessibility, and income as the primary predictors of this financial preference. These variables have been proven to be significant predictors of mode choice as well. The findings can help to identify opportunities for generating a modal shift in organizations.
1. Introduction
Commuting is one of the most important travel purposes (Pooley and Turnbull, 2000). However, commuting and work-related trips by car increase congestion and have an adverse impact on the environment as most such trips are carried out in peak hours (De Borger and Wuyts, 2011; Harding, 2014; May et al., 2019). In Europe, many employees are provided with a company car, i.e., “a car that is made available to a worker by his/her company or employer and which may be used for private purposes” (May et al., 2019, p. 2). This phenomenon has been increasing since the car became popular in Europe in the 1960s (Pooley and Turnbull, 2000; Dataforce Transport Environment, 2020; Vanacker, 2020; Vandenbroucke et al., 2020). When the company car is used for commuting and other personal purposes, it is often taxed in a beneficial way for both the employee and the employer. Therefore, company cars are a popular part of the remuneration package and are often used to compensate for the high taxes on labor. Approximately 57% of all newly registered cars in Europe and Belgium are registered by a company (Dataforce Transport Environment, 2020). However, many externalities are associated with the favorable conditions of having access to a company car. First, the cost of the tax benefits is substantial: In Europe, deductions and write-offs for company cars are estimated at €32 billion. Second, company cars drive longer distances than private cars (Laine and Van Steenbergen, 2017; Dataforce Transport Environment, 2020), resulting in higher levels of air pollution and congestion. Additionally, company cars often have larger engines than the average car, and providing company cars encourages employees to find a workplace further away from home (Potter et al., 2006).
Belgium provides a clear example of the association between the favorable fiscal climate of company cars and their negative externalities. The tax burden on labor in Belgium is the highest in the EU (Princen, 2017). Consequently, the subsidies for the private use of company cars are high compared to the European average, as well as their proportion of company cars (Princen, 2017). Simultaneously, Belgium performs poorly on reducing greenhouse gas emissions and air pollution (IRCEL, 2016) and obtained second place in the ranking of the EU Hours spent on road congestion annually (Box, 2019). Despite the pressure of the European Union to reform the Belgian fiscal system of company cars (Princen, 2017), the legislation concerning company cars had not changed much until recently. This is problematic for organizations that would like to take social responsibility and improve climate change by stimulating sustainable travel behavior among their employees. Employees consider company cars as an acquired right and are therefore very reluctant to support policies that impair the benefits of their company car. Due to the negative externalities associated with company cars, a search for alternative measures and solutions has become more pressing.
Considering the European climate accord, many current studies focus on electrifying the car fleet. However, making company cars more environmentally friendly does not reduce mileage. By reducing the number of company cars, modal shift and the avoidance of travel can also be achieved. Since organizations provide company cars for many reasons, most research focuses on understanding and changing government policies. The preferences of the actual user, i.e., the employee, are often overlooked and are essential in the acceptance of a sustainable corporate mobility policy.
Organizations can influence the commuting behavior of their employees in different ways. A combination of restrictive measures that discourage car use with rewarding measures that encourage sustainable alternatives (“sticks and carrots”) is the most efficient (Hole, 2004; Vanoutrive et al., 2010). One of these rewarding measures could be a financial incentive given to employees who decide to give up their company car. If the possibility (or obligation) to exchange the company car for financial compensation is provided, employees might shift toward alternative solutions, or in the worst case, buy their cars, which generally result in fewer kilometers driven. In Belgium, a policy measure called “Cash for Car” (CFC) has recently been introduced, where organizations can allow employees to voluntarily exchange their company car for a cash equivalent. With CFC, Belgium is the first EU country to set up a legal framework for exchanging the company car for a cash equivalent (Jacobs, 2019). The potential success of this measure, in light of reproducing this framework in other European countries, can only be assessed if we gain insight into the preferences of company car drivers. These preferences shape the two research questions of this study: “How effective is financial compensation as an incentive to exchange an employee's company car for more sustainable transport modes in organizations?” and: “What is the minimum level of financial compensation that organizations need to offer to employees to encourage them to exchange their company car for more sustainable transport modes?” With more sustainable transport modes, we focus on transport modes other than the car, e.g., public transport or active travel. The literature suggests a wide range of variables associated with car dependency and mode choice. In our research, we will examine whether these predicting variables also show significant associations with the studied financial compensation. After all, an important aspect of (mode) choice is related to the cost of the available options (Palma and Rochat, 2000; Commins and Nolan, 2011; De Witte et al., 2013). The answers to these questions can help organizations to implement sustainable mobility measures and to identify early adopters.
This study is structured as follows: First, a literature review situates the Belgian company car landscape in a European context and summarizes the variables related to mode choice and car dependency. Second, the methodology to answer the research questions is discussed. Based on an online survey of 527 company car drivers, we used stepwise linear regression to model the variables associated with their required financial compensation. The analysis and the results follow afterward. In the last section, we discuss the results and conclude the article with limitations, corporate and policy recommendations, and recommendations for further research.
2. Brief literature review
2.1. Determinants of mode choice linked to financial preference
Company cars are defined in this research as motorized vehicles that are made available by employers to their employees, which the employee can also use for private reasons. Apart from being a mere instrument to make professional trips, the company car has become an extremely popular fringe benefit because of its beneficial tax treatment. In addition to company cars, organizations can offer more sustainable alternatives such as public transport (PT) passes and cycling allowances, as part of a sustainable management strategy. Pull measures often consist of financial rewards that compensate for the disadvantages of alternative modes of transport, which appears to be a successful measure in promoting sustainable mobility policies (Kingham et al., 2001; Cairns et al., 2010; Van Malderen et al., 2012). Although there is evidence that promoting alternative modes of transport by providing financial compensation leads to a more sustainable mobility behavior of employees, we do not have much insight into the determinants that make certain employees more susceptible to these financial incentives than others.
To gain more insight into which determinants cause a stronger preference for these financial rewards, pushing employees toward a sustainable transport mode, we linked the concept of the choice of alternatives to utility theory, and choice modeling. Utility theory, also known as consumer behavior theory, is based on the individual and rational decision-making process (Barbera et al., 1998; Bacci and Chiandotto, 2019). Choice modeling is based on (random) utility theory and is used to model individual decision processes via revealed and stated preference studies. Utility theory (Zietsman et al., 2006; Susilo et al., 2012) and choice modeling (Goetzke, 2008; Grimaldi et al., 2010; Zhao et al., 2012; Pawlak et al., 2015; Ton et al., 2020) are common methods to predict travel behavior and willingness-to-pay and have often been applied in transport research. The amount of money for which each employee would give up their company car could rationally be explained as a function f (α1, α2, …, αn) of determinants α1, α2, …, αn.
The choice of financial incentives for mobility is most probably based on travel behavior and more specifically the choice of transport mode. Determinants of mode choice and car dependency are widely researched topics. Many systematic literature reviews (De Witte et al., 2013; Lanzini and Khan, 2017; Hasnine et al., 2018; Moniruzzaman and Farber, 2018; Javaid et al., 2020) have identified important indicators for mode choice such as sociodemographic indicators (e.g., age, gender, occupation, and car availability), journey characteristic indicators (e.g., departure time and trip chaining), and spatial indicators (e.g., density and parking availability), all three affecting socio-psychological indicators (e.g., familiarity and lifestyle). Moreover, younger generations are said to prefer collective and active modes of transport, are less car-dependent, and are less focused on car ownership (Hjorthol, 2016; L'Hostis et al., 2016). The literature on determinants of mode choice in a corporate context is less widespread and mainly focuses on commuting only. However, company cars can also be used for private purposes, and one effect of providing company cars is the increase of private kilometers driven. The choice of transport mode for commuting to work is said to be explained by individual characteristics (e.g., household composition and income), contextual characteristics (e.g., congestion), and mode characteristics (e.g., travel time and cost) (Palma and Rochat, 2000; Commins and Nolan, 2011). Additionally, parking possibilities, accessibility of the workplace, working sector, working hours, and the amount of professional trips play an important role in the mode choice of commuters (Wilson, 1992; Vandenbroucke et al., 2020). Cornelis et al. (2012), Derauw et al. (2019), and Vandenbroucke et al. (2020) confirmed that having access to a company car is an important determinant of mode choice. The number of researched determinants of mode choice and car dependency is substantial and shows the complexity of decisions related to travel behavior. However, the connection between these determinants and the concept of corporate mobility budgets and financial incentives for mobility has not been investigated.
2.2. Belgian company cars in a European context
In total, 87% of the European company car market is held by eight countries: Belgium, the Netherlands, Germany, France, Italy, Poland, and Spain. In Belgium, the company car is the most heavily subsidized by the government, estimated at 6,542 € per car on average (Dataforce Transport Environment, 2020). By subsidies, we refer to tax advantages going to both employees and employers. Princen (2017) estimated a Belgian average subsidy of 2,763 € per vehicle per year, similarly being the highest of the 27 OECD countries studied. In her calculations, the indirect effect that part of the tax advantages for employees will be reflected in lower wages has been also taken into account. In the Netherlands and the UK, the opposite holds true: Company cars are not subsidized, and a company-registered vehicle generates more tax than a private vehicle (Dataforce Transport Environment, 2020). In Europe, vehicles registered through the corporate channel drive on average 2.25 times further than private cars. The estimations in Belgium are similar (May, 2017). In Belgium, owning a company car generates an increase in commuting by 58.2 kilometers per week and an increase in private trips by 8.2 kilometers per day (Laine and Van Steenbergen, 2017).
Company cars are often seen as a catalyst for new vehicle technologies to penetrate the private market and throughout Europe, and measures are taken to greenify the car fleet. In 2019, 5% of the company cars in Belgium were low or zero-emission vehicles (BEV or PHEV) according to Dataforce Transport Environment (2020), compared to the European average of 3.7%. In the Netherlands, this percentage went up to 20% as a result of heavy subsidizing (Dataforce Transport Environment, 2020). However, clean technologies should be combined with reducing the kilometers driven to reach the climate challenges and increase the quality of life of citizens. Between 1995 and 2008, the UK significantly reduced the number of company cars per capita by 31% with the help of radical system changes such as the fuel scale charge (Le Vine et al., 2014). For many countries such as Belgium, more drastic changes are not supported by many stakeholders such as employers and employees. Recently, Belgium tested more soft solutions to reduce the numbers of company cars. The first measure is cash for cars (CFC), implemented in 2018, where organizations can give their employees the possibility to exchange their company car for a financial compensation, based on the catalog value and CO2 emissions of the company car (Vanderhoven, 2020). This compensation has the same fiscal benefits as the company car. In Table 1, some examples of CFC compensations for different car models are shown, calculated from data provided by Van Bever et al. (2018). The second measure is called the corporate mobility budget (MB) which was implemented in March 2019 (De Craecker, 2020). The employer can allow the employee to use this budget, calculated from the total cost of ownership (TCO) of the company car, to spend it on a more environmentally friendly car, supplemented by more sustainable transport modes and a (fiscally beneficial) financial compensation.
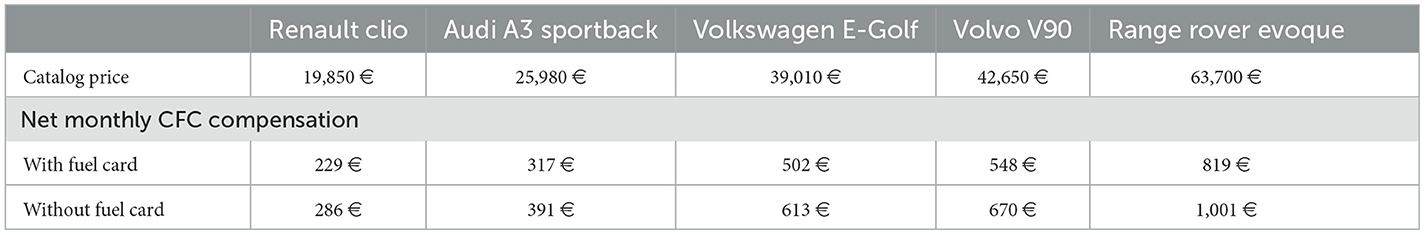
Table 1. Examples of CFC compensation for company cars, based on Van Bever et al. (2018).
Both measures are completely voluntary for organizations and employees. This indicates the reluctant attitude of the government to abolish the fiscally beneficial system of company cars altogether. Vandenbroucke et al. (2020) discussed the impact of an obligatory budget, which reduced the number of company cars to zero. Abolishing the system of company cars and replacing it with a (obligatory) mobility budget, as a more drastic measure, could significantly reduce the amount of kilometers driven by car. Almost a year after the implementation of a mobility budget, the take-up of both alternatives has been low: Only 0.011% of the eligible employees use a mobility budget, and 0.175% use the CFC arrangement (De Craecker, 2020). Zijlstra (2016) explained the various challenges of a preliminary form of the Belgian mobility budget from the employees' perspective and similarly concluded that the interest of company car drivers in these alternatives was still very low. However, the study did not consider the more recent mobility solutions, such as Mobility as a Service (MaaS) and electric vehicles.
Despite the growing numbers of company cars in Belgium, industries and governments collectively make efforts to reduce climate change, including the electrification of the car fleet. By 2026, zero-emission company cars will remain fully deductible from company tax, and tax incentives will be provided for the installation of charging stations at home and at public charging points (Winckelmans, 2020). As a result of past and upcoming regulations in Belgium, the average CO2 emissions of new car registrations have decreased by 20% in the past decade and are expected to continue declining (Febiac, 2020). In 2021, 21% of the newly registered company cars were ZLEV compared to 7% on the private market (Febiac, 2022). However, there are currently also issues associated with electric vehicles, such as limited charging infrastructure and higher purchase costs.
As demonstrated in the preceding paragraphs, a more sustainable approach to employee mobility in Belgium is pressing. Our study aims to provide evidence of the low take-up of the recently introduced soft measures (e.g., CFC and mobility budgets) by company car drivers by focusing on the preferences of the individuals for a financial compensation.
2.3. Sustainable mobility as part of a CSR strategy
Sustainable organizations can contribute to reducing climate change, air pollution, and congestion by facilitating sustainable commuting habits among their employees. The role of sustainable mobility in Corporate Social Responsibility (CSR) and CSR initiatives within organizations has not been thoroughly researched to date. Initial studies in management science found that initiatives promoting sustainable corporate mobility as part of a broader CSR strategy are often considered peripheral and lack legitimacy. This, in turn, impedes their adoption and implementation (Volz-Tollet, 2021). However, as demonstrated previously, a more sustainable way of thinking about the mobility of employees is pressing. The high increase in fuel prices in Europe contributes to the debate. Since company cars often come with unlimited fuel, employees lack financial incentives to reduce gas use on the one hand, and organizations question the profitability of providing company cars on the other hand.
Ramaekers et al. (2010) describe a lack of scientific research on the issue of company cars and sustainable corporate mobility policies. A possible reason for this is that these topics transcend the mobility domain to fiscal studies and studies in Business and Human Resource Management. In this study, the topic of sustainable corporate mobility is approached from the perspective of travel behavior. Although evidence suggests that promoting alternative transport modes (e.g., by providing financial compensation) can lead to a more sustainable mobility pattern (Cairns et al., 2010; Van Malderen et al., 2012), we do not have much insight into the determinants that make certain employees more susceptible to these policies than others. Gaining more insight into these determinants can help organizations identify early adopters of sustainable mobility measures, such as providing company bicycles instead of company cars.
3. Method
To answer the research questions, a survey among Belgian employees with access to a company car was carried out in April 2018. The respondents were selected based on a convenience sample, through a panel provided by Survey Sample International (SSI). Quota sampling has been applied to be able to guarantee a minimum level of representativeness. We have set quotas for region, age, and gender, based on similar studies. The population consists of employees and company directors with a company car living in Belgium. A total of 621 respondents filled in the survey, and after cleaning the data, 527 observations remained.
The dependent variable is the monthly financial compensation that respondents expect to exchange their company car for (i.e., the required increase in their net salary), this has been asked of every respondent in an open-question numeric format [“In exchange for what net monthly amount (which will be taxed in the same way as your company car), would you be ready to trade in your company car and—if applicable—fuel card?”]. This question pertains to the respondents' expected financial compensation should their company car be canceled, whatever their attitude to this cancelation may be. The response was mandatory, but every respondent that gave a response equal to 0 or ≥2,500 was removed from the analysis. The value “0” was considered an ambiguous value since it contains additional meanings than just an amount of money, e.g., the respondent does not know or the respondent is not at all prepared to exchange their company car for a financial compensation. Second, we consider a monthly compensation of 2,500 EUR and higher to be impractical and unrealistic. In the analysis, they were clearly defined as outliers and were therefore removed from the analyses because they might negatively impede the modeling results. After removing these observations, 438 responses remained.
The independent variables can be categorized into five groups: sociodemographic, work-related, attitudinal, mobility-related variables, and variables specifically related to corporate mobility. The attitudinal variable is based on the preference of the respondents in exchanging their company car (and fuel card) for financial compensation. This was asked in the following manner:
“If you could decide to exchange your company car (and fuel card) for additional salary that is taxed in the same way as your company car, which choice would you make?”
• I would probably not choose this option.
• I would consider trading my company car for additional net salary to purchase my own car.
• I would consider trading my company car for additional net salary that I wouldn't immediately spend.
• I would consider trading my company car for additional net salary to cover other modes of transportation for myself and/or my household (e.g., (electric) bicycle, motorcycle, public transportation, etc.).
• I would consider trading my company car for additional net salary to expand my employer-provided package of fringe benefits (group insurance, pension contributions, extra vacation days, etc.).
In this study, we investigate the possibility of removing the company car altogether and replacing it with an amount of money. It is thereby important to measure not only the preferences of the group that is already willing to do so, i.e., the low-hanging fruit, but also the preference of those who are harder to be convinced, i.e., the employees who are more dependent on their company car. Additionally, we would like to point out the difference between the dependent variable and this attitudinal, independent variable. The attitudinal independent variable measures the interest in a mobility budget. The dependent variable, however, measures the amount of money that people would require if a voluntary or obligatory mobility budget is in place, or if the system of company cars is abolished altogether. The complete list of independent variables, as well as their references from the literature, can be consulted in Appendix A. Language (Dutch or French) has been set as a control variable.
The data were then analyzed using stepwise linear regression with the ordinary least square (OLS) method. Linear least square regression analysis is an effective technique to examine the linear relationship between a continuous dependent variable and a wide range of categorical or continuous independent variables (Guthrie, 2020). The analysis aims to predict the required budget by using as few predictors as possible, selecting from a very wide range of possible predictors, which have all been discussed in the literature as being important factors influencing mode choice and car dependency. The stepwise regression technique can reduce the risk of overfitting. We opted for a bidirectional elimination by manually adding and excluding variables and, therefore, by relying on judgment for the selection and removal of independent variables. The analysis was made using the R software (R Core Team, 2019) and consists of the following five steps, based on the recommendations of Chatterjee and Hadi (2012). First, we explored the correlations within different groups of variables in explorative plots to examine which variables are the most important and how they are mutually correlated. Second, we made separate simple linear regression models with each independent variable and ranked these variables from lowest to highest p-value based on their F-statistic. The third step was to build the regression model. We started with a forward model building by adding the predictor with the lowest p-value to the model and continued adding one predictor at a time, using model comparisons [anova()-function in R], until the latest added predictor showed no improvement in the adjusted R2. We also removed any independent variable that became insignificant in the new model and restarted the forward process. In the process of model building, we opted to consider all marginally significant variables (p < 0.10; i.e., the Alpha-to-Enter significance level). When the addition of a new variable did not show any further additional improvement in the adjusted R2 and all variables were significant at the Alpha-to-Enter significance level, the stepwise model-building procedure was completed. The estimates of the ordinal independent variables are calculated using orthogonal polynomial coding. This is because, when we treat ordinal variables as continuous variables, this would lead to incorrect estimates and interpretations. After all, there is no equal spacing between the different levels of ordinal predictor variables. Treating them as nominal variables would lead to a loss of information about the order between the different levels. Orthogonal polynomial contrasts offer a solution by considering the ordered nature of the categories without assuming equal spacing between them. The contrasts capture and examine the linear, quadratic, and cubic trends within the categorical variable (cfr. .L, .Q and .C in Table 4). In a fourth step, we checked for multicollinearity of this final model, measured with the Variance Inflation Factor (VIF) (Akinwande et al., 2015). The last step in our analysis was to examine the assumptions of the final model through a residual analysis. Some deviation from normality was observed by inspecting a QQ plot which was solved using a square root transformation. Because both the untransformed and transformed models yielded identical results both in terms of the sign and the significance, we opted to report the untransformed model for ease of interpretation. The final model is estimated by means of following equation:
With .L, .Q, and .C representing the linear, quadratic, and cubic terms of alternative mode. Income consisted of five distinct categories: 1 ≤ 1,000€; 2 = 1,001–1,500€; 3 = 1,501–2,000€; 4 = 2,501–3,000€; and 5 ≥ 3,000€.
4. Results and analysis
4.1. Sample description
The most relevant descriptive statistics are displayed in Table 2. There are no statistics available about the exact demographics of Belgian employees who have access to a company car; therefore, we were not able to compare and examine whether these numbers are representative of the population. Consequently, we did not weigh the variables. However, the demographic data of the samples used in the research of BELDAM (Cornelis et al., 2012), Zijlstra (2016) and Vandenbroucke et al. (2020) are similar, with the main difference that our sample is slightly younger: 25% of the respondents are under 30 years, compared to 5% in the study of Zijlstra (2016) and 1% in the study of Cornelis et al. (2012). Most of the respondents in the survey were male (65%), Dutch-speaking (57%), and between 25 and 54 years of age (70%); 65% of the respondents earned between 1,501 and 3,000 euros net per month. Approximately 12% did not answer the question about income. Because we wanted to include this absence of response in our analysis as a separate response category, we treated the variable income as categorical instead of ordinal.
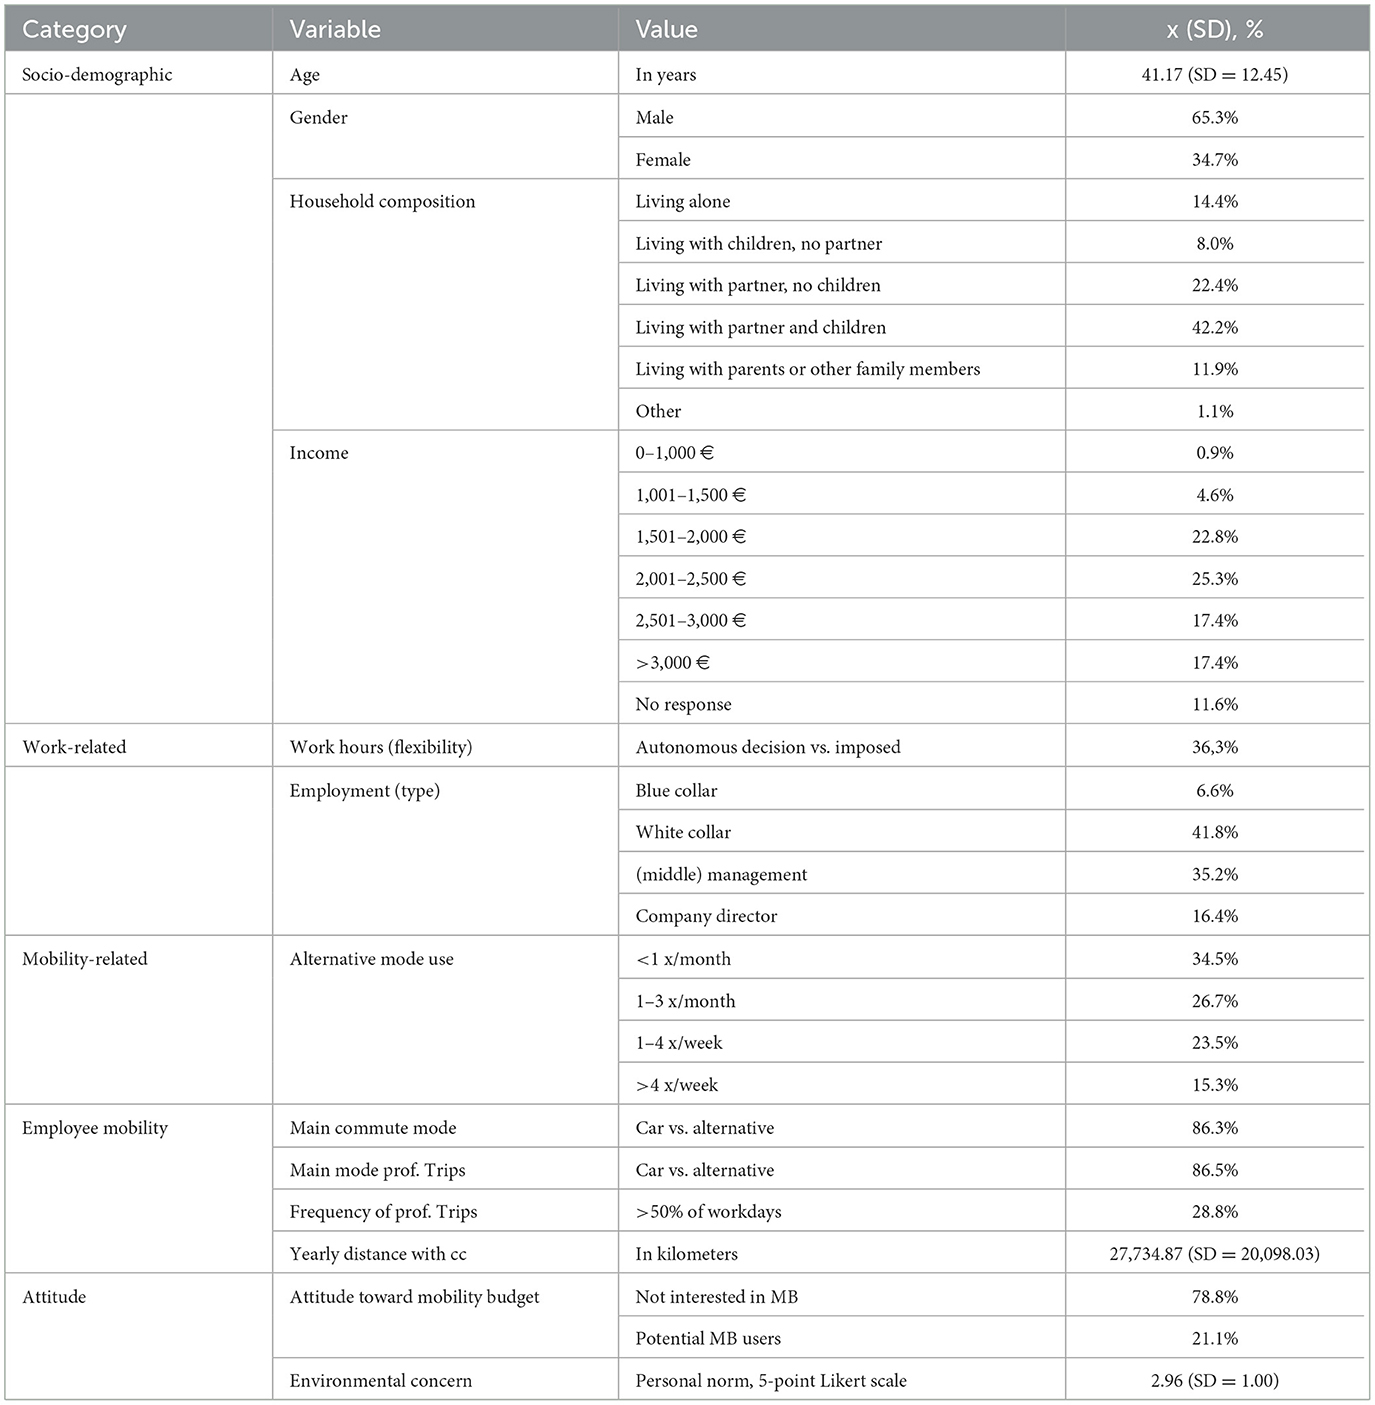
Table 2. Descriptive statistics of the independent variables.
The majority (54%) traveled more than once per week for professional purposes (commuting excluded). The respondents estimated to drive on average 27,735 km per year (SD = 20,098.03; n = 389) with their company car. For comparison, actual data show that the average company car travels 28,094 km per year. A privately owned car travels 14,770 km (Kwanten, 2018).
The frequency of use of different transport modes, for both private and professional trips, is summarized in Figure 1. In total, 80% of the respondents drove their cars almost every day. Being a car passenger was the second most used transport mode, and 75% of the respondents used public transport less than once a month or never. In the regression model, it did not seem appropriate to include all the frequencies (ordinal) and transport modes (categorical) separately, due to the limited sample size per subgroup and theoretical implications. Therefore, we have grouped these variables into one ordinal variable (alternative mode use), describing the frequency of using alternative transport modes in general (including a car as a passenger).
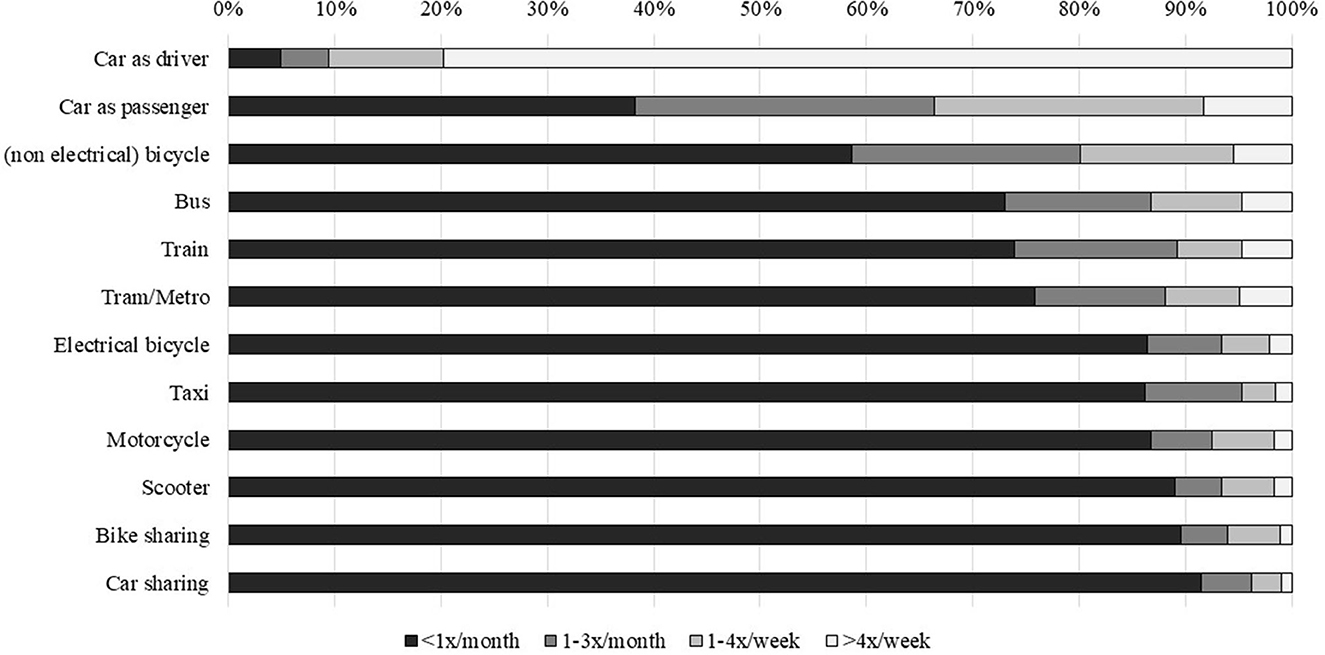
Figure 1. Frequency of the use of transport modes for private and professional trips (n = 438).
Additionally, the interest of company car drivers in the mobility budget (without the option to choose a car) and the environment was explored. Based on the preference of exchanging their company car (and fuel card) for financial compensation, respondents were categorized into two groups, coded in the binary variable attitude toward mobility budget. The first group consisted of respondents who were not willing to exchange their company car for an amount of money (55%) and respondents indicating that they would buy their own car (25%). The second group was considered to be possible (future) users of the mobility budget (MB), or in short: potential MB users. This group (20%) indicated that they would probably choose the option to exchange their company car for financial compensation that they would not immediately spend on their private car. We consider the potential MB users to be potential non-company car users of the future. However, it is important to notice that only 5% of our respondents would consider trading their company car for additional net salary to cover other modes of transportation such as bicycles and public transport. Another 5% would spend this salary on other extralegal benefits such as paid leave, and the remaining 10% would not immediately spend this salary.
Based on four questions on a five-point Likert scale, validated by Petschnig et al. (2014), an average score for “environmental concern; personal norm” has been calculated, regarding fuel types (internal Cronbach's α = 0.92). We treat the variable as if it was a continuous variable, and since the variable approximates a Gaussian distribution (skewness = −0.18, kurtosis = 2.63), the sample is large enough and there are at least five categories (Grace-Martin, 2008).
The dependent variable of the linear regression analysis comprises the financial compensation for which respondents would be willing to trade in their company car. On average, this amount was €682.81 (SD = €431.47). Figure 2 shows the comparison of the required financial compensation between car dependents and potential MB users, by performing an independent sample t-test. Our data confirm that the average financial compensation required by the group that was not interested in a mobility budget (as measured by the question on the attitudinal variable) is significantly higher (€740.97) than for potential MB users (€467.55). Additionally, one-way ANOVA has been performed comparing the required compensation of the respondents in each response group (i.e., response 1 to 5 instead of turning it into a binary variable). The results of the one-way ANOVA revealed significant differences in the required compensation among the various response groups (F(4,428) = 15.75, p < 0.001). Post-hoc Tukey–Kramer tests indicated that respondents who were not ready to exchange a company car for cash (response 1; M = €825, SD = $428) required a significantly higher compensation compared to the other respondent groups; those who would choose to buy a car (response 2; M = €583, SD = $401); other transport modes (response 4; M = €373, SD = $213); extralegal benefits (response 5; M = €497, SD = $394); and those who indicated to not spend it on any of those (response 3; M = €497, SD = €369) with p < 0.01.
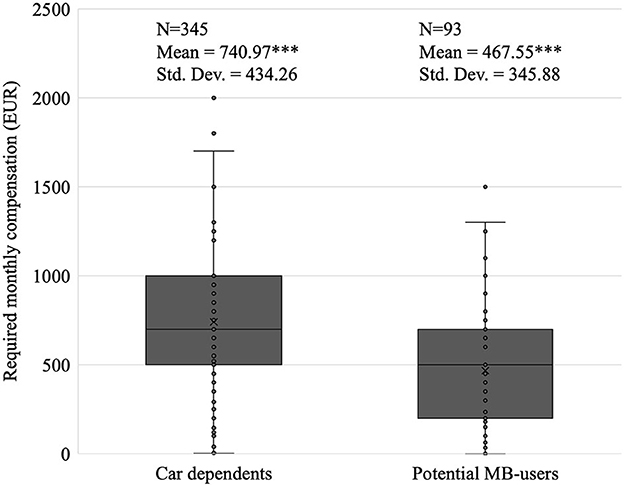
Figure 2. Average of required monthly financial compensation for which a company car could be exchanged.
4.2. Stepwise linear regression model
Since the linear regression analysis was primarily intended to be exploratory, i.e., to map possible associations, we included a wide selection of variables in the survey, and the lack of statistical significance concerning the influence of certain variables was considered equally valuable as finding significant effects. We started with a broad range of independent variables that are claimed to be relevant in determining mode choice and/or car dependency in the literature and looked at their correlations using explorative plots (see Figure 3 and Appendix B). First, we assumed that the demographic variables, such as age, gender, household composition, number of children living at home, urbanization level of residence, education, and income, could be associated with the required financial compensation. These variables have shown no high correlations with the required financial compensation (|R| = [0.09–0.18]), and neither did they show a strong mutual correlation. We made similar explorative plots for variables in the remaining categories (see Appendix B), and no strong mutual correlations were found within the groups of variables.
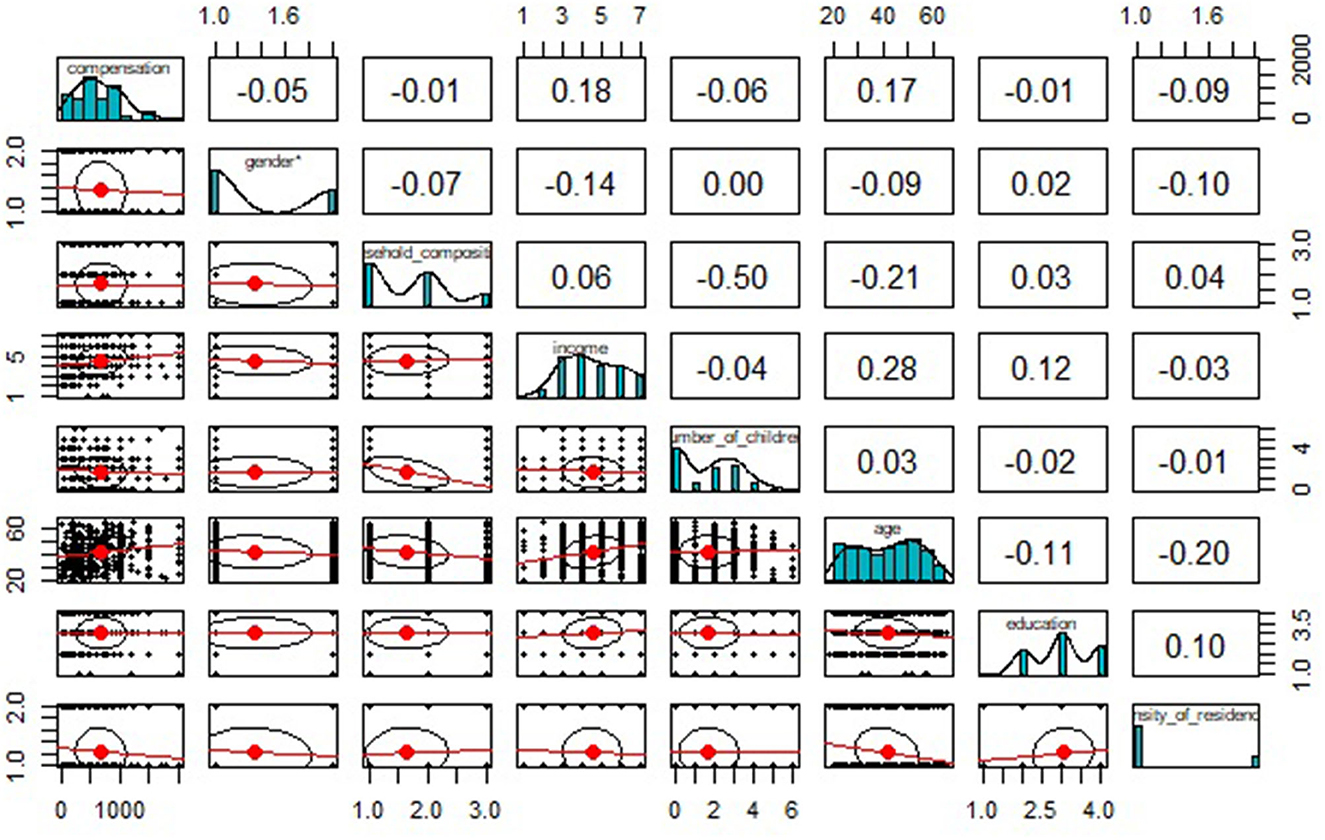
Figure 3. Visual representation of the correlation among sociodemographic variables (n = 438), created using the R package psych (Revelle, 2020).
After exploring the different variables and their mutual correlations, separate simple linear regression models were ranked from lowest to highest p-value of their F-test (see Table 3). The independent variable attitude toward the mobility budget showed the most significant association with the dependent variable (p < 0.001). Of the 26 variables studied, 17 appeared to have a statistically significant association with the dependent variable. Based on the literature, we expected the household composition and the number of children to show a significant association with the dependent variable, because it affects how often people chain trips and therefore it would affect the dependency on their (company) car (De Witte et al., 2013; Oakil et al., 2016). However, these variables did not show any significant relationship with the dependent variable.
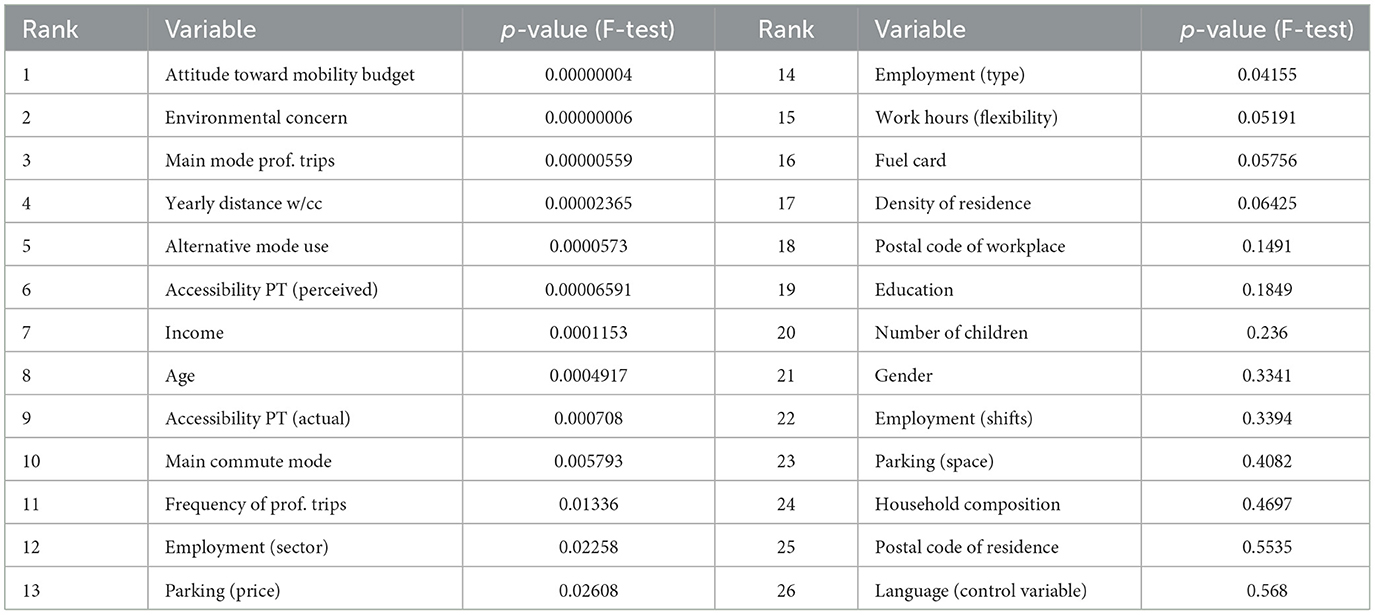
Table 3. Ranking of independent variables from lowest to highest p-value (F-test of single linear model).
Next, we built the regression model by iteratively including the independent variable with the lowest p-value. After adding income to the model, the main mode of professional trips became insignificant, and therefore we have removed it from the model. The F-statistic of the model comparison (ANOVA) also indicated that the model with main mode of professional trips included showed no significant improvement (p = 0.266) compared to the model with this variable excluded. An interaction term between the variables' environmental concern and attitude toward MB was added to the model as preliminary analyses suggested that the relationship between attitude toward MB and financial compensation is moderated by the environmental concern. In Table 4, one can find the details of the final regression analysis (multiple R-squared = 0.202, adjusted R-squared = 0.174) in which we model the expected financial compensation (n = 438).
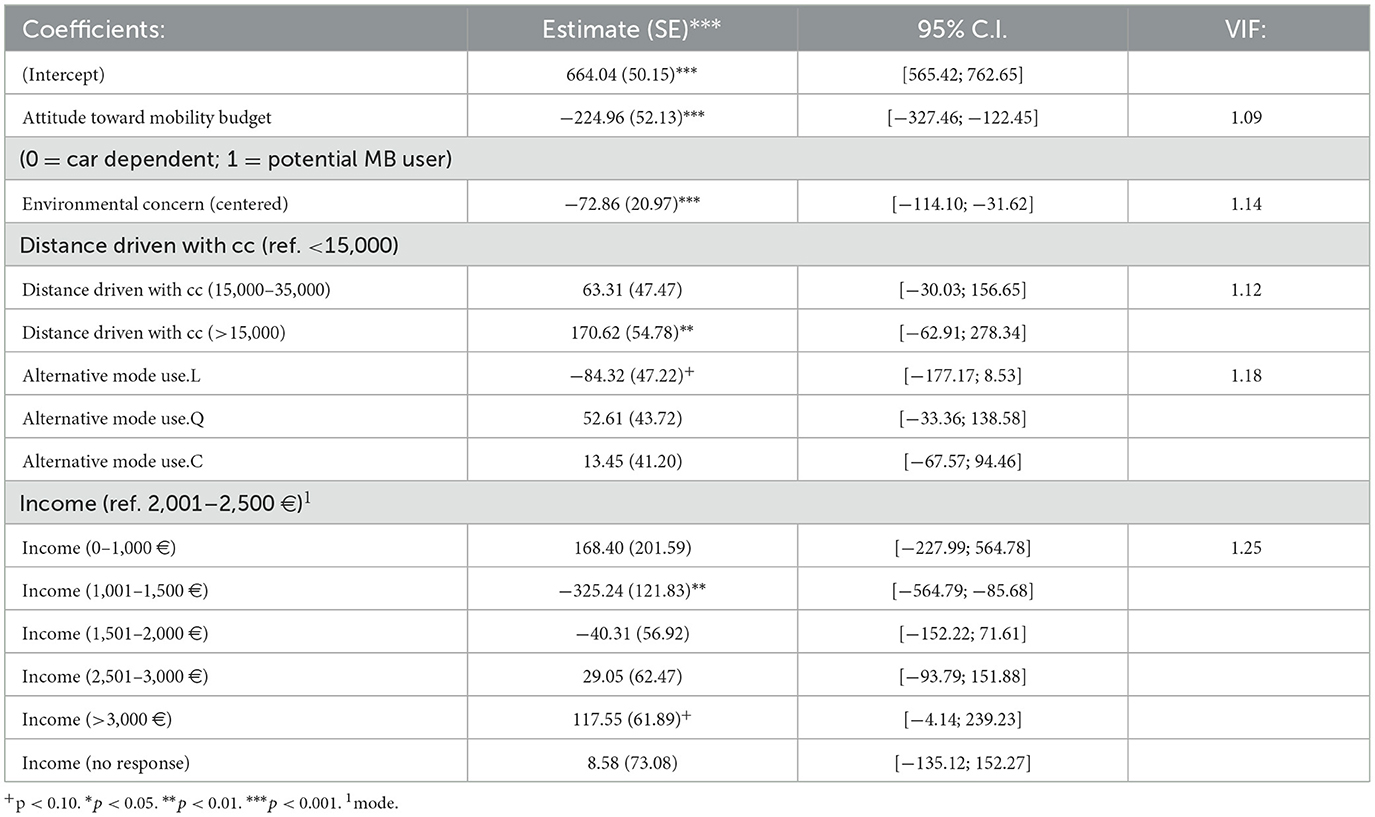
Table 4. Details of final regression model.
From the intercept, we can derive that a respondent categorized as a car-dependent (attitude toward MB = 0), with an average score for environmental concern, an average income (2,001–2,500 euros), who drives between 15.000 and 35.000 kilometers per year, is predicted to give up their company car for an amount of 664.04 euros. The model shows significant effects for the following variables. First, the acceptance of a mobility compensation (attitude toward MB) being the most significant one (b = −224.96, p < 0.001), followed by environmental concern (b = −72.86, p < 0.001). The next predictor is the respondents' estimation of the annual kilometers driven with their company car, showing that those who drive more than 35.000 kilometers per year require significantly more compensation (b = 172.62, p = 0.002). We found evidence for a linear relation with the ordinal variable alternative mode use (cf. L). Meaning that respondents who are already familiar with alternative transport modes need a lower compensation to be convinced to give up their company car (b = −84.32, p = 0.075). Income is the last predictor in the model: those who earn 1,001–1,500 euros per month (b = −325.24, p = 0.008) expect a significantly lower amount than respondents in the reference category of 2,001–2,500 euros. Respondents earning more than 3,000 euros per month expect a significantly higher amount (b = 117.55, p = 0.058). The variance inflation factor (VIF) of all the independent variables was close to 1, signifying the absence of multicollinearity.
The interaction effect between the attitude toward MB and environmental concern was found to be significant at first but turned insignificant when adding the number of kilometers driven to the model. For the participants who were willing to give up their company car (attitude toward MB = 1), their required compensation did not seem to depend largely on their degree of environmental concern. For participants who were not willing to give up their company car (attitude toward MB = 0), the more participants were environmentally concerned, the lower their required compensation tended to be. When these participants were highly concerned with the environment, their required compensation tends to be almost identical to that of the participants who were willing to give up their car. However, since it became insignificant when adding a stronger variable to the model, we have left this interaction effect out of the final equation, resulting in a more nuanced interpretation.
After the final model was constructed, its residuals were inspected to check the assumptions. The descriptive statistics of the residuals (Q1 = −255; median = −36; Q3 = 190), as well as a visual inspection through a QQ plot, showed that the data were slightly skewed. By taking a square root transformation of the data, the residuals became normally distributed. Fitting our final model on these transformed data yielded similar results in terms of statistical significance and the sign of the estimates as well as in terms of the adjusted R2. As similar conclusions can be drawn, and for ease of interpretation, we opted to show the results of the untransformed data. The residual analysis and the results of the transformed model can be consulted in Appendix C. Table 5 contains the Type III tests for the variables of the selected model, because these can give insight in the significant main and interaction effects instead of focusing on the parameter estimates of the (dummy) variables.
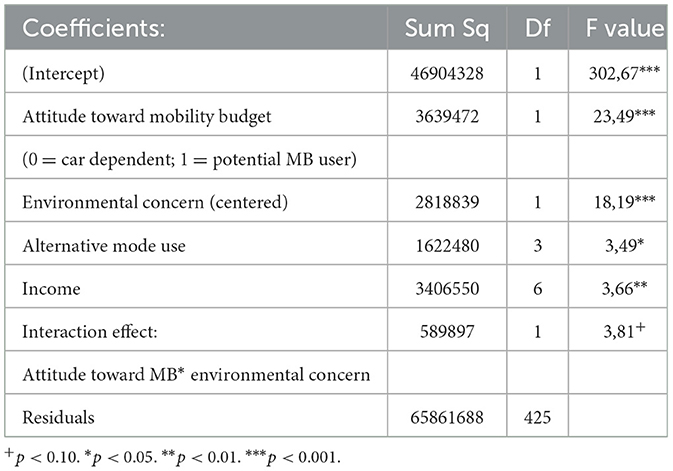
Table 5. Type III tests of the final linear regression model.
4.3. Logistic linear regression model
In addition to the linear regression analysis exploring the amount of financial compensation required to exchange the company car, we examined the differences and similarities of both subsamples with a logistic regression analysis. This analysis aims to verify the assumptions that both subsamples differ fundamentally in terms of their choice for mobility options (car or alternative modes) by comparing the sociodemographic, attitudinal, and work-related characteristics of the subsamples using a binary logistic regression model using the R software. The process of bidirectional elimination has also been applied to building the maximum likelihood model, with the final model estimated using the following equation:
where p refers to the probability of belonging in the non-car-dependent subsample, and xi (i = 1, … n) are the independent variables (Febres et al., 2020).
Table 6 shows the results of the model. We could reject the null hypotheses (by using the Alpha-to-enter significance level of 0,10) that both subsamples are equal in terms of age, environmental concern, urbanization level of their workplace, and the use of the car as a main transport mode for conducting professional trips. The subsamples did not differ significantly (p > 0.10) in terms of most sociodemographic variables such as gender, income, and profession, so these variables were eliminated from the model. However, a substantial number of variables related to attitude and mobility were considered statistically significant. This indicates that both subsamples would make different choices in real life.
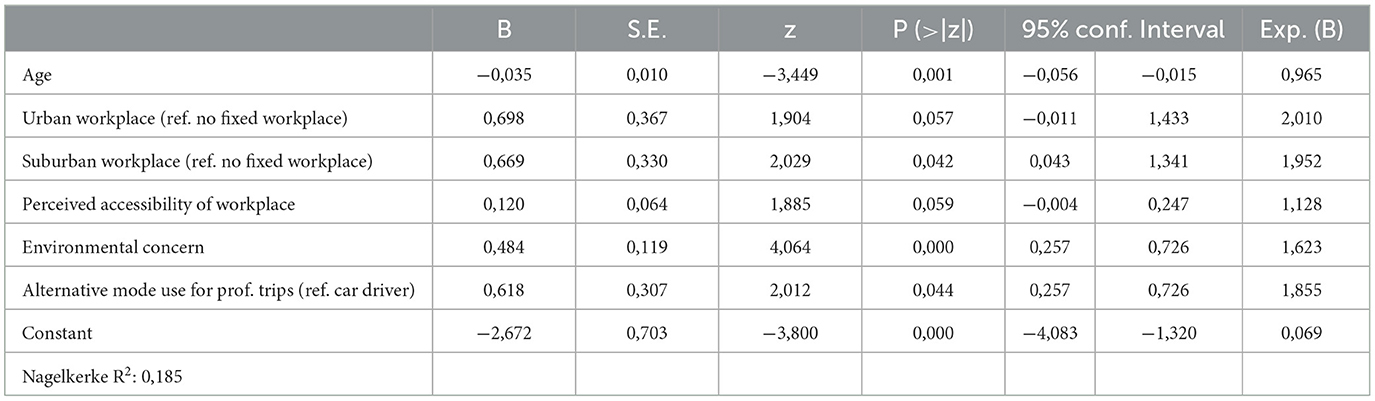
Table 6. Factors associated with the probability of belonging to the non-car-dependent subsample, using stepwise logistic regression.
The odds of belonging to the non-car-dependent subsample are higher when one is younger, has no fixed workplace, and uses alternative transport modes to make professional trips. The odds are also higher when the respondent perceives that it is easier to reach their workplace with public transport, and when one is more concerned with the environment. In turn, the respondents who are categorized as car dependents rely more on their car and are therefore less likely to exchange their company car for a financial incentive or any other alternative transport mode.
5. Discussion and conclusion
Facilitating sustainable corporate mobility is a way for sustainable organizations to reduce climate change, air pollution, and congestion. Earlier studies have shown that alternative transport choices among employees can be successfully promoted by providing financial compensation (Van Malderen et al., 2012). Organizations can offer additional wages to employees in return for their company car to encourage more sustainable mobility behavior. However, not all employees may be willing to exchange their cars for financial compensation. In this study, we analyzed the (reported) preferences of employees regarding the financial compensation for which they would exchange their company car. The average monthly compensation that respondents require to give up their company car is €683 (SD = €431). We found that 45% of our sample would consider trading their company car for a monthly financial compensation. Moreover, 20% also indicated that they would not buy their own car with this compensation. This group was called potential MB users, i.e., they are potential non-car users. The remaining 80% indicated that they will continue to use their car (with the car being owned privately or by their employer) if it can be exchanged for financial compensation. This distribution is similar to the results of the Company Cars Report by Fleet Profile (2017): 78 vs. 22%. Only 5% of our respondents would consider trading their company car for an additional net salary to fully cover other modes of transportation.
Since we have shown that a substantial part of our sample may be interested in replacing their company car with financial compensation, we looked further into this financial compensation and the factors influencing it. The linear regression model contains five predictor variables: the respondents' interest in giving up their car for cash, their environmental concern, their (reported) yearly distance driven with their company car, their familiarity with alternative transport modes, and their income. The modeling result shows that by keeping other variables constant, an average potential MB user requires 225 EUR less compensation per month than the average respondent in the group who is not willing to replace their car for a mobility budget. We also found that the association between the interest in giving up their car for a mobility budget and the financial compensation is moderated by their environmental concern; when car dependents are highly concerned with the environment, their required compensation approximates that of the potential MB user. These results mean that employees who are more environmentally conscious and already familiar with alternative transport modes may be more easily convinced to exchange their company car for financial compensation as the money that they require to exchange their company car is significantly lower.
Variables such as the main commuting mode, the main mode used for professional trips, and the frequency of use of alternative transport modes show significant associations in the single predictor models, which indicate that we can draw an analogy from travel mode choice. However, since we predominantly included variables associated with mode choice, the goodness-of-fit is rather low to conclude them (multiple R-squared = 0.202). Other factors can determine such a (financial) decision which is not related to transport, i.e., other fringe benefits offered to employees, salary taxation, job requirements, etc. In the literature, the variable age often appears significant in explaining the variance in mode choice and car dependency (De Witte et al., 2013; Hjorthol, 2016; L'Hostis et al., 2016; Hasnine et al., 2018). Our single predictor model and binary logistic model also indicated that younger respondents tend to be more willing (and require less compensation) to give up their company car. However, adding this predictor to the multiple regression model showed no significant added value: the more significant predictors explained the same variance that age explained. For example, a higher level of environmental concern is associated with a younger age (R = −0.11, p = 0.021) and a higher income is associated with an older age (R = 0.28, p < 0.001), making seniority in the workplace a possible confounding variable.
In addition to the lower goodness-of-fit, a second limitation came with the regression model. With hierarchical regression, multiple hypothesis tests have been performed at a significance level of p = 0.10. The probability of getting at least one significant result due to chance rises exponentially with the number of hypotheses. Therefore, the chance of getting a type I error (i.e., finding a significant result that in reality is not there) increases with each hypothesis test (Goldman, 2008). Two other limitations of this study include the potential biases associated with self-reported data obtained through online surveys, as well as the relevance of using data from a survey conducted in 2018. Changing perceptions of employers and employees about their mobility might impact the validity of the results in future. However, since this study is mainly explorative, based on many variables, we can justify using this method. The extent to which emotional variables such as attitudes are important in the choice of mobility options is an important conclusion that might remain more steady over time.
The objectives addressed in this article are primarily motivated by a policy and implementation gap. However, the findings also contribute to the existing knowledge in the domains of travel behavior research and have implications for transport researchers. The research relates to studies on car dependence and car ownership, applied in a more corporate context, rather than on a personal level, as most existing studies have done. The findings confirm preliminary research on employee preferences for alternative corporate mobility policies, indicating that interest in alternative mobility solutions remains limited (e.g., Zijlstra, 2016). However, we notice an evolution in favor of the mobility budget. Compared to 2017 (Fleet Profile, 2017), the number of companies offering a form of mobility budget increased by 66%, and the number of employees using it increased by 23%.
Cairns et al. (2010) and Van Malderen et al. (2012) found that financial compensation could lead to more sustainable commuting behavior, such as the adoption of mobility budgets. However, little research had been conducted on the determinants that make certain employees more susceptible to corporate mobility policies than others. Therefore, this research expands current knowledge on the resistance of employees to exchange their company car for more sustainable transport alternatives. In particular, the research shows that this resistance is associated with sociodemographic and attitudinal variables. Dimitropoulos et al. (2016) and Cusack (2021) found that the degree of environmental concern can have a positive impact on modal shifts. This also seems to be the case when applying this in a corporate context. Addressing attitudes related to environmental concerns in future analyses can lead to a better understanding of the decision-making process of employees and commuters. Based on our analysis, environmental concern and alternative mode use appear to be two important factors that might affect the interest in a mobility budget, demonstrating that a new way of thinking is needed to evolve toward a more sustainable future. Our results also show that this paradigm shift in thinking is more present in the younger generation, but it is still unclear whether this shift will continue as these generations grow older.
Since we do not know the exact population of company car drivers in Belgium, we cannot exactly assess the representativeness of the sample. The issue concerning generalizability becomes more challenging when we consider a European or worldwide population. Nevertheless, Belgium is an interesting case study when it comes to company cars and company car use. If we want to reproduce measures such as the mobility budget and reducing the fiscal benefits of company cars to other European countries, we hereby present interesting variables to study, such as environmental concern and age, which might influence the willingness of adopting such measures, also in other countries. Our findings can therefore be used as recommendations within the CFC and MB principles. By looking into the actual success of the adoption of the CFC measure, we can compare stated with revealed preference. The compensation required by company car drivers seems higher than what organizations can offer in reality: the average required monthly amount in our study corresponds with the CFC remuneration of a Volvo V90 (Diesel) with fuel card (Van Bever et al., 2018), which is located in a higher segment. A lower, more realistic CFC remuneration is expected to be adopted by only a very small part of the population, according to our study. Not surprisingly, the CFC arrangement did not have the desired effect and was abolished in January 2020 (Vanderhoven, 2020).
A first suggestion for future research is to study the impact of status and image on the acceptance of replacing the company car with more sustainable alternatives. In an open question, 31 respondents mentioned the importance of status, image, or luxury, which were not included in the survey. Another advantage of company cars, and cars in general, is the ease of use in the case of chain trips, which has not been captured properly in this study. Household composition as a variable did not seem to be significant in our modeling; however, it would be interesting to study the determinants of chain trips on top of parameters related to household composition and whether there is a company car in the household. To measure the environmental concern of the respondents, more questions could as well be added. In this study, we have only asked four questions concerning personal norms toward different fuel types. Since this variable turns out to be significant in predicting the price for which respondents would give up their company car (p < 0.001), which was not initially expected when reviewing the literature, more questions to map the overall environmental concern could be asked to obtain a more diversified image of this variable, which may increase the reliability of the study. Additionally, the method did not allow us to account for the influence of external factors in the analysis, such as government policies and infrastructure developments. These may as well influence company car drivers' financial preference for alternative transport solutions and might be an interesting topic for further research.
A fifth recommendation for further research is to include other stakeholders in the acceptance of measures promoting sustainable alternatives to the company car. Employees without access to a company car (85% of all employees), according to May (2017), the government, and employers are three other important stakeholders in reducing the number of company cars. However, approaching the employee as a consumer with individual utilities (i.e., applying utility theory to the choice of mobility options in organizations) might be an interesting method to study other alternatives. In addition, financial compensation to employees in exchange for their company car is not the only solution to tackle the complete issue that employee mobility faces today, as also mentioned by Van Bever et al. (2018), but for some employees, getting a feasible compensation every month could be a step in the right direction in transitioning to a more sustainable mobility pattern.
Data availability statement
The raw data supporting the conclusions of this article will be made available by the authors, without undue reservation.
Author contributions
LD: conceptualization of research objectives, design and execution of survey, analysis, and writing outline and manuscript. IK: outline, proofreading, and editing. LS: methodological and statistical support, proofreading, and editing. CM: outline, proofreading, and editing. PS: proofreading and editing of corrections. All authors contributed to the article and approved the submitted version.
Funding
This research is part of an academic, independent research chair coordinated by the Brussels Studies Institute (BSI), called Companies and Sustainable Mobility: The Company Car Debate and Beyond. The research chair was funded by 11 different institutions and organizations (Renta, Febiac, Traxio, Solvay School Alumni, VAB, Touring, Acerta, BLVABM, FEGARBEL, BFFMM, and FOD Mobiliteit en Vervoer). The funding parties were present in quarterly steering committees and had a strictly advisory role. The advice was never binding nor compromising our research.
Acknowledgments
The authors would like to thank all partners of the research chair for their advisory part in the research design, as well as our colleagues for proofreading this article.
Conflict of interest
The authors declare that the research was conducted in the absence of any commercial or financial relationships that could be construed as a potential conflict of interest.
Publisher's note
All claims expressed in this article are solely those of the authors and do not necessarily represent those of their affiliated organizations, or those of the publisher, the editors and the reviewers. Any product that may be evaluated in this article, or claim that may be made by its manufacturer, is not guaranteed or endorsed by the publisher.
Supplementary material
The Supplementary Material for this article can be found online at: https://www.frontiersin.org/articles/10.3389/frsus.2023.1163127/full#supplementary-material
Abbreviations
PT, Public transport; CFC, Cash for Cars; MB, Mobility budget; TCO, Total cost of ownership; MaaS, Mobility as a Service; OLS, Ordinary Least Squares; VIF, Variance inflation factor; SD, Standard deviation; SE, Standard error.
References
Akinwande, M. O., Dikko, H. G., and Samson, A. (2015). Variance inflation factor: as a condition for the inclusion of suppressor variable(s) in regression analysis. Open J. Statist. 5, 754–767. doi: 10.4236/ojs.2015.57075
Bacci, S., and Chiandotto, B. (2019). Introduction to Statistical Decision Theory: Utility Theory and Causal Analysis. London: CRC Press. doi: 10.1201/9781315112220
Barbera, S., Hammond, P., and Seidl, C. (1998). Handbook of Utility Theory: Volume 1: Principles. New York, NY: Springer Science and Business Media.
Box, I. (2019). A New Deal for Mobility in Belgium. Deloitte Belgium. https://www2.deloitte.com/be/en/pages/strategy-operations/strategy-analytics-mergers-acquisitions/articles/future-of-mobility-press-release.html (accessed May 2, 2019).
Cairns, S., Newson, C., and Davis, A. (2010). Understanding successful workplace travel initiatives in the UK. Transport. Res. Part A. 44, 473–494. doi: 10.1016/j.tra.2010.03.010
Chatterjee, S., and Hadi, A. S. (2012). Regression Analysis by Example. Fifth edition. Hoboken, New Jersey: Wiley.
Commins, N., and Nolan, A. (2011). The determinants of mode of transport to work in the greater dublin area. Transp. Policy 18, 259–268. doi: 10.1016/j.tranpol.2010.08.009
Cornelis, E., Hubert, M., Huynen, P., Lebrun, K., Patriarche, G., De Witte, A., et al (2012). Belgian Daily Mobility 2012 - BELDAM Verslag. FOD Mobiliteit en Vervoer. Available online at: https://mobilit.belgium.be/sites/default/files/downloads/2012-12-19_BELDAM_verslag.pdf (accessed June 21, 2022).
Cusack, M. (2021). Individual, social, and environmental factors associated with active transportation commuting during the COVID-19 pandemic. J. Transp. Health 22, 101089. doi: 10.1016/j.jth.2021.101089
Dataforce Transport Environment (2020). Dataforce Study on Company Cars. Transport and Environment. Available online at: https://www.transportenvironment.org/sites/te/files/publications/2020_10_Dataforce_company_car_report.pdf (accessed December 03, 2022).
De Borger, B., and Wuyts, B. (2011). The tax treatment of company cars, commuting and optimal congestion taxes. Transport. Res. Part B. 45, 1527–1544. doi: 10.1016/j.trb.2011.06.002
De Craecker, S. (2020). Slechts 0.011% van de medewerkers koos voor mobiliteitsbudget. Available online at: https://www.acerta.be/nl/over-acerta/in-de-pers/slechts-0-011-van-de-medewerkers-koos-voor-mobiliteitsbudget (accessed January 10, 2020).
De Witte, A., Hollevoet, J., and Macharis, C. (2013). “Social cost benefit analysis,” in Sustainable Mobility and Logistics, eds. M. Cathy, and J. Van Mierlo (Brussels: VUBPress), 313–25.
Derauw, S., Gelaes, S., and Pauwels, C. (2019). Enquête Monitor over de Mobiliteit van de Belgen. D/2019/13.831/11. Federale Overheidsdienst Mobiliteit en Vervoer. Available online at: https://mobilit.belgium.be/sites/default/files/partie_mobilite_nl-final_1.pdf (accessed March 11, 2022).
Dimitropoulos, A., van Ommeren, J. N., Koster, P., and Rietveld, P. (2016). Not Fully Charged: Welfare Effects of Tax Incentives for Employer-Provided Electric Cars. J. Environ. Econ. Manage. 78, 1–19. doi: 10.1016/j.jeem.2016.01.004
Febiac (2020). Automotive Pocket Guide. Febiac. Available online at: https://www.febiac.be/documents_febiac/publications/2021/03/AUTOMOTIVE-POCKET-GUIDE-NL.pdf (accessed December 30, 2022).
Febiac (2022). Datadigest 2021. Available online at: https://www.febiac.be/public/statistics.aspx?FID=23&lang=NL (accessed January 1, 2022).
Febres, J. D., García-Herrero, S., Herrera, S., Gutiérrez, J. M., López-García, J. R., and Mariscal, M. A. (2020). Influence of seat-belt use on the severity of injury in traffic accidents. Eur. Transp. Res. Rev. 12, 9. doi: 10.1186/s12544-020-0401-5
Fleet Profile (2017). Company Cars Report 2017. Available online at: https://www.fleetprofile.com/solutions/company-car-report/ (accessed December 8, 2017).
Goetzke, F. (2008). Network effects in public transit use: evidence from a spatially autoregressive mode choice model for New York. Urban Stud. 45, 407–417. doi: 10.1177/0042098007085970
Grace-Martin, K. (2008). “Can Likert Scale Data Ever Be Continuous?” The Analysis Factor (blog). Available online at: https://www.theanalysisfactor.com/can-likert-scale-data-ever-be-continuous/ (accessed October 16, 2008).
Grimaldi, R., Laurino, A., and Beria, P. (2010). The choice between bus and light rail transit: a stylised cost-benefit analysis model. MPRA - Munich Personal RePEc Archive, no. 24872. Available online at: http://mpra.ub.uni-muenchen.de/24872/ (accessed January 9, 2016).
Guthrie, W. F. (2020). NIST/SEMATECH e-Handbook of Statistical Methods (NIST Handbook 151). Gaithersburg, MD: National Institute of Standards and Technology.
Harding, M. (2014). Personal Tax Treatment of Company Cars and Commuting Expenses. OECD Taxation Working Papers 20.
Hasnine, M. S., Lin, T., Weiss, A., and Habib, K. N. (2018). Determinants of travel mode choices of post-secondary students in a large metropolitan area: the case of the city of Toronto. J. Transp. Geogr. 70, 161–171. doi: 10.1016/j.jtrangeo.2018.06.003
Hjorthol, R. (2016). Decreasing popularity of the car? Changes in driving licence and access to a car among young adults over a 25-year period in Norway. J. Transp. Geogr. 51, 140–146. doi: 10.1016/j.jtrangeo.2015.12.006
Hole, A. R. (2004). Forecasting the demand for an employee park and ride service using commuters' stated choices. Transp Policy 11, 355–362. doi: 10.1016/j.tranpol.2004.04.003
IRCEL (2016). Environmental Performance Index (EPI): Does Belgium Have Europe's Worst Air Quality? 2016. Available online at: https://www.irceline.be/news/environmental-performance-index-epi-does-belgium-have-europes-worst-air-quality (accessed February 14, 2023).
Jacobs, F. (2019). How Belgium's Mobility Budget Will Affect Company Cars. Text. Fleet Europe. Available online at: https://www.fleeteurope.com/en/maas/belgium/features/how-belgiums-mobility-budget-will-affect-company-cars (accessed April 12, 2019).
Javaid, A., Creutzig, F., and Bamberg, S. (2020). Determinants of low-carbon transport mode adoption: systematic review of reviews. Environ. Res. Lett. 15, 103002. doi: 10.1088/1748-9326/aba032
Kingham, S., Dickinson, J., and Copsey, S. (2001). Travelling to work: will people move out of their cars. Transp. Policy 8, 151–160. doi: 10.1016/S0967-070X(01)00005-1
Kwanten, M. (2018). Kilometers afgelegd door Belgische voertuigen. FOD Mobiliteit en Vervoer. Available online at: https://mobilit.belgium.be/sites/default/files/rapport_kilometers_2017_nl.pdf (accessed December 14, 2020).
Laine, B., and Van Steenbergen, A. (2017). Commuting subsidies in Belgium. Reflets Perspect. Écon. 2, 101. doi: 10.3917/rpve.562.0101
Lanzini, P., and Khan, S. A. (2017). Shedding Light on the Psychological and Behavioral Determinants of Travel Mode Choice: A Meta-Analysis. Transport. Res. Part F. 48, 13–27. doi: 10.1016/j.trf.2017.04.020
Le Vine, S., Zolfaghari, A., and Polak, J. (2014). “Carsharing: evolution, challenges and opportunities,” in 22th ACEA Scientific Advisory Group Report (London: Centre for Transport Studies, Imperial College London).
L'Hostis, A., Müller, B., Meyer, G., Brückner, A., Foldesi, E., Dablanc, L., et al (2016). Mobility4EU deliverable D2.1: societal needs and requirements for future transportation and mobility as well as opportunities and challenges of current solutions. Available online at: http://www.mobility4eu.eu/?wpdmdl=1245 (accessed February 1, 2018).
May, X. (2017). The Debate Regarding the Number of Company Cars in Belgium. Brussels Studies Factsheet. Brussels Studies. La Revue Scientifique Électronique Pour Les Recherches Sur Bruxelles/Het Elektronisch Wetenschappelijk Tijdschrift Voor Onderzoek over Brussel/The e-Journal for Academic Research on Brussels, July. Available online at: http://journals.openedition.org/brussels/1540 (accessed February 1, 2018).
May, X., Ermans, T., and Hooftman, N. (2019). Company Cars: Identifying the Problems and Challenges of a Tax System. Brussels Studies. La Revue Scientifique Pour Les Recherches Sur Bruxelles/Het Wetenschappelijk Tijdschrift Voor Onderzoek over Brussel/The Journal of Research on Brussels. doi: 10.4000/brussels.2499
Moniruzzaman, M., and Farber, S. (2018). What drives sustainable student travel? Mode choice determinants in the greater Toronto area. Int. J. Sustain. Transport. 12, 367–379. doi: 10.1080/15568318.2017.1377326
Oakil, A. T. M., Manting, D., and Nijland, H. (2016). Determinants of car ownership among young households in the netherlands: the role of urbanisation and demographic and economic characteristics. J. Transp. Geogr. 51, 229–235. doi: 10.1016/j.jtrangeo.2016.01.010
Palma, A., and Rochat, D. (2000). Mode choices for trips to work in Geneva: an empirical analysis. J. Transp. Geogr. 8, 43–51. doi: 10.1016/S0966-6923(99)00026-5
Pawlak, J., Polak, J. W., and Sivakumar, A. (2015). Towards a microeconomic framework for modelling the joint choice of activity–travel behaviour and {ICT} use. Transport. Res. Part A. 76, 92–112. doi: 10.1016/j.tra.2014.10.013
Petschnig, M., Heidenreich, S., and Spieth, P. (2014). Innovative alternatives take action – investigating determinants of alternative fuel vehicle adoption. Transport. Res. Part A. 61, 68–83. doi: 10.1016/j.tra.2014.01.001
Pooley, C. G., and Turnbull, J. (2000). Modal choice and modal change: the journey to work in Britain since 1890. J. Transp. Geogr. 8, 11–24. doi: 10.1016/S0966-6923(99)00031-9
Potter, S., Enoch, M., Rye, T., Black, C., and Ubbels, B. (2006). Tax treatment of employer commuting support: an international review. Transp. Rev. 26, 221–237. doi: 10.1080/01441640500184385
Princen, S. (2017). Taxation of Company Cars in Belgium: Room to Reduce Their Favourable Treatment. LU: Publications Office. Available online at: https://data.europa.eu/doi,/10.2765/70 (accessed October 1, 2020).
R Core Team (2019). R: A Language and Environment for Statistical Computing. Vienna, Austria: R Foundation for Statistical Computing. Available online at: https://www.R-project.org/ (accessed October 1, 2020).
Ramaekers, K., Wets, G., Witte, A. D., Macharis, C., Cornelis, E., Castaigne, M., et al. (2010). “The impact of company cars on travel behaviour,” in Proceedings WCTR 2010 (Electronic Version) (WCTR).
Revelle, W. (2020). Psych: Procedures for Psychological, Psychometric, and Personality Research. Available online at: https://CRAN.R-project.org/package=psych (accessed November 13, 2020).
Susilo, Y., Lyons, G., Jain, J., and Atkins, S. (2012). Rail passengers' time use and utility assessment. Transport. Res. Rec. 2323, 99–109. doi: 10.3141/2323-12
Ton, D., Bekhor, S., Cats, O., Duives, D. C., Hoogendoorn-Lanser, S., and Hoogendoorn, S. P. (2020). The experienced mode choice set and its determinants: commuting trips in the Netherlands. Transport. Res. Part A. 132, 744–758. doi: 10.1016/j.tra.2019.12.027
Van Bever, A., Poppe, J., Malengreaux, R., and Guchtenaere, S. D. (2018). Personenwagens. Is het einde van de bedrijfswagen in zicht? Gent: Ghent University.
Van Malderen, L., Jourquin, B., Thomas, I., Vanoutrive, T., Verhetsel, A., and Witlox, F. (2012). On the mobility policies of companies: what are the good practices? The belgian case. Transp. Policy 21, 10–19. doi: 10.1016/j.tranpol.2011.12.005
Vanacker, L. (2020). Bedrijfswagen Nog Nooit Zo Populair. De Tijd. Available online at: https://www.tijd.be/ondernemen/auto/bedrijfswagen-nooit-zo-populair/10196708.html (accessed January 8, 2020).
Vandenbroucke, A., Mezoued, A. M., and Vaesen, J. (2020). Bedrijfswagens en duurzame mobiliteit. Analyse en uitdagingen. Brussel: ASP Academic and Scientific Publ.
Vanderhoven, M. (2020). Het Grondwettelijk Hof keurt de “cash for car”-regeling af. Available online at: https://www.vbo-feb.be/actiedomeinen/hr–personeel/bijzondere-voordelen/het-grondwettelijk-hof-keurt-de-cash-for-car-regeling-af_2020-01-27/ (accessed January 27, 2020).
Vanoutrive, T., Van Malderen, L., Jourquin, B., Thomas, I., Verhetsel, A., and Witlox, F. (2010). Mobility management measures by employers: overview and exploratory analysis for Belgium. Eur. J. Transp. Infrastr. Res. 10, 121–141. doi: 10.18757/ejtir.2010.10.2.2878
Volz-Tollet, A. (2021). Sustainable mobility schemes in companies: a thwarted legitimacy? RIMHE. 44, 53a−79a. doi: 10.3917/rimhe.044.0053a
Wilson, R. W. (1992). Estimating the travel and parking demand effects of employer-paid parking. Reg. Sci. Urban Econ. 22, 133–145. doi: 10.1016/0166-0462(92)90029-Z
Winckelmans, W. (2020). 2026 voor elektrische bedrijfswagens is niet onhaalbaar. De Standaard. Available online at: https://www.standaard.be/cnt/dmf20200918_94881456 (accessed November 27, 2020).
Zhao, M., Tyler, N., and Lan, C. (2012). What determines commute time choices? A structural equation modelling approach. Transp. Plann. Technol. 35, 393–408. doi: 10.1080/03081060.2012.680809
Zietsman, J., Rilett, L. R., and Kim, S. (2006). Transportation corridor decision-making with multi-attribute utility theory. Int. J. Manag. Decis. Mak. 7, 254–266. doi: 10.1504/IJMDM.2006.009147
Keywords: stepwise linear regression, car users, sustainable mobility, financial preference, travel behavior, company cars, employee mobility
Citation: De Wilde L, Stas L, Savieri P, Vanhaverbeke L, Keserü I and Macharis C (2023) Can we persuade company car drivers to opt out? Front. Sustain. 4:1163127. doi: 10.3389/frsus.2023.1163127
Received: 13 February 2023; Accepted: 14 September 2023;
Published: 10 October 2023.
Edited by:
Stavros Afionis, Cardiff University, United KingdomReviewed by:
Laurent Franckx, Federal Planning Bureau, BelgiumBenoit Laine, Federal Planning Bureau, Belgium
Copyright © 2023 De Wilde, Stas, Savieri, Vanhaverbeke, Keserü and Macharis. This is an open-access article distributed under the terms of the Creative Commons Attribution License (CC BY). The use, distribution or reproduction in other forums is permitted, provided the original author(s) and the copyright owner(s) are credited and that the original publication in this journal is cited, in accordance with accepted academic practice. No use, distribution or reproduction is permitted which does not comply with these terms.
*Correspondence: Liesbeth De Wilde, TGllc2JldGguZGUud2lsZGVAdnViLmJl