 Nutcha Taneepanichskul
 Helen C. Hailes
 Mark Miodownik
- 1Plastic Waste Innovation Hub, University College London, London, United Kingdom
- 2Department of Mechanical Engineering, University College London, London, United Kingdom
- 3Department of Chemistry, University College London, London, United Kingdom
In the UK waste management systems biodegradable and compostable packaging are not automatically detected and separated. As a result, their fate is generally landfill or incineration, neither of which is an environmentally good outcome. Thus, effective sorting technologies for compostable plastics are needed to help improve composting rates of these materials and reduce the contamination of recycling waste streams. Hyperspectral imaging (HSI) was applied in this study to develop classification models for automatically identifying and classifying compostable plastics with the analysis focused on the spectral region 950–1,730 nm. The experimental design includes a hyperspectral imaging camera, allowing different chemometric techniques to be applied including principal component analysis (PCA) and partial least square discriminant analysis (PLS-DA) to develop a classification model for the compostable materials plastics. Materials used in this experimental analysis included compostable materials (sugarcane-derived and palm leaf derived), compostable plastics (PLA, PBAT) and conventional plastics (PP, PET, and LDPE). Our strategy was to develop a classification model to identify and categorize various fragments over the size range of 50 x 50 mm to 5 x 5 mm. Results indicated that both PCA and PLS-DA achieved classification scores of 100% when the size of material was larger than 10 mm x 10 mm. However, the misclassification rate increased to 20% for sugarcane-derived and 40% for palm leaf-based materials at sizes of 10 x 10 mm or below. In addition, for sizes of 5 x 5 mm, the misclassification rate for LDPE and PBAT increased to 20%, and for sugarcane and palm-leaf based materials to 60 and 80% respectively while the misclassification rate for PLA, PP, and PET was still 0%. The system is capable of accurately sorting compostable plastics (compostable spoons, forks, coffee lids) and differentiating them from identical looking conventional plastic items with high accuracy.
1. Introduction
There has been a recent growth in the production and use of compostable plastics in an attempt to reduce the impact of conventional plastics on the environment (WRAP, 2022). These types of plastics are designed to biodegrade at their end of life in controlled systems such as industrial composting (Song et al., 2009). Bioplastics production worldwide is projected to increase from 2.23 million tons in 2022 to around 6.3 million tons in 2027 (Bioplastic, 2022). In 2019, the global compostable plastic market was valued at $991.2 million and is predicted to reach $3,102.6 million by 2027 (AMR, 2022).
Typically, compostable plastics are manufactured fully or in part from biomass and include polylactic acid polymers (PLA), polybutylene adipate terephthalate (PBAT) and starch-based polymers. PLA is typically used to produce cup lids, salad boxes, tea bags, coatings for coffee cups, food containers and cartons. PBAT and starch-based plastics are often used for plastic films such as magazine wraps and caddy liners. Apart from compostable plastics, other biomass-derived substances are also used to produce packaging such as sugarcane and palm leaf.
The advantages of compostable packaging are realized when these types of packaging are industrially composted and do not enter the environment or pollute other waste streams or the soil (Purkiss et al., 2022). Currently, most compostable plastics are treated as a contaminant in the recycling of conventional plastics such as HDPE and PET, reducing their value. Moreover, when composting various types of organic residues, the finished product always contains a certain amount of other materials such as flakes of plastic film (REA, 2021). Therefore, contaminants have to be eliminated in order to improve compost quality. Currently, trommel and density sorting are applied to screen the compost and reduce the presence of other materials. However, the levels of contaminants from the current screening process is unacceptably high (SEPA, 2019). To improve the accuracy of the current system advanced sorting technologies need to be developed (Xu and Gowen, 2020).
In this study we use hyperspectral imaging (HSI) in a one step process to identify different materials. We apply shortwave infrared (SWIR) in the range 950–1,730 nm to identify not just only different types of conventional plastics (PP, PET, and LDPE) and compostable plastic (PLA, PBAT) packaging but also compostable materials (palm leaf and sugarcane-based materials) with various sizes from 50 x 50 mm to 5 x 5 mm. The technique we have developed is notably different to Moroni and Mei (2020). The novelty arises from our use of machine learning methods. We used mean centering (MC) and standard normal variate (SNV) algorithms and applied these to reduce the impact of possible external sources of variability and highlight sample spectral differences that allowed a more accurate interpretation and classification of the model. We have also used spectral information to successfully develop unsupervised principal component analysis (PCA) and partial least square discriminant analysis (PLS-DA) to differentiate packaging material types and to classify unknown packaging material samples. A detailed description of our HSI method is presented, including the hardware and software components. Results are shown at a laboratory scale where we use this method to successfully identify different sorts of conventional, compostable, and biodegradable packaging materials over a range of sizes to a high degree of accuracy. We also discuss the real world applicability of this technique in waste processing systems.
1.1. Background
Taneepanichskul et al. (2022) recently identified a variety of suitable sorting technologies for compostable plastics such as gravity-based sorting, triboelectric sorting, image based identification, spectral based identification, hyperspectral imaging, and tracer based sorting suitable for this task. The analysis showed that each technique has its advantages and disadvantages in terms of effectiveness, cost and environmental footprint. Hyperspectral imaging technology was identified as one of the most suitable non-destructive techniques to identify compostable packaging. It has the potential to be integrated with existing waste sorting systems, as well being economically feasible and a sustainable way to sort compostable plastics (Biopak, 2022; Taneepanichskul et al., 2022). For example, the power consumption for the identification process is very low. When compostable plastics are comingled with other materials such as recyclable plastics or food waste, HSI is one of the most effective techniques for differentiating between them since it combines imaging technology and spectroscopy into one approach. Moreover, it is able to detect the spectral signature of each pixel of the acquired image in different wavelength regions (visible, near infrared, short-wave infrared, etc.) according to the characteristics of the selected sensing device. One potential drawback however is the large amount of spectral information collected by HSI from the sample surfaces that must be processed in order to make sorting decisions in real time.
For large pieces of plastic (50–500 mm), Balsi et al. (2018) have used shortwave infrared (SWIR) spectral imaging in the range of 900–1,700 nm for the spectral characterization of polymers including PS, PVC, PLA, PET, PC and three types of PE (LDPE, HDPE and LLDPE). The absorption peaks of different types of plastic were identified by a continuum removal method (Balsi et al., 2018). Bonifazi et al. (2013) have applied hyperspectral imaging to enhance the efficiency of polyolefin recycling systems (Bonifazi et al., 2013). Recently Moroni and Mei (2020) used hyperspectral imaging to separate PS, PET, and PLA samples at their different stages of the life cycle (virgin to plastic waste). In order to separate these three types of plastics they used a sequential method. The first spectral index of 1,170–1,650 nm used hyperspectral imaging to separate polymers with flame retardants to allow grouping of plastics with the same polymer type and additive content necessary for recycling. A decision tree that included a partial least square and hierarchical models was then used to identify the types of plastic. The accuracy was higher than 90% in all cases.
2. Materials and methods
2.1. Sample preparation
The packaging materials used in this experiment consisted of virgin conventional plastic including PP, LDPE and PET, compostable plastic namely PLA, PBAT and biodegradable packaging—palm leaf derived packaging and sugarcane-derived packaging. The materials were all sourced from commercial producers and are provided in Table 1. The sources of material are also provided in Table 1.

Table 1. The details of materials tested.
The samples were cut into squares of various sizes and divided into two sets, one for training and a testing dataset. The training dataset was the dataset used to build the classification model. It was an input into the machine learning algorithms to allow the model to associate spectral imaging data with known material classifications. The testing dataset was the dataset that contains unseen data to test the model accuracy in determining material classifications. It was used to evaluate the performance of the model. The sizes of materials in the training dataset and testing dataset ranged from square samples cut from thin films 50 x 50 mm−20 x 20 mm and 10 x 10 mm−5 x 5 mm, respectively, as shown in Figure 1. These are similar to those carried out in previous studies (Moroni et al., 2015).
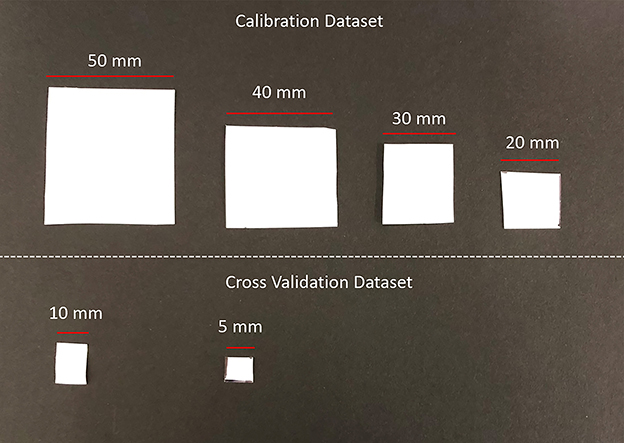
Figure 1. The size of samples PP, LDPE, PET, PLA, PBAT, sugarcane derived packaging and palm leaf derived packaging in a Calibration Dataset (50 x 50 mm, 40 x 40 mm, 30 x 30 mm, and 20 x 20 mm) and Cross Validation Dataset (10 x 10 mm and 5 x 5 mm).
The population in these experiments was 210. We used a krejcie-morgan table to calculate the sample size in the training dataset, which was determined as 140 (Krejcie and Morgan, 1970). For the 140 samples in the training dataset and 70 samples in the testing datasets, the details are shown in Table 2. We adopted a random sampling strategy to select the sample order for the training datasets.

Table 2. List of samples in the training dataset and testing dataset.
2.2. Hyperspectral imaging equipment and data acquisition
HSI acquisitions and analyses were carried out a laboratory in the Department of Mechanical Engineering, University College London. There are four main components of hyperspectral imaging system which are a hyperspectral camera, light source, conveyor belt and lens (Xiong et al., 2014) (Figure 2A).
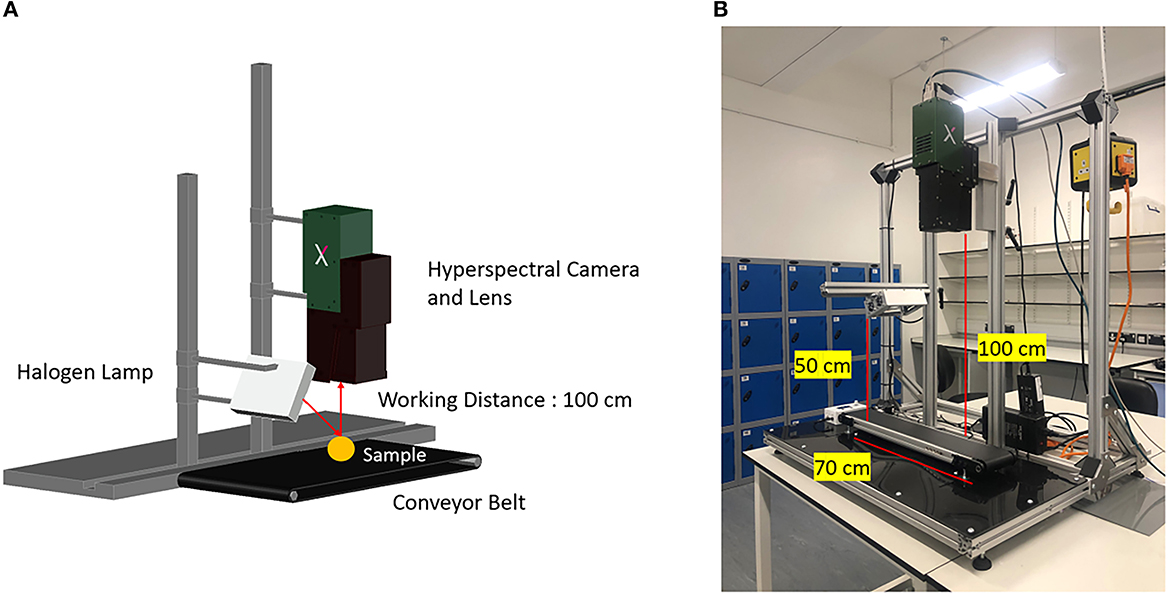
Figure 2. Images of hyperspectral camera system. (A) Components of HSI system. (B) Dimension of HSI system.
In this study, hyperspectral images were collected by a HySpex Baldur S-640i N covering the spectral range 950–1,730 nm, with a spectral resolution of 3.36 nm, for a total of 232 wavelength bands. The hyperspectral camera was used with a 1 m working distance 16° FOV (Hyspex, 2021). The images were acquired by scanning the image line by line: the spatial pixels size was 0.44 mm. Every sample scanned by the system produced image information in the form of an x-y grid of pixels, and for each pixel a spectrum was recorded, yielding a hyperspectral data cube for each sample. The hyperspectral camera was adjustable in height and angle. In this case, the height between lens and objects was set at 100 cm. The angle between the lens and objects was 90°. The halogen lamp produced an intense and continuous spectrum from 400 nm to 2,500 nm. The acquisition platform also consisted of a conveyor belt (700 x 215 x 60 mm) with adjustable speed (Figure 2B). Acquisition was controlled by a PC equipped with specialized acquisition and pre-processing software: HyspexGround (Hyspex, 2019) which was used to perform the acquisition, to collect spectra, and to perform preliminary spectral analysis.
System calibrations were carried out by recording a black and a white reference image. The black image (B) was acquired to eliminate the dark current effect of the camera sensor. The white reference image (W) was acquired adopting a standard white ceramic tile under the same conditions as the raw image. Equation 1 describes the calculation used to perform for image correction:
where I is the corrected hyperspectral image in a unit of relative reflectance (%), I0 is the original hyperspectral image, B is the black reference image (~0%), and W is the white reference image (~99.9%).
2.3. Spectral data preprocessing
After image correction the background noise was removed by an initial reduction of the range of the wavelengths investigated. The first and last spectral bands were excluded in order to reduce the size of data (spectral variable). Some spectral bands that gave the noisiest data were also eliminated. Subsequently, the background of each image was removed. After that the hyperspectral data were preprocessed using mean centering (MC) and standard normal variate (SNV) algorithms to reduce the impact of possible external sources of variability and highlight sample spectral differences that allowed a more accurate interpretation and classification of the model. For mean centering, the first stage is often to subtract the average from each variable. The objective of mean centering is to ensure that all results will be interpretable in term of variation around the mean. This is especially crucial if the variables differ significantly in their relative magnitudes, otherwise the values with the greatest variance will be favored in regression analysis. For SNV analysis this technique removes the multiplicative interferences caused by scatter and particle size effects from spectral data. SNV removes scatter effects by centering and scaling each individual spectrum. The method assumes that the absorbance of each wavelength point in the spectrum meets a certain distribution such as a Gaussian distribution. Each spectrum was calibrated based on this assumption. The average value of a spectrum was subtracted from the original spectrum, and then the result was divided by the standard deviation.
2.4. Spectral data analysis
The SWIR region gives chemical information about the investigated materials (sugarcane and palm leaf derived packaging, PLA, PBAT, PET, PP and LDPE) since most absorption bands in this range arise from overtones of N-H, C-H and O-H vibration. Spectra were analyzed using Breeze software version 2022.1.5 (Hyspex, 2019). After a spectral data preprocessing step, principal components analysis (PCA) was applied to explore the data, to define classes and to evaluate the best algorithms for further classification model development, setup, and implementation. The chosen method for classification and validation was the partial least-squares discriminant analysis (PLS-DA).
2.4.1. Principal component analysis (PCA)
PCA converts an observational dataset from potentially correlated variables into linearly uncorrelated variables, namely a principal component (PC). The first PC accounts for the highest variability in the dataset. Therefore, most of the information are captured in PC1. The remaining amount of variance become subsequent principal components in descending order (Farrugia et al., 2021). In hyperspectral imaging, this technique is applied directly to the pixel of hyperspectral image. In the data pre-processing step the data cube is rearranged. The pixels of region of interest are considered as a set of correlated variables to which PCA is applied. The score matrix Z is given by Equation 2:
where the rows of the input matrix X ∈ ℝK×L represent the spectral values for K = M × N (pixels) over L spectral bands (λ). W ∈ ℝL×Ppixels is the loading matrix, the columns of which represent the eigenvectors of the covariance matrix of X. The columns of W provide the transformation functions that map the pixel spectral vectors into PCs. The columns of Z ∈ ℝK×Prepresent the PC scores which are the representations of X in the PC space (Figure 3). Each PC image is the product between the pixel spectral vectors of X and a column of W. Each PC image is obtained by reshaping each PC making up Z, to a two-dimensional representation (Abdi and Williams, 2010). In this study 120 samples of different types and sizes of plastics were used in the training dataset. Subsequently, a PCA was applied for visualizing and confirmation of good clustering (Jolliffe, 2005).

Figure 3. Reshaping of hyperspectral datacube and PCA method.
To summarize, the PCA method can be divided into six major steps as shown in Figure 3. The hyperspectral data is imported and then reshaped.
There are many techniques for PCA to transform the data such as hotelling transformation but all of them have the same mathematical model: the eigenvalues are computed, sorted in descending order and used to create a PCA plot where materials that are similar are located close together (Serranti et al., 2011, 2015, 2019).
2.4.2. Partial least square and discrimination analysis (PLS-DA)
PLS-DA is considered as a supervised method of PCA in the sense that this method achieves dimensionality reduction but it takes the class label in consideration. It combines partial least square (PLS) and discriminant analysis (DA). The PLS regression technique is applied to find latent variables (LVs) with maximum covariance with Y variables. The main difference between PLS regression and PLS-DA is that the dependent variable in PLS-DA has a categories scales whereas the dependent variable has a continuous scale in PLS regression. Thus PLS-DA can be applied as a classifier. In PLS-DA, the linear equation is modeled by latent variables. This allows graphical visualization and the understanding of the relations by LV scores and loadings (Wold et al., 2001).
There are six data processing steps that were used to form a PLS-DA analysis. Firstly, latent variables are computed based on an original dataset. Next the computed latent variables are plugged into a linear regression model to calculate a prediction value and then the cut off value is selected to classify types of material. Normally, we selected 0.5 as a cutoff point. If the prediction score is <0.5, it is classified as 0. If the prediction score is more than one, it is classified as 1 (Serranti et al., 2011, 2015, 2019). Each class of material is displayed as a different color. After calibration, the performance of the model was assessed using a test dataset. In this study, there were 80 samples in the testing dataset containing 8 different types of plastics with small size (10 x 10 mm and 5 x 5 mm).
3. Results
The experiments were carried out with a range of different packaging materials using hyperspectral imaging (Table 2). The purpose of the experiments was to generate PCA and PLS-DA classification models and assess the performance of model. Figure 4 shows the raw absorbance spectra of sugarcane derived packaging, PP, PLA, PET, LDPE, PBAT and palm leaf derived packaging acquired by hyperspectral camera (HySpex Baldur S-640i N).
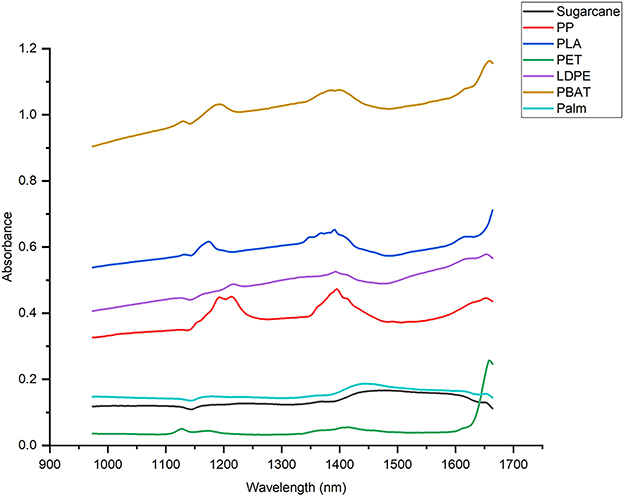
Figure 4. Raw absorbance spectra of sugarcane derived packaging, PP, PLA, PET, LDPE, PBAT and palm leaf derived packaging acquired by hyperspectral camera (HySpex Baldur S-640i N).
The pre-processed data using mean centering (MC) and standard normalized variation (SNV) normalization is shown in Figure 5.
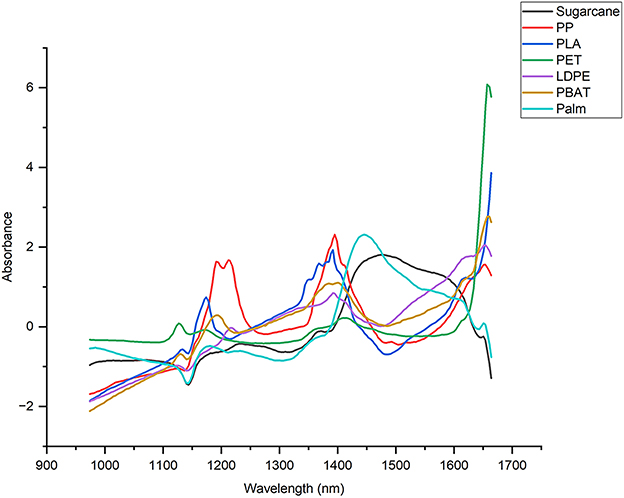
Figure 5. Pre-processed spectra using mean centering (MC) and standard normalized variation (SNV) normalization of sugarcane derived packaging, PP, PLA, PET, LDPE, PBAT and palm leaf derived packaging.
3.1. Principal component analysis
For each of the training samples, after collecting a hyperspectral data cube and the pre-processing step, the PCA was applied to reshape the data cube and reduce data dimensionally. For each sample, a PCA score plot was generated allowing the identification of seven different groups of materials according to the material spectral signature (Figure 6).
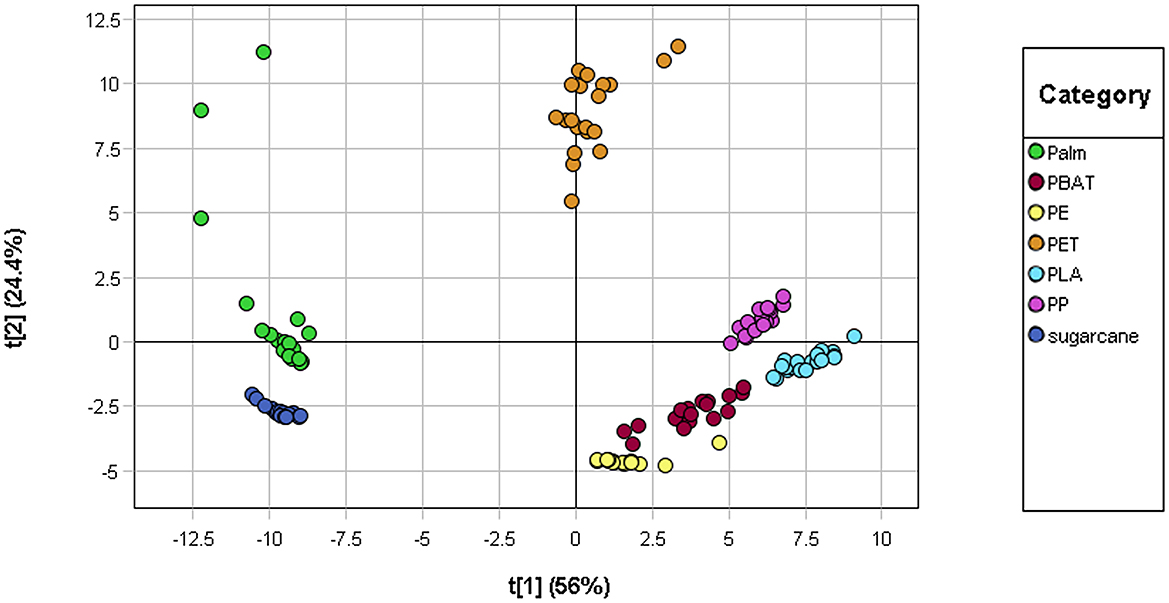
Figure 6. P1-PC2 score plots of palm leaf derived packaging, sugarcane-based packaging, PBAT, PLA, PE, PET, and PP after the application of SNV and mean center pre-processing.
In this experimental set up, the majority of variance was captured by the first two principal components (PCs), where PC1 and PC2 explains 56% and 24.4% of the variance, respectively. The PCA model results shows the separability of the different classes of materials. From the PCA score plot, the compostable material (palm and sugarcane derived), compostable plastic (PLA, PBAT) and conventional plastic (LDPE, PP, PET) shows the high level of separability. There is no overlap between each type of material in training dataset although palm is the least clustered.
3.2. Partial least square discriminant analysis (PLS-DA)
The PLS-DA model of 7 classes of various sizes of materials built on the training dataset showed a captured variance of 80% with two latent variables.
Subsequently the value of accuracy, misclassification rate, R2 (R square) and RMSE (Root-mean-square deviation), sensitivity and specificity of each type of materials were calculated to measure the performance and robustness of the classification model. The sensitivity and specificity value ranged from 0 to 1. These values provide the information about model performance. The higher the values are, the better the model. From Table 3, it illustrated that the performance model on training dataset was very high because sensitivity and specificity values of all materials were 1. Moreover, the accuracy model was 100% and misclassification rate was 0% for all types of materials. R2 and RMSE values also proved the robustness of classification model. R2 was >96% and RMSE was lower than 0.07 for all types of materials in the training dataset.

Table 3. Accuracy, misclassification rate, specificity, and sensitivity values.
After we ensured that the performance and robustness of the classification of model were adequate, we applied it to the testing dataset (10 x 10 mm and 5 x 5 mm) to classify types of materials. The accuracy, misclassification rate, sensitivity and specificity values determined are shown in Table 4.
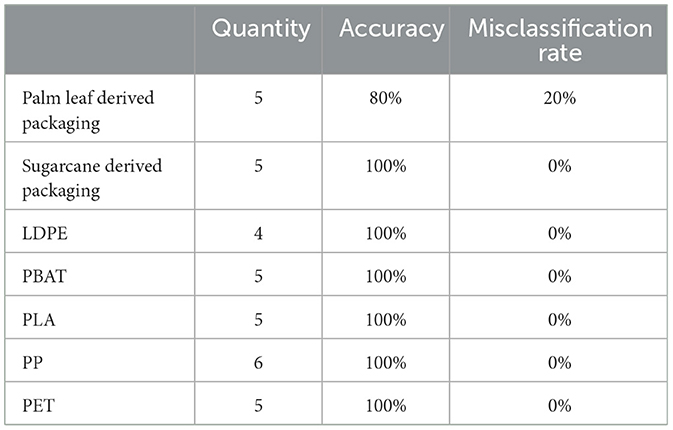
Table 4. Accuracy, misclassification rate, specificity and sensitivity values for seven classes PLS-DA model in testing dataset obtained for the seven classes PLS-DA model on training dataset.
For both compostable plastic (PLA, PBAT) and conventional plastics (PP, PET and LDPE), these values were very high (>90%). However, the sensitivity value of compostable materials (palm and sugarcane derived) was 40%.
Figure 7 illustrates PLS-DA seven classes' model applied to the cross validation set to predict the type of materials that shows the corresponding classified hyperspectral images. It appears that in the 7-classes model, sugarcane, palm, PLA, PBAT, LDPE, and PET are recognized with 100% accuracy. Even if some pixels are misclassified, the majority of them belong to the correct class in each object. These sporadic errors in prediction are probably due to the surface roughness of the sample, highlighting the scattering effect of the light, or to the presence of dirtiness on the sample surface. In this study, PLS-DA was used to perform a good discrimination among classes of materials and to define predictions in new hyperspectral images, adopting pre-processing algorithms defined in the PCA step. Each category is independently modeled on the others and a sample can be assigned to only a class or even to more classes or can be rejected by all classes. The PLS-DA model obtained, instead, assigns only one of the available categories, based on its spectral signature, to each unknown sample in the hyperspectral image, making interpretation of the results easier. The results of PLS-DA, applied to hypercubes, are prediction maps, where each class is defined by a different color.
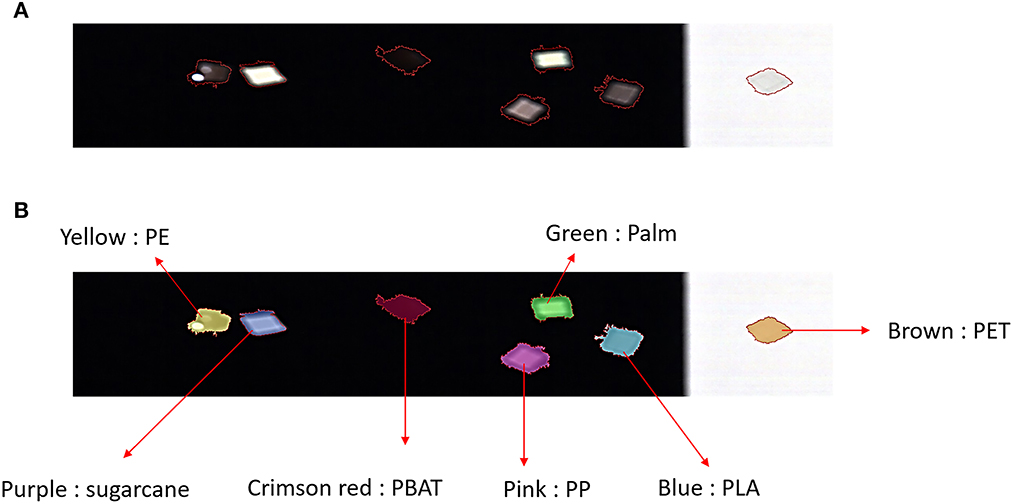
Figure 7. PLS-DA seven classes' model applied to cross validation set to predict type of materials. (A) RGB optical image obtained by the hyperspectral camera, (B) the hyperspectral image overlayed with the classification color (yellow: PE, blue: PLA, pink: PP, crimson red: PBAT green: palm leaf, purple: sugarcane, brown: PET).
The size of samples also has a tremendous effect on the accuracy of the model. In training datasets, the size of sample is bigger than the testing dataset. Therefore, the overall accuracy of the model is higher than the testing set. For example, the accuracy of palm leaf derived packaging on the training dataset was 100% while the accuracy of the testing dataset dramatically decreases to 40%. However, the accuracy level of conventional plastic (PP, LDPE and PET) and compostable plastic (PLA, PBAT) on the testing dataset is still very high. It can identify and differentiate types of plastic when the size is 5 x 5 mm.
3.3. Real world applications
The PLS-DA classification model was also applied to classify and detect compostable materials in the market—black plastic cutlery and white PP plastic cutlery, sugarcane-based packaging and a white PLA lid. All of these materials we loaded onto the conveyor belt in a random jumbled arrangement. Figure 8 shows the PLS-DA model applied to detect compostable materials in the market (plastic plate, plastic lid and cutlery). The result shows that the model correctly identified white PP plastic cutlery and PLA lid and sugarcane-based packaging as shown in Figure 8B. Black plastic cutlery could not be detected because the pigments they contain absorbed too much light (Figure 8B), and no detectable signal could be evaluated for material identification.
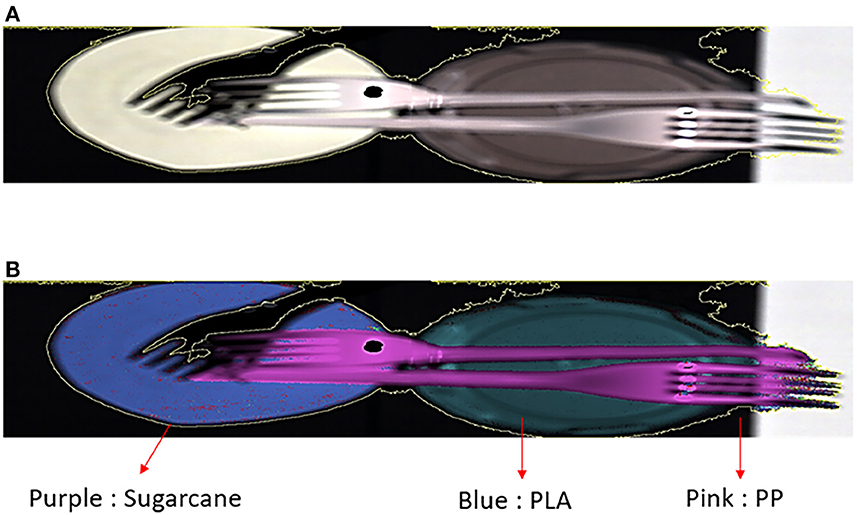
Figure 8. PLS-DA model applied to detect compostable materials in the market (plastic plate, plastic lid and cutleries). (A) RGB optical image obtained by the hyperspectral camera (HySpex Baldur S-640i N), (B) the hyperspectral image overlayed with the classification color (purple: sugarcane, blue: PLA and pink: PP).
The model has also been applied to classify overlapping small sized materials (10 mm), and it provided perfect classification result as demonstrated in Figure 9 and Table 5. Most pixels of the materials were predicted correctly but some pixels (red) were misclassified due to surface roughness and the scattering of light. Thus, the acquisition conditions such as angle of the halogen lamp, integration time, frame rate and speed of conveyor belt has an impact on the quality of hyperspectral images and accuracy of the system.
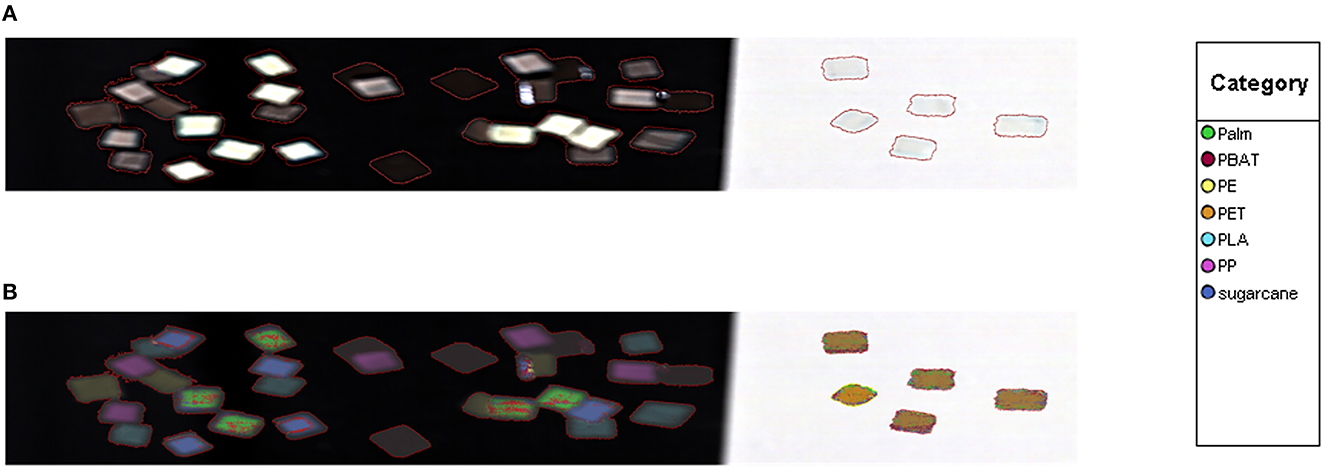
Figure 9. PLS-DA model applied to detect small size (10 mm) of materials. (A) RGB optical image obtained by the hyperspectral camera, (B) the hyperspectral image overlayed with the classification color.

Table 5. Accuracy and misclassification rate of overlapping small materials.
The other issues that affect the real-world application of this technique are the time required to classify each sample and the cost of the system. The system provides real time analysis which makes high throughput possible, the classification rate being determined by the computing power. However, the cost of hyperspectral imaging technology is higher than current sorting technologies. The estimated price of hyperspectral cameras currently range from $45,000 to $49,800 (Optosky, 2022).
4. Discussion and conclusions
The combination of HSI in the SWIR range (950–1,730 nm) and multivariate data analysis (MDA) were applied to distinguish types of materials. The dataset comprises various size of compostable materials (sugarcane and palm leaf derived), compostable plastic (PLA, PBAT) and conventional plastics (PP, LDPE and PET).
The approach in this work was to differentiate between 7 types of materials (sugarcane, palm, PP, LDPE, PET, PBAT, and PLA) with various size (50 x 50 mm, 40 x 40 mm, 30 x 30 mm, 20 x 20 mm, 10 x 10 mm, and 5 x 5 mm) and predict types of materials as well as determine the performance of the model. For training datasets, the sizes of materials were larger than the testing dataset as mentioned in the methods section. The PCA score plot was developed on the training dataset. The result clearly illustrated that the model built can perfectly differentiate between types of materials. There is also no overlap among the classes. It can be concluded that the variation among types of samples can be attributed to the chemical structure of the materials. After that, a PLS-DA model with pre-processed MSC and SNV was developed to classify types of materials. The accuracy, misclassification rate, sensitivity and specificity values were calculated to measure the performance of the classification model. It gave a satisfactory result where the accuracy and misclassification of the model was 100 and 0% for all types of materials. Furthermore, both sensitivity and specificity were 1.
Since the performance of the model on training datasets was very good, the model was applied to classify types of materials on the testing dataset. The performance of the model was also measured. It gave an excellent classification result. The partial least squares discriminant analysis (PLS-DA) model pre-processed with MSC and SNV was successful and achieved with 100% accuracy for PP, PET, PLA. The accuracy for LDPE and PBAT classification was 90%, while the accuracy level for palm and sugarcane-based packaging classification was 40 and 60% respectively. A few errors in misclassification occurred due to the roughness of surface and scattering of light.
The model has also been applied to overlapping samples and real-world compostable packaging. The model also gave good results. For overlapping small samples, the misclassification rate of palm leaf derived packaging was 20% while other types of material were 0%. However, the hyperspectral imaging system has a limitation in common with other IR detection systems, in cannot reliably detect dark materials because of light absorbance effects.
The classification technique that we have developed is different to the approach reported by Moroni and Mei (2020). Both systems are able to identify compostable plastic (PLA) with very high accuracy. While the accuracy of their model was more than 95%, our classification model was 100%. The results of Maroni and Mei study also demonstrated that the spectral indices had a tremendous impact on performance of the separation system, where accuracy of the system dropped from 100 to 96% when the spectral indices (λ1 / λ2) changed to 1,120/1,370. While our study focused on size resolution, the accuracy decreased with sample size for certain materials (e.g., palm-leaf derived packaging).
Our system is capable of accurately sorting compostable plastics at the typical product scale (compostable spoons, forks, coffee lids) and differentiating them from identical looking conventional plastic items with high accuracy. For the system to be adopted by industrial composters, the classification speed needs to be increased to match the conveyor speeds in use, and real-time robotic removal of the plastics needs to be demonstrated.
The compostable plastic market worldwide is predicted to reach $3,102.6 million by 2027. The full environmental advantages of compostable plastic will only be realized if these plastics does not pollute other waste streams and do not enter the open unmanaged environment. HSI is a promising technology due to real time sorting: it has high accuracy (99%), low power consumption and no additional chemicals or water are needed. Some recycling plants are interested in HSI because it is able to enhance sorting purity of plastics recycling collections and industrial composting. Nevertheless, the operational costs of this sorting technology are significant and can only be justified by higher revenues from the increased performance of recycling and industrial composting facilities (Taneepanichskul et al., 2022).
Data availability statement
The raw data supporting the conclusions of this article will be made available by the authors, without undue reservation.
Author contributions
NT conducted experiments. NT, HH, and MM analyzed the data. All authors contributed to the article and approved the submitted version.
Funding
This work was carried out at the UCL Plastic Waste Innovation Hub and was funded by a Thai Government Ph.D. scholarship and a NERC grant NE/V010735/1.
Conflict of interest
The authors declare that the research was conducted in the absence of any commercial or financial relationships that could be construed as a potential conflict of interest.
Publisher's note
All claims expressed in this article are solely those of the authors and do not necessarily represent those of their affiliated organizations, or those of the publisher, the editors and the reviewers. Any product that may be evaluated in this article, or claim that may be made by its manufacturer, is not guaranteed or endorsed by the publisher.
References
Abdi, H., and Williams, L. J. (2010). Principal component analysis. Wiley Interdiscip. Rev. Comput. Stat. 2, 433–459. doi: 10.1002/wics.101
AMR (2022). Compostable Plastic Market. Available online at: https://www.alliedmarketresearch.com/compostable-plastic-market-A06578 (accessed 28 February, 2022).
Balsi, M., Esposito, S., and Moroni, M. (2018). Hyperspectral characterization of marine plastic litters. (2018). Bari: IEEE International Workshop on Metrology for the Sea; Learning to Measure Sea Health Parameters (MetroSea). IEEE. 28–32. doi: 10.1109/MetroSea.2018.8657875
Biopak (2022). Bioplastics vs. Plastics: What's Better for the Environment? Available online at: https://www.biopak.com/sg/resources/bioplastic-vs-regular-plastic (accessed 12 January, 2023).
Bioplastic, E. (2022). Bioplastics Market Data. Available online at: https://www.european-bioplastics.org/market/ (accessed 12 January, 2023).
Bonifazi, G., D'agostini, M., Dall'ava, A., Serranti, S., and Turioni, F. (2013). “A new hyperspectral imaging based device for quality control in plastic recycling. Optical Sensors,” in 2013 International Society for Optics and Photonics. 8774. doi: 10.1117/12.2014909
Farrugia, J., Griffin, S., Valdramidis, V. P., Camilleri, K., and Falzon, O. (2021). Principal component analysis of hyperspectral data for early detection of mould in cheeselets. Curr. Res. Nutr. Food Sci. 4, 18–27. doi: 10.1016/j.crfs.2020.12.003
Hyspex (2021). Hyspex Baldur S-640i N. Available online at: https://www.hyspex.com/hyspex-products/hyspex-baldur/hyspex-baldur-s-640i-n/ (accessed 3 April, 2022).
Jolliffe, I. (2005). “Principal component analysis,” in Encyclopedia of Statistics in Behavioral Science. doi: 10.1002/0470013192.bsa501
Krejcie, R. V., and Morgan, D. W. (1970). Determining sample size for research activities. Educ. Psychol. Meas. 30, 607–610. doi: 10.1177/001316447003000308
Moroni, M., and Mei, A. (2020). Characterization and separation of traditional and bio-plastics by hyperspectral devices. Appl. Sci. 10, 2800. doi: 10.3390/app10082800
Moroni, M., Mei, A., Leonardi, A., Lupo, E., and Marca, F. L. (2015). PET and PVC separation with hyperspectral imagery. Sensors. 15, 2205–2227. doi: 10.3390/s150102205
Optosky (2022). Hyperspectral Camera. Available online at: https://optosky.com/hyper-spectral-imager.html (accessed 12 January, 2022).
Purkiss, D., Allison, A. L., Lorencatto, F., Michie, S., and Miodownik, M. (2022). The big compost experiment: using citizen science to assess the impact and effectiveness of biodegradable and compostable plastics in UK home composting. Front. Sustainab. 3, 942724. doi: 10.3389/frsus.2022.942724
REA (2021). Policy on Liners and Re-Purposed Bags Suitable for Separate Collection Of Targeted Food Waste Streams From Households, Businesses And Non-Domestic Premises in Eng. Available online at: https://www.r-e-a.net/wp-content/uploads/2021/08/REA_policy_on_liners_and_re-purposed_bags_for_collecting_targeted_food_waste_streams_FINAL_v1-1_18082021.pdf (accessed 1 December, 2021).
SEPA (2019). Plastic in Food Waste at Compost Sites. Available online at: https://www.sepa.org.uk/media/536296/191125-final-compost-input-quality-report-v6.pdf (accessed 1 December, 2021).
Serranti, S., Fiore, L., Bonifazi, G., Takeshima, A., Takeuchi, H., and Kashiwada, S. (2019). Microplastics characterization by hyperspectral imaging in the SWIR range. SPIE future sensing technologies, 2019. Int. J. Opt. Photonics 11, 19710. doi: 10.1117/12.2542793
Serranti, S., Gargiulo, A., and Bonifazi, G. (2011). Characterization of post-consumer polyolefin wastes by hyperspectral imaging for quality control in recycling processes. Waste Manag. 31, 2217–2227. doi: 10.1016/j.wasman.2011.06.007
Serranti, S., Luciani, V., Bonifazi, G., Hu, B., and Rem, P. C. (2015). An innovative recycling process to obtain pure polyethylene and polypropylene from household waste. Waste Manag. 35, 12–20. doi: 10.1016/j.wasman.2014.10.017
Song, J., Murphy, R., Narayan, R., and Davies, G. (2009). Biodegradable and compostable alternatives to conventional plastics. Philos. Trans. R. Soc. 364, 2127–2139. doi: 10.1098/rstb.2008.0289
Taneepanichskul, N., Purkiss, D., and Miodownik, M. (2022). A review of sorting and separating technologies suitable for compostable and biodegradable plastic packaging. Front. Sustain. 3, 901885. doi: 10.3389/frsus.2022.901885
Wold, S., Sjöström, M., and Eriksson, L. (2001). PLS-regression: a basic tool of chemometrics. Chemom. Intell. Lab. Syst. 58, 109–130. doi: 10.1016/S0169-7439(01)00155-1
WRAP (2022). Plastic Packaging. Available online at: https://wrap.org.uk/taking-action/plastic-packaging (accessed 10 May, 2022).
Xiong, Z., Sun, D.-W., Zeng, X.-A., and Xie, A. (2014). Recent developments of hyperspectral imaging systems and their applications in detecting quality attributes of red meats: a review. J. Food Eng. 132, 1–13. doi: 10.1016/j.jfoodeng.2014.02.004
Keywords: hyperspectral imaging, deep learning, principal component analysis, automatic sorting, industrial composting
Citation: Taneepanichskul N, Hailes HC and Miodownik M (2023) Automatic identification and classification of compostable and biodegradable plastics using hyperspectral imaging. Front. Sustain. 4:1125954. doi: 10.3389/frsus.2023.1125954
Received: 16 December 2022; Accepted: 13 February 2023;
Published: 14 March 2023.
Edited by:
Tomaso Fortibuoni, Istituto Superiore per la Protezione e la Ricerca Ambientale (ISPRA), ItalyReviewed by:
Maria Angela Butturi, University of Modena and Reggio Emilia, ItalyChristian Bux, University of Bari Aldo Moro, Italy
Copyright © 2023 Taneepanichskul, Hailes and Miodownik. This is an open-access article distributed under the terms of the Creative Commons Attribution License (CC BY). The use, distribution or reproduction in other forums is permitted, provided the original author(s) and the copyright owner(s) are credited and that the original publication in this journal is cited, in accordance with accepted academic practice. No use, distribution or reproduction is permitted which does not comply with these terms.
*Correspondence: Mark Miodownik, bS5taW9kb3duaWtAdWNsLmFjLnVr