- 1Research Center for Sustainable International Business (SIB), International Business School Maastricht, Zuyd University of Applied Sciences, Maastricht, Netherlands
- 2Commodity Risk Management Expertise Center (CORMEC), Department of Marketing and Consumer Behaviour, Wageningen University & Research, Wageningen, Netherlands
- 3Research Center for Smart Urban Redesign, Zuyd University, Heerlen, Netherlands
In studying circularity in the construction and demolition industry (CDI) in the EU, five projects in selected EU countries were compared to assess how the application of circularity achieved balance in the environment, social and economic dimensions of sustainability. The selected projects using secondary data based on a web search of these projects involved different stages of the circularity ladder, used diverse design principles, and focused on different stages of the construction life cycle, making them interesting comparators for applying circularity in CDI. For strong sustainability to exist, there should be a balance between the sustainability triptych covering environment, social and economic dimensions which is often overlooked in many circular and sustainability projects with an overemphasis on one dimension and disregard for another. Selected indicators for the three dimensions included those found in environmental impact and life cycle assessments for environmental criteria, social impact assessments for social criteria and economic feasibility, and project appraisal and evaluation reports for economic criteria. In weighting criteria, several methods exist comprising subjective, objective, and integrated techniques. The robustness of objective vs. subjective weights is rather debatable. The objective of the research is to test different weighting techniques using subjective and objective methods to determine if differences in project rankings exist in terms of sustainability balance. The ranking of projects and conclusions about best practices in the CDI circular economy could be influenced by the weighting techniques used. As the weighting of criteria could influence project outcomes, objectivity in weighting is often advised. However, in this study, computational comparisons indicated that subjective methods do not significantly differ from objective ones that use mathematical and statistical rigor. As such, subjective weighting methods still conveniently capture credible and consistent results. Nonetheless, this should not detract from efforts to objectify weighting methods that lend more credence and justification to scoring and ranking results.
1. Introduction
In 1994, Elkington (1994) coined the phrase the triple bottom line (TBL) to underscore sustainable business performance that is measured in relation to its finances, its environmental impact, and social responsibility. These TBL dimensions are often referred to as the 3Ps for people (social), planet (environment), and profits (economic), which became an accounting framework that incorporates the three pillars of sustainability performance. Mulia et al. (2016) maintained that an appropriate balance exists between economic, environmental, and social outcomes. However, they argue that the TBL model, as proposed by Elkington as shown in Figure 1, shows a weak case for sustainability as only a small intersection of the overlapping circles of the sustainability dimensions represents the possibility of this balance. Other authors developed alternative stronger sustainability versions of the TBL like the adjacent circles model by Adams (2006) and the concentric circles model by Mitchell (2000) to starkly contrast with the Mickey Mouse model of Peet (2009) where the economic dimension dominates, and the environmental and social dimensions are the peripheral ears.

Figure 1. Triple bottom line models. SOC, social; ENV, environmental; ECO, economic. Source: Adapted from Mulia et al. (2016).
The debate on what makes weak and strong sustainability is further explored by Hediger (2006) and Dietz and Neumayer (2007), which centers on the substitutability between natural and physical capital and their implications for sustainability. Even in studies on corporate social responsibility (CSR) and financial performance which are often taken as a proxy indicator for the economic dimension of TBL, there is a perceived neglect of one of the dimensions. A meta-analysis conducted by Alshehhi et al. (2018) noted that CSR is mostly about the social element of sustainability and has nothing to do with the environmental and economic dimensions and that “the competition between the dimensions of sustainability” needed to be synthesized into a holistic framework. An interesting trend, though, observed in their literature survey was the shift toward corporate performance with a social–environmental combination, although overlooking this time economic sustainability.
The problem of equalizing the sustainability triptych of environment, social and economic dimensions is nowhere showcased than in rating the success of circularity projects using multi-criteria decision analysis (MCDA). The robustness of objective vs. subjective weighting techniques for sustainability criteria for each of the three dimensions leads to questions about whether substantial differences exist in the scoring and ranking of projects to determine best practices. In studying circularity in the construction and demolition industry (CDI) in the EU, five projects in selected member countries were compared to assess how the application of circularity achieved balance in the sustainability dimensions. All projects involved different stages of the circularity ladder; used diverse design principles; and focused on different stages of the construction life cycle, making them interesting subjects for comparison in terms of applying circularity in CDI. The objective of this research is to determine if rankings of the project according to balancing the sustainability dimensions would alter and substantially affect conclusions about best practices if different weighting methods using objective and subjective techniques were employed. The study was motivated by previous research conducted on the same projects1 that led to doubts about project ranking results due to the use of subjective weights. This would benefit policymakers and especially project evaluators in determining success in achieving balanced sustainability in circular projects, which oftentimes lack measurable parameters needed in developing objective weights.
In succeeding chapters, a brief literature review will be conducted on the interplay between sustainability, circularity, and corporate social responsibility (CSR), followed by a review of several methods comprising subjective and objective techniques in MCDA. The article proceeds with a discussion of the sustainability indicators used as criteria for the three dimensions and the actual calculation of the weighted scoring of the selected projects using different techniques. Finally, a review of the results is presented.
2. Literature review
The evaluation of selected projects in terms of their sustainability impacts will be conducted in terms of typical environmental, social, and economic indicators that represent criteria to be weighted and scored to determine project success in achieving balance in the three dimensions. The topics to be reviewed in this section will first cover the link between CSR, sustainability, and circularity and their application to CDI. This is followed by a survey of subjective and objective weighting techniques for MCDA. Finally, the literature review covers the criteria or indicators used in three dimensions to be used in evaluating project success in achieving balance in sustainability.
2.1. Circularity, sustainability, and CSR
There is no universal definition of CE based on literature surveys of De Angelis (2018) and Sillanpää and Ncibi (2019), although a global definition of circularity awaits consensus. The difficulty of finding a clear definition is attributed to the concept of CE being intertwined with sustainable development, CSR, and business models. While the former survey looks for common principles of CE found from originators in the various disciplines of economics,2 industrial ecology,3 biomimicry,4 architecture,5 and management,6 the latter work decries the limited attention to the social dimension to complete the triptych of sustainable development (economy–environment–social) and CSR's three P's (people, planet, and profit).
Both above-mentioned surveys use the metaphors of spaceships and sailboats, dating back the conceptualization of CE to Boulding (1966) publication allegorizing a closed economy as a spaceship with limited, finite resources subsisting on waste conversion. The sailboat analogy, in turn, refers to Ellen MacArthur, for whom a foundation for circularity was created. She circumnavigated the world in 2004 in record time, alluding to her boat as her world, requiring minimum resources to make the boat lighter and faster, hence just relying on available supplies to avoid unnecessary stops for restocking. It was in 1990, though, when the word CE was formally introduced by Pearce and Turner (1990), describing the path for economic growth within ecological limits. The early academic writings on CE resembled those of closed-loop supply chains described in industrial ecology, although focusing more on technical and engineering rather than business perspectives.
De Angelis (2018) further explored the link between CE and business models. A circular business model is one that combines notions of value proposition, value creation and delivery, and value capture within the Ellen MacArthur Foundation (2015)'s ReSOLVE7 framework, which stand for measures needed to innovate business models according to CE principles. Rizos et al. (2017) summarize multiplied CE definitions and interpretations, as found in Supplementary material 1. Evident from the surveys is that CE is conveniently juxtaposed against the alternative linear economy that is often characterized as a “take-make-use-dispose” paradigm, as shown in Figure 2. What is common among the different CE constructs is the idea of closing the loop, which means the disposal stage at the end feeds back into the production system to create circularity. Thus, the final stage of waste disposal is linked to the concept of circularity, as it is waste that is looped back.
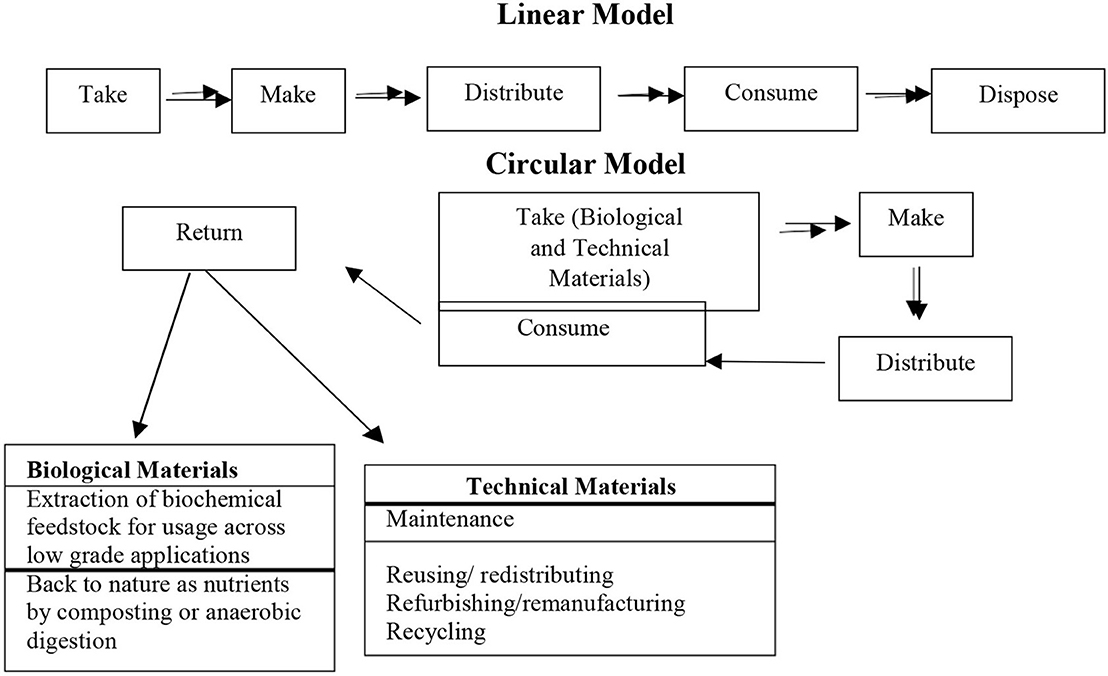
Figure 2. Circular vs. Linear economy. Source: Adapted from De Angelis (2018, p. 21).
Grant et al. (2017) developed a hierarchy of waste management that comprises the stages of circularity shown in Figure 3. Reduce means using fewer resources. Reuse involves using a product or some parts that can be shared, refurbished (restoring a product to good condition but not comparable to brand new), repaired (fixing a fault that made the product inoperable), or remanufactured (replacing worn, non-functional product, or component to “like new” or “better than new” condition, hence upcycling). Recycle refers to product recovery, where waste is separated into materials that may be reprocessed or fitted into new products. Recover is creating energy from waste that cannot be reused or recycled and hence, incinerated. Disposal, in turn, is the final destination for waste as a landfill, which may be problematic when materials are toxic or non-biodegradable. In this framework, waste prevention is preferable to waste disposal.
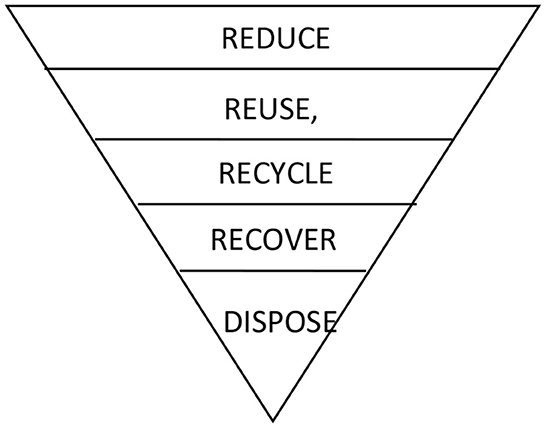
Figure 3. Hierarchy of waste management. Source: Adapted from Grant et al. (2017, p. 183).
Kirchherr et al. (2017), Ghisellini et al. (2018), and Potting et al. (2018) extend the hierarchy to comprise more Rs (Refuse, Rethink, Reduce, Reuse, Repair, Refurbish, Remanufacture, Repurpose, Recycle, and Recover), as shown in Figure 4, as a more comprehensive construct.
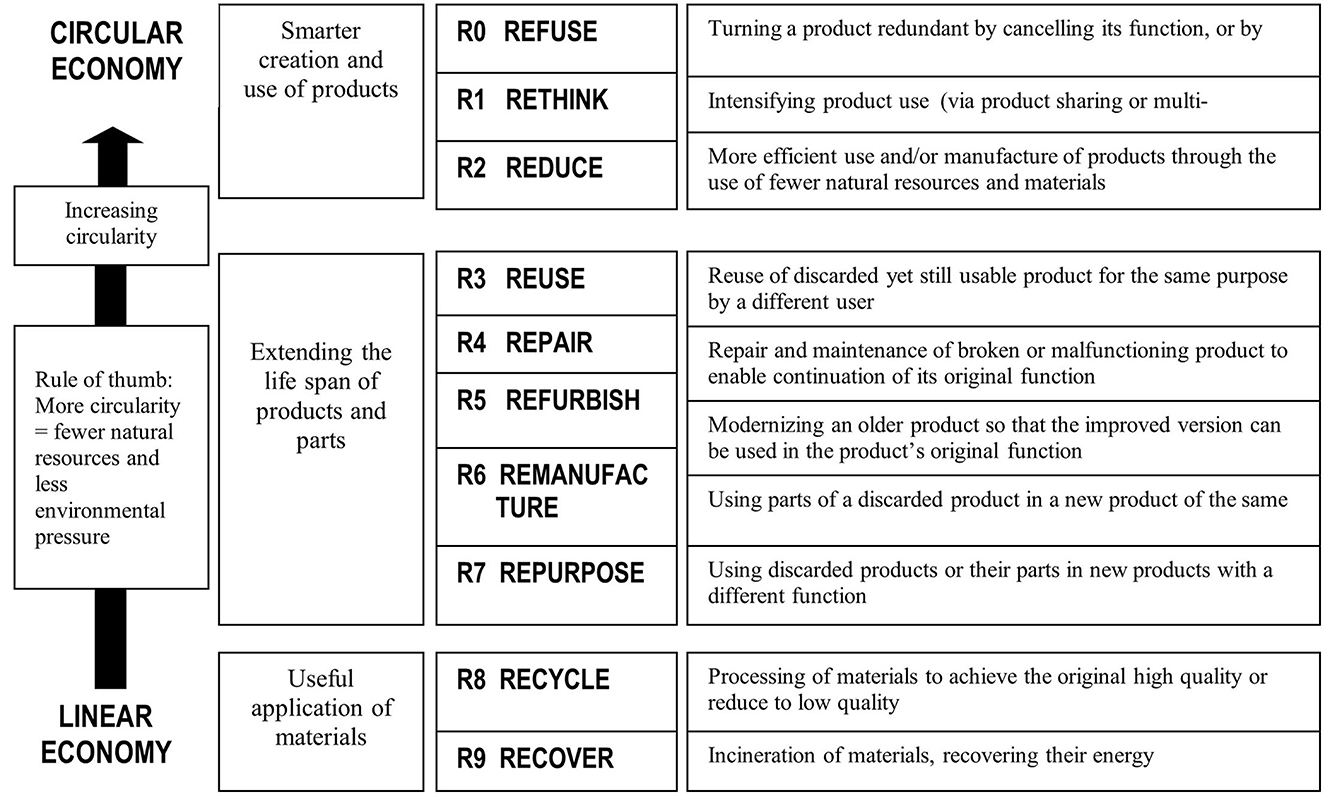
Figure 4. The R's of the circular economy. Source: Adapted from Potting et al. (2018).
De Groene Zaak (2015) amended this hierarchy and introduced a circularity ladder that probes into the environmental sustainability of different CE business models. A distinction is made between product life extension and sharing models and resource recovery business models. The former potentially reduces the amount of waste generated by slowing resource loops and funneling resource flows, whereas the latter simply diverts existing waste toward material and energy recovery. Compared to the waste hierarchy model, which ranks waste management options according to environmental impacts associated with the end-of-life phase, the circularity ladder takes into account the environmental impact of the entire product life cycle. The circularity ladder is depicted in Figure 5.
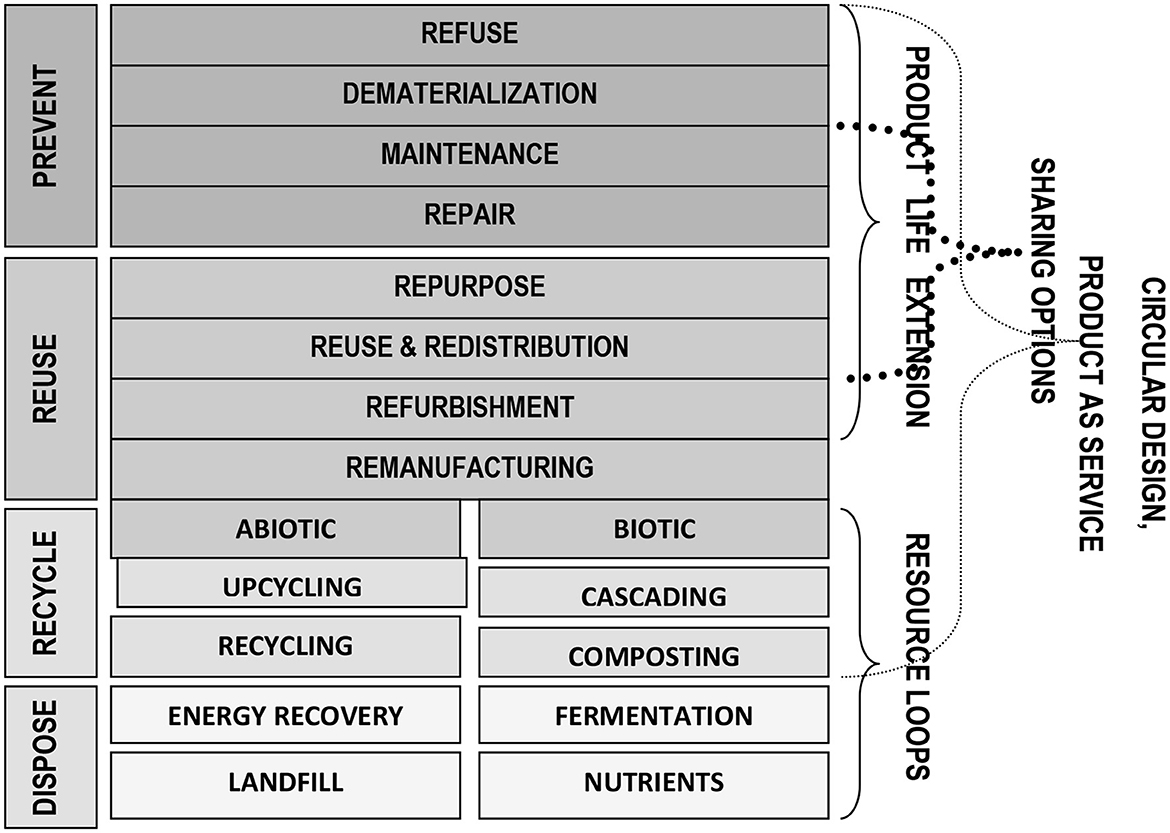
Figure 5. The circularity ladder. Source: Adapted from De Groene Zaak (2015).
2.2. Circularity in the construction and demolition industry
The EU Action Plan on the Circular Economy (EU Commission, 2015) formalized the EU mandate for member states to transit toward a CE in line with the EU's commitment to reach the UN Sustainable Development Goals (SDGs) by 2030. A CE at the EU level is envisioned to (i) protect businesses against scarcity of resources and accompanying price volatility, hence generating innovative and sustainable competitive advantages; (ii) save energy and avoid irreversible damages caused by resource usage exceeding the planet's renewal capacity; and (iii) create business opportunities into more efficient ways of producing and consuming, thereby creating local jobs, fostering skills and promoting social cohesion and integration. CE, in summary, cuts across many EU common policies and priority areas from energy and the environment, food safety and quality, farming, and sustainable agriculture to social cohesion, research and innovation, and entrepreneurship and promotion of small and medium enterprises (SMEs).
Several sectors were targeted in the EU CE action plan. The priority sectors that were identified were plastics, food waste, critical raw materials, construction and demolition, and biomass and bio-based products. This article will focus on the application of circularity in the CDI, which became a priority area since the industry has the largest waste stream by volume based on Wahlström et al. (2020), contributing 839 million tons based on 2018 EU-wide data. This represented 36% of all waste in the EU, as shown in Figure 6, with a breakdown by member state illustrated in Figure 7. Most of the CDI waste, however, ends up in incinerators for energy production or as down cycled content for road surfaces despite its enormous potential for recycling and reuse, hence “closing the loop”. Earlier, CDI was a target for the EU energy policy regarding its operational efficiency in energy usage.
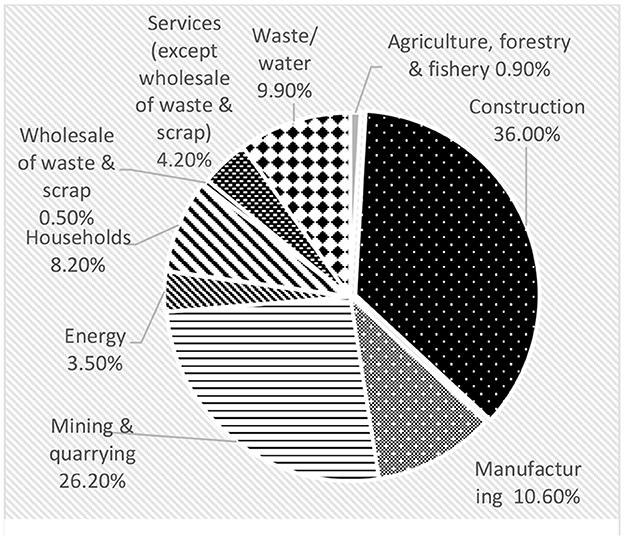
Figure 6. Waste generation by economic activity and households EU-27, 2018. Source: Eurostat (online data code: env_wasgen).
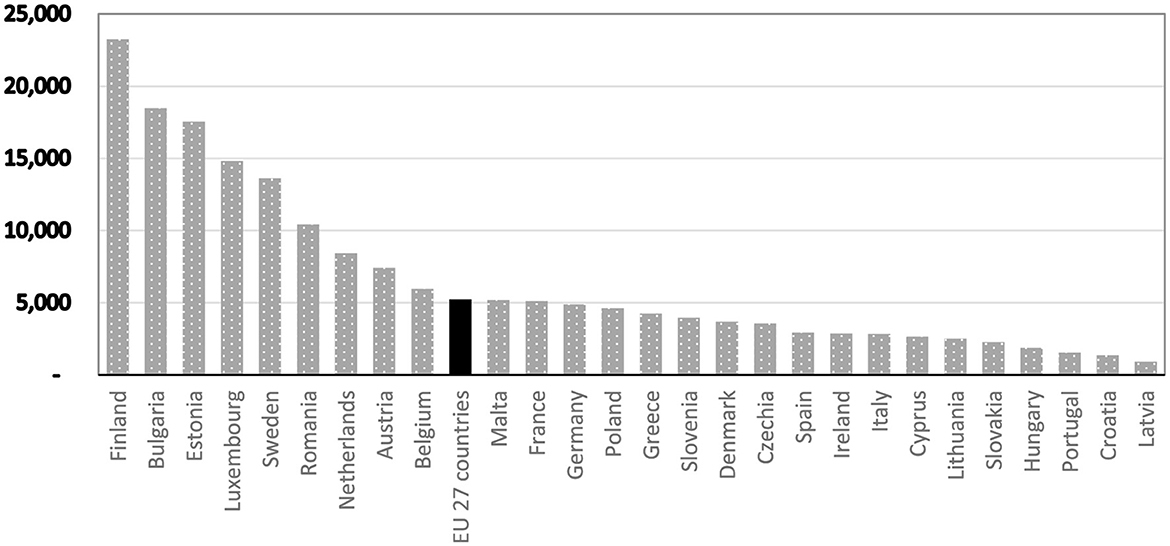
Figure 7. Per capita waste generation in the EU-27 (in kg), 2018. Source: Eurostat (online data code: env_wasgen).
2.3. Weighting methods for multi-criteria decision analysis
The main objective of MCDA is to furnish decision-makers with tools enabling the selection of solutions to a multi-criteria decision problem involving conflicting criteria. Several MCDA methods are used by researchers according to Zardari et al. (2015) such as analytic hierarchy process (AHP), analytic network process (ANP), ELECTRE,8 GP (goal programming), MACBETH,9 MAUT,10 MAVT,11 PROMETHEE,12 TOPSIS,13 and WSM (Weighted Sum Model). These methods fall into three categories based on similar principles, namely: (i) multiple attribute theory, (ii) outranking methods, and (iii) interactive methods. In these MCDA methods, transparency, the complexity of calculations, and cost considerations influence the choice of method.
The simplest and most popular MCDA method is the WSM, or what Ginevicius and Podvezko (2005) called the simple additive weighting (SAW) method. Triantaphyllou and Mann (1989) expressed the WSM as follows: , where AWSM is the WSM score of the best alternative, N is the number of criteria, aij is the actual value of the ith alternative in terms of the jth criterion, and wj is the weight of importance of the jth criterion. Assuming additive utility, the total value of each alternative equates to the sum of products given in the expression. This restriction in WSM is later modified in the weighted product method (WPM), where the main difference is the use of multiplication, making the calculation dimensionless by eliminating units of measure. Triantaphyllou and Mann (1989) further explained the WPM as calculated using the formula: , where N, aij, and wj are the same as in WSM and AK and AL are alternatives or options being considered by the decision-maker. The values of will either be less than, equal to, or exceeding unity, where the latter case indicates that alternative AK is superior to alternative AL. If all alternatives are lined up on this scaling, the best or superior alternative is the one that has the highest value for . Hence, instead of actual values, relative ones are used as follows: , where ajs are actual values and are relative values.
In this study, the WSM approach is used as the scoring system since it is methodologically similar to AHP developed by Saaty (1980). As illustrated and mathematically proven in Triantaphyllou and Mann (1989), AHP will “tend to behave like the WSM as the number of alternatives increases.” By testing the AHP, WSM, and WPM methods, the authors found that when converted into percentages, the WPM was inapplicable due to the occurrence of zeros and hence the problem of division by zeros, and the WSM yielded the most reliable results.
All these MCDA approaches are traditionally grouped into quantitative and qualitative methods. In qualitative methods, the decision maker employs verbal analysis in selecting the best alternative from several available options and ranks them in descending order of significance. The extent to which the alternatives differ often requires the complicated task of rating the alternatives, especially if a sufficient amount of criteria exists on a particular characteristic, thus requiring the use of quantitative methods to determine the best option.
When using quantitative methods, the influence of specific criteria depends on the weights of the criteria. Vinogradova et al. (2018) described the criteria weights as expressing the significance and influence on the evaluation results. These criteria weights can be subjective, objective, and integrated based on classifications by several MCDA authors.14 The main objective of the weighting method is to assign cardinal or ordinal values to different criteria to indicate their relative importance in the choice decision.
Subjective weights are based on estimates that decision-makers assign, normally influenced by their preferences. Objective weights, in turn, are obtained through mathematical methods, and decision-makers have no role in determining the relative importance of the criteria. The integrated weighting method combines subjective and objective weights that involve multiplication and additive synthesis (Zardari et al., 2015), where the principle is to integrate subjective weights based on opinion and objective weights that are mathematically processed information gathered from the criteria data.
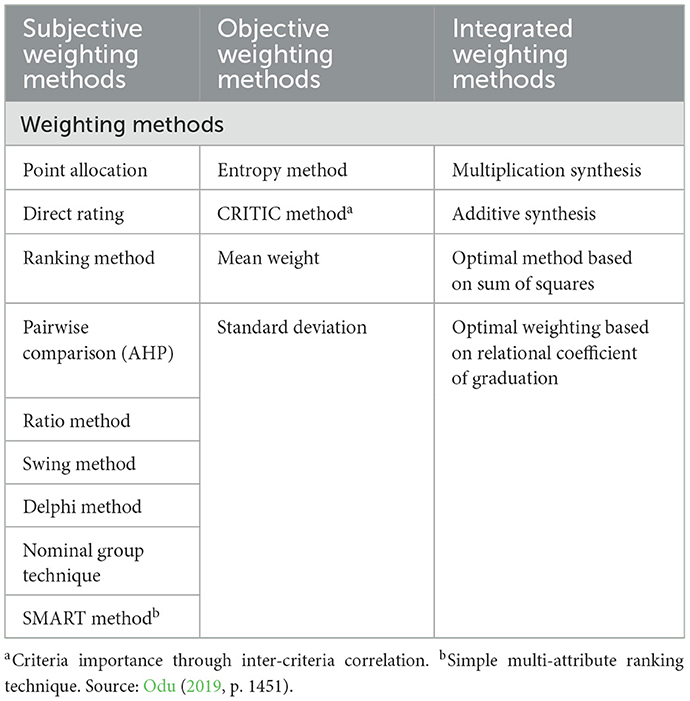
Zardari et al. (2015) and Odu (2019) surveyed the different weighting methods used in MCDA. They compared these weighting methods in determining preference for each criterion in terms of desirable properties that satisfy a performance measure. These weighting techniques are summarized in Table 1.
In this study, selected subjective weighting methods such as point allocation, direct rating, ranking, pairwise comparison, and Delphi methods will be used. For objective weighting methods, only the mean weight and CRITIC methods will be measured as the other objective techniques needed more raw information that was not available or accessible from which standard deviations or variances could be calculated. These methods will be described in the Research Methodology section.
2.4. Environmental, economic, and social indicators
The construction and demolition industry has a pivotal role to play in sustainable development, as noted by Zabihi et al. (2012), Zhang et al. (2014), Yilmaz and Bakis (2015), and Zavadskas et al. (2018) requiring integration of technological, economic, social and environmental benefits. Following the TBL paradigm of sustainable development in the circular economy, the following part of the literature review will explain the indicators to be used to weigh and score the three sustainability dimensions. These indicators are typically used in environmental and social impact assessments, life cycle assessments, and economic technical and feasibility studies, forming the criteria used in MCDA performed for this research. Ortiz-de-Monetllano and van de Meer (2022) meanwhile suggested that circularity indicators should differentiate between circularity processes (the 9 R's) and circularity impacts (the three sustainability dimensions).
2.4.1. Environmental impact
Singh et al. (2016) describe the common tools used to assess the environmental impact of projects, which are: environmental impact assessment (EIA), ecological footprint (EF), and life cycle assessment (LCA). Performed usually during the planning stage of a project, an EIA identifies and predicts the impact on the environment and outlines mitigation measures to eradicate negative effects of the project on the environment such as carbon or greenhouse gas (GHG) emissions, water use, energy demand, solid waste, exposure to hazardous and toxic materials, and other forms of pollution. In Yijun et al. (2011), the CE theory is applied to EIA. On the other hand, EF, based on the Global Footprint Network,15 was introduced in the 1990s to measure how much resources, especially from nature, are consumed and how much waste is generated, hence accounting for the demand for and supply of natural resources. On the demand side, EF aggregates all productive areas for which consumers, society, or a given product compete, hence measuring the ecological assets required by users to produce the natural resources they consume and to absorb its waste, specifically carbon emissions. On the supply side, EF measures the bio-capacity or productivity of ecological assets to absorb the waste that an economy generates. The third tool, LCA, is an international standardized methodology for accounting for the environmental footprint of a product or service within the requirements of ISO 14040 and 14044, as cited by OECD (2019). LCA involves data collection on inputs (resources) and outputs (emissions and waste) that constitute inventory analysis, which gets translated into indicators of environmental, health, and resource availability impacts leading to some quantification of an environmental load of products or services throughout their lifetime. Ortiz et al. (2009) review research conducted on LCA in the construction and building sector. Haupt and Hellweg (2019) developed a framework for measuring environmental sustainability in a CE that measures the environmental value retained by circular products through the different circularity stages. The list of environmental criteria or indicators to be used for the selected projects and their respective definitions are shown in Supplementary material 3.
2.4.2. Economic impact
Rizos et al. (2017) describe the economic effects of CE as generating employment in the recycling business. However, caution should be placed on net employment as there are also jobs that get displaced by CE, especially in sectors involved in the production of primary extractive materials. Other economic effects cited in Hysa et al. (2020) are trade effects in terms of exports of new recycled materials coupled with reduction of imports of primary materials; value chain multiplier effects in terms of input purchases and delivery channels as well as cross-value chain cooperation; changes in consumption usage and demand patterns; higher value-added and greater residual values at the end of life of buildings; increase in investments in innovations and new technologies related to recycling and remanufacturing; and savings on building maintenance costs. While most circular projects in the built environment are subsidized, the potential for self-financing is important for replicating similar CE projects. Otherwise, these become reliant on the availability of subsidies. The economic indicators are found in Supplementary material 4.
2.4.3. Social impact
Padilla-Rivera et al. (2020) surveyed how social aspects have been considered and incorporated in CE. They suggested thematic areas in terms of labor practices and decency of work, human rights, society, and product responsibility. The social impact of CE concerns mostly stakeholder participation, as shown by Persson and Olander (2004) and Bal et al. (2013), but social impact assessments suggest other indicators relating to income equality, cultural diversity, involuntary settlement, gender and race disparities; social cohesion and inclusion, and preservation of cultural heritage as outlined in IDB (2018). The social life cycle assessment (S-LCA) by UNEP (2009) also covers socio-economic aspects along the life cycle of products and services that directly affects stakeholders positively or negatively. However, many of these indicators overlap with economic and environmental indicators such as local employment, supplier relationships, health, and consumer and worker safety. In this article, these overlapping indicators were used in the economic impact instead of social. The social indicators are listed in Supplementary material 5.
3. Research methodology
3.1. Selection of EU projects for comparison
The selection criteria for the choice of projects involves the following: (1) the location of the project inside the EU member states; (2) the availability of data in terms of project description, interim or final assessments as cited by official websites of the project sponsors, social media including architectural digests and magazines, or industry associations; (3) capacity for expedient comparative analysis in line with the requirements of sustainable development in the CDI although no selection criteria were made for the type of building (whether residential or public or commercial). The countries chosen for this study were the Netherlands, Belgium, Germany, France, and Denmark. Figure 6 shows that on a per capita basis, these countries were among the top 10 waste producers in Western Europe, with the Netherlands ranking fourth16; Belgium, sixth; France, seventh; Germany, eighth; and Denmark, ninth.
Supplementary material 6 describes the projects, which are namely; (1) the Superlocal project in the Netherlands (Figure 7); (2) the Circular Retrofit Lab (CRL) project in Belgium (Supplementary material 8); (3) Open-Air Library in Germany (Supplementary material 9); (4) Rehafutur Engineer's House project in France (Supplementary material 10); and (5) Upcycle Studios in Denmark (Supplementary material 11).
The key points of the projects are as follows: (1) the Superlocal project is distinct for dismounting a whole apartment studio hull and moving it to a new site which is a feature of designing for disassembly, and for developing stackable instead of cemented bricks to facilitate disassembly at the end of life for reuse; (2) the Circular Retrofit Lab is prominent for designing for adaptability with reversible solutions being brainstormed by stakeholders including architecture students, contractors, and product manufacturers; (3) the Open-Air Library stands out as a community project from its design using donated beer crates and reused façade of a historic warehouse as construction materials, and reclaiming an unused abandoned industrial site for the project; (4) the Rehafutur Engineer's House exemplifies the selection of materials experimenting on use of natural or biological resources for insulation while preserving the cultural heritage of a UNESCO site; and (5) the Upcycle Studios showcases the use of upcycled materials from construction debris, careful segregation of toxic from non-toxic elements and designing for adaptability where functionality of space is flexed between housing and business configurations.
3.2. Methodology for comparing project sustainability dimensions
3.2.1. Choice of criteria
To compare the selected EU projects on the three dimensions of sustainability, a qualitative approach of MCDA was used where criteria for each sustainability dimension were ranked by importance. Then projects were scored based on each criterion used for assessing the impacts of the three dimensions. The criteria used were chosen based on indicators discussed in Section 2.4 of the article.
3.2.2. Scoring of the projects
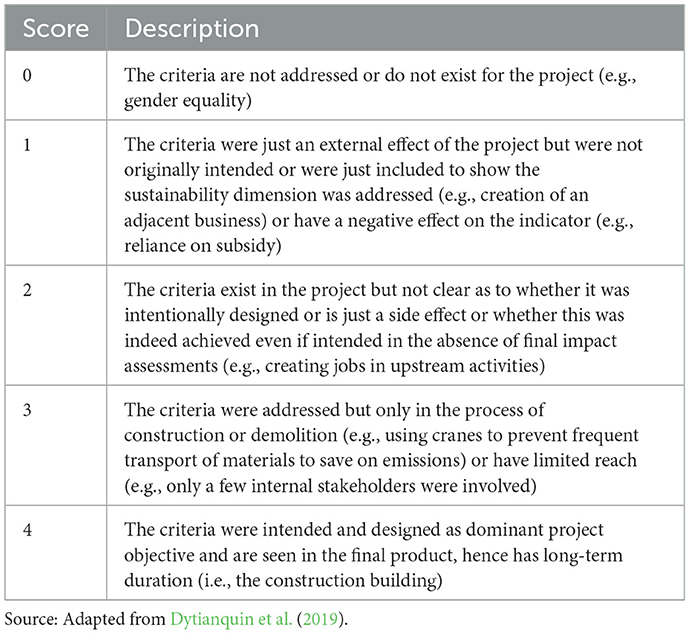
To make the impact of different weighting methods on the results comparable, the scoring system of the projects has to be standardized. All indicators of each sustainability dimension are scored from 0 to 4 with 4 indicating the highest using a Likert scale. The higher the score, the more the project addresses the sustainability yardstick of the sustainability dimension. The scale allows some range that is not too close to if only three scores were used and will prevent the error of central tendency or choosing the middle score. The scoring system is shown in Table 2.
The scores are then multiplied by the weights of the indicators for each dimension and then summed up to get the total score for the project for that sustainability dimension. The weighted total scores for the three dimensions of a project are then averaged with equal weights for each dimension since the objective is to obtain balance. Based on the average weighted scores, the projects are then ranked from 1 to 5 as there are five projects, with 1 being the best practice or most balanced project in terms of sustainability/circularity, hence obtaining the first position.
3.2.3. Subjective weighting methods
As this article is about the impact of weighting methods, five subjective weighting methods will be used—point allocation, equal weighting, direct rating, ranking, pairwise comparison, and Delphi methods.
The point allocation method involves assigning numbers to the criteria that sum up to 100 points, which implies that the weights are easy to normalize. The more points assigned to a criterion signify its relative importance. However, the method loses precision as the number of criteria exceeds six. Supplementary material 7 shows the results for the projects using the point allocation method.
In the direct rating method, the decision maker ranks all the criteria according to importance on an ordinal scale. Often the numbers 1–5, 1–7, or 1–10 are used for the importance, which can be altered without adjusting the weight of another criterion as normalization rules require. In this study, the importance of the criteria in each sustainability dimension was ranked from 1 to 3 where 3 is the highest, depending on whether the criteria are a necessary and sufficient condition to produce the required sustainability effect. A necessary condition must be present for an event to occur, while sufficiency establishes conditions that will produce the event. A necessary condition must be present but it alone does not provide sufficient cause for the event to occur. According to Dul (2015), a necessary condition allows an outcome to exist, whereas a sufficient condition ensures and produces the outcome. The author uses the analogy of a high score on the Graduate Record Examination (GRE) test for a student to enter graduate school (the outcome) where an adequate score is necessary for the outcome but not sufficient as other admission requirements such as a good motivation letter, TOEFL score, recommendation letter, and evidence of student performance and grades, are required. However, a low GRE score would certainly not lead to admission independent of how the student performs on the other requirements. A sustainability criterion is a 3 if it is both necessary and sufficient to produce the sustainability effect, a 2 if it is sufficient but not necessary, and a 1 if it is necessary but not sufficient. The results of the direct rating method applied to the projects are shown in Supplementary material 8.
The ranking method is similar to the direct rating method except that the ranks are normalized by dividing by the sum of all the ranks. Roszkowska (2013) described three approaches to calculating weights using the ranking method—the rank sum, rank exponent, and rank reciprocal. The rank-sum formula is given as: where rj is the rank of the jth criterion, j = 1,2….,n.
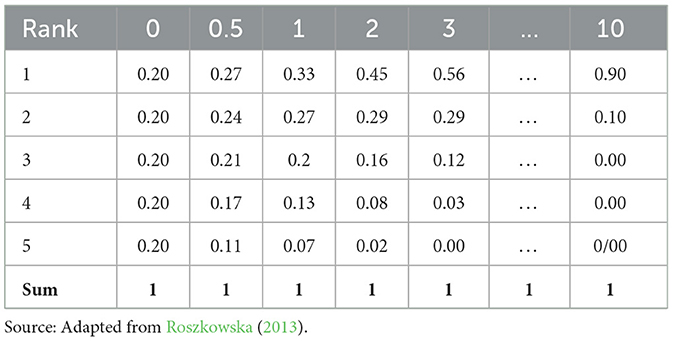
The rank exponent method is a generalized version of the rank-sum method. The numerator and denominator in the rank-sum method formula are raised to an exponential parameter ρ representing the weight of the most important criterion according to the decision maker. This is expressed as follows: . In Table 3, Roszkowska (2013) shows how weight distributions become steeper as the exponential ρ is raised to n = 5. The third method, called the reciprocal or inverse weight method, uses the reciprocal of the ranks by dividing each term by the sum of the reciprocals, as shown in the following formula: . Supplementary materials 9–11 show the results of the ranking method using the rank-sum, rank exponent, and rank reciprocal methods.
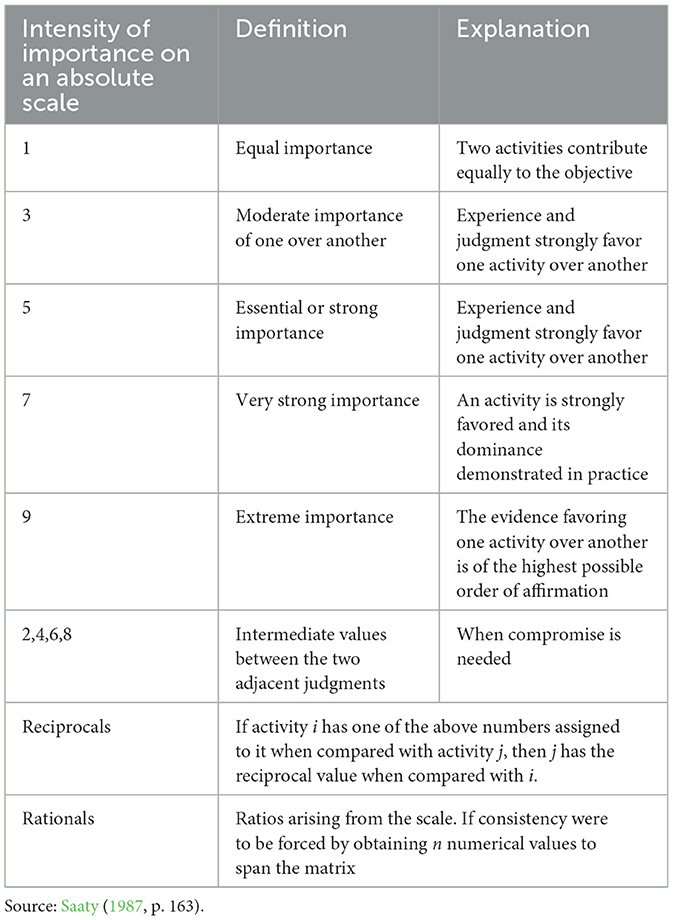
According to Zardari et al. (2015), the pairwise comparison is an old psychometric technique that is a well-developed method of ordering criteria. As the name suggests, it involves comparing each criterion against every other criterion in pairs with the number of comparisons (Cp) determined by: with n being the number of criteria. Calculating weights using pairwise comparisons entails three steps: The first is developing a matrix of criteria with their intensity values where the diagonals are 1, the upper triangular matrix are paired comparative rankings using Saaty (1987) ordinal scale, and the lower triangular matrix are reciprocal values of the upper triangular. This means that if criterion i was assigned a number to it compared to criterion j, the latter has the reciprocal value when compared to i. The rankings of pairs are based on the AHP developed by Saaty17 using his table of importance, as shown in Table 4.
The second step involves calculating the criteria weights, also known as principal eigenvectors, by taking the geometric mean of each row (i.e., taking the nth root of the number of criteria), as suggested in Dean (2022) following Saaty (2001), and which are then normalized into a resulting new column of the pairwise correlation matrix. Another method suggested by Zardari et al. (2015) and Odu (2019) is to sum the values in each column, dividing each element by the column total and dividing the sum of the normalized scores for each row by the number of criteria, which yields a priority vector.
The third step computes a consistency ratio (CR) where a value lower than 0.1 indicates a reasonable level of consistency in the pairwise comparisons and larger than 0.1 indicate inconsistent judgments. As outlined in Odu (2019), a consistency check involves the following three steps: (a) multiplying each value in the pairwise comparisons matrix by the respective criteria weight or eigenvector to obtain a priority vector; (b) the products of the priority vector and pairwise matrix in step a) generate elements of λmax which is needed to calculate the consistency index (CI) solved as , where n denotes the number of criteria. Then, the random index (RI) taken from Saaty (1980) is used, as shown in Table 5, to locate the number of criteria. The consistency ratio (CR) is the ratio between the CI and RI, i.e., where the hurdle value is 0.10, which indicates that the pairwise comparisons are consistent.
Given these AHP scales, Supplementary material 12 shows the pairwise comparisons using the geometric mean approach for the selected projects, while Supplementary material 13 shows the calculations of the pairwise comparisons needed to measure the consistency ratios found in Supplementary material 14. Based on the last table, all criteria used for the three sustainability dimensions passed the hurdle of 10% for consistency of pairwise comparisons with the environment, economic and social indicators obtaining 9.7, 9.4, and 8.1%, respectively.
The Delphi method is another subjective method involving the selection of experts as participants to give their view on the weights to be accorded each criterion. The weights are then either voted upon or averaged out to reach a synthesis of the final weights to be used to evaluate the criteria. For this weighting method, a survey was passed on to engineers of the Zuyd's Research Center for Smart Urban Redesign, to which five faculty members responded. So as not to prejudice the weightings given by the experts, the project descriptions were not attached, and the questions asked the weights engineers would typically give to the different environmental, economic, and social criteria. The results of the weighting using this method are shown in Supplementary material 15.
3.2.4. Objective weighting methods
The mean weight method is the simplest method as it distributes the weights equally without any preference shown by the decision maker. Roszkowska (2013) states that when there is no knowledge about weights, then the weights are represented by a uniform probability density function where the expected value is centroid (center of mass) of the line with coordinates (½, ½) such that w1(EW) = w2(EW)=. The following weight formula is thus used called the mean weight: where j = 1,2,…, n. Again, as the number of criteria increases to ten or more, the weights become diminutive. The results of applying the equal weighting method to the selected projects are shown in Supplementary material 16.
Another objective weighting method used for this study was the CRITIC method. CRITIC involves the use of correlation analysis to reveal contrasts between criteria. A matrix of rj's is first created containing ideally the raw data of all n alternatives, although Zardari et al. (2015) used scores of the alternatives to comprise the rj matrix. The standard deviation of each vector of rj's is calculated to represent the contrast intensity of the corresponding criterion. A symmetric matrix of dimension m x m is then created with rows and columns corresponding to each criterion. The correlation coefficients of each element of the matrix are denoted as ljk is then calculated where the values denote the discordancy of the scores of a pair of criteria (i.e., the lower, the more discordant). Then, another matrix denoted as containing the ljk's subtracted from 1 is generated and then summed up to measure the conflict created by criterion j with another criterion k with respect to the decision situation defined by the rest of the criteria. The amount of information denoted by Cj is then measured by multiplying each standard deviation calculated earlier (σj) by the conflict matrix, hence: . A higher value of Cj signifies that more information is transmitted by the respective criterion, which is relatively important for decision-making. The objective weights for each criterion are finally derived by normalizing the resulting vector of Cj's to unity, i.e., . The results of applying the CRITIC method are illustrated in Supplementary material 17 using the metrics needed for calculating the objective weights shown in Supplementary material 18.
The other objective criteria methods could not be applied due to a lack of information. For example, data on actual carbon emitted or residual values, or actual jobs created are not available for all or most of the projects. Thus, only the results of the mean weight method and CRITIC among the objective techniques can be measured.
4. Research findings
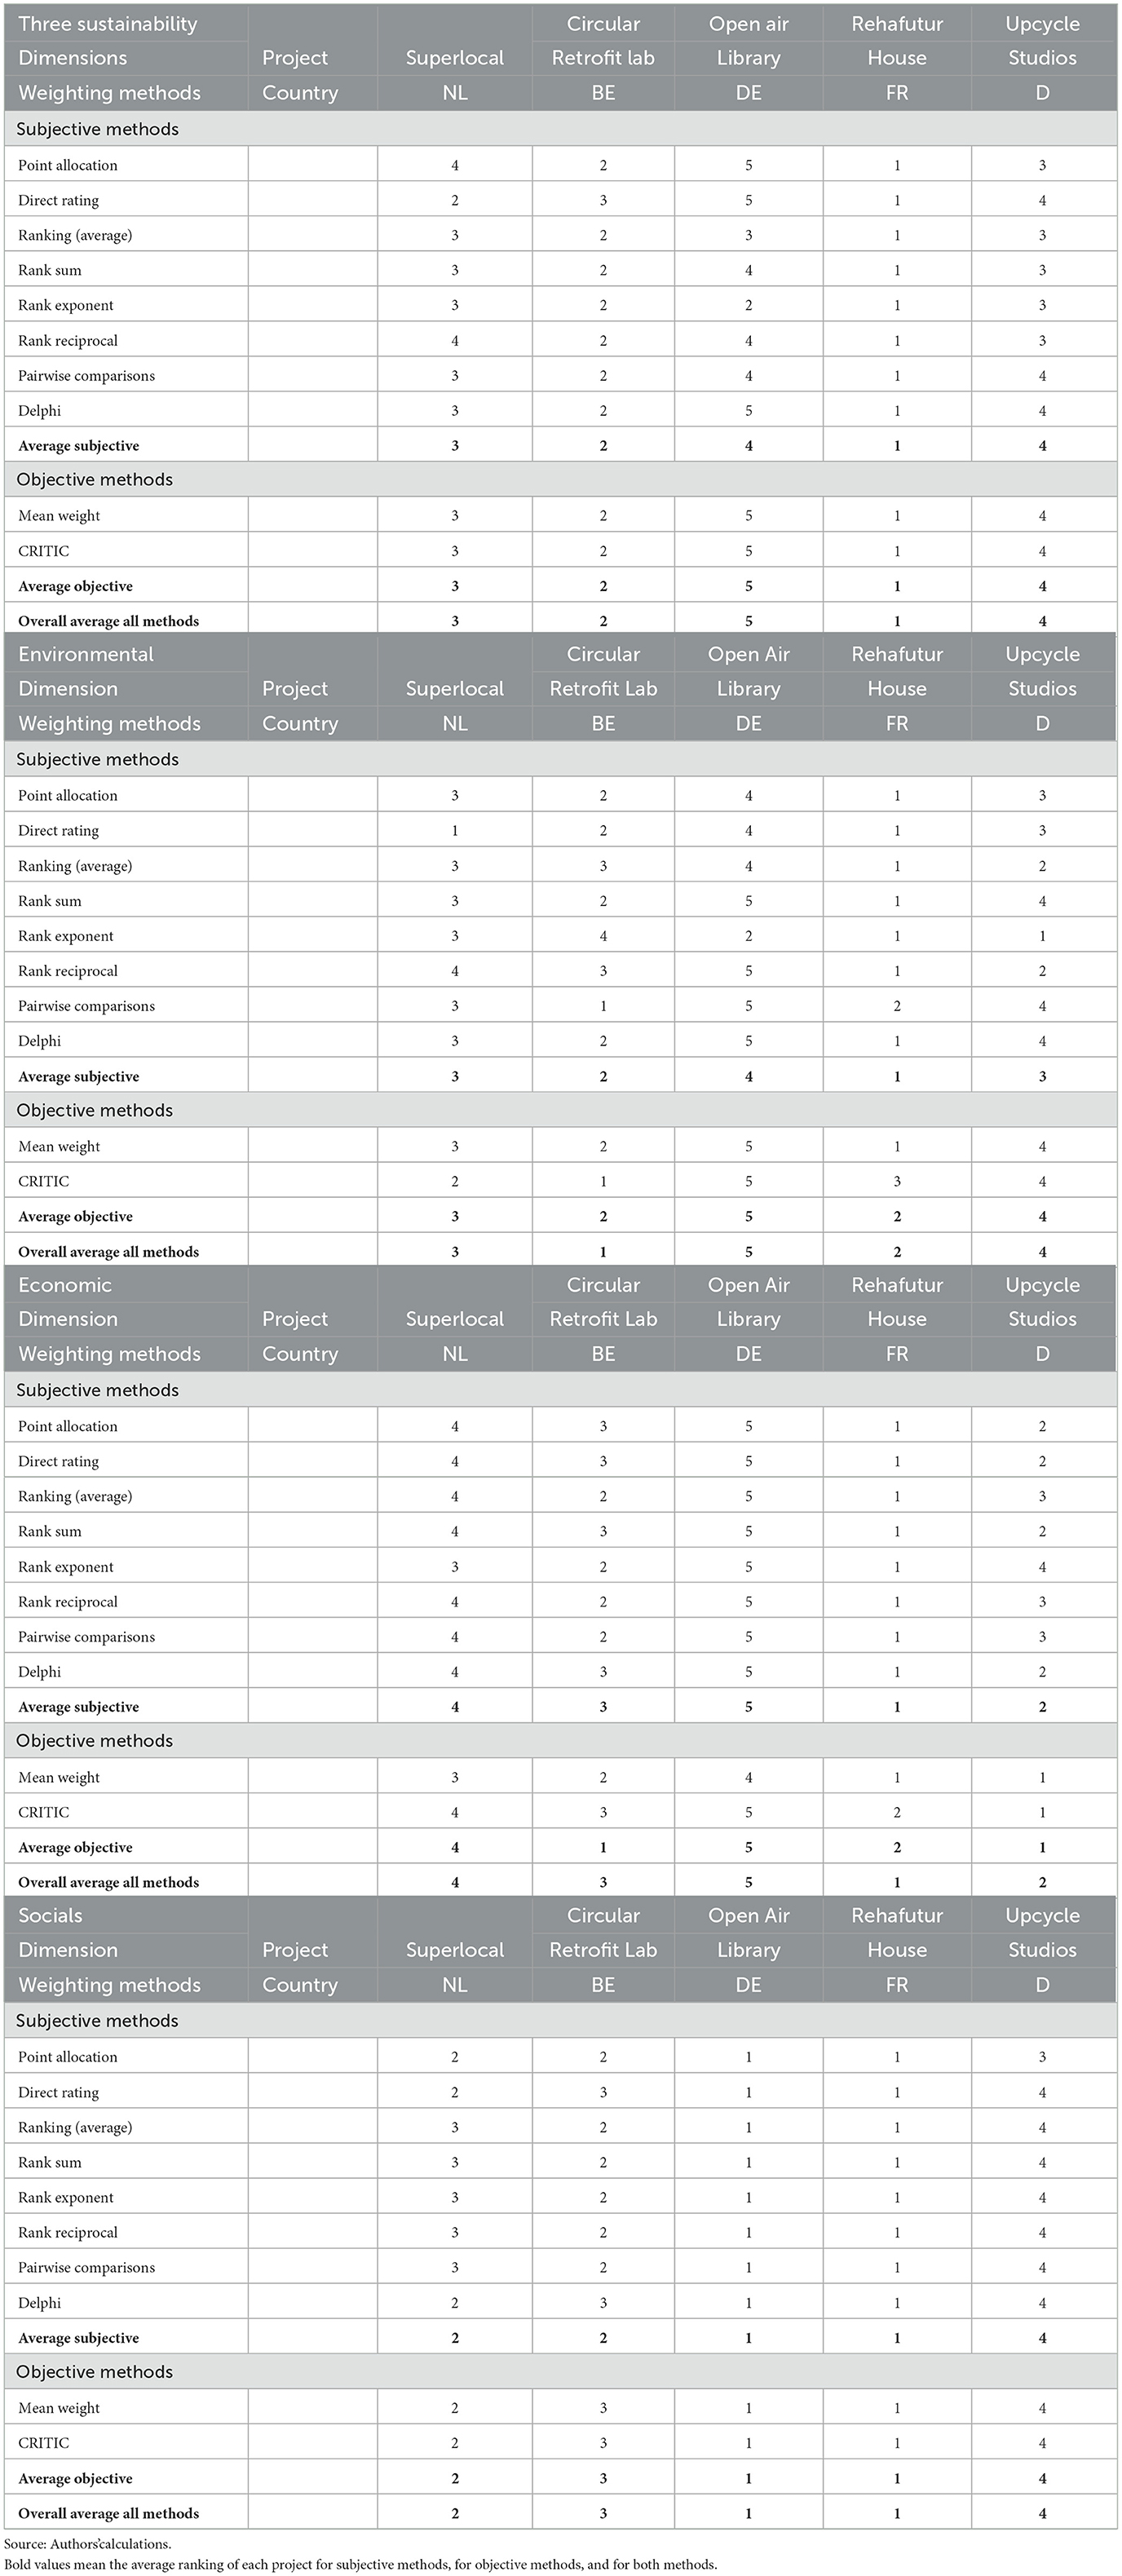
The rankings of the selected projects are normally affected by the weighting methods used in the scoring of the criteria. In this case, several environmental, economic, and social indicators were scored to determine the best-ranking project on CDI that balances the sustainability triptych or triple bottom line (TBL). A mixture of subjective and objective weighting methods was tested using a standard scoring system for comparability and consistency to determine if the weighting procedure influences the project rankings. For the study, seven subjective methods and two objective methods were tested. Table 6 shows a comparison of the weighting methods on the ranking of the five EU projects.
The results show that the average project rankings for both subjective and objective weighting methods were similar, with the French project taking the lead, followed by the Belgian, Dutch, and Danish projects, and trailing last is the German project. The results are consistent for both objective weighting methods but vary a bit in the ranking for the second to fourth slots depending on the subjective weighting method used. However, there was consistency in the rankings for the first and last spots for all subjective weighting methods, which in this case are the Rehafutur House (French) and Open-Air Library (German) projects, respectively.
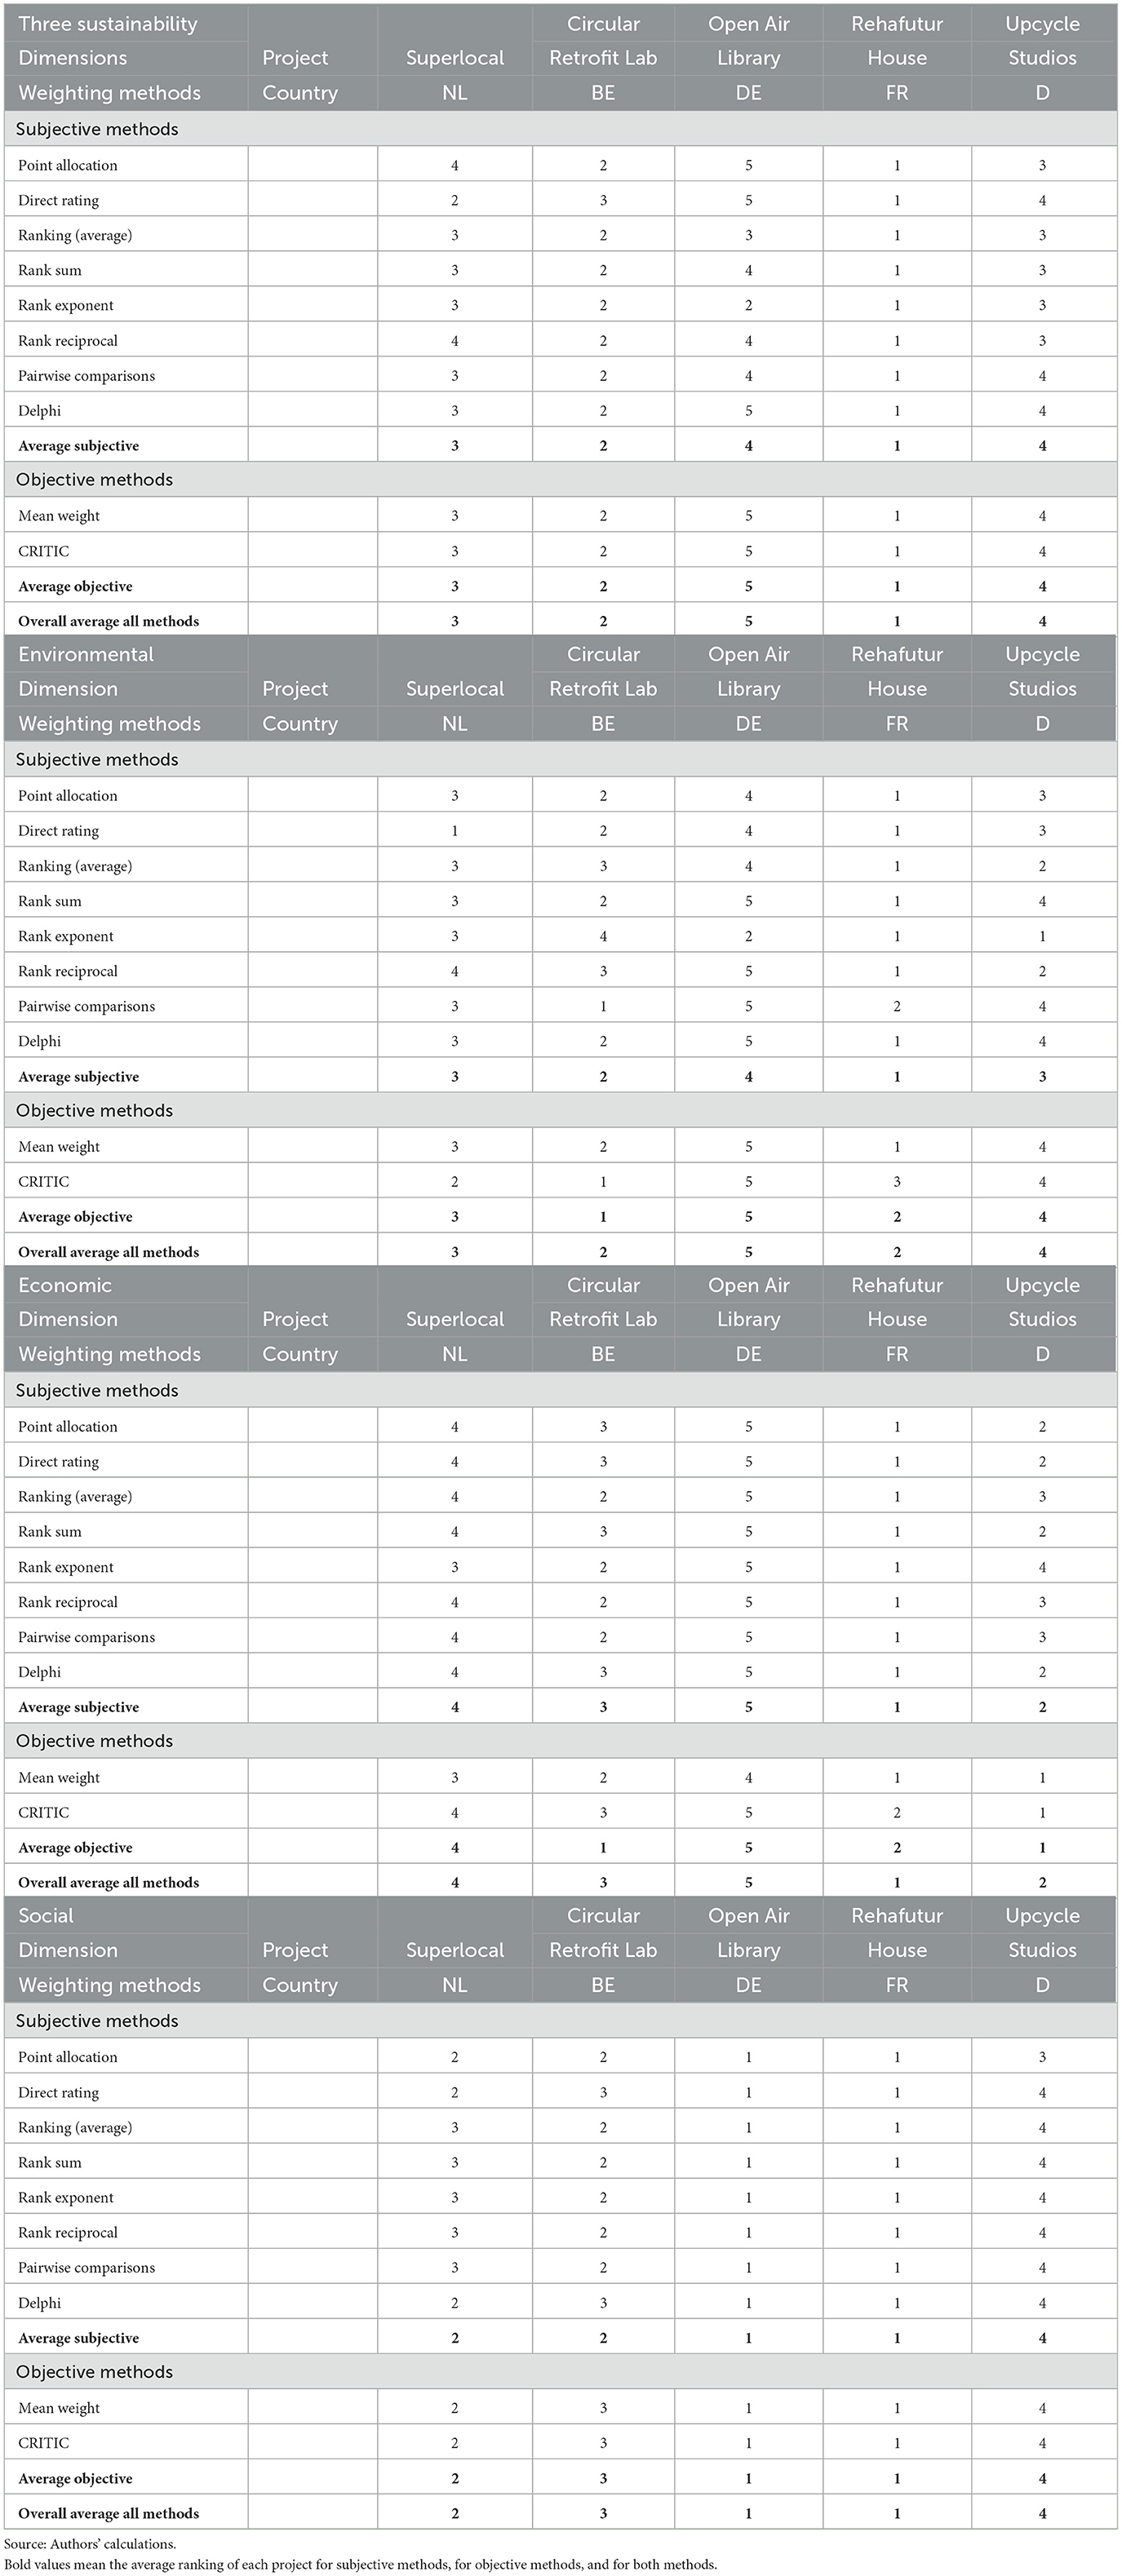
By sustainability dimension shown in Table 7, the Circular Retrofit Lab ranked first overall for the environment using the average rankings for both subjective and objective weighting techniques, followed by Rehafutur House. However, the latter ranked first in the subjective weighting methods. The Open-Air Library consistently ranked last in both weighting methods, as did Superlocal at third and Upcycle Studios at fourth places, respectively.
In terms of economic dimension, the Rehafutur House ranked first in the subjective but second in the objective weighting method. However, it prevailed in the first place when averaging the results of the two methods. The objective method awarded leading ranks to Upcycle Studios and the Circular Retrofit Lab in the economic dimension. However, the latter was outranked for third by the former at second when taking the average of the two methods. Both the Superlocal and Open-Air Library consistently landed in fourth and fifth places, respectively in the economic dimension in both weighting methods.
Finally, in the social dimension, the Open-Air Library tied with the Rehafutur House for first place under both weighting methods, with the last spot going to the Upcycle Studios. In the social dimension, the Superlocal and Circular Retrofit Lab projects were outranking each other in the second and third spots depending on the weighting method. However, in the average of both methods, the Dutch project ended up having more social sustainability compared to the Belgian project.
In the Delphi method, where experts were asked to weigh the criteria, it was also worth noting that three out of the five experts (60%) would weigh the criteria for the TBL equally in the absence of project information, particularly for the environmental and social dimensions; and two out of five experts (40%) for the economic dimensions.
5. Conclusion and limitations
The main research question of the study is to determine which of the selected EU projects achieved a balance between the environmental, economic, and social objectives of sustainability and circularity in CDI. This represents the decision-making goal for which different criteria were used, and the projects could be considered as alternatives that the decision-maker is evaluating. As is normally experienced in MCDA, the weighting methods matter in the final ranking or evaluation of alternatives, or as in this study's case, the outcome of project success in balancing sustainability dimensions of environmental, social, and economic objectives. While it may be important for decision-makers and applied researchers to consider objectivity in weighting decisions, the computational comparisons indicate that results arising from the use of subjective weighting methods, which are simple and measure-friendly, do not differ significantly from objective weighting methods that are mathematically rigorous and data intensive. As such, subjective weighting methods still conveniently capture similar results, at least for the highest and lowest ranking projects in this study. For the other projects in between, where rankings are so close to each other and are interchanging depending on the subjective or objective approach used, a compromise is to average the results of the different subjective techniques to determine a more justifiable outcome. This conclusion, though, is not meant to underplay efforts to objectify weighting methods that lend more credence to scoring and ranking results and are, therefore, more justifiable.
There are also overlaps in the criteria for sustainability dimensions as borne by the construction and building experts who participated in the Delphi method, where additional criteria were suggested but are covered or implied by the existing list of indicators. Cases in point are the inclusion of ozone depletion potential, which is implied in GHG emissions; responsible sourcing materials, which is covered by the use of biotic materials; and eutrophication and acidification potentials in water bodies that fall under land use. Categorization of certain criteria is also problematic as they could appear in two of the TBL dimensions. For instance, changes in consumption or demand patterns (responsible consumption) are sometimes grouped under social or economic dimensions. Some indicators are claimed to be redundant, like stakeholder participation and community involvement, so reading the descriptions and definitions of the indicators is crucial before any even weighting and scoring procedure can commence.
The study is limited by the lack of raw information from the projects to properly conduct the other objective weighting methods. Actual or estimated numbers on carbon emissions and water use, solid waste reduction in tons, employment or jobs created, the savings on maintenance costs and residual values, suppliers and other stakeholders consulted, training and workshops conducted were not available. Many indicators as well are not prone to these quantifications such as preservation of cultural heritage, embodied energy and pollution, or change in consumption patterns. The collection of this raw project information will help measure weights objectively using standard deviation or variance procedures.
Caution should also be taken to generalize project success by nationality as the choice of projects could have affected the results. A better project from a country could have been selected to tilt the results. As weighting methods belong to the methodological realm of determining balance in achieving the triple bottom line, it must be noted that the balance of the sustainability dimensions for projects in the CDI sector also depends on several antecedents, such as (1) the circularity policy at the national, municipality or regional levels; (2) the stages of circularity the project is addressing in the waste hierarchy or circularity ladder framework; (3) building design principles; and (4) the life cycle phases of the construction industry. These antecedents were explored and described in a separate article.18
Data availability statement
The raw data supporting the conclusions of this article will be made available by the authors, without undue reservation.
Author contributions
All authors listed have made a substantial, direct, and intellectual contribution to the work and approved it for publication.
Acknowledgments
This article reproduced portions of a previous conference paper on Crossing Boundaries 2021 held in Maastricht, Netherlands, on 24–25 March 2021 and published by IOP with reference doi: 10.1088/1755-1315/855/1/012017, particularly some sections on the Literature Review (Sections 2.1, 2.2, and 2.4), Methodology (Sections 3.1 and 3.2), and Supplementary materials 1–16. The previous conference article published by IOP focused on antecedents for project success in circularity in CDI, while this article focuses on the comparison of objective and subjective weighting criteria in evaluating project success. The overlap lies in the use of the same EU CDI projects for both papers and portions of the literature review on the circular economy, sustainability and CSR, circularity in CDI and description of environmental, social, and economic indicators, as well as the selected EU projects. This statement is issued for ethical reasons for copyright which per the IOP website, is covered by the Creative Commons Attribution 3.0 license, which allows copying and redistributing, adapting, remixing, and building upon material published by IOP.
Conflict of interest
The authors declare that the research was conducted in the absence of any commercial or financial relationships that could be construed as a potential conflict of interest.
Publisher's note
All claims expressed in this article are solely those of the authors and do not necessarily represent those of their affiliated organizations, or those of the publisher, the editors and the reviewers. Any product that may be evaluated in this article, or claim that may be made by its manufacturer, is not guaranteed or endorsed by the publisher.
Supplementary material
The Supplementary Material for this article can be found online at: https://www.frontiersin.org/articles/10.3389/frsus.2023.1115865/full#supplementary-material
Footnotes
1. ^See Dytianquin et al. (2019) as published in IPO with doi: 10.1088/1755-1315/855/1/012017.
2. ^See Boulding (1966), Mäler (1974), Tietenberg (1984), Pearce and Turner (1990), and Daly (1992).
3. ^See Frosch and Gallopoulos (1989), Allenby (1992), Chertow (2000), Bringezu (2003), Wells and Seitz (2005), Linton et al. (2007), Lifset and Boons (2012), and Bloomsma and Brennan (2017).
4. ^The study of innovative solutions in nature and natural processes. See Benyus (2002), Kennedy (2007), Marshall and Lozeva (2009), Habib (2011), Das et al. (2015), and Green et al. (2015).
5. ^See Stahel (1986), Lyle (1994), and McDonough and Braungart (2002).
6. ^See Lovins et al. (1999), Hawken et al. (2000), and Pauli (2010).
7. ^REgenerate, Share, Optimize, Loop, Virtualize, and Exchange.
8. ^Elimination and choice translating reality which is the English translation of the French acronym.
9. ^Measuring attractiveness by a categorical based evaluation TECHnique.
10. ^Multi-attribute utility theory.
11. ^Multi-attribute value theory.
12. ^Preference ranking organization method for enrichment evaluation.
13. ^Technique for order preference by similarity to ideal solution.
14. ^See Belton and Stewart (2002), Ginevicius and Podvezko (2005), Wang et al. (2009), Zarghami and Szidarovszky (2011), Stanujkic et al. (2013), Zardari et al. (2015), Guarini et al. (2018), Vinogradova et al. (2018), Odu (2019), Randelović et al. (2020), and Keshavarz-Ghoarbaee et al. (2021).
15. ^See https://www.footprintnetwork.org/.
16. ^After Finland, Luxembourg, and Sweden.
17. ^See Saaty (1987), Saaty (2004), and Saaty (2008).
18. ^See Dytianquin et al. (2019) as published in IPO with doi: 10.1088/1755-1315/855/1/012017.
References
Adams, W. M. (2006). The future of sustainability: rethinking environment and development in the Twenty-first Century. Report of the IUCN Renowned Thinkers Meeting.
Allenby, B. R. (1992). Achieving sustainable development through industrial ecology. Int. Environ. Affairs 4, 56–68.
Alshehhi, A., Nobanee, H., and Khare, N. (2018). The impact of sustainability practices on corporate financial performance: literature trends and future research potential. Sustainability 10, 494. doi: 10.3390/su10020494
Bal, M., Bryde, D., Fearon, D., and Ochieng, E. (2013). Stakeholder engagement: achieving sustainability in the construction sector. Sustainability 6, 695–710. doi: 10.3390/su5020695
Belton, V., and Stewart, T. (2002). Multiple Criteria Decision Analysis—An Integrated Approach. Boston, MA, USA: Kluwer Academic Press. doi: 10.1007/978-1-4615-1495-4
Bloomsma, F., and Brennan, G. (2017). The emergence of circular economy: a new framing around prolonging resource productivity. J. Ind. Ecol. 21, 603–614. doi: 10.1111/jiec.12603
Boulding, K. (1966). “The economics of the coming spaceship earth,” in Environmental quality in a growing economy, ed. H. Jarett (Baltimore, MD: Resources for the Future/Johns Hopkins University Press) 3–14.
Bringezu, S. (2003). “Industrial ecology and material flow analysis,” in Perspectives on Industrial Ecology, eds. D. Bourg and S. Erkman (Sheffield, UK: Greenleaf).
Chertow, M. (2000). Industrial symbiosis: Literature and taxonomy. Ann. Rev. Energy Environ. 25, 313–337. doi: 10.1146/annurev.energy.25.1.313
Daly, H. E. (1992). Allocation, distribution and scale: towards an economics that is efficient, just and sustainable. Ecol. Econ. 6, 185–193. doi: 10.1016/0921-8009(92)90024-M
Das, S., Bhowmick, M., Chattopadhyay, S. K., and Basak, S. (2015). Application of biomimicry in textiles. Curr. Sci. 109, 893–901. doi: 10.18520/cs/v109/i5/893-901
De Angelis, R. (2018). Business Models in the Circular Economy. London: Palgrave Macmillan. doi: 10.1007/978-3-319-75127-6
De Groene Zaak, E. (2015). Boosting circular design for a circular economy. Joint Report funded by EU Climate KIC Pioneers into Practice Programs.
Dietz, S., and Neumayer, E. (2007). Weak and strong sustainability in the SEEA: concepts and measurement. Ecol. Econ. 61, 617–626. doi: 10.1016/j.ecolecon.2006.09.007
Dul, J. (2015). Necessary condition analysis : Logic and methodology of “necessary but not sufficient” causality. Organ. Res. Methods 19, 10–52. doi: 10.1177/1094428115584005
Dytianquin, N., Hermans-Gregersen, J., Kalogeras, N., van Oorschot, J., and Ritzen, M. (2019). “Circularity in selected EU Countries: The case of construction and demolition industry,” IOP Conference Series: Earth and Environmental Science 855, 012017. doi: 10.1088/1755-1315/855/1/012017
Elkington, J. (1994). Towards the sustainable corporation win-win-win business strategies for sustainable development. California Manage. Rev. 36, 90–100. doi: 10.2307/41165746
Ellen MacArthur Foundation (2015). Towards the circular economy: Economic and business rationale for an accelerated transition. Available online at: https://www.ellenmacarthurfoundation.org/assets/downloads/publications/Ellen-MacArthur-Foundation-Towards-the-Circular-Economy-vol.1.pdf (accessed December 8, 2020).
EU Commission. (2015). Closing the Loop: An EU Action Plan for the Circular Economy. Communication from the Commission to the European Parliament, the Council, the European Economic and Social Committee and the Committee of the Regions. Brussels.
Frosch, R., and Gallopoulos, N. (1989). Strategies for manufacturing. Sci. Am. 261, 94–102. doi: 10.1038/scientificamerican0989-144
Ghisellini, P., Ripa, M., and Ulgiati, S. (2018). Exploring environmental and economic costs and benefits of a circular economy approach to the construction and demolition sector: A literature review. J. Cleaner Prod. 178, 618–643. doi: 10.1016/j.jclepro.2017.11.207
Ginevicius, R., and Podvezko, V. (2005). “Objective and subjective approaches to determining the criterion weight in multicriteria models,” in Proceedings of International Conference RelStat. Transport and Telecommunication 6 133–137.
Grant, D., Trautrims, A., and Wong, C. Y. (2017). Sustainable Logistics and Supply Chain Management (2nd Ed.). London: Kogan Page Ltd.
Green, D. W., Lee, J. M., and Jung, H. S. (2015). Marine structural biomaterials in medical biomimicry. Tissue Eng. Part Rev. 21, 438–450. doi: 10.1089/ten.teb.2015.0055
Guarini, M. R., Battisti, F., and Chiovitti, A. (2018). A Methodology for the Selection of Multi-Criteria Decision Analysis Methods in Real Estate and Land Management Processes. Sustainability 10, 507. doi: 10.3390/su10020507
Habib, M. K. (2011). Biomimetics: innovations and robotics. Int. J. Mechatr. Manuf. Syst. 4, 113–134. doi: 10.1504/IJMMS.2011.039263
Haupt, M., and Hellweg, S. (2019). Measuring the environmental sustainability of a circular economy. Environ. Sustain. Indic. 1, 10005. doi: 10.1016/j.indic.2019.100005
Hawken, P., Lovins, A., and Lovins, L. (2000). Natural Capitalism: The Next Industrial Revolution. London: Earthscan.
Hediger, W. (2006). Weak and strong sustainability, environmental conservation and economic growth. Nat. Resour. Model. 19, 359–394. doi: 10.1111/j.1939-7445.2006.tb00185.x
Hysa, E., Kruja, A., Ur Rehman, N., and Laurenti, R. (2020). Circular economy innovation and environmental sustainability impact on economic growth: An integrated model for sustainable development. Sustainability 12, 4831. doi: 10.3390/su12124831
IDB (2018). Inter-American Development Bank. Social impact assessment: integrating social issues in development projects. IDB Series on Environmental and Social Risk and Opportunity.
Kennedy, S. (2007). Biomimicry.bimimetics: general principles and practical examples. The Science Creative Quarterly. Available online at: https://www.scq.ubc.ca/biomimicrybimimetics-general-principles-and-practical-examples/ (accessed December 10, 2020).
Keshavarz-Ghoarbaee, M., Amiri, M., Zavadskas, E. K., Turskis, Z., and Antucheviciene, J. (2021). Determination of objective weights using a new method based on the removal effects of criteria (MEREC). Symmetry 13, 525. doi: 10.3390/sym13040525
Kirchherr, J., Reike, D., and Hekkert, M. (2017). Conceptualizing the circular economy: An analysis of 114 definitions. Resour. Conserv. Recycl. 127, 221–232. doi: 10.1016/j.resconrec.2017.09.005
Lifset, R., and Boons, F. (2012). Industrial ecology: Business management in a material world,” in The Oxford Handbook of Business and the Natural Environment, eds. P. Bansal, and A. Hoffman (Oxford: Oxford University Press). doi: 10.1093/oxfordhb/9780199584451.003.0017
Linton, J., Klassen, R., and Jayaramman, V. (2007). Sustainable supply chains; An introduction. J. Oper. Manage. 25, 1075–1082. doi: 10.1016/j.jom.2007.01.012
Lovins, A., Lovins, I., and Hawken, P. (1999). A road map for natural capitalism. Harvard Bus. Rev. 145, 158.
Mäler, K. G. (1974). Environmental Economics: A Theoretical Inquiry. Baltimore: Johns Hopkins University Press.
Marshall, A., and Lozeva, S. (2009). Questioning the theory and practice of biomimicry. Int. J. Design Nat. Ecodyn. 4, 1–10. doi: 10.2495/DNE-V4-N1-1-10
McDonough, W., and Braungart, M. (2002). Cradle to Cradle: Remaking the Way We Make Things. New York: North Point Press.
Mitchell, C. (2000). Integrating sustainability in chemical engineering practice and education: concentricity and its consequences. Process Safety Environ. Protect. 78, 237–242. doi: 10.1205/095758200530754
Mulia, P., Behura, A. K., and Kar, S. (2016). Categorical imperative in defense of strong sustainability. Problems Sustain. Develop. 11, 29–36.
Odu, G. O. (2019). Weighting methods for multi-criteria decision making technique. J. Appl. Sci. Environ. Manage. 23, 1449–1457. doi: 10.4314/jasem.v23i8.7
OECD (2019). Building Models for the Circular Economy: Opportunities and Challenges for Policy. Paris: OECD Publishing. doi: 10.1787/g2g9dd62-en
Ortiz, O., Castells, F., and Sonnemann, G. (2009). Sustainability in the construction industry: A review of recent developments based on LCA. Constr. Build. Mater. 23, 28–39. doi: 10.1016/j.conbuildmat.2007.11.012
Ortiz-de-Monetllano, C. G.-S., and van de Meer, Y. (2022). A theoretical framework for circular processes and impacts through a comprehensive review of indicators. Global J. Flexible Syst. Manage. 23, 291–314. doi: 10.1007/s40171-022-00300-5
Padilla-Rivera, A., Russo-Garrido, S., and Merveille, N. (2020). Addressing the social aspects of a circular economy: a systematic literature review. Sustainability 7912, 1–17. doi: 10.3390/su12197912
Pauli, G. (2010). The Blue Economy: 10 Years, 100 Innovations, 100 Million Jobs. Taos, NM: Paradigm Publications.
Pearce, D. W., and Turner, K. T. (1990). Economics of Natural Resources and the Environment. Baltimore: Johns Hopkins University Press.
Peet, J. (2009). Strong Sustainability for New Zealand: Principles and Scenario, SANZ (Phase-2). Report, New Zealand: Nakedize Ltd.
Persson, U., and Olander, S. (2004). “Methods to estimate stakeholder views of sustainability for construction projects,” in The 21st Conference on Passive and Low Energy Architecture (Eindhoven, Netherlands).
Potting, J., Hanemaaijer, A., Delahaye, R., Ganzevles, J., Hoekstra, R., and Lijzen, J. (2018). Circular economy: what we want to know and can measure. Framework and baseline assessment for monitoring the progress of the circular economy in the Netherlands. Policy Report. PBL Netherlands Environmental Assessment Agency.
Randelović, M., Savić, G., Stojanović, B., and Randelović, D. (2020). An Integrated DEA/AHP methodology for determining the criteria importance in the process of business-friendly certification at the local level. TEME. 6, 285–300. doi: 10.22190/TEME180614021R
Rizos, V., Tuokko, K., and Behrens, A. (2017). The circular economy: A review of definitions, processes and impact. Center for European Policy Studies (CEPS) Research Report No. 2017/8.
Roszkowska, E. (2013). Rank ordering criteria weighting methods – A comparative overview. Optimum. Studia Ekonomiczne Nr. 5, 14–33.
Saaty, T. (1980). The Analytic Hierarchy Process: Planning, Setting Priorities, Resource Allocation. London: McGraw-Hill.
Saaty, T. (1987). The analytical hierarchy process—what it is and how it is used. Mathem. Modell. 9, 161–176. doi: 10.1016/0270-0255(87)90473-8
Saaty, T. (2001). Decision Making for Leaders: The Analytical Hierarchy Process for Decisions I a Complex World. Pittsburgh: RWS Publications.
Saaty, T. (2004). Decision Making—The Analytic Hierarch and Network Processes (AHP/ANP). J. Syst. Sci. Syst. Eng. 13, 1–35. doi: 10.1007/s11518-006-0151-5
Saaty, T. (2008). Decision Making with the Analytic Hierarchy Process. Int. J. Serv. Sci. 1, 83–98. doi: 10.1504/IJSSCI.2008.017590
Sillanpää, M., and Ncibi, C. (2019). The Circular Economy: Case Studies about the Transition to the Linear Economy. London: Elsevier/Academic Press. ISBN 978-0-12-815267-6.
Singh, A., Sharma, B., Gaurav, N., and Singh, N. (2016). “Environmental impact assessment as a tool to achieve the sustainable development,” in IMPACT International Journal of Research in Applied, Natural and Social Sciences 143–156.
Stahel, W. R. (1986). Product life as a variable: the notion of utilization. Sci. Public Policy 13, 185–193. doi: 10.1093/spp/13.4.185
Stanujkic, D., Dordević, B., and Dordević, M. (2013). Comparative analysis of some prominent MCDM methods: A case of ranking serbian banks. Serbian J. Manag. 8, 213–241. doi: 10.5937/sjm8-3774
Triantaphyllou, E., and Mann, S. (1989). An examination of the effectiveness of multi-dimensional decision-making methods: a decision-making paradox. Dec. Support Syst. 5, 303–312. doi: 10.1016/0167-9236(89)90037-7
UNEP (2009). United Nations Environment Program. Guidelines for social life cycle assessments of products. ISBN: 978-92-807-3021-0.
Vinogradova, I., Podvezko, V., and Zavadskas, E. K. (2018). The recalculation of the weights of criteria in MCDM methods using the bayes approach. Symmetry 10, 205. doi: 10.3390/sym10060205
Wahlström, M., Bergmans, J., Teittinen, T., Bacher, J., Smeets, A., and Paduart, A. (2020). Construction and Demolition Waste: Challenges and Opportunities in a Circular Economy Eionet Report - ETC/WMGE 2020/1. European Environmental Agency, European Topic Center on Waste and Materials in a Green Economy.
Wang, J. J., Jing, Y.-Y., Zhang, C.-F., and Zhao, J.-H. (2009). Review on multi-criteria decision analysis aid in sustainable energy decision-making. Renew. Sustain. Energy Rev. 13, 2263–2278. doi: 10.1016/j.rser.2009.06.021
Wells, P., and Seitz, M. (2005). Business models and closed loop chains: A typology. Supply Chain Manag. 10, 249–251. doi: 10.1108/13598540510612712
Yijun, J., Ying, H., and Xuhong, S. (2011). “Applying circular economy theory in Environmental Impact Assessment,” in 2010 International Conference on Biology, Environment and Chemistry IPCBEE 1 (Singapore: IACSIT Press).
Yilmaz, M., and Bakis, A. (2015). Sustainability in Construction Sector. Procedia – Soc. Behav. Sci. 195, 2253-2262. doi: 10.1016/j.sbspro.2015.06.312
Zabihi, H., Habib, F., and Mirsaeedie, L. (2012). Sustainability in building and construction: Revising definitions and concepts. Int. J. Emer. Sci. 2, 570–578.
Zardari, N. H., Ahmed, K., Shirazi, S. M., and Yusof, Z. B. (2015). Weighting Methods and their Effects on Multi-Criteria Decision Making Model Outcomes in Water Resources Management. New York, NY: Springer Verlag. doi: 10.1007/978-3-319-12586-2
Zarghami, M., and Szidarovszky, F. (2011). Multicriteria Analysis: Applications to Water and Environment Management. New York, NY: Springer-Verlag. doi: 10.1007/978-3-642-17937-2
Zavadskas, E. K., Saparauskas, J., and Antucheviciene, J. (2018). Sustainability in construction engineering. Sustainability 10, 2236. doi: 10.3390/su10072236
Keywords: circular economy, construction and demolition industry, environmental, social and economic dimensions, weighting methods, multi-criteria decision analysis
Citation: Dytianquin N, Kalogeras N, van Oorschot J and Abujidi N (2023) Circularity in the construction and demolition industry: Comparing weighting methods for multi-criteria decision analysis. Front. Sustain. 4:1115865. doi: 10.3389/frsus.2023.1115865
Received: 04 December 2022; Accepted: 03 March 2023;
Published: 03 April 2023.
Edited by:
Atiq Zaman, Curtin University, AustraliaReviewed by:
Mercedes Gaitan-Angulo, Konrad Lorenz University Foundation, ColombiaFabricio Espejel, Center of Research and Technologic Development in Electrochemistry, Mexico
Copyright © 2023 Dytianquin, Kalogeras, van Oorschot and Abujidi. This is an open-access article distributed under the terms of the Creative Commons Attribution License (CC BY). The use, distribution or reproduction in other forums is permitted, provided the original author(s) and the copyright owner(s) are credited and that the original publication in this journal is cited, in accordance with accepted academic practice. No use, distribution or reproduction is permitted which does not comply with these terms.
*Correspondence: Norman Dytianquin, bm9ybWFuLmR5dGlhbnF1aW5AenV5ZC5ubA==; Nikos Kalogeras, bmlrb3Mua2Fsb2dlcmFzQHp1eWQubmw=; bmlrb2xhb3Mua2Fsb2dlcmFzQHd1ci5ubA==; John van Oorschot, am9obi52YW5vb3JzY2hvdEB6dXlkLm5s; Nurhan Abujidi, bnVyaGFuLmFidWppZGlAenV5ZC5ubA==
 Norman Dytianquin
 Nikos Kalogeras
 John van Oorschot3*
 Nurhan Abujidi