
94% of researchers rate our articles as excellent or good
Learn more about the work of our research integrity team to safeguard the quality of each article we publish.
Find out more
ORIGINAL RESEARCH article
Front. Sustain., 31 August 2022
Sec. Sustainable Chemical Process Design
Volume 3 - 2022 | https://doi.org/10.3389/frsus.2022.948443
This article is part of the Research TopicWomen in Sustainability: Chemicals, Process Engineering and Materials 2021View all 4 articles
 Apoorva Nisal1
 Urmila Diwekar1,2*
 Neeraj Hanumante3
 Yogendra Shastri3
 Heriberto Cabezas4
 Vicente Rico Ramirez5
 Pablo Tenoch Rodríguez-González6
Inordinate consumption of natural resources by humans over the past century and unsustainable growth practices have necessitated a need for enforcing global policies to sustain the ecosystem and prevent irreversible changes. This study utilizes the Generalized Global Sustainability model (GGSM), which focuses on sustainability for the Food-Energy-Water (FEW) Nexus. GGSM is a 15-compartment model with components for the food-web, microeconomic framework, energy, industry and water sectors, and humans. GGSM shows that an increased per capita consumption scenario is unsustainable. In this study, an optimal-control theory based approach is devised to address the unsustainable scenario through policy interventions to evaluate sustainability by employing multiple global indicators and controlling them. Six policy options are employed as control variables to provide global policy recommendations to develop the multi-variate optimal control approach. Seven objectives are proposed to limit the human burden on the environment to ascertain sustainability from a lens of ecological, economic, and social wellbeing. This study observes the performance of the policy options toward seven sustainability indicators: Fisher Information, Green Net Product, Ecological Buffer, Carbon dioxide emissions, Nitrous oxide emissions, and Global Water Stress. The optimal control model assesses these multiple objectives by minimizing the variance in the Fisher Information. One significant result from this study is that optimizing for the Fisher Information based objective is adequate to attain sustainability and manage the other objectives under consideration. Thus, forgoing a multi-objective problem framework. The results show that cross-dimensional policy interventions such as increased vegetarianism and increased penalty on industrial discharge are shown to have a positive impact on scale.
The industrial revolution, followed by globalization, boosted the global economy dramatically and improved the quality of life. Following this, the digital era ushered in the technology that is now essential to the daily lives of many. Human consumption increased exponentially over the past 70 years. The total amount of raw materials extracted to meet final consumption demands or the material footprint per capita has increased by 113% in the last 30 years (United Nations, 2019a). Moreover, in 1992, Meadows and team predicted that the per capita consumption would increase by 50% over the next 50 years (Meadows et al., 1992). Thus, owing to the rising population combined with such consumption, humans are extracting more today than 70 years ago (Syvitski et al., 2020). Unstructured global consumption has resulted in repercussions such as the transformation of land use, loss of biodiversity, excessive pollution, and stress on natural resources. Contrastingly, the digital era also fueled innovation and the evolution of existing technologies to mitigate the impact of human consumption. The field of global sustainable development studies the intricate relationships between the environment, economics, society, and technology and analyzes the impact of policies corresponding with human activity.
Brundtland Commission (1987) described sustainability as “development that meets the needs of the present without compromising the ability of the future generations to meet their own needs.” Studying sustainability has become imperative for the increased longevity of resources on this planet from an organizational and global perspective, and several researchers have proposed systemic approaches to provide a sustainable policy-making structure (Etschmaier, 2014; Liu et al., 2015; Schwaninger, 2015).
A recent review studying nexus challenges in Brazil and policymaking in the energy-food-water nexus encourages policymakers to consider scientific feedback from nexus experts and nexus modeling tools in proposed policies to evaluate the land use, energy intensity, and water impact of policies while maintaining a sustainable economy (Mercure et al., 2019). Similarly, Wallington and Cai (2017) assessed the policy tradeoff between agriculture expansion and deforestation and hydropower vs. biodiversity and emissions in the FEW nexus in the humid tropics to make a case for policy redesign. These studies reiterate the importance of science-based policymaking to the complex interconnected challenges posed in sustainable development at scale from social welfare, resource management, and governance standpoint (Catney and Doyle, 2011; Voinov et al., 2014; Artioli et al., 2017).
There is an immediate need for global policies in food systems, the water sector, energy, and the industry sector to make incremental progress on the Sustainable Development Goals (SDGs) proposed by the United Nations. In the food systems, policy initiatives encouraging organic farming have been proposed as a measure to advance toward achieving the SDGs (Eyhorn et al., 2019). Sustainable transformation of agricultural systems is necessary to fulfill the rising demand and ensure human prosperity. Researchers have proposed a sustainability intensification plan with measures such as green GDP, innovative water solutions, and ecosystem function conservation areas for agricultural development. This approach hinges on cross-domain and integrated-system innovation and initiatives in different sectors at scale (Rockström et al., 2017).
Researchers have proposed sustainable policymaking by studying various individual or interconnected systems in the global ecosystem by applying systemic mathematical decision-making approaches. Algorithmic control approaches have been applied to the dairy production sector for sustainable production, loss prevention, and emission reduction (Validi et al., 2014; Haass et al., 2015). Taherzadeh et al. (2021) carried out a risk assessment associated with water, energy, and land in a global economy and the inter-regional multi-sectoral resource uncertainty in a global supply chain to study the tradeoff between globalization and natural resources. Machine learning techniques have also been applied to predict climate conditions, nitrogen management in agricultural crop prediction, and soil conditions in agricultural planning (Coopersmith et al., 2014; Chlingaryan et al., 2018; Chakraborty et al., 2021). Multi-agent reinforcement learning based control also shows positive impacts on greenhouse gas emissions and pollutants and energy requirements for a wastewater treatment plant (Chen et al., 2021). Integrated models have been widely used to study sustainability and provide policy recommendations. Gao et al. (2018) utilized an integrated model for the water-food-energy nexus management in land and water constrained setting in China by modeling water prices to encourage optimal crop production sites, technologies, and crop diversity through environmental impacts and water analysis. Vinca (2021) assessed transboundary cooperation based policy recommendations for the climate-land-energy-water nexus focused on the Indus basin region in Pakistan for electricity generation, food trade, and water economics between India, Pakistan, and Afghanistan with a focus on the Sustainable Development Goals. A similar study focusing on the land-water resource allocation space evaluated social, economic, and environmental goals in a sugarcane production setting with an uncertain yield in Thailand by applying multi-objective optimization techniques improved on the social and economic goals through informed policy-making (Amaruchkul, 2021). Randall (2021) proposed a cost-benefit optimization approach to sustainability by integrating humans and nature, planetary boundary, and utilizing sustainability indicators to evaluate the benefits of a policy on the overall welfare of the system. Structured burden-shifting policymaking is necessary to observe impacts across several sustainability indicators instead of a singular objective focused policy (Algunaibet and Guillén-Gosálbez, 2019). The fundamental background of this study is discussed next.
Cabezas et al. (2018) proposed a Sustainable Systems Hypothesis stating that sustainability can be achieved by limiting the human burden on the environment so as to not exceed the biocapacity, conservation of trophic and functional integrity of the ecosystem, adequate economic production to exceed the consumption, certain quality of human existence, sustainable use of energy resources and finally, and maintenance of system order and self-organization over time. These criteria can be captured using indicators such as ecological footprint, sustainable process index, ecosystem integrity, green net product, quality of human existence, energy extraction rate, and an overall indicator of system performance which is Fisher Information. The ecological footprint, sustainable process index, and the rate of energy extraction over time should not be increasing for a sustainable system. Also, from an economic and social wellbeing perspective, the green net product and the quality of human existence should not decrease over time. Furthermore, the Fisher Information measures the ability of a system to maintain its order, and self-organization over time. In the case of a sustainable system, the FI remains steady and unchanging over time.
Fisher Information (FI) is a statistical theory concept to measure the amount of information that can be observed about a random variable. FI is utilized in frequentist statistics for designing an experiment, for construction of a null hypothesis test or computation of confidence intervals, and in Bayesian statistics to define Jeffrey's prior for estimation problems or in the case of a Bayesian hypothesis test (Ly et al., 2017). Thus, FI finds applications in diverse disciplines such as mathematical psychology, physics, quantum theory, computational biology, and sustainability (Frieden, 2004; Nalewajski, 2008; Eason and Cabezas, 2012; Kanitscheider et al., 2015; Demkowicz-Dobrzański et al., 2020; Meyer, 2021). Frank (2009) showed that the natural selection phenomenon in evolutionary biology follows the fundamental behind maximization of the FI to dynamically move the system toward maximum fitness in the absence of any other evolutionary force other than natural selection. Many studies have illustrated the ability of FI to evaluate the dynamic order of model and real systems (Karunanithi et al., 2008; Rico-Ramirez et al., 2010; Gonzalez-Mejia, 2011; Ahmad et al., 2016). A recent sustainability assessment for an urban university identified the strengths of FI for a real integrated-system analysis (Ai et al., 2019).
Rico-Ramirez et al. (2010) show the significance of FI as a generalized sustainability index for dynamic models through immunotherapy and continuous crystallization applications. Al-Saffar (2018) studied several ecological nonlinear dynamical systems, such as the predator-prey model, and the three species model showing the significance of FI as a measure of system variability or sustainability. Ramírez-Carrillo et al. (2018) show the application of FI combined with time series data to evaluate the ecosystem health and stability of North America. FI for a system is sensitive to changes and is a good indicator of policy progress over time. Gonzalez-Mejia et al. (2012) evaluated FI as a measure of the US air quality over a period of 29 years and showed that FI reflects the changes in the air quality.
These studies show the strong significance of FI as a sustainability indicator for real dynamical systems.
An optimal control method is an approach in mathematical decision-making where the profile of a parameter over time is of importance. It has been applied to an urban wastewater management system to improve river water quality, wastewater treatment plants to offer environmental and economic benefits, and renewable energy and hybrid grid systems (Butler and Schütze, 2005; Sichilalu, 2016; Revollar et al., 2017).
Recently, Kellett et al. (2019) utilized an optimal control approach with an integrated assessment model to evaluate the mitigation of greenhouse gas emissions by the middle of the century. They state the necessity of having an array of policy responses relying on pricing greenhouse gas emissions and providing a basis for pricing options through optimal control based modeling. Jiang et al. (2019) utilized stochastic optimal control techniques to reduce transboundary pollution in the Xiang Jiang River Basin in China to propose an environmental policy design to address conflicts due to water pollution across regional boundaries. Verma et al. (2021) utilized mathematical modeling to track the human population, energy use, and atmospheric carbon dioxide emissions to propose emission reduction strategies such as switching to more energy-efficient options and low carbon energy sources by applying optimal control methods. The optimal control method has been combined with FI in bipartite quantum dynamics to achieve higher precision in the presence of noise (Qin et al., 2022). Furthermore, this intersection of optimal control and FI proved successful in the physical domain to minimize connection time between non-equilibrium steady states system (Prados, 2021). Similarly, Vickers and Andersson (2021) minimized the estimation uncertainty for a particle tracking microscope through FI based optimal control.
Shastri et al. (2008b) proposed an optimal control theory based approach to extend sustainability by utilizing FI for a small integrated ecological-economic system. Furthermore, Doshi et al. (2015) extended this approach by applying multivariate optimal control to an evolved version of the integrated ecological-economic system. Rawlings et al. (2020) proposed a nuanced approach to find the optimal value of time for time averaged FI calculation and subsequent optimization while identifying the dynamic regime of the system to observe sustainable behavior in an integrated ecological model using optimal control.
The World 3 model was developed to study the limits of the world system (Meadows et al., 1972). Following the success of the World 3 model, many global models such as the GUMBO model, the GCAM model, and recently the HARMONEY and HANDY models have been developed, which study the complex interactions between humans and the planet for climate change mitigation and sustainability (Boumans et al., 2002; Motesharrei et al., 2014; Calvin et al., 2019; King, 2020).
In this study, we utilize an integrated assessment model known as the generalized global sustainability model (GGSM) (Hanumante et al., 2022; Nisal et al., 2022) and optimal control methods to derive policy options elemental toward achieving sustainability. The model is available here.
In the following manuscript, Section 2 presents the methodology behind this study by describing the different aspects of this study, followed by Section 3, which presents the results of this approach. Section 4 presents the discussion section to investigate the policy inferences in further detail and finally, Section 5 summarizes the conclusions and future path for this study.
A model was recently developed with a focus on global sustainability and particularly the Food-Energy-Water Nexus. This is a 15-compartment model with components for the food-web, microeconomic framework, energy, industry and water sectors, and humans. The different compartments in this model are three primary producers (P1, P2, and P3), three herbivores (H1, H2, and H3), two carnivores (C1 and C2), human households (HH), industry (IS), energy producer (EP), fuel source (FS), water reservoir (WRS), resource pool (RP), and an inaccessible resource pool (IRP) as presented in Figure 1. The resource pool represents a finite nutrient source, and the mass that is biologically inaccessible to the rest of the ecosystem is represented by the inaccessible resource pool. The primary producers make mass available for the rest of the ecosystem by consuming the resource pool, and the compartments P2 and P3 recycle small amounts of mass from the inaccessible resource pool back into the system to represent bacterial actions. The energy producer sector (EP) utilizes labor to convert a non-renewable energy fuel source into usable energy and has the capability to utilize P1 to produce biopower or renewable energy. It is assumed that the price of energy generated from biopower is equal to the price of energy produced from the non-renewable energy source. The industry sector utilizes P1 and resource pool to make products for humans to consume. It is worth noting that the mass of the human compartment does not increase by consuming products from the industry, but these products add to the mass of the inaccessible resource pool. Similarly, the energy producer sector adds to the mass of the inaccessible resource pool through energy production. The humans (HH) can work in four industries: the industry sector (IS), energy producer sector (EP), agriculture sector (P1), and livestock sector (H1) and the industry sector determines wages depending on the demand-supply gap of the IS product and abundance of human labor. Hence, it also follows that the ecological compartments can be grouped as those with economic value or domesticated species and wild species without economic value. A rudimentary legal system incorporated in the model assigns property rights to the owners of the domesticated species, IS products, and non-renewable energy sources. H1 has regulated grazing rights to access P2. The access of C1 to H1 is regulated because while H1 is private property, C1 is a protected species. H2 has limited access to P1 by human action, e.g., fencing. Human population growth depends on the per capita mass, birth rate, and mortality rate. The historical crude death rate data for the past 65 years starting from the year 1950 was used to model the global population. The food-web model is expressed with Lotka-Volterra type expressions, and the economy is represented by a price-setting model where the HH and the firms attempt to maximize their well-being. Thus, the ecological compartments are expressed as differential equations, and economic equations take an algebraic equation form. Owing to the integrated nature of this model, the ecological and economic equations are regulated by key variables which can be used to control the system over time. This model is highly sensitive to changes, and altering these key parameters impacts model performance and sustainability. Furthermore, this model can predict global quantities such as carbon dioxide emissions and nitrous oxide emissions to quantify pollution and the gross domestic product as a performance indicator for the global economy. Global-scale data was used during the modeling exercise to estimate planetary quantities. The model is simulated for a timeframe of 200 years, starting from the year 1950 and going until the year 2150. Global population, carbon dioxide emissions and sector-wise carbon emissions, and nitrous oxide emissions have been validated against historical databases. Furthermore, the model was analyzed for several scenarios in the sustainability study, such as the base case scenario, population explosion scenario, per capita consumption increase scenario, and population explosion combined with the per capita consumption increase scenario. A brief explanation of these scenarios is provided below:
• Base case scenario (Scenario 1): This is the business-as-usual scenario where the parameters are the best fit against historical data. Hence, the system is stable, and ecological compartments are stable. The emissions (both carbon dioxide and nitrous oxide emissions) are increasing but low in the overall scheme, and the economy is stable.
• Population increase scenario (Scenario 2): This scenario was speculated to see how the model performs if the population increases at a higher rate compared to current trends. The model performance showed that while the ecological compartments get consumed at a marginally faster rate, the system can support an increased population.
• Per capita consumption increase scenario (Scenario 3): In this scenario, the per capita consumption increases and is modeled by linearly varying the coefficients used for the estimation of per capita demand for individual resources. As the consumption levels increase, the system is unstable and ecological compartments start dying, leading to the loss of biodiversity. The economy is unstable, and the emissions increase drastically. This poses an unsustainable system.
• Per capita consumption increase with the population explosion scenario (Scenario 4): In this scenario, the per capita consumption increases along with an increase in the human population. Similar to the per capita consumption increase scenario, the system is unstable and unsustainable. Thus, the population explosion only accelerates the process of the ecological compartment collapse.
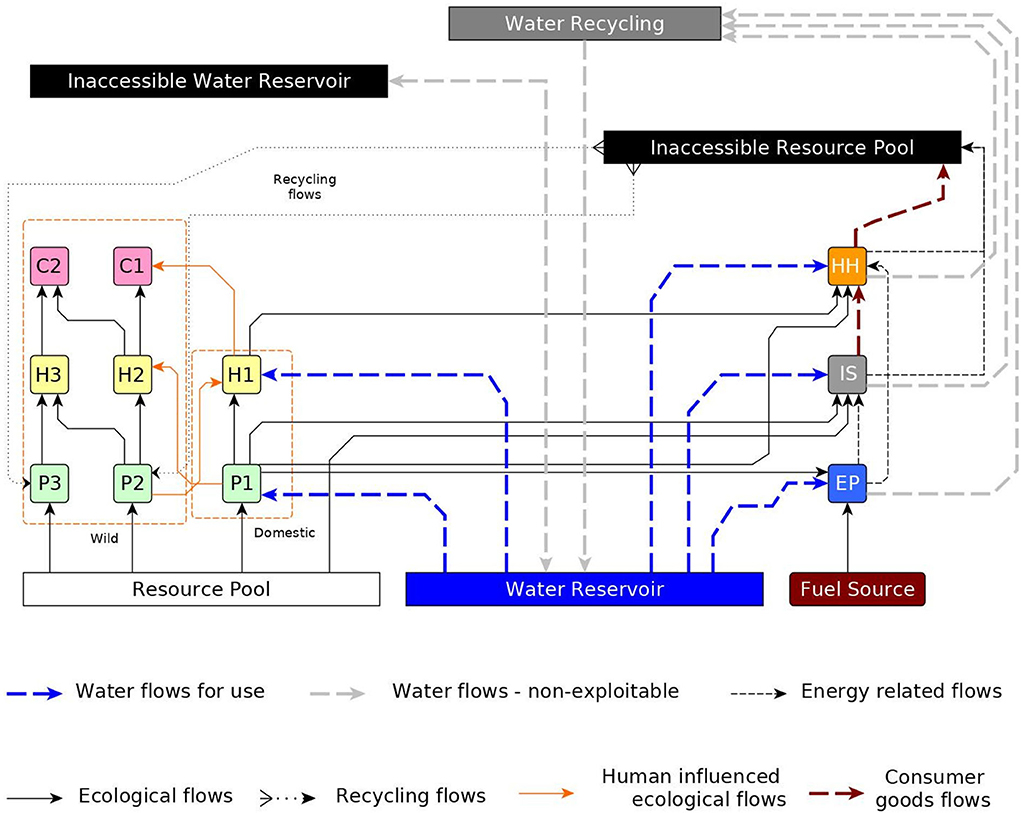
Figure 1. Generalized global Sustainability model (GGSM). Compartments: primary producers shown in green (P1,P2,P3), herbivores shown in yellow (H1,H2,H3), carnivores (C1, C2) shown in pink, human households (HH) shown in orange, industry sector (IS) shown in gray, energy producer (EP) shown in blue, fuel source shown in brown, water reservoir shown in blue, resource pool shown in white, inaccessible resource pool shown in black (Hanumante et al., 2022; Nisal et al., 2022).
Further details of this model can be found in Hanumante et al. (2022) and Nisal et al. (2022). This model was reparameterized recently to present a more realistic system. After this reparameterization, the base case remains the same. The ecological compartment trends observed in scenarios 3 and 4, while qualitatively similar, shift further by 10 years.
Sustainability is a multifaceted concept with wide ranging effects across physical, ecological, economic, environmental, and social welfare dimensions. The objectives defined below in this section are measures of sustainability from an overall welfare perspective across these dimensions.
Fisher Information is a concept originating from Information Theory and is a measure of the dynamic order of a system under consideration. The Sustainable Regimes Hypothesis was developed by Cabezas and Fath (2002) to utilize FI as a measure of sustainability as a function of dynamic order. The evolution of FI over time gives an indication of the order or organization of a system (Cabezas and Fath, 2002).
• Constant FI: If the FI is constant or oscillating about a constant value, the system is dynamically sustainable.
• Increasing FI: If the FI is increasing over a period of time, the system is moving toward a state of increasing self-organization. Thus, it is an indication of a potentially sustainable state.
• Decreasing FI: If the FI is decreasing over time, the system is unstable. Such a system's loss of organization is an indication of an unsustainable system.
Fisher Information for one variable can be expressed as
where p(x) is the probability of observing a particular value of x (González-Mejía et al., 2015). Shastri and Diwekar (2006) extended this ideology to a system with n variables and show that when n variables constitute the state variable vector of a system, it gives the FI of that system. Following this ideology, the time averaged FI for a system with n species is given by:
where Tc is the cycle time of the system and
v(t) and a(t) are called the velocity and acceleration terms, respectively.
It is observed in the case of the GGSM that the FI is stable for the base case (Scenario 1) and the population explosion scenario (Scenario 2). For the per capita consumption increase scenario (Scenario 3), the FI is unstable and for the per capita consumption increase with population explosion scenario (Scenario 4), FI is unstable and shows high variation.
An ecological buffer is a measure of bio-productive land to give insight into a country's use of its ecological assets' regenerative capacity (Vanham et al., 2019). Thus, it measures the equivalent land demand of the population by identifying the amount of bio-productive land required to support the annual average consumption and the waste production of an individual (Rodriguez-Gonzalez et al., 2020). The modeling of the ecological buffer in this study involves all the compartments and the human influenced flows in the system. Thus, the ecological buffer measures the biocapacity of an entity (state, country, continent, or world) and the ability of this entity to offset the implications of the rising population and thus consumption. Hence, ideally, the ecological buffer should be higher for there to be a biocapacity reserve to account for the growing demand.
The green net product is an economic measurement of sustainability from the perspective of social welfare. In its simplest form, it can be defined as the sum of the real value of consumption and the real value of the net investments (Rodriguez-Gonzalez et al., 2020). In this study, GNP is calculated as the sum of GDP and the penalty on greenhouse gas emissions. The penalty on emissions is imposed in the form of a carbon price of $60/tCO2 as from the range recommended by the high-level commission on the carbon prices by the World Bank Group consistent with achieving the Paris temperature target by 2030 (Stiglitz et al., 2017). Thus, a higher value of GNP is preferable.
This is an indicator of the stress on the water system to fulfill the water demand on a global scale. Global water stress is defined as the ratio of the total water demand to the available exploitable water resources (Hanumante et al., 2022). In an ideal scenario, a lower value of the global water stress is preferred.
The carbon dioxide from the GGSM is utilized in this case. In the case of carbon emissions, the following compartments are utilized: P1 and H1 represent agriculture and livestock, IS represents the industry, EP represents the energy sector, and finally, the residential, commercial, and transportation sector is considered as a function of the human population. Thus, a lower value of carbon emissions is preferred.
The nitrous oxide emissions from the GGSM are utilized in this case. For nitrous oxide emissions: Agriculture represented by P1 and P2, industry by IS, and the energy sector by EP are used to model the NOX emissions. A lower value of nitrous oxide emissions is desirable.
The GDP is utilized as a measure of the economic performance of the model. The GDP from the model utilizes information from the same sectors as the carbon emissions described above. Since the GDP is an indicator of economic activity, a higher and stable GDP is preferable. GDP is a sum of the human influenced flows from a particular sector to humans multiplied by its respective price. The general expression for GDP in this model is:
Previously (Benavides et al., 2015) studied the model as a network to determine the controllability of the system. The study concluded that controlling a minimum number of 12 nodes was necessary for sustainability in this system. These parameters were used to conduct sensitivity analysis and are presented in Table 1. After conducting an initial sensitivity analysis, six variables were shortlisted for the optimal control problem. These six variables showed the most significant impact on the ecological compartments and on maintaining sustainability. These variables have been classified according to their technological, social, or economical characteristics and incorporate the techno-socioeconomic scope of this study. The techno-social variables include penalties that castigate the Industry Sector (IS) or the energy producer sector (EP) for waste disposal into the environment. From the techno-social variables, the discharge fee for the industry sector was selected in the current study as a control variable.
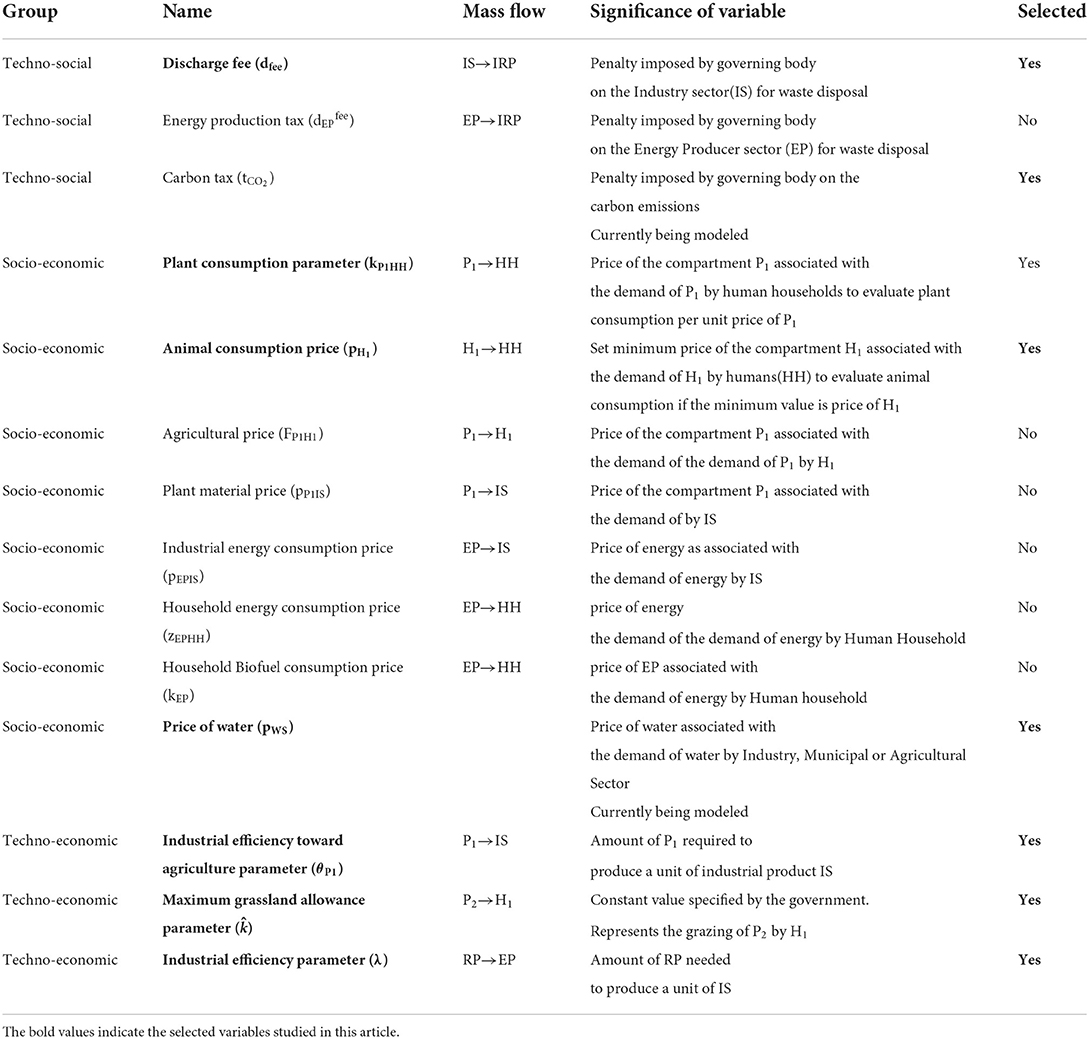
Table 1. Policy options for sensitivity analysis.
The socio-economic variables include the plant consumption parameter which is associated with the demand of P1 by humans (kP1HH) to evaluate plant consumption per unit price of P1, the minimum set price of the herbivores H1 associated with the demand of H1 by humans to evaluate the animal consumption if the minimum value is the price of H1 (pH1), agricultural price parameter (fP1H1) which is the parameter associated with the price of P1 with the demand of P1 by H1, plant material price parameter (pP1IS) which is the parameter related to the price of P1 with the demand of P1 by IS, industrial energy consumption price parameter (pEPIS) which is the price of a unit of energy associated with the demand of energy by IS, household energy consumption price parameter (zEPHH) which is the price of a unit of energy associated with the demand for energy by humans (HH), household biofuel consumption price parameter (kEP) which is the price of a unit of energy through biopower associated with the demand for energy by humans (HH). The plant consumption parameter and the animal consumption parameter were selected for the optimal control problem as they were more sensitive toward the compartments.
The techno-economic variables included variables such as industrial efficiency toward agricultural parameter to evaluate the amount of P1 required to produce a unit of the industrial product IS (θP1), the maximum grassland allowance parameter to regulate grazing of P2 by H1 (), and industry efficiency parameter which affects the amount of RP needed to produce one unit of IS (λ). All techno-economic parameters were selected for optimal control due to their sensitivity toward compartmental change. Furthermore, work is being carried out to develop a new techno-social parameter to penalize the carbon emissions emitted into the environment in the form of a carbon tax and a new socio-economic parameter to include the price of water associated with the demand of water by industry, municipal, or agriculture sectors. The suitability of these as optimal control variables will be determined further, and subsequent analysis will be carried out in the future.
Thus, the six parameters selected for the optimal control problem are: plant consumption parameter (kP1HH), animal consumption price (pH1), Industrial efficiency toward agriculture (θP1), maximum grassland allowance parameter (), industrial efficiency parameter (λ), and the discharge fee (dfee).
The impact of the six decision variables selected for optimal control on the ecological compartments was observed from the sensitivity analysis. The variable kP1HH which is the parameter associated with the consumption of the P1 compartment by humans shows an effect on the ecological compartments P1, H1, and C1. As this parameter increases, the demand for P1 by the human compartment (HH) increases, or humans consume more of the P1 compartment. This dynamic has a positive impact on the H1 and C1 compartments. The maintenance of these species shows that there is a large enough food resource available for each.
The parameter pH1 which is the minimum set price of the compartment H1 shows an effect on P1, H1, and C1. As the value of pH1 increases, the H1 is maintained, but P1 gets depleted faster, and the mass of C1 increases. Furthermore, the increase has a positive impact on green net product and GDP but a negative impact on all other objectives. The variable that controls the grazing of P2 by H1 () shows a drastic impact on the ecological compartments and is sensitive to change across all the objectives. The technological variable θP1, which measures the efficiency of the industry sector toward the agriculture sector, controls the amount of P1 required by the industry sector to make one unit of industry product for humans to utilize. An increase in θP1 results in faster depletion of P1, H1, and C1 and increases both the Carbon dioxide and Nitrous Oxide emissions and the global water stress while reducing the green net product, ecological buffer, and the GDP. The variable λ which controls the amount of RP required to make one unit of industry product shows that when increased, it has a positive impact on P1 but has a negative impact on the green net product, emissions, global water stress, GDP, and the ecological buffer. The discharge fee pISHH which penalizes the industry sector for emitting waste into the environment shows that the effect of this penalty can only be observed at a relatively higher value compared to the extremely low base value.
Optimal Control Theory presents a mathematical optimization basis for controlling models of dynamic systems. The optimal control method evaluates time-dependent control variables to investigate control strategies over time. An optimal control problem necessitates a mathematical system with time-dependent variables involving a performance indicator to steer the path of the control variables in order to optimize the performance indicator. Sustainability involves the overall welfare of humans and nature across several aspects such as social, ecological, environmental, economic, and physical over the course of time. Optimal control provides the tools necessary to control such a complex time-dependent system. In the case of sustainable development, the objective now becomes the maintenance and wellbeing of nature and human society. The Sustainable Regimes Hypothesis was developed to guide and interpret the use of Fisher Information (FI) as a measure of sustainability (Cabezas and Fath, 2002). In the case of a sustainable regime in a system, the average value of FI over time should be steady and higher than zero (González-Mejía et al., 2015; Rodriguez-Gonzalez et al., 2020). Thus, the objective for the optimal control problem can be to maximize the FI or to minimize the variance of FI between the system under review and an ideal sustainable system or the base case. When the FI is maximized, the system is propelled into a state that is more sustainable mathematically.
Although, when the FI variance is minimized, the system will be maintained in a sustainable state since the system's level of organization tries to remain constant (Shastri et al., 2008a; Doshi et al., 2015; Rodriguez-Gonzalez et al., 2020).
The objective function J can be formalized as:
Where It is the time averaged FI for a system under consideration or the consumption increase scenario, in this case, Iconstant is the FI of an ideal system or the base case in this study, and T is the total time under consideration. This is subject to the model equations, both ecological model equations, which are differential equations, and the microeconomic model equations, which take algebraic form and the bounds on the decision variables.
Optimal control problems can be solved using several techniques such as calculus of variations, dynamic programming, maximum principle method (Diwekar, 2020). This study utilizes the nonlinear programming (NLP) optimization technique to solve the optimal control problem. To apply the NLP approach for optimal control, a discretized problem space is required. The optimal control problem starts in the year 2020 and goes on until the year 2150, thus 130 years in total.
The six decision variables described in the previous section are selected for control. These represent policy parameters and can vary over time. In the base case, these variables hold constant values throughout the timeline as presented in Figure 3. This gives the opportunity to explore several options in case of optimal control. The control problem can evaluate if there exists a solution where a constant optimal value achieves sustainability. Another approach could be that the total time is converted to equispaced time intervals and the policy parameters can vary at each time step to attain sustainability. In this study, we will study the first scenario and evaluate if there is an optimal solution that maximizes the survival of the ecological compartments while tackling the multiple objectives.
The model starts in the year 1950 and the per capita consumption increase scenario starts in the year 2020 (Hanumante et al., 2022; Nisal et al., 2022). Hence, the optimal control strategy starts from the year 2020 and goes till 2150 for a total of 130 years. Starting from 1950 to the year 2019, the decision variables have the same values as the base case. Starting from 2020 the control variables can take any value, and this value is constant through the optimal control timeline until the year 2150. Thus, at the year 2020 time step, the decision variables take a specific value, and the effect on the FI is observed. The idea behind this approach is that by obtaining a FI trend as close as possible to the ideal FI- the system would achieve stability and hence be sustainable. The optimal values of the policy parameters are then utilized to evaluate the nature of all the model compartments and performance on the objectives. These results are compared to the scenario analysis results for the uncontrolled per capita consumption increase scenario (Scenario 3) (Nisal et al., 2022).
In this section, the results from the multivariate optimal control scenario are presented.
The results from the optimal control strategy for the increased per capita consumption scenario are compared to the previous uncontrolled increased per capita consumption scenario (Scenario 3). This scenario where the six decision variables are controlled is referred to as “Scenario 3 Controlled.” The variance in the FI is minimized as the objective function. The following results show that FI alone as an objective function is enough to achieve sustainability and regulate the other objectives under consideration.
It is apparent from these results shown in Figure 2 that the control of these six parameters maintains the masses of the ecological compartment. These results show that the ecological compartments deplete at a slower rate than the previous uncontrolled inordinate consumption. Furthermore, the results also show that controlling these variables attains sustainability as there is an obvious shift in the trend which can be seen in the plots for H1, H2, H3, and C1, C2 as shown in Figures 2C,G–J. These results also show that the industry production is now maintained.
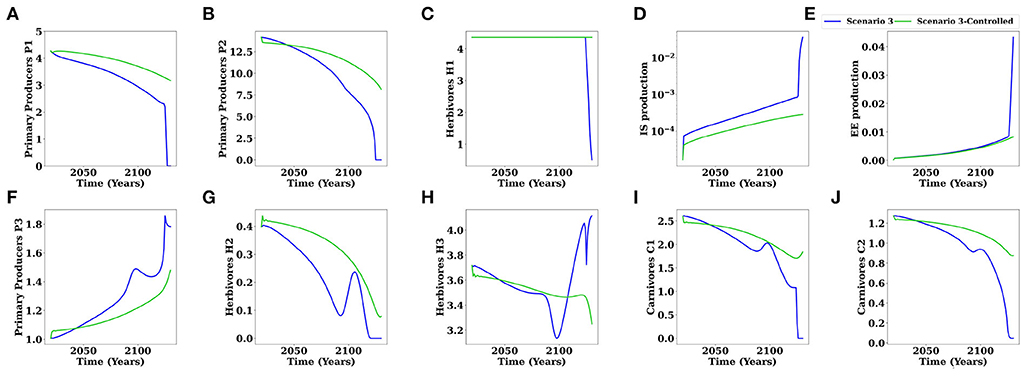
Figure 2. Effect of the controlled variables on the ecological compartments for the increased per capita consumption scenario (scenario 3 controlled) as compared to the uncontrolled increased per capita consumption scenario (scenario 3). (A) Primary producers P1. (B) Primary producers P2. (C) Herbivores H1. (D) IS production. (E) EE production. (F) Primary producers P3. (G) Herbivores H2. (H) Herbivores H3. (I) Carnivores C1. (J) Carnivores C2.
As the ecological compartments are maintained in the controlled scenario, both the industry and electricity production are maintained. Thus, the industry sector extracts less from the resource pool as compared to the previous uncontrolled scenario.
Figures 3A–F presents the optimal profiles for these decision variables as compared to the previous scenario where these variables remain constant throughout for 200 years.
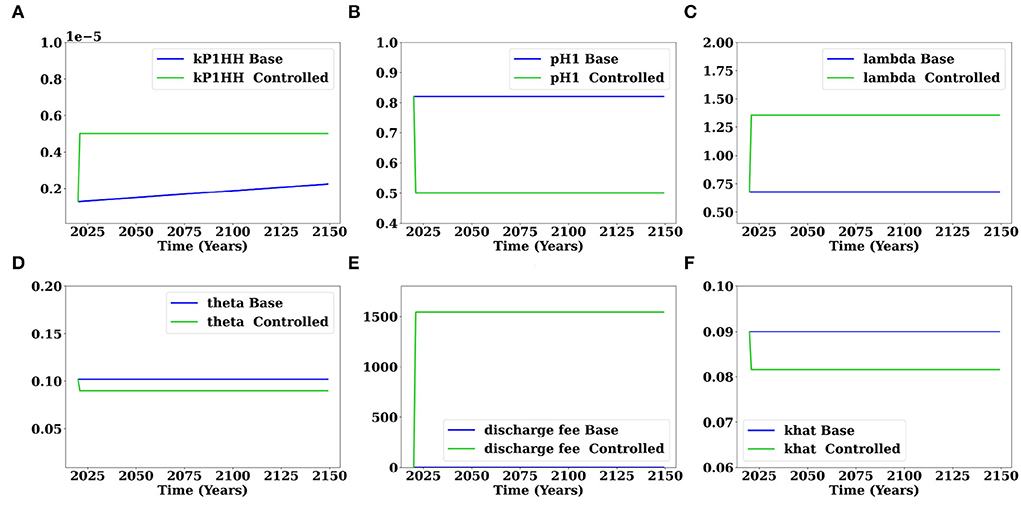
Figure 3. Optimal control profiles of the six decision variables (scenario 3 controlled) as compared to the decision variable profiles for the uncontrolled increased per capita consumption scenario (scenario 3). (A) Plant consumption parameter (kP1HH). (B) Animal consumption price (pH1). (C) Industrial efficiency parameter (λ). (D) Industrial efficiency toward agriculture parameter (θP1). (E) Discharge fee (dfee). (F) Maximum grassland allowance parameter ().
Figure 4 presents the profiles of the objectives under consideration, namely Carbon dioxide emissions, Nitrous Oxide emissions, Ecological Buffer, Green Net Product (GNP), Gross Domestic Product (GDP), and Global Water Stress. Figure 5 presents the FI profiles for the controlled scenario 3 as compared to the uncontrolled scenario 3 and the ideal scenario, which is the base case or the business as usual case. The objective of this study is to minimize the variance between the FI of the scenario under study (controlled scenario 3) and the ideal scenario (base case). Figure 5 shows that the FI of the controlled scenario 3 is close to the ideal scenario and shows a stable trend as compared to the uncontrolled scenario 3 where the FI is trending down continuously and shows fluctuations around the year 2125 which is the point at which the compartments start dying. Thus, this figure shows that the variance between control scenario 3 and the base case is minimized.
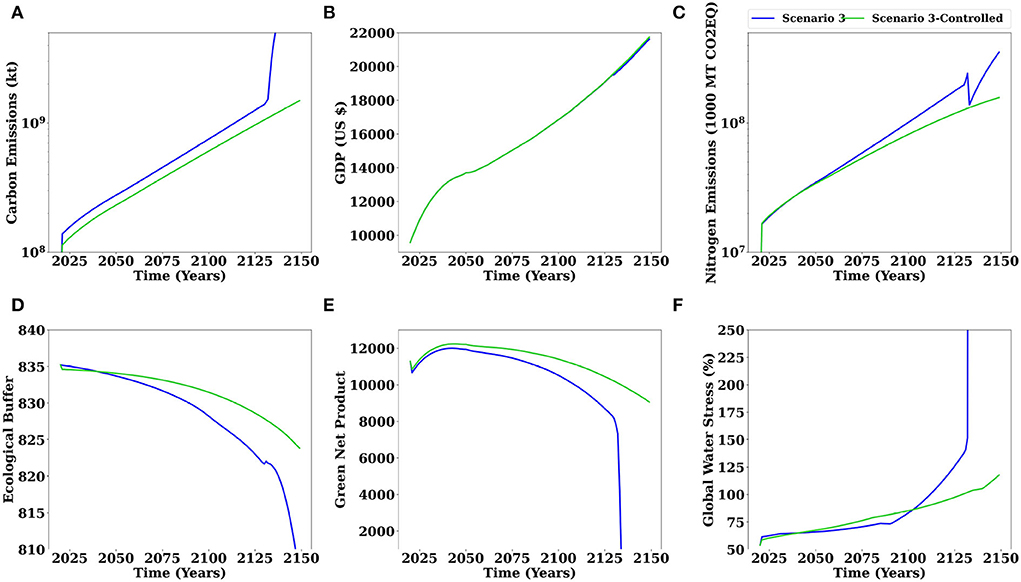
Figure 4. Objective function profiles of the six objectives for the controlled increased per capita consumption scenario (scenario 3 controlled) as compared to the objective profiles for the uncontrolled increased per capita consumption scenario (scenario 3). (A) Carbon emissions. (B) Gross Domestic Product (GDP). (C) Nitrogen emissions. (D) Ecological buffer. (E) Green net product. (F) Global water stress.
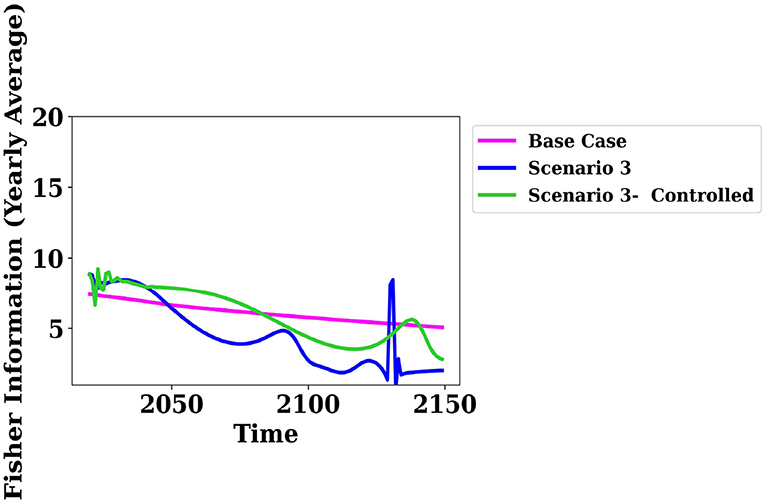
Figure 5. Fisher Information profile for the controlled increased per capita consumption scenario (scenario 3 controlled) as compared to the Fisher Information profiles for the uncontrolled increased per capita consumption scenario (scenario 3) and the business as usual scenario (scenario 1) (Nisal et al., 2022).
Figure 4 shows the profiles of the other six objectives with the optimal control variables.
The GDP as presented in Figure 4B shows a slight change around the year 2125 for the uncontrolled scenario 3. To further evaluate the effect of optimal control on this objective, the timeline was extended for 50 more years, and the forecasted GDP is observed till the year 2200. For this extended timeline, all parameters are the same as the previously described Scenario 3 with the exception that the total time is 250 years as opposed to the previous 200 years. Similarly, for the controlled scenario, the optimal decision profiles remain the same as presented in Figure 3 and the total time is 250 years. Figure 6 presents the GDP in this extended timeline and shows that the GDP in uncontrolled scenario 3 starts dropping marginally around the year 2125 and there is a sharp decline in GDP around the year 2175, which indicates that the economy is unstable in an unsustainable system. However, in the case of the controlled scenario 3, the GDP is increasing and indicates a stable global economy. Thus, corroborating the other results of this study that sustainability can be maintained through specific policy interventions. The multi-sectoral policy interventions will be discussed in the following section.
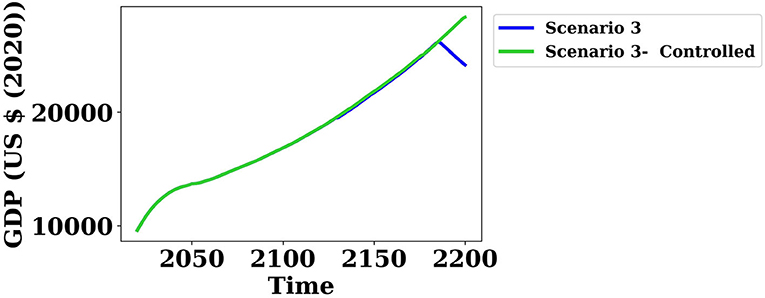
Figure 6. Gross Domestic Product (GDP) profile for the controlled increased per capita consumption scenario (scenario 3 controlled) as compared to the Gross Domestic Product (GDP) profile for the uncontrolled increased per capita consumption scenario (scenario 3).
Sustainable policymaking applied to global settings is a broad, multidisciplinary, and multifaceted space. Identification of creative policy mixes that promote environmental sustainability and economic prosperity while destabilizing older policies is needed for overall sustainability (Scordato et al., 2018). The policy implications of the optimal control solution are discussed in this section.
Figure 3A shows that a higher value of the plant consumption parameter (kP1HH) is optimal. This parameter affects the consumption of compartment P1 by the human compartment. One of the policy implications of such an increase in this parameter would be an associated increase in the consumption of the primary producer by humans. The model shows that humans are consuming more of the primary producer P1 over time which can mean that humans have an increased inclination for vegetarianism as a diet and plant-based foods are preferable. This could be implemented by reducing the tariffs associated with the agriculture sector and promoting plant-based foods as a sustainable alternative. This ideology finds support among many proposed sustainable growth ideas which suggest that restricting meat consumption and increasing plant consumption in the diet is a more sustainable approach (Salonen and Helne, 2012; United Nations, 2012; Lacour et al., 2018). This policy is also in line with the United Nations Sustainable Development Goal of "No Hunger", promoting food security and sustainable agriculture. However, the consumption of P1 by the HH compartment in this model is governed by multiple factors such as the surplus of P1 available, the availability from the resource pool (RP), and the amount of P1 going to the industry sector (IS). The amount of P1 required by the Industry or P1IS is a function of the decision variable θP1, and the amount of RP required by the Industry or RPIS is a function of the decision variable λ. A change in these variables also affects the P1HH flow.
The decision variable pH1, which is the minimum set price of the product H1 as related to the demand for H1 by humans (HH), evaluates animal consumption. The GGSM is an interconnected model where the demand-supply gap dynamics determine the prices of the products. Since the P1 compartment is maintained, enough food is available for the herbivores to prosper. Thus, as the livestock is maintained, there is enough to fulfill the human demand, and so the optimum value of the minimum set price of the H1 compartment is lower for the pH1 decision variable as compared to the base value as presented in Figure 3B.
The decision variables λ and θP1 are measures of industry efficiency. λ measures the efficiency of the Industry sector toward extraction from the environment or the amount of RP required to produce one unit of industry product. While θP1 measures the efficiency of the Industry sector toward agricultural production or the amount of P1 required to produce one unit of Industry product. It can be seen from Figure 3C presenting the profile for θP1 that the industrial efficiency toward utilization of agricultural produce as raw materials needs to improve. Thus, less quantity of P1 is required to produce one unit of industry product for humans to utilize. Agricultural biomass, whether it be food, fiber, or fuel, is utilized in various industries to produce several industrial products such as oils, resins, and paper. The profile for θP1 implies that there is a need for efficient handling of these agricultural products by the industry sector. Thus showing that there is a need for global investment in technologies that improve industrial efficiency to reduce the amount of agricultural biomass consumed. Alternatively, this policy can be implemented by improving the utilization of bio waste generated from agriculture, reduction of waste, and a green industrial approach (Shafiee-Jood and Cai, 2016; Gaurav et al., 2017; Prasara-A and Gheewala, 2017; Garcia-Herrero et al., 2018; Ben-Othman et al., 2020).
The optimal control profile (Figure 3F) for the control variable which regulates the access of livestock to the wild primary producer P2 compartment, shows that the access of livestock (H1) to P2 should be reduced. This policy suggests an active need for wild plants to be protected and livestock access to such wild grasslands to be curtailed further.
The decision variable discharge fee (pISHH) is a penalty imposed by a governing body on the industry sector to levy the amount of waste emitted into the environment. Thus, this fee taxes the industry for polluting the environment. Figure 3E shows that qualitatively a much larger value of discharge fee is required to achieve the sustainability goals as compared to the negligible penalty that is currently imposed on industrial waste. Du and Li (2020) show that constraining industrial pollutant discharge while implementing environmental regulations can reduce industrial emissions. Furthermore, investment in green industrial production and pollution treatment techniques are needed along with discharge penalties to observe realizable pollution control (Ji et al., 2020). The non-renewable energy sector is a major contributor to environmental emissions. Renewable energy offers advantages over nonrenewable energy by being abundant, sustainable, and having a low carbon footprint. McCollum et al. (2013) show that stringent climate policy for carbon emission mitigation and investing in decarbonization efforts would improve air quality and offer significant cost savings through reduced pollution control and energy security overheads, thus, increasing the gross domestic product (GDP) by the year 2030. Furthermore, the timing of a strategy with a mix of carbon emission taxation and subsidizing renewables is more sustainable in the longer term (Strnad et al., 2019). Furthermore, a faster reduction in the energy intensity (the ratio of the energy use to economic output) offers cross-sectoral benefits by reducing the demand for nonrenewable energy and upscaling renewable or low-carbon energy technologies (von Stechow et al., 2015). Walker et al. (2014) show that inter-sectoral policy interventions such as control of organic and sewage waste along with efficient wastewater treatment present economic benefits, reduced energy, water consumption, and sizable recovery of nitrogen and carbon in the system.
It is observed from Figure 4A, that the carbon emissions in the controlled scenario 3 are lower than those observed in the uncontrolled scenario. Similarly, Figure 4C shows that the nitrogen emissions (NOX) start reducing over time in the controlled scenario. The ecological buffer as shown in Figure 4D is higher in the controlled scenario, which depicts that the biocapacity of the environment is more, and thus, the environment is more resilient to human development. The Green Net Product (GNP), a green economic indicator, as shown in Figure 4E, is increasing and stable compared to the uncontrolled scenario. This is also because the green net product penalizes the economy with an increase in the number of environmental pollutants, which are carbon and nitrogen emissions in this case. The global water stress shown in Figure 4F measures the strain on the water resources to fulfill the demands of the human population. It is observed that the global water stress percentage is consistently lower as compared to the previous scenario 3 where the stress exceeded 100% in only 85 years. While there are seven objectives under consideration to measure sustainability, only one objective, i.e., FI was utilized to model the optimal control problem.
One significant contribution of this study is that minimizing the variance in the Fisher Information proves to be critical in fulfilling the other six objectives. Whereas minimizing for any one of the remaining six objectives does not fulfill the other criteria. Thus, forgoing a multi-objective optimization framework for this study. Fundamentally, Fisher Information is a measure of the order of the system. Thus, a system that maintains its order and has a near constant Fisher Information profile is stable and, thus, sustainable (Cabezas et al., 2018). These results reaffirm this theory by showing that optimizing the Fisher Information proves beneficial for maintaining sustainability in this system. Optimal control problems investigate an optimal control law that satisfies the performance indicator. It was apparent during this study that this problem has multiple solutions, many of which might not be realizable in an actual world environment but propose mathematical optimality. We acknowledge that some of the policy interventions mentioned here, such as the inflated discharge fee, might be unrealistic to impose in a global environment. However, qualitatively it is essential to note that this study shows that a high enough discharge fee or a drastic policy intervention is necessary if we are to observe any reduction in emissions on a global scale. The model utilized for this study is developed to give a better understanding of the world albeit in an abstracted mathematical manner. Hence, this is a complicated model based on assumptions that might not hold true in the real world. Thus, we concede that this model is evolving with time, and hence more features can be added which could change the policy inferences that are presented here.
Inordinate human consumption is unsustainable and has been a rising cause of concern regarding climate change and other environmental impacts. Global policy interventions are a necessity to tackle this crisis in order to maintain our global ecosystem, biodiversity, and economy for future generations. This study looks at sustainability from an optimal control perspective to provide a scientifically quantifiable foundation for policymaking. In this study, key policy variables within the GGSM framework are utilized as decision variables with the objective to minimize the variance in the FI. It is observed that reducing the variance in the FI yields a system that is sustainable across all the ecological dimensions and shows to have a better global economic contribution with a positive impact on tackling pollution. Thus, optimizing for FI is sufficient to optimize the other objectives under consideration. It is important to note that while the FI can provide a basis to reach a sustainable path, the policy actions from the different dimensions have to be implemented together. In this study, only one scenario was considered for analysis, where the policy variables remain constant for the control timeline of 130 years. In the future, we will look at other scenarios such as limiting the change of the policy variables to a certain percentage or magnitude and allowing the variables to change over time. Thus, the future study will look at the evolution of policy interventions over time and the impact of such interventions on the global environment.
The Generalized Global Sustainability Model utilized for this study can be found here: https://zenodo.org/record/6331602. This model uses global proportions for herbivores and carnivores to initialize the respective compartments Bar-On et al. (2018). Further, global scale data for human mortality rate, human population, carbon dioxide emissions, sectoral carbon emissions, nitrous oxide emissions, gross domestic product, global water available, regional water distribution, and the sectoral water demand were utilized in this model. These data are available from repositories such as FAO, AQUASTAT, Our World in Data, The World Bank and United Nations Food and Agriculture Organization of the United Nations (FAO) (2003, 2014, 2016, 2021a,b,c), United Nations (2004, 2019a,b, 2021), United Nations Statistics Division (2009), World Bank (2010), Gassert et al. (2013), Ritchie and Roser (2013, 2017), Roser (2013), Roser et al. (2013), The World Bank (2020a,b,c), Our World in Data (2021).
AN contributed to the investigation, software implementation, and writing of the original draft. UD contributed to the conceptualization, formal analysis, investigation, methodology, project administration, supervision, and review and editing of the manuscript. NH, YS, VR, PR-G, and HC contributed to the investigation and review and editing of the manuscript. All authors contributed to the article and approved the submitted version.
Collaborators from India acknowledge support from the Ministry of Human Resource Development, Government of India, through the SPARC (project code: P1238). The research contribution by HC was carried out in the framework of the GINOP-2.3.2-15-2016-00010 Development of enhanced engineering methods with the aim at the utilization of subterranean energy resources project of the Research Institute of Applied Earth Sciences of the University of Miskolc in the framework of the Szechenyi 2020 Plan, funded by the European Union.
This is a collaborative project between the USA, India, and Hungary. The authors would like to thank Shubham Sonkusare from the Department of Chemical Engineering at the Indian Institute of Technology Bombay for his contribution to reparameterizing the Generalized Global Sustainability Model.
The authors declare that the research was conducted in the absence of any commercial or financial relationships that could be construed as a potential conflict of interest.
All claims expressed in this article are solely those of the authors and do not necessarily represent those of their affiliated organizations, or those of the publisher, the editors and the reviewers. Any product that may be evaluated in this article, or claim that may be made by its manufacturer, is not guaranteed or endorsed by the publisher.
Ahmad, N., Derrible, S., Eason, T., and Cabezas, H. (2016). Using fisher information to track stability in multivariate systems. R. Soc. Open Sci. 3:160582. doi: 10.1098/rsos.160582
Ai, N., Kjerland, M., Klein-Banai, C., and Theis, T. L. (2019). Sustainability assessment of universities as small-scale urban systems: a comparative analysis using fisher information and data envelopment analysis. J. Clean. Prod. 212, 1357–1367. doi: 10.1016/j.jclepro.2018.11.205
Algunaibet, I. M., and Guillén-Gosálbez, G. (2019). Life cycle burden-shifting in energy systems designed to minimize greenhouse gas emissions: novel analytical method and application to the United States. J. Clean. Prod. 229, 886–901. doi: 10.1016/j.jclepro.2019.04.276
Al-Saffar, A. (2018). Using Fisher information approach in nonlinear dynamical systems (Ph.D. thesis). University of Sheffield, Sheffield, United Kingdom.
Amaruchkul, K. (2021). Multiobjective land–water allocation model for sustainable agriculture with predictive stochastic yield response. Int. Trans. Oper. Res. doi: 10.1111/itor.13015. [Epub ahead of print].
Artioli, F., Acuto, M., and McArthur, J. (2017). The water-energy-food nexus: an integration agenda and implications for urban governance. Polit. Geogr. 61, 215–223. doi: 10.1016/j.polgeo.2017.08.009
Bar-On, Y. M., Phillips, R., and Milo, R. (2018). The biomass distribution on earth. Proc. Natl. Acad. Sci. U.S.A. 115, 6506–6511. doi: 10.1073/pnas.1711842115
Benavides, P. T., Diwekar, U., and Cabezas, H. (2015). Controllability of complex networks for sustainable system dynamics. J. Complex Netw. 3, 566–583. doi: 10.1093/comnet/cnu051
Ben-Othman, S., Jõudu, I., and Bhat, R. (2020). Bioactives from agri-food wastes: present insights and future challenges. Molecules 25:510. doi: 10.3390/molecules25030510
Boumans, R., Costanza, R., Farley, J., Wilson, M. A., Portela, R., Rotmans, J., et al. (2002). Modeling the dynamics of the integrated earth system and the value of global ecosystem services using the gumbo model. Ecol. Econ. 41, 529–560. doi: 10.1016/S0921-8009(02)00098-8
Brundtland Commission (1987). Our Common Future. The World Commission on Environment 1 and Development. Brundtland Commission, 45–65.
Butler, D., and Schütze, M. (2005). Integrating simulation models with a view to optimal control of urban wastewater systems. Environ. Model. Softw. 20, 415–426. doi: 10.1016/j.envsoft.2004.02.003
Cabezas, H., Argoti, A., Friedler, F., Mizsey, P., and Pimentel, J. (2018). Design and engineering of sustainable process systems and supply chains by the P-graph framework. Environ. Prog. Sustain. Energy 37, 624–636. doi: 10.1002/ep.12887
Cabezas, H., and Fath, B. D. (2002). Towards a theory of sustainable systems. Fluid Phase Equil. 194–197, 3–14. doi: 10.1016/S0378-3812(01)00677-X
Calvin, K., Patel, P., Clarke, L., Asrar, G., Bond-Lamberty, B., Cui, R. Y., et al. (2019). GCAM v5. 1: representing the linkages between energy, water, land, climate, and economic systems. Geosci. Model Dev. 12, 677–698. doi: 10.5194/gmd-12-677-2019
Catney, P., and Doyle, T. (2011). The welfare of now and the green (post) politics of the future. Crit. Soc. Policy 31, 174–193. doi: 10.1177/0261018310395921
Chakraborty, D., Başağaoğlu, H., and Winterle, J. (2021). Interpretable vs. noninterpretable machine learning models for data-driven hydro-climatological process modeling. Expert Syst. Appl. 170:114498. doi: 10.1016/j.eswa.2020.114498
Chen, K., Wang, H., Valverde-Pérez, B., Zhai, S., Vezzaro, L., and Wang, A. (2021). Optimal control towards sustainable wastewater treatment plants based on multi-agent reinforcement learning. Chemosphere 279:130498. doi: 10.1016/j.chemosphere.2021.130498
Chlingaryan, A., Sukkarieh, S., and Whelan, B. (2018). Machine learning approaches for crop yield prediction and nitrogen status estimation in precision agriculture: a review. Comput. Electron. Agric. 151, 61–69. doi: 10.1016/j.compag.2018.05.012
Coopersmith, E. J., Minsker, B. S., Wenzel, C. E., and Gilmore, B. J. (2014). Machine learning assessments of soil drying for agricultural planning. Comput. Electron. Agric. 104, 93–104. doi: 10.1016/j.compag.2014.04.004
Demkowicz-Dobrzański, R., Gorecki, W., and Guţă, M. (2020). Multi-parameter estimation beyond quantum fisher information. J. Phys. A 53:363001. doi: 10.1088/1751-8121/ab8ef3
Diwekar, U. M. (2020). Introduction to Applied Optimization, Vol. 22. Cham: Springer Nature. doi: 10.1007/978-3-030-55404-0
Doshi, R., Diwekar, U., Benavides, P. T., Yenkie, K. M., and Cabezas, H. (2015). Maximizing sustainability of ecosystem model through socio-economic policies derived from multivariable optimal control theory. Clean Technol. Environ. Policy 17, 1573–1583. doi: 10.1007/s10098-014-0889-2
Du, W., and Li, M. (2020). Assessing the impact of environmental regulation on pollution abatement and collaborative emissions reduction: micro-evidence from Chinese industrial enterprises. Environ. Impact Assess. Rev. 82:106382. doi: 10.1016/j.eiar.2020.106382
Eason, T., and Cabezas, H. (2012). Evaluating the sustainability of a regional system using fisher information in the San Luis Basin, Colorado. J. Environ. Manage. 94, 41–49. doi: 10.1016/j.jenvman.2011.08.003
Etschmaier, M. M. (2014). A decision-making system for sustainability of productive enterprises: basing management decision-making on the condition of assets. Int. J. Sustain. Policy Practice 9, 1–11. doi: 10.18848/2325-1166/CGP/v09i02/55418
Eyhorn, F., Muller, A., Reganold, J. P., Frison, E., Herren, H. R., Luttikholt, L., et al. (2019). Sustainability in global agriculture driven by organic farming. Nat. Sustain. 2, 253–255. doi: 10.1038/s41893-019-0266-6
Food and Agriculture Organization of the United Nations (FAO) (2016). The State of World Fisheries and Aquaculture. Technical report, FAO.
Food and Agriculture Organization of the United Nations (FAO) (2014). Infographics on Water Resources and Uses. Available online at: http://www.fao.org/3/I9253EN/i9253en.pdf (accessed March 03, 2021).
Food and Agriculture Organization of the United Nations (FAO) (2021a). AQUASTAT Database. Available online at: http://www.fao.org/aquastat/statistics/query/index.html?lang=en (accessed March 03, 2021).
Food and Agriculture Organization of the United Nations (FAO) (2021b). AQUASTAT Metadata - Total Exploitable Water Resources. Available online at: www.fao.org/aquastat/statistics/popups/itemDefn.html?id=4196 (accessed March 03, 2021).
Food and Agriculture Organization of the United Nations (FAO) (2021c). Metadata for SDG 6. Available online at: https://unstats.un.org/sdgs/metadata/files/Metadata-06-04-02.pdf (accessedMarch 03, 2021).
Food and Agriculture Organization of the United Nations (FAO) (2003). Review of World Water Resources by Country. Available online at: http://www.fao.org/3/Y4473E/y4473e0f.gif (accessed August 25, 2021).
Frank, S. A. (2009). Natural selection maximizes fisher information. J. Evol. Biol. 22, 231–244. doi: 10.1111/j.1420-9101.2008.01647.x
Frieden, B. R. (2004). Science From Fisher Information, Vol. 974. New York, NY: Citeseer. doi: 10.1017/CBO9780511616907
Gao, J., Xu, X., Cao, G., Ermoliev, Y. M., Ermolieva, T. Y., and Rovenskaya, E. A. (2018). Optimizing regional food and energy production under limited water availability through integrated modeling. Sustainability 10:1689. doi: 10.3390/su10061689
Garcia-Herrero, I., Hoehn, D., Margallo, M., Laso, J., Bala, A., Batlle-Bayer, L., et al. (2018). On the estimation of potential food waste reduction to support sustainable production and consumption policies. Food Policy 80, 24–38. doi: 10.1016/j.foodpol.2018.08.007
Gassert, F., Reig, P., Luo, T., and Maddocks, A. (2013). Aqueduct Country and River Basin Rankings: A Weighted Aggregation of Spatially Distinct Hydrological Indicators. Available online at: https://www.wri.org/research/aqueduct-country-and-river-basin-rankings (accessed April 25, 2021).
Gaurav, N., Sivasankari, S., Kiran, G., Ninawe, A., and Selvin, J. (2017). Utilization of bioresources for sustainable biofuels: a review. Renew. Sustain. Energy Rev. 73, 205–214. doi: 10.1016/j.rser.2017.01.070
González-Mejía, A., Vance, L., Eason, T., and Cabezas, H. (2015). “Chapter 2 - Recent developments in the application of Fisher information to sustainable environmental management,” in Assessing and Measuring Environmental Impact and Sustainability, ed J. J. Klemeš (Oxford: Butterworth-Heinemann), 25–72. doi: 10.1016/B978-0-12-799968-5.00002-6
Gonzalez-Mejia, A. M. (2011). Fisher information-sustainability analysis of several US Metropolitan statistical areas (Ph.D. thesis). University of Cincinnati, Cincinnati, OH, United States.
Gonzalez-Mejia, A. M., Eason, T., Cabezas, H., and Suidan, M. T. (2012). Computing and interpreting fisher information as a metric of sustainability: regime changes in the United States air quality. Clean Technol. Environ. Policy 14, 775–788. doi: 10.1007/s10098-011-0445-2
Haass, R., Dittmer, P., Veigt, M., and Lütjen, M. (2015). Reducing food losses and carbon emission by using autonomous control–A simulation study of the intelligent container. Int. J. Prod. Econ. 164, 400–408. doi: 10.1016/j.ijpe.2014.12.013
Hanumante, N., Shastri, Y., Nisal, A., Diwekar, U., and Cabezas, H. (2022). Integrated model for Food-Energy-Water (FEW) nexus to study global sustainability: the water compartments and water stress analysis. PLoS ONE 17:e0266554. doi: 10.1371/journal.pone.0266554
Ji, S., Chen, H., Chuan, Y., Gao, L., Liu, C., Liu, H., et al. (2020). Relationship verification between CO2 and pollutant emissions: policy evaluation based on the pollutant discharge fee in china. J. Water Clim. Change 11, 891–900. doi: 10.2166/wcc.2019.277
Jiang, K., You, D., Li, Z., and Shi, S. (2019). A differential game approach to dynamic optimal control strategies for watershed pollution across regional boundaries under eco-compensation criterion. Ecol. Indic. 105, 229–241. doi: 10.1016/j.ecolind.2019.05.065
Kanitscheider, I., Coen-Cagli, R., Kohn, A., and Pouget, A. (2015). Measuring fisher information accurately in correlated neural populations. PLoS Comput. Biol. 11:e1004218. doi: 10.1371/journal.pcbi.1004218
Karunanithi, A. T., Cabezas, H., Frieden, B. R., and Pawlowski, C. W. (2008). Detection and assessment of ecosystem regime shifts from fisher information. Ecol. Soc. 13:22. doi: 10.5751/ES-02318-130122
Kellett, C. M., Weller, S. R., Faulwasser, T., Grüne, L., and Semmler, W. (2019). Feedback, dynamics, and optimal control in climate economics. Annu. Rev. Control 47, 7–20. doi: 10.1016/j.arcontrol.2019.04.003
King, C. W. (2020). An integrated biophysical and economic modeling framework for long-term sustainability analysis: the Harmoney model. Ecol. Econ. 169:106464. doi: 10.1016/j.ecolecon.2019.106464
Lacour, C., Seconda, L., Allés, B., Hercberg, S., Langevin, B., Pointereau, P., et al. (2018). Environmental impacts of plant-based diets: how does organic food consumption contribute to environmental sustainability? Front. Nutr. 8:8. doi: 10.3389/fnut.2018.00008
Liu, J., Mooney, H., Hull, V., Davis, S. J., Gaskell, J., Hertel, T., et al. (2015). Systems integration for global sustainability. Science 347, 963–963. doi: 10.1126/science.1258832
Ly, A., Marsman, M., Verhagen, J., Grasman, R. P., and Wagenmakers, E.-J. (2017). A tutorial on fisher information. J. Math. Psychol. 80, 40–55. doi: 10.1016/j.jmp.2017.05.006
McCollum, D. L., Krey, V., Riahi, K., Kolp, P., Grubler, A., Makowski, M., et al. (2013). Climate policies can help resolve energy security and air pollution challenges. Clim. Change 119, 479–494. doi: 10.1007/s10584-013-0710-y
Meadows, D. H., Meadows, D. H., Randers, J., and Behrens, W. W. III. (1972). The Limits to Growth: A Report to the Club of Rome (1972). Google Scholar, 91.
Meadows, D. H., Meadows, D. L., and Randers, J. (1992). Beyond the Limits: Confronting Global Collapse Envisioning a Sustainable Future. New York, NY: Chelsea Green Publishing Company.
Mercure, J. F., Paim, M. A., Bocquillon, P., Lindner, S., Salas, P., Martinelli, P., et al. (2019). System complexity and policy integration challenges: the Brazilian Energy- Water-Food Nexus. Renew. Sustain. Energy Rev. 105, 230–243. doi: 10.1016/j.rser.2019.01.045
Meyer, J. J. (2021). Fisher information in noisy intermediate-scale quantum applications. Quantum 5:539. doi: 10.22331/q-2021-09-09-539
Motesharrei, S., Rivas, J., and Kalnay, E. (2014). Human and nature dynamics (handy): modeling inequality and use of resources in the collapse or sustainability of societies. Ecol. Econ. 101, 90–102. doi: 10.1016/j.ecolecon.2014.02.014
Nalewajski, R. F. (2008). Use of fisher information in quantum chemistry. Int. J. Quant. Chem. 108, 2230–2252. doi: 10.1002/qua.21752
Nisal, A., Diwekar, U., Hanumante, N., Shastri, Y., and Cabezas, H. (2022). Integrated model for food-energy-water (FEW) nexus to study global sustainability: the main generalized global sustainability model (GGSM). PLoS ONE 17:e0267403. doi: 10.1371/journal.pone.0267403
Our World in Data (2021). Land Area. Available online at: https://ourworldindata.org/grapher/land-area-km (accessed March 03, 2021).
Prados, A. (2021). Optimizing the relaxation route with optimal control. Phys. Rev. Res. 3:023128. doi: 10.1103/PhysRevResearch.3.023128
Prasara-A, J., and Gheewala, S. H. (2017). Sustainable utilization of rice husk ash from power plants: a review. J. Clean. Prod. 167, 1020–1028. doi: 10.1016/j.jclepro.2016.11.042
Qin, S., Cramer, M., Koch, C. P., and Serafini, A. (2022). Optimal control for Hamiltonian parameter estimation in non-commuting and bipartite quantum dynamics. arXiv preprint arXiv:2205.02429. doi: 10.48550/arXiv.2205.02429
Ramírez-Carrillo, E., López-Corona, O., Toledo-Roy, J. C., Lovett, J. C., de León-González, F., Osorio-Olvera, L., et al. (2018). Assessing sustainability in North America's ecosystems using criticality and information theory. PLoS ONE 13:e0200382. doi: 10.1371/journal.pone.0200382
Randall, A. (2021). Monitoring sustainability and targeting interventions: indicators, planetary boundaries, benefits and costs. Sustainability 13:3181. doi: 10.3390/su13063181
Rawlings, E. S., Barrera-Martinez, J., and Rico-Ramirez, V. (2020). Fisher information calculation in a complex ecological model: an optimal control-based approach. Ecol. Model. 416:108845. doi: 10.1016/j.ecolmodel.2019.108845
Revollar, S., Vega, P., Vilanova, R., and Francisco, M. (2017). Optimal control of wastewater treatment plants using economic-oriented model predictive dynamic strategies. Appl. Sci. 7:813. doi: 10.3390/app7080813
Rico-Ramirez, V., Reyes-Mendoza, M. A., Quintana-Hernandez, P. A., Ortiz-Cruz, J. A., Hernandez-Castro, S., and Diwekar, U. M. (2010). Fisher information on the performance of dynamic systems. Indus. Eng. Chem. Res. 49, 1812–1821. doi: 10.1021/ie901220w
Ritchie, H., and Roser, M. (2013). Land use. Our World in Data. Available online at: https://ourworldindata.org/land-use
Ritchie, H., and Roser, M. (2017). Meat and Dairy Production. Our World in Data. Available online at: https://ourworldindata.org/meat-production
Rockström, J., Williams, J., Daily, G., Noble, A., Matthews, N., Gordon, L., et al. (2017). Sustainable intensification of agriculture for human prosperity and global sustainability. Ambio 46, 4–17. doi: 10.1007/s13280-016-0793-6
Rodriguez-Gonzalez, P. T., Rico-Martinez, R., and Rico-Ramirez, V. (2020). Effect of feedback loops on the sustainability and resilience of human-ecosystems. Ecol. Model. 426:109018. doi: 10.1016/j.ecolmodel.2020.109018
Roser, M. (2013). Economic Growth. Our World in Data. Available online at: https://ourworldindata.org/economic-growth
Roser, M., Ritchie, H., and Ortiz-Ospina, E. (2013). World Population Growth. Our World in Data. Available online at: https://ourworldindata.org/world-population-growth
Salonen, A. O., and Helne, T. T. (2012). Vegetarian diets: a way towards a sustainable society. J. Sustain. Dev. 5:10. doi: 10.5539/jsd.v5n6p10
Schwaninger, M. (2015). Organizing for sustainability: a cybernetic concept for sustainable renewal. Kybernetes 44, 935–954. doi: 10.1108/K-01-2015-0008
Scordato, L., Klitkou, A., Tartiu, V. E., and Coenen, L. (2018). Policy mixes for the sustainability transition of the pulp and paper industry in Sweden. J. Clean. Prod. 183, 1216–1227. doi: 10.1016/j.jclepro.2018.02.212
Shafiee-Jood, M., and Cai, X. (2016). Reducing food loss and waste to enhance food security and environmental sustainability. Environ. Sci. Technol. 50, 8432–8443. doi: 10.1021/acs.est.6b01993
Shastri, Y., and Diwekar, U. (2006). Sustainable ecosystem management using optimal control theory: part 1 (deterministic systems). J. Theor. Biol. 241, 506–521. doi: 10.1016/j.jtbi.2005.12.014
Shastri, Y., Diwekar, U., and Cabezas, H. (2008a). Optimal control theory for sustainable environmental management. Environ. Sci. Technol. 42, 5322–5328. doi: 10.1021/es8000807
Shastri, Y., Diwekar, U., Cabezas, H., and Williamson, J. (2008b). Is sustainability achievable? exploring the limits of sustainability with model systems. Environ. Sci. Technol. 42, 6710–6716. doi: 10.1021/es800661x
Sichilalu, S. M. (2016). Optimal control of renewable energy/grid hybrid systems with heat pump load (Ph.D. thesis). University of Pretoria, Pretoria, South Africa. doi: 10.1016/j.solener.2016.05.028
Stiglitz, J. E., Stern, N., Duan, M., Edenhofer, O., Giraud, G., Heal, G. M., et al. (2017). Report of the High-Level Commission on Carbon Prices.
Strnad, F. M., Barfuss, W., Donges, J. F., and Heitzig, J. (2019). Deep reinforcement learning in World-Earth system models to discover sustainable management strategies. Chaos 29:123122. doi: 10.1063/1.5124673
Syvitski, J., Waters, C. N., Day, J., Milliman, J. D., Summerhayes, C., Steffen, W., et al. (2020). Extraordinary human energy consumption and resultant geological impacts beginning around 1950 CE initiated the proposed anthropocene epoch. Commun. Earth Environ. 1, 1–13. doi: 10.1038/s43247-020-00029-y
Taherzadeh, O., Bithell, M., and Richards, K. (2021). Water, energy and land insecurity in global supply chains. Glob. Environ. Change 67:102158. doi: 10.1016/j.gloenvcha.2020.102158
The World Bank (2020c). Nitrous Oxide Emissions (Thousand Metric Tons of CO2 Equivalent) Data. The World Bank.
United Nations (2012). Flexitarianism: Flexible or Part-Time Vegetarianism–United Nations Partnerships for SDGs Platform. United Nations.
United Nations (2019b). World Population Prospects Highlights, 2019 Revision Highlights, 2019 Revision. United Nations.
United Nations (2021). Sustainable Development Goal 6 on water and sanitation (SDG 6) - Global Status. Available online at: https://www.sdg6data.org/ (accessed March 03, 2021).
United Nations Statistics Division (2009). Energy Statistics Yearbook. United Nations Statistics Division.
Validi, S., Bhattacharya, A., and Byrne, P. (2014). A case analysis of a sustainable food supply chain distribution system–a multi-objective approach. Int. J. Prod. Econ. 152, 71–87. doi: 10.1016/j.ijpe.2014.02.003
Vanham, D., Leip, A., Galli, A., Kastner, T., Bruckner, M., Uwizeye, A., et al. (2019). Environmental footprint family to address local to planetary sustainability and deliver on the SDGs. Sci. Tot. Environ. 693:133642. doi: 10.1016/j.scitotenv.2019.133642
Verma, M., Verma, A. K., and Misra, A. (2021). Mathematical modeling and optimal control of carbon dioxide emissions from energy sector. Environ. Dev. Sustain. 23, 13919–13944. doi: 10.1007/s10668-021-01245-y
Vickers, N. A., and Andersson, S. B. (2021). Information optimal control for single particle tracking microscopy. IFAC-PapersOnLine 54, 649–654. doi: 10.1016/j.ifacol.2021.08.434
Vinca, A. (2021). Integrated climate-land-energy-water solutions: modelling and assessment of sustainability policy options (thesis). University of Victoria, Victoria, BC, Canada.
Voinov, A., Seppelt, R., Reis, S., Nabel, J. E. M. S., and Shokravi, S. (2014). Values in socio-environmental modelling: persuasion for action or excuse for inaction. Environ. Model. Softw. 53, 207–212. doi: 10.1016/j.envsoft.2013.12.005
von Stechow, C., McCollum, D., Riahi, K., Minx, J. C., Kriegler, E., van Vuuren, D. P., et al. (2015). Integrating global climate change mitigation goals with other sustainability objectives: a synthesis. Annu. Rev. Environ. Resour. 40, 363–394. doi: 10.1146/annurev-environ-021113-095626
Walker, R. V., Beck, M. B., Hall, J. W., Dawson, R. J., and Heidrich, O. (2014). The energy-water-food nexus: Strategic analysis of technologies for transforming the urban metabolism. J. Environ. Manage. 141, 104–115. doi: 10.1016/j.jenvman.2014.01.054
Keywords: global model, optimal control, sustainability, policy making, Fisher information
Citation: Nisal A, Diwekar U, Hanumante N, Shastri Y, Cabezas H, Rico Ramirez V and Rodríguez-González PT (2022) Evaluation of global techno-socio-economic policies for the FEW nexus with an optimal control based approach. Front. Sustain. 3:948443. doi: 10.3389/frsus.2022.948443
Received: 19 May 2022; Accepted: 18 July 2022;
Published: 31 August 2022.
Edited by:
Ruchi Agrawal, TERI Gram, IndiaReviewed by:
José María Ponce-Ortega, Michoacana University of San Nicolás de Hidalgo, MexicoCopyright © 2022 Nisal, Diwekar, Hanumante, Shastri, Cabezas, Rico Ramirez and Rodríguez-González. This is an open-access article distributed under the terms of the Creative Commons Attribution License (CC BY). The use, distribution or reproduction in other forums is permitted, provided the original author(s) and the copyright owner(s) are credited and that the original publication in this journal is cited, in accordance with accepted academic practice. No use, distribution or reproduction is permitted which does not comply with these terms.
*Correspondence: Urmila Diwekar, dXJtaWxhQHZyaS1jdXN0b20ub3Jn
Disclaimer: All claims expressed in this article are solely those of the authors and do not necessarily represent those of their affiliated organizations, or those of the publisher, the editors and the reviewers. Any product that may be evaluated in this article or claim that may be made by its manufacturer is not guaranteed or endorsed by the publisher.
Research integrity at Frontiers
Learn more about the work of our research integrity team to safeguard the quality of each article we publish.