- 1Graduate School of Advanced Integrated Studies in Human Survivability (Shishukan), Kyoto University, Kyoto, Japan
- 2Institute of Developing Economies, Japan External Trade Organization, Chiba, Japan
- 3Economic Research Institute for ASEAN and East Asia (ERIA), Jakarta, Indonesia
This study examined whether nighttime light can be a proxy for building height. It is important for estimating an urban environment and urban design and understanding industrial clusters. However, it is necessary to purchase height data for a wide range of buildings, and it is difficult to obtain data in a time series. In this study, we examined whether it is possible to estimate the height of buildings using nighttime light data. This research focuses on the fact that as the number of windows increases, the amount of light leaking from the windows during the night increases for the entire building. This increases the amount of light emitted by the building. We conducted the first Japanese correlation analysis using a three-dimensional dataset with a resolution of 1 meter that was released by Hyogo Prefecture on 10 January 2020. We also used nighttime light data from the Suomi NPP satellite, which has been in operation since 2011 and is jointly managed by National Oceanic and Atmospheric Administration and NASA. The percentage of land occupied by buildings within a 450-meter square of a nighttime light resolution was varied to obtain a higher correlation between buildings and nighttime light. The correlation between the average height of buildings and the luminous intensity of nighttime light within that pixel was calculated. The coefficient of determination was 0.425, which was the best value when the percentage of land occupied by buildings in a pixel was between 70 and 80%. This study found a high correlation between night light and building height. We believe that if a building has a certain size, the night light can be used as a proxy. The results of our research will contribute to understanding the changes and characteristics of urban development and population distribution as urbanization progresses in various regions. Rapid public transportation services, education, and environmental improvement will contribute to urban development and changes in population distribution, which will greatly relieve urban poverty and improve urban security and the environment.
Introduction
Research background
Estimating economic activities or Gross Domestic Products (GDPs) is one of the critical challenges to promote the research of economics and other fields of social sciences (James, 2020). However, we face various obstacles such as lack of data or data accessibilities and improving statistical methods (Henderson and Adam, 2012). In line with the research trends, the authors aimed to examine the relationship between the nighttime light and building height to understand the amounts of economic activities in urban areas by using the case of Japan.
In Japanese urban planning, floor area ratios are set for each building site in order to control industrial concentration and population density. The floor area ratio is the total floor area ratio to the site area. In Japan, floor area ratios are set by local governments according to the characteristics of each region. Local governments set floor area ratios according to the characteristics of each region. In central areas, where people and businesses tend to congregate, floor area ratio regulations are more relaxed, making it easier to construct relatively large buildings [see the website of the Ministry of Internal Affairs Communications (2021)]. In this way, the development of a city is controlled by its floor area ratio, which is closely related to its industrial concentration and population density.
When planning urban facilities, such as transportation, parks and green spaces, and educational and cultural facilities, it is important to understand the changes and characteristics of urban development and population distribution changes and characteristics. If public transportation services, education, and environmental development lag behind urban development and changes in population distribution, there may be serious problems in terms of poverty, security, and the environment. We believe it is important to understand the differences and characteristics of urban development and population distribution to reduce these risks.
The total floor area of buildings and the building height are critical factors in understanding the characteristics of a city. However, the data on gross floor area and building height needed to determine floor area ratios are not available every year. The only way to obtain accurate data over a wide area is to purchase it. The data collection method is another reason for the high cost of data. Building height data is measured by aerial laser surveying. The measurements were taken by airplane over a large area over about two years, so it took a lot of time and money to collect the data, which increased the cost of the data.
On the other hand, the amount of satellite data downloaded free of charge has increased significantly over the past decade. The accuracy of earth observation using satellites has been improving in recent years, and the scope of open data has been expanding. In addition, geographic information systems (GIS) is a technology that enables advanced analysis and quick decisions on information indicating the location of specific points or areas in space (positional information). Information on various events associated with the location-based on computer processing has been dramatically developed. The combination of these technologies has made it possible to understand and predict the spatial structure of various regions [see the website of the Geospatial Information Authority of Japan (2021)].
This study examined the relationship between nighttime light and building height. Suppose nighttime light data can be applied as a proxy variable for building height. Building height data—which is difficult to obtain in a time series—can be referred to free of charge. The characteristics of urban industrial clusters and population distribution can be grasped on a finer timescale, contributing to urban design and planning.
Review of previous studies
Henderson and Adam (2012) used the World Bank's global GDP growth data for 1992–1993 and 2004–2005 and found a correlation between changes in nighttime light intensity and GDP growth. The coefficient of determination is 0.288, which is a scatter plot of 170 countries worldwide with the difference in GDP without processing on the Y-axis and the logarithm of the difference in night light on the X-axis. This research approaches the three main problems that have been identified in developing countries: the existence of unofficial transactions that are not reflected in GDP, the lack of infrastructure for collecting statistics, and the existence of countries whose GDP is not published. Research is still being actively conducted. Since the publication of this paper as a working paper in 2009, the value of using nocturnal satellite imagery has been fully recognized by the economist community, and its use has expanded rapidly since then (Mellander et al., 2015).
On the other hand, it is difficult to estimate GDP in developing countries where the main industry is rural because nighttime light cannot be measured (Nordhaus and Chen, 2012). Previous studies have proven that nighttime light has a certain effect on improving economic production statistics at the national level in certain countries, but little research has been conducted at the local level within a country (Keola and Andersson, 2015). In particular, it has been challenging to estimate the economic activity of people living in or near the international poverty line ($1.90 per person per day). Since the level of luminous intensity in these areas was very low and varied very little, the night light was not effective in estimating the economic activity in these areas. At the time, a method of using cell phone data to infer poverty was used to solve this problem by Blumenstock et al. (2015).
Blumenstock et al. (2015) shows that they used an anonymous database containing records of billions of interactions on Rwanda's largest cell phone network to infer and map the socioeconomic status of individuals based on their past cell phone usage history. They also randomly selected 856 people from the database and conducted a telephone questionnaire about their assets and housing characteristics. Using cell phone metadata, they were able to reconstruct the distribution of wealth for the entire country accurately and infer the distribution of assets in micro-regions consisting of only a few households (Blumenstock et al., 2015). This approach was a very effective way to visualize the distribution of wealth in countries with limited information resources, where census and household surveys are rarely conducted.
On the other hand, extending this research beyond a country is very difficult because it relies on a unique data set, with data bias depending on the cell phone company that provides the data.
Therefore, recent studies have used deep learning techniques to infer economic activity in rural districts and other districts where it is challenging to extract production at night light. Jean et al. (2016) used survey data from five African countries (Nigeria, Tanzania, Uganda, Malawi, and Rwanda) and satellite data were used to train convolutional neural networks to explain up to 75% of the economic variation at the regional level. Jean et al. (2016) obtained characteristics of poor areas and made economic forecasts by overlaying daylight and nightlight satellite images of areas that appear almost black with no light when viewed in nightlight. We extracted objects such as houses and rivers from the daytime satellite images using deep learning. We found that these features, such as the material of the roof and the distance to the urban area, were proportional to the expenditure of the village and inferred economic activity from them.
In general, deep learning models such as convolutional neural networks can, in principle, be trained to estimate economic outcomes from satellite images directly. Still, when it comes to poor regions in Africa, the lack of these training data makes it difficult to apply this method (Christian, 2019). However, Jean et al. (2016) used a method called transfer learning, which is capable of inferring even on a small training data set, allowing for the extraction of village objects.
Thus, research has been conducted on the use of night light to infer GDP from night light (Chen and Nordhaus, 2019). However, previous studies have shown that it is difficult to estimate GDP from nightlight data alone since GDP is estimated based on primary statistics covering as many economic transactions as possible. Therefore, in developing countries with many data gaps in the primary statistics, GDP as a teacher data, has low credibility and needs to be substituted with other figures (Nordhaus and Chen, 2012). There are many regions where no data exists when it comes to GDP. Gaps in teacher data can be an obstacle to numerical estimation. On the other hand, for height data, the accuracy of the teacher data is high, and the sample size is large.
Barr et al. (2015) is the first paper to examine how skyscraper height and output co-move rigorously. Here he explains that building height can be a leading indicator of GDP, while at the same time explaining that height does not cause production (Barr et al., 2015). Therefore, instead of using nighttime lighting directly to estimate GDP, understanding industrial structure from building height could contribute to closing the GDP data gap. Therefore, this study proposes a proxy variable for building height as a new use value for nighttime lighting.
Research purpose
This study aims to conduct a correlation analysis with night light data using building height data based on prefecture-wide 3D data with 1-m mesh accuracy, which Hyogo Prefecture in Japan released for the first time in Japan on January 10, 2020. Hyogo Prefecture is located in the center of Japan. It has more than five million populations, including Kobe city (about 1.5 million people), one of the largest cities in Japan according to the statistics1. Therefore, the data of Hyogo prefecture is suitable for our research purpose to examine the urban area.
The hypothesis of this study is that night light can be used as a proxy for building height as a new use night light. This is inspired by the fact that the number of windows in a building increases in proportion to the height of the building. As the number of windows increases, the amount of light that leaks out of the windows at night increases for the establishment, and the amount of light emitted increases. This research is focused on this point. In this study, we will examine whether a positive correlation can be found between nighttime light and the height of a building.
Data
e-Stat (https://www.e-stat.go.jp/)
The General Contact Point for Government Statistics (e-Stat) is a portal site for government statistics in Japan. It has been in operation since 2008 and was created by the Liaison Conference of Chief Information Officers of Ministries and Agencies. It aims to provide a one-stop service for information on government statistics in Japan [see the websites of e-Stat (2021) “About this Site”].
This site consolidates statistics-related information that has been scattered across independent websites operated by ministries and agencies. The site provides various statistics registered by each ministry and agency, such as statistical table files, statistical data, publication schedules, new information, survey item information, and statistical classifications [see the websites of e-Stat (2021) “About this Site”]. Its purpose is to provide statistical results, which are the information infrastructure of society, in a form that is easily accessible to all.
In this study, we used the boundary data of Hyogo Prefecture from e-Stat. The boundary data is used to cut the satellite data and GIS data such as Night-Time Light Data and building information by coordinate mesh. The boundary data is the data for the whole Hyogo Prefecture in the 2014 national census and subregions (town, district, character, etc.). The data format is a shapefile in the world geodetic system rectangular plane coordinate system.
It is used in large scale maps, such as “1/2,500 National Land Map,” “1/5,000 National Land Map,” and “1/10,000 Topographic Map” published by the Geographical Survey Institute. The projection method is the Gauss-Kruger method (also called “horizontal Mercator projection”). In order to reduce the distortion caused by projecting an ellipsoid surface onto a plane, the whole country of Japan is divided into 19 regions, each of which has its coordinate origin.
In order to reduce the distortion caused by projecting an ellipsoid surface onto a plane, the whole country is divided into 19 regions, each of which has its own coordinate origin. One-hundred-thirty km east and west from the coordinate origin is the applicable range of each coordinate system [see the website of esri Japan., 2021, “Coordinate Systems Used in Japan”].
National land data information (https://nlftp.mlit.go.jp/ksj/)
The Ministry of Land, Infrastructure, Transport and Tourism (MLIT) of Japan has developed numerical national land information to support the formulation and implementation of national land planning. The ministry provides a variety of information on national land, including administrative areas, railroads, roads, rivers, official land price announcements, land use mesh, and public facilities [see the website of MLIT Ministry of Land Infrastructure Transport Tourism (2021a), GIS Home Page].
This study used the 2014 Hyogo Prefecture data. To investigate the light intensity of building sites in Hyogo Prefecture, we overlaid the building site data on top of the nighttime lighting data.
Fundamental geospatial information (https://www.gsi.go.jp/kiban/)
Fundamental Geospatial Information has been developed by the Geospatial Information Authority of Japan since the enactment of the Basic Act on the Utilization of Geospatial Information in 20072. At present, the initial development of base map information is almost complete, with about 100,000 square kilometers of urban planning areas at a scale level of 2,500 and other areas at a scale level of 25,000.
Basic items of fundamental geospatial data
In order to extract the area of buildings and location information by coordinates, all the data of Hyogo Prefecture was downloaded and used. The downloaded file format was JPGIS (GML) format.
The JPGIS format, officially called the “Japan Profile for Geographic Information Standards,” is a set of data formats developed in accordance with international and national standards. The main purpose is to ensure the compatibility of the GIS spatial data for mutual use among different systems. It is a practical standard that specifies rules for data design, quality, description methods, and specification writing methods. These are international and national standards.
Therefore, by promoting the use of JPGIS, an environment that facilitates the mutual use of data can be established. The effects of sharing data maintained by different maintenance entities, reducing system dependency, and eliminating duplication of investment can be expected. This will enable cost reduction and business efficiency and will contribute to the formation of a more efficient information society and the realization of a safe and secure society (see the website of GSI 2 (2021), “What can be done with the practical use of geospatial information (JPGIS)”).
The basic items of Fundamental Geospatial Information are 10 items taken from the 13 items of Fundamental Geospatial Information. They are survey reference points, coastlines, boundaries and representative points of administrative divisions, road edges, track centerlines, elevation points, water lines, perimeter lines of buildings, boundaries and representative points of towns and cities, and boundaries and representative points of city blocks (Fundamental Geospatial Data Fundamental Geospatial Data Basic Items., 2021).
Building data
The extent of the buildings was determined from the building perimeter data published by the Geospatial Information Authority of Japan. The data was downloaded for the entire area of Hyogo Prefecture and was used to identify the actual locations of buildings. The data items are defined by the acquisition standard used in the large scale topographic map format, and the buildings are indicated by the following categories.
Futsu-Tatemono
Buildings with less than three floors and buildings with three or more floors constructed of wood or other materials.
Kenrou-Tatemono
Buildings constructed of reinforced concrete, etc., more than three stories above ground or with a height equivalent of more than three stories.
Futsu-Muhekisha
Buildings without side walls, greenhouses, and similar buildings in factories with less than three floors; for example, plastic greenhouses.
Kenrou-Muhekisha
Buildings without side walls constructed of reinforced concrete or similar materials and having a height of more than three stories above ground or more than the equivalent of three stories (for example, self-propelled multistorey parking lots, etc.) (Ministry of Land Infrastructure Transport Tourism, 2021b).
G-space information center (https://www.geospatial.jp/gp_front/)
The G-Spatial Information Center is a platform built by the National Institute of Information and Communications Technology. the University of Tokyo and Hitachi, Ltd. have built a platform to freely combine and obtain G-Spatial information held by the public and private sectors in a one-stop service. It was established based on the Basic Plan for the Promotion of Geospatial Information Utilization approved by the government in March 20123. The Council for Promotion of Social Infrastructure Information Distribution has been conducted since 2016.
The merits of the G-Spatial Information Center are abilities to register and centrally search for G-Spatial information held by industries, governments, and academia; the ability to convert registered G-Spatial information into a form that is easy for users to use and obtain; and the ability to obtain G-Spatial information by both downloading and API. Making the registered G-Spatial information available via API, may mean that G-Spatial information will be utilized in a wide range of fields [see the website of Japan Council for Promotion of Information Sharing on Infrastructures Operation of the “G.-Geospatial Information Center. (2021)].
Hyogo prefecturewide digital surface model
On January 10, 2020, Hyogo Prefecture released the first prefecture-wide 3D dataset with 1-m mesh accuracy in Japan. The Digital Surface Model (DSM) is also known as a numerical surface model, which is the numerical surface layer of aerial laser survey results that include the ground surface, buildings, and vegetation. It is the original aerial survey data.
The data is in the form of a grid with 1-m intervals, and it is text data with XYZ coordinate values. It was created using aerial laser survey data of a 1-m mesh produced by Hyogo Prefecture and the Rokko Erosion Control Office, Kinki Regional Development Bureau, and the Ministry of Land, Infrastructure, and Transport of Japan. The coordinate system is the Japan Geodetic System 2000.
Hyogo-wide digital height model
This is the height data of the ground above the ground surface, which is created by the difference between the DSM and the Digital Elevation Model (DEM). This includes everything above the ground surface, including buildings and trees and other plants. The observation period was from 2012 to 2013.
National oceanic and atmospheric administration (NOAA)/NASA Suomi NPP satellite day/night band (https://eogdata.mines.edu/download_dnb_composites.html)
NASA and the NOAA launched the Suomi NPP Earth observation satellite in November 2011, equipped with the Visible and Infrared Imager and Radiometer (VIIRS). Most satellites have a daytime light source, and most satellites observe only during the daytime, but Suomi NPP also performs observations at night, and the data used in this study is nighttime data.
The monthly data has not been filtered to remove auroras, fires, boats, and other transient lights. Also, the resolution is a 15-arcsecond grid (about 450 m) ranging from −180 to 180 degrees, covering latitudes 65S to 75N, and is available in geotiff format [Version 1 VIIRS Day/Night Band Nighttime Lights].
This paper uses annual data for the year 2016. In this study, we used the data from the vcm-orm-ntl file, where the nighttime light outliers are removed and the non-light portion is set to zero. The values in this data are proportional to the actual luminous intensity.
Research methods
Creating a correlation between building height and nighttime light in hyogo prefecture
Using the VIIRS annual composite, DSM, and DEM data, we calculated the height (DSM–DEM) in each night light (NL) pixel. The coordinates are standardized to ESPG 2447 (JGD2000, Japan Plane Rectangular CS V). The mean, standard deviation, maximum, minimum, and number of samples for the height of each building per NL pixel were calculated using Fundamental Geospatial Data. Additionally, building heights were derived for Futsu-Tatemono and Kenrou-Tatemono.
Then, the NL pixels overlapped the land use meshes that occupied more than 50%, more than 60%, more than 70%, more than 80%, and more than 90% of the total building land area and were analyzed, respectively and compared with Google map to investigate the characteristics of the land. Then, we accepted the best-fit building land ratio as the result of this study.
Spatial merging and feature extraction using geopandas 0.8.0
GeoPandas is an open-source project that enables geospatial data manipulation in Python. GeoPandas extends the data types used to enable geospatial manipulation with Pandas. In this paper, we used the Digital Height Model for the entire Hyogo area (2010–2018), masked with the building perimeter frame obtained from the base map information, to extract the nighttime light allocated to it. The data from the SUOMI NPP was used to extract the NL allocated to each of the 23 wards of Tokyo and to extract how much nighttime light was allocated to each building in these 23 wards.
The data in the SUOMI NPP is “created in a 15-second geographic grid [Version 1 VIIRS Day/Night Band Nighttime Lights “README” file].” Note that 1 second angle = 1°/3,600.0. Therefore, the distance between the axes of the longitude and latitude lines is expressed as ddeg = 15.0/3,600.0. Using this, prepare longitude lines at intervals of 15.0/3,600.0 for 60° to 180°, which is the range of the NL data, and latitude lines at intervals of 15.0/3,600.0 for 0° to 75°. Cut the NL data at the pixel that you want to study.
Analysis results
The elevation data of the ground surface and the overlying land surface were obtained with a spatial resolution of 1 m by subtracting the DSM and DEM data published by Hyogo Prefecture during the observation period 2012–2013. Data with either DSM or DEM missing were not used. The data were spatially combined with the perimeter frame data of ordinary and solid buildings in Hyogo Prefecture in 2014. It was extracted from the base map information to obtain the data for buildings only.
Because the spatial resolution of the NL data is 460 × 460 m, we used this unit as 1 pixel. By spatially combining the building data, we derived the number of buildings contained in each pixel and extracted the amount of light from each building in each pixel. Subsequently, when we checked the data on the map, we found that forests and gardens were included in the building data.
Therefore, the building site information was extracted from the land use information, and by spatially combining this information, only the buildings were extracted from the part where the site was selected. After that, the average height of the buildings in the pixel was derived and became the Y-axis measurements. The annual composite value of the number of observations for each month weighted by the number of observations for each pixel in NL VIIRS 2013 was used as the X-axis.
In order to remove data where forests and fields occupied most of the pixel, we restricted the data by the percentage of land used for buildings in the pixel so that we could more accurately analyze the correlation between building height and NL. To find the best correlation between NL and building heights, the percentage of building sites in the pixel was changed to 50% or more, 60% or more, 70% or more, 80% or more, and 90% or more, respectively, and the correlation analysis was conducted.
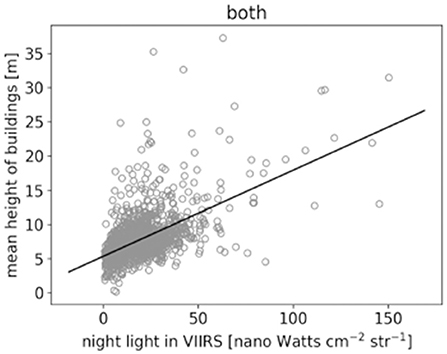
The average height of the buildings in the pixel was derived and placed on the Y-axis, and the annual composite value was placed on the X-axis, weighted by the number of observations in each month for each pixel in NL VIIRS 2013. Figure 2 shows the plots of the pixels with more than 50% of building sites. The data have a linear distribution, but there are some outliers where the average height of the buildings is more than 25 m. It is also clear that the data is mainly concentrated in the area where the average height is <15 meters.
Figure 1 shows 1,769 observations; the slope is 0.126, the intercept is 5.3500, and R-squared is 0.335. The F-stat is sufficiently large, and the prob (F-stat) is close to 0, indicating that the coefficient of the explanatory variable is unlikely to be 0, and the regression equation is meaningful. Both t-statistics are more significant than 2, which means that both coefficients are significant.
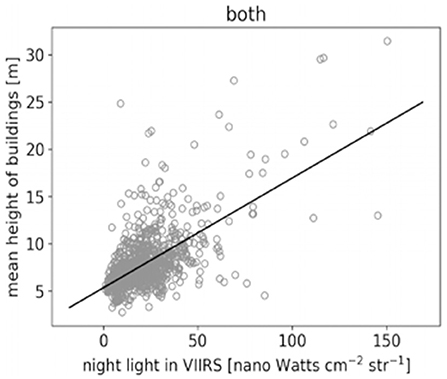
Next, we looked at the plots with more than 60% of the building sites in the pixel (Figure 2). They were scattered linearly, but there were some outliers where the average height of the buildings was more than 25 meters. We also found that the data was mainly concentrated in the area where the average height was below 15 meters. There were 1,470 observations; the slope was 0.1225, the intercept was 5.3791, and R-squared was 0.331. The F-statistic was sufficiently large, and the prob (F-statistic) was close to 0, so it was very unlikely that the coefficient of the explanatory variable was 0, indicating that the regression equation was meaningful. Both t-statistics are >2, which means that both coefficients are significant.
The number of observations decreased, and R-squared also decreased slightly when compared with more than 50% of building sites in the pixel. There is not much difference in the data between the case where the land within the pixel is more than 50% and the case where the land within the pixel is more than 60%.
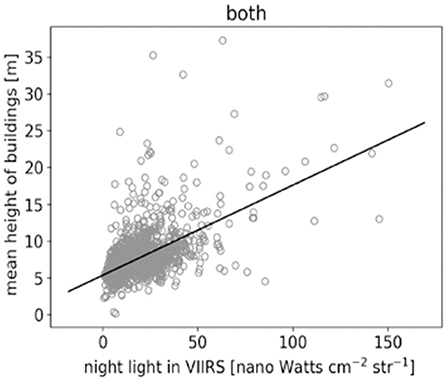
Here is a plot with more than 70% of the building sites in pixels (Figure 3). Similarly, the data is linearly distributed. We also found that the data is mainly concentrated in areas where the average height is <15 meters. The number of observations was 1,028, the slope was 0.1161, the intercept was 5.3668, and the R-square was 0.392.
The F statistic was sufficiently large, and the prob (F statistic) was close to zero, indicating that the coefficients of the explanatory variables were very unlikely to be zero and that the regression equation was meaningful. Both t-statistics were more outstanding than two, and the coefficients were significant. Buildings with >50 or 60% land use had the highest Pixel R-squared values, although the number of data was reduced.
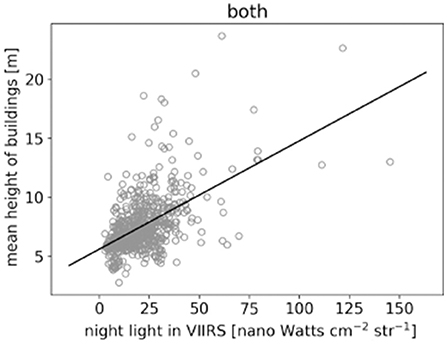
We plot pixels with >80% of building sites (Figure 4). Overall, the distribution is linear. We also see that the data is mainly concentrated in areas with an average height of 15 m or less. The number of observations was 595, the slope was 0.0920, the intercept was 5.5951, and the R-square was 0.290. The F statistic is sufficiently large, and the prob (F statistic) is close to 0, indicating that the coefficient of the explanatory variable is very unlikely to be 0 and the regression equation is meaningful. The t statistics are all above two, and both coefficients are significant.
Comparing the number of building lots in pixels with more than 50%, 60%, and 70% building lots, the observed values decrease, and the R-square decreases significantly; when data with more than 80% of buildings in a pixel is superimposed on a Google map, the data for Kobe City Hall disappears due to the increase in the percentage of residential lots. Data with high building height is critical to see the relationship with NL, and it is challenging to adapt the data with more than 80% of residential land.
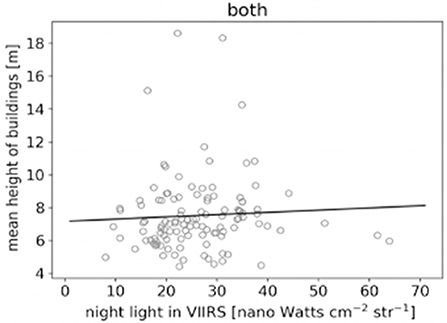
We can see a plot with more than 90% of the buildings in pixels (Figure 5). Overall, the distribution is linear. We also found that the data is mainly concentrated in areas with an average height of 8 meters or less. The number of observations was 116, the slope was 0.0136, the intercept was 7.1641, and the R-square was 0.003.
The F-statistic is sufficiently large, and the prob (F-statistic) is close to 0, so it is very unlikely that the coefficient of the explanatory variable is 0, indicating that the regression equation is meaningful. Both t-statistics are larger than 2, and both coefficients are significant.
The number of observations and the R-squared decreased significantly when comparing the data of more than 50%, more than 60%, more than 70%, and more than 80% of building sites in a pixel. In the case of low-rise buildings such as those in residential areas, the correlation between building height and nighttime light is not significant.
Finally, we extracted and examined the percentage of building sites with a high relationship between building height and nighttime light, looking at the percentage of building sites in a pixel between 70 and 80% (Figure 6). The number of observations was 599, the slope was 0.1185, the intercept was 5.4652, and the R-squared was 0.425. The F-statistic was large enough, and the prob (F-statistic) was close to 0, so it was very unlikely that the coefficient of the explanatory variable was 0, indicating that the regression equation was meaningful. Both t-statistics were >2, which means that both coefficients are significant; R-squared was able to produce the highest results.
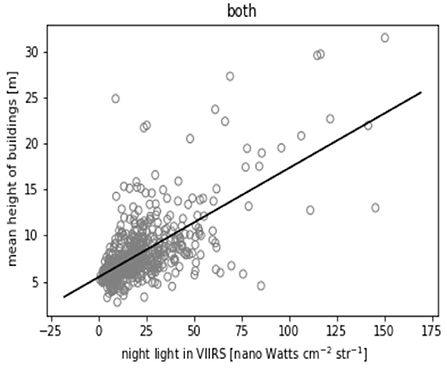
Figure 6. Scatter plot of the night light and building height for land use ratio between 70 and 80%.
Discussion
The correlation between nighttime light and DCM data in Hyogo Prefecture was analyzed by dividing the percentage of land use within one nighttime light pixel into 50%, 60%, 70%, 80%, and 90%. The results show that the best correlation is obtained when the percentage of land use within one pixel is 70%.
As the land use ratio increased, the grid became more dominated by residential areas with many single-family homes. The best results were obtained for between 70 and 80%, except for building coverage ratios above 80%, where residential areas dominate and important landmarks are excluded.
This paper assumes that as building height increases, the number of windows increases, and the amount of light increases. Thus, nighttime light can be a proxy variable for building height. However, in low-rise residential areas, the number of windows is not proportional to height, and a good correlation cannot be found. Thus, light intensity is not proportional to height.
Using the R-square of 0.288 of Henderson and Adam (2012) as a benchmark, this study obtained a good value of R-square of 0.425 for a building coverage of 70%-80%. However, this study was able to show that nighttime lighting correlates with buildings of a certain height but not with buildings with low-height building structures, such as those found in residential areas.
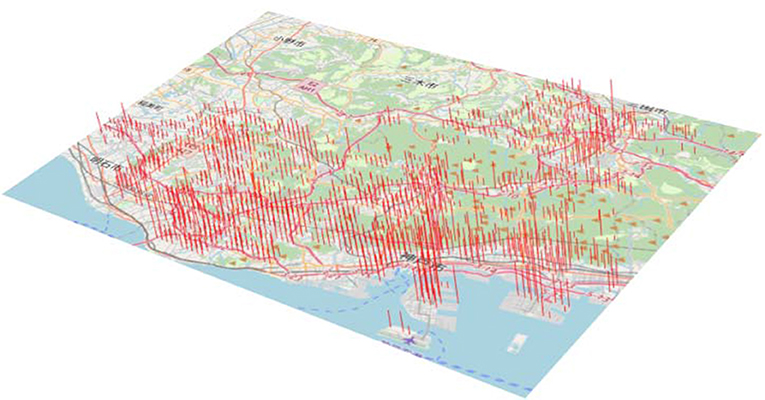
Using the present results, the height of buildings was estimated from the nighttime light in Hyogo Prefecture, and the buildings are depicted in Figure 7. For comparison, Figure 8 uses DSM data to represent actual building heights; in Figure 8, blue, yellow, and red represent taller buildings as they become more elevated. This view shows that the data allows predictions for buildings of a certain height. On the other hand, Figure 7.
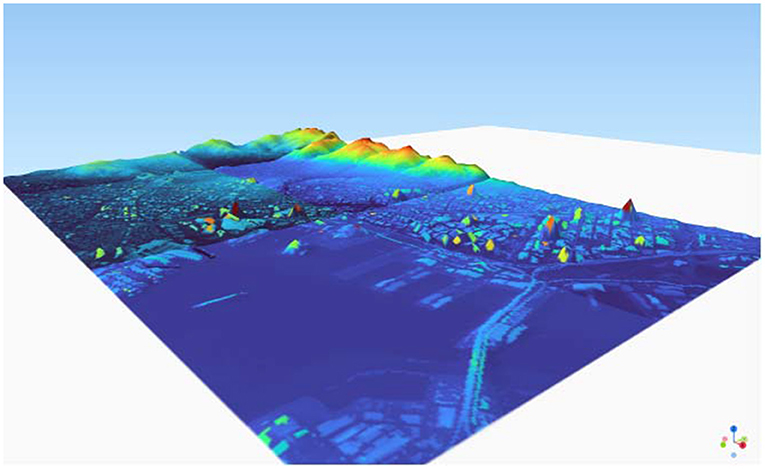
Figure 8. Reproduction of buildings in the vicinity of Sannomiya to Nagata in Hyogo Prefecture from DSM data.
The residential area to the north of Sannomiya, the center of Kobe city, is blank and not represented in Figure 4, indicating that a certain height is necessary to estimate the height of buildings by nighttime light.
The spatial resolution of NL needs to be increased for more accurate estimation. 460 × 460m resolution is still too coarse, so the data currently needs to be corrected by hand, for example, by visually checking buildings on site. It can be expected.
Another possible reason for the low accuracy of the data is the time it took for the satellite to capture the NL. In Hyogo Prefecture, nighttime light was captured for about 2 h a day, which is not enough to capture the lights of the buildings accurately. In addition to using satellite imagery, it is also important to go to the site and understand the differences between the NL data and the satellite imagery to improve accuracy.
Conclusion and future works
This study examines whether nighttime light can be a proxy for building height. Building height is a very important measurement for estimating urban environment and design and for understanding industrial clusters. However, only tall buildings such as landmarks can be obtained from OpenStreetMap. To obtain height data and include low-rise buildings across the country, data would need to be purchased. Another major disadvantage is the difficulty in acquiring time-series data. Time-series data on building heights can be used to visually check changes in municipalities over time and can be applied to a variety of studies.
Therefore, we examined the possibility of using “nighttime lighting data,” which has recently become available free of charge on a detailed time scale, for estimating the height of buildings, which is basically provided for a fee.
Due to the structure of buildings, the number of windows increases in proportion to the size of the building. As the number of windows increases, the amount of light leaking from the building windows at night increases and the amount of light emitted by the building increases. This study focused on this correlation.
If we can correlate NL with building height, we can replace NL with the height of all buildings in the world.
This study obtained a good value of R-square of 0.425 for a building coverage of 70–80%. Calculations were performed for buildings with building percentages of 50, 60, 80, and 90% or more within the mesh, but the most accurate results were obtained for buildings with building percentages of 70% or more within the mesh. When the percentage of buildings in the mesh was 80% or higher, the mesh was more residential and no correlation was observed. This indicates that further work is needed to find a correlation for buildings with a height of about 10–12 m, which is the height of an average Japanese house. Thus, NL was found to have a certain correlation with building height.
The challenge for this study is to test the results in other regions and countries in order to verify the generality of the results of this study. However, Hyogo Prefecture is one of the most suitable regions for this study; we plan to investigate whether there are regional differences in the correlation between NL and building height.
Another major issue to be investigated is the source of nighttime light. Nighttime light is a mixture of various light sources. For example, the light from streetlights reflects off the ground, is dispersed by aerosols, and is very strongly detected in satellite imagery. We consider it a very important task to analyze the spectra received by satellite sensors in order to investigate more precise correlations between buildings and nighttime light. We believe that with further analysis of this spectrum, it will be possible to determine not only the height of buildings from nighttime light alone, but also the outer frames of various objects, such as traffic signals and roads.
Data availability statement
The original contributions presented in the study are included in the article/Supplementary material, further inquiries can be directed to the corresponding author.
Author contributions
GK: concept creation, methodology, drafting, and diagramming. DS: data analysis, peer review, and editing. SK: concept making, peer review, and figure preparation. FI and YY: concept making, peer review, and editing. All authors contributed to the paper and approved the submitted version.
Funding
This research was supported by (Research and Development Project on the Development of Earth Observation System Using Space Technology) of Mori Memorial Foundation.
Acknowledgments
We sincerely thank the members of the GSAIS Empirical Research Group for their various comments and suggestions and for their significant contributions to the completion of the paper.
Conflict of interest
The authors declare that the research was conducted in the absence of any commercial or financial relationships that could be construed as a potential conflict of interest.
Publisher's note
All claims expressed in this article are solely those of the authors and do not necessarily represent those of their affiliated organizations, or those of the publisher, the editors and the reviewers. Any product that may be evaluated in this article, or claim that may be made by its manufacturer, is not guaranteed or endorsed by the publisher.
Supplementary material
The Supplementary Material for this article can be found online at: https://www.frontiersin.org/articles/10.3389/frsus.2022.908822/full#supplementary-material
Footnotes
1. ^See the website of Hyogo Prefecture, http://web.pref.hyogo.lg.jp/kk11/jinkou-tochitoukei/jinnkounouno.html (access 30 march 2022).
2. ^See website, https://www.gsi.go.jp/common/000002047.pdf (access 30 march 2022).
3. ^See website, https://www.gsi.go.jp/common/000195830.pdf (Last view on 30 March 2022).
References
Barr, J., Mizrach, B., and Mundra, K. (2015). Skyscraper height and the business cycle: separating myth from reality. Appl. Econ. 47–2 doi: 10.1080/00036846.2014.967380
Blumenstock, J., Cadamuro, G., and On, R. (2015). Predicting poverty and wealth from mobile phone metadata. Science. 350. 1073–1076. doi: 10.1126/science.aac4420
Chen, X., and Nordhaus, D. W. (2019). VIIRS nighttime lights in the estimation of cross-sectional and time-series GDP. Remote Sens. 11, 1057 doi: 10.3390/rs11091057
Christian, O. (2019). Industrial growth in Sub-Saharan Africa: evidence from machine learning with insights from nightlight satellite images. J. Econ. Stud. 48–8. doi: 10.1108/JES-05-2020-0201
esri Japan. (2021). Coordinate Systems Used in Japan. Available online at: https://www.esrij.com/gis-guide/coordinate-and-spatial/coordinate-system-japan/ (accessed June 22, 2021).
e-Stat. (2021). About this Site. Available online at: https://www.e-stat.go.jp/about (accessed June 22, 2021).
Fundamental Geospatial Data Fundamental Geospatial Data Basic Items. (2021). Available online at: https://fgd.gsi.go.jp/download/ref_kihon.html (accessed June 22, 2021).
Geospatial Information Authority of Japan. (2021). What is GIS… Available online at: https://www.gsi.go.jp/GIS/whatisgis.html (accessed June 22, 2021).
GSI 2. (2021). What can be done with the practical use of geospatial information (JPGIS). Available online at: https://www.gsi.go.jp/GIS/jpgis-wj_about.html (accessed June 22, 2021).
Henderson, J. V., and Adam, D. N. (2012). Measuring economic growth from outer space. Am. Econ. Rev. 102, 994–1028 doi: 10.1257/aer.102.2.994
James, H. (2020). Alternative Economic Indicater. Kalamazoo, MI: W.E. Upjohn Institute for Employment Research. doi: 10.17848/9780880996778
Japan Council for Promotion of Information Sharing on Infrastructures Operation of the G.-Geospatial Information Center. (2021). A Key Infrastructure for the 21st Century - Toward the Distribution and Business Creation of Various G-Geospatial Information from Industry, Government and Academia. Available online at: https://aigid.jp/web/wp-content/uploads/2016/11/geospatial_pressrelease.pdf (accessed June 22, 2021).
Jean, N., Burke, M., Xie, M., Davis, W. M., Lobell, D. B., and Ermon, S. (2016). Combining satellite imagery and machine learning to predict poverty. Science. 353, 790–4. doi: 10.1126/science.aaf7894
Keola, S., and Andersson, M. (2015). Monitoring economic development from space: using nighttime light and land cover data to measure economic growth. World Dev. 60, 322–334. doi: 10.1016/j.worlddev.2014.08.017
Mellander, C., Lobo, J., Stolarick, K., and Matheson, Z. (2015). Night-time light data: a good proxy measure for economic activity?. PLoS ONE. 10:e0139779. doi: 10.1371/journal.pone.0139779
Ministry of Internal Affairs Communications. (2021). Budget of National Statistics (Outline of Expenditure Budget for Statistical Services). Available online at: https://www.soumu.go.jp/toukei_toukatsu/index/seido/3.html (accessed June 27, 2021).
Ministry of Land Infrastructure Transport Tourism. (2021a). Appended Table 1::List of geographical objects [Appended Tables 1-2, 1-3] Available online at: https://www.mlit.go.jp/crd/tosiko/GISguidance/pdf/11.pdf (accessed June 22, 2021).
Ministry of Land Infrastructure Transport Tourism. (2021b). GIS Home Page, National Land Data Download. Available online at: https://nlftp.mlit.go.jp/index.html (accessed June 22, 2021).
Nordhaus, W. D., and Chen, X. (2012). Improved Estimates of Using Luminosity as a Proxy for Economic Statistics: New Results and Estimates of Precision. Cowles Foundation Discussion Paper No. 1857. Available online at: https://ssrn.com/abstract=2030960 or http://dx.doi.org/10.2139/ssrn.2030960 doi: 10.2139/ssrn.2030960 (accessed March 29, 2012).
Keywords: night light data, building height, satellite image analyses, GIS, urban environment
Citation: Kazawa G, Seki D, Keola S, Iwasaki F and Yamashiki YA (2022) Possible correlation between nighttime lighting data and building height. Front. Sustain. 3:908822. doi: 10.3389/frsus.2022.908822
Received: 31 March 2022; Accepted: 03 August 2022;
Published: 31 August 2022.
Edited by:
Alexander Ryota Keeley, Kyushu University, JapanReviewed by:
Changyong Cao, National Oceanic and Atmospheric Administration (NOAA), United StatesMeiqin Che, Nantong University, China
Copyright © 2022 Kazawa, Seki, Keola, Iwasaki and Yamashiki. This is an open-access article distributed under the terms of the Creative Commons Attribution License (CC BY). The use, distribution or reproduction in other forums is permitted, provided the original author(s) and the copyright owner(s) are credited and that the original publication in this journal is cited, in accordance with accepted academic practice. No use, distribution or reproduction is permitted which does not comply with these terms.
*Correspondence: Go Kazawa, a2F6YXdhLmdvdS42MnhAc3Qua3lvdG8tdS5hYy5qcA==
 Go Kazawa
 Daikichi Seki
 Souknilanh Keola
 Fusanori Iwasaki
 Yosuke Alexandre Yamashiki