 Claudio Carbone
 Daniele Ferrario
 Andrea Lanzini
 Stefano Stendardo
 Alessandro Agostini
95% of researchers rate our articles as excellent or good
Learn more about the work of our research integrity team to safeguard the quality of each article we publish.
Find out more
ORIGINAL RESEARCH article
Front. Sustain. , 05 April 2022
Sec. Circular Economy
Volume 3 - 2022 | https://doi.org/10.3389/frsus.2022.809231
This article is part of the Research Topic Circular Carbon Systems and Processes View all 8 articles
Cement industry is estimated to account for ~6–7% of anthropogenic CO2 emissions globally. Therefore, the identification of innovative solutions for their mitigation is both a priority and a challenge. The integration of carbon capture and storage technologies into the industrial production process is considered among the most viable solutions for this purpose, and calcium looping (CaL) represents one of the most promising. A key research challenge points to maximize process efficiencies and minimize production cost to decouple cement production from carbon emissions. The carbon capture process proposed in this work is a looping system where CO2 is absorbed by calcium oxide (CaO) in the first reactor (carbonator) and the calcium carbonate (CaCO3) produced is regenerated in an oxy-fired calciner. During calcination, CO2 is released from the sorbents, purified, compressed, and then made available for geological storage. In this study, greenhouse gas (GHG) emissions related to two cement production systems with CaL carbon capture are evaluated: the tail-end CaL carbon capture and the integrated CaL carbon capture. The carbon footprint is complemented with the assessment of the resources depletion mineral and elements and the demand of primary energy. An eco-design approach was pursued by carrying out a life cycle assessment to identify the environmental hotspots and which CaL integration approach presents a higher potential for cement industry decarbonization. The results of the analysis were compared with a conventional cement production process. The results show that the GHG emissions may be reduced by 74% with a tail-end approach and 71% when the CaL is fully integrated into the cement production process. When a future perspective, with higher penetration of renewable energy resources into the electricity sector, was modeled, the results showed that CaL integrated into the clinker production process is more promising in terms of reduction of the carbon footprint, rather than the tail-end solutions. Primary energy consumption from non-renewables is substantially impacted by CaL, with the integrated CaL configuration showing to be a more efficient solution because of less primary energy consumption (coal).
World cement production has grown steadily in the last decades and represents an energy-intensive industry, which accounts for ~1.4 Gt of CO2 emissions per year, corresponding to roughly 6–7% of global anthropogenic GHG emissions (Zhu, 2011). The cement industry is therefore required to restructure its sector significantly to play a role in mankind's quest to mitigate anthropogenic climate warming.
Cement manufacturing is a complex process that begins with mining, drying, and then grinding raw materials. The main raw material is calcium carbonate (CaCO3) from limestone or marl, which is mixed with oxides of Si, Fe, and Al, and ground to a fine powder, called raw meal. The raw meal is heated to a sintering temperature in a cement kiln where its chemical bonds are broken down and recombined into new compounds. The obtained intermediate product, the so-called clinker, is the main constituent of cement. Clinker is ultimately ground to a fine powder in a cement mill and mixed with gypsum and other additives to obtain cement.
The entire cement production cycle is hard to decarbonize, as only 40% of CO2 emissions are associated with fossil fuel combustion while the major part is due to raw materials calcination in the cement kiln (De Lena et al., 2017). The most common measures in decarbonizing the cement production are clinker substitution (e.g., with granulated blast furnace slag, fly ash, naturally occurring pozzolanas) or use of alternative raw materials (e.g., geopolymer materials) (Zhao et al., 2021); decreasing clinker-to-cement ratio; replacement of fossil fuels with alternative fuels, such as waste-derived fuels; and improvements in energy (thermal and electric) efficiency (García-Gusano et al., 2015). These measures are estimated to enable a reduction of specific emissions per tonne of cement by only 20–25% by 2050 (Hills et al., 2016); even by completely electrifying the production process or switching to clean fuels such as hydrogen, it would be possible to abate solely CO2 emissions coming from the combustion process (Fennell et al., 2021). For this reason, the implementation of carbon capture and storage technologies are considered crucial to deeply decarbonize the cement industry sector (Plaza et al., 2020; IEA, 2021). Different carbon capture technologies have identified to be applicable to the cement industry. They are commonly classified into pre-combustion, post-combustion, and oxy-fuel combustion. Post-combustion and oxy-fuel combustion are preferred as those technologies permit to capture CO2 from the calcination process needed for clinker production. In post-combustion technologies, CO2 removal is obtained by separating CO2 from exhaust gases after fuel combustion and calcination completion. In oxy-fuel systems, combustion takes place in the presence of pure O2 and CO2 is obtained as by-product. The main post-combustion carbon capture technologies applicable to the cement industry rely on absorption (e.g., chemical absorption processes with aqueous monoethanolamine or chilled ammonia), membrane separation, and calcium looping (CaL) (Gardarsdottir et al., 2019; Voldsund et al., 2019). Chemical absorption with amine solution, amine scrubbing, has been extensively studied for industrial applications since 1930 and has already reached commercial-scale demonstration for coal power plants (Ieaghg, 2015; Miyamoto et al., 2017). Furthermore, amine scrubbing will soon reach this milestone even for CO2 capture in the cement industry, and it is therefore considered the benchmark technology for carbon capture (Gardarsdottir et al., 2019; Voldsund et al., 2019). Norway Longship project, the first of its kind in the world, will employ Aker Solutions' Advanced Carbon Capture (ACC) technology, based on a particular amine solvent, to capture 0.4 Mt/year of CO2 from Norcem's cement factory flue gases located in Brevik, Norway. Full operation is expected by 2024 (Plaza et al., 2020).
Implementation of carbon capture can incentivize also the reuse of carbon. Policies on carbon dioxide recycling could help the creation of a market demand stimulating higher value applications (e.g., fuels, polymers, chemical intermediates, aggregates). In the last 10 years, the increasing attention of policy-makers, researchers, industries, and private investors has been reflected in the creation of a global funding for CO2 reuse of ~US$1 billion (IEA, 2019). Indeed, we are in the era of circular economy; the carbon capture processes themselves have to shift from a linear paradigm to a circular one. In circular CO2 capturing processes, the materials used for capturing the CO2, at the end of their life cycle, should be recycled in manufacturing processes making the circular carbon economy even more sustainable.
To this regard, also the European GHG Emissions Trading Scheme (EU ETS) might play a crucial role in incentivizing CO2 reuse and carbon capture technologies. The European GHG Emissions Trading Scheme is the largest cap-and-trade system worldwide and one of the most important European climate change mitigation policies in place. Its environmental effectiveness depends on the stringency of the overall emissions cap (Demailly and Quirion, 2008). To achieve the EU's overall greenhouse gas emissions reduction target for 2030, the sectors covered by the EU ETS must reduce their emissions by 43% compared with 2005 levels. Therefore, the overall volume of greenhouse gases that can be emitted by power plants, industry factories, and aviation sector covered by the EU ETS is limited by a cap on the number of emission allowances. Within the cap, companies receive or buy emission allowances, which they can trade as needed. The cap decreases every year, ensuring that total emissions fall. Each allowance gives the holder the right to emit 1 tonne of CO2, or the equivalent amount of other powerful greenhouse gases, nitrous oxide (N2O) and perfluorocarbons (PFCs). Since the beginning of phase 3 of the EU ETS (2013–2020), the cap on emissions is set for the EU as a whole. Phase 4 of the EU ETS (2021–2030) entails that the cap on emissions continues to decrease annually at an increased annual linear reduction factor of 2.2% [Climate Action (EU ETS), 2022]. The cement industry sector is one of the most exposed among those covered by the EU ETS since it is both highly CO2 intensive and relatively open to international trade. Over the last 2 years, the cost of CO2 emission credits has steadily increased from a fairly stable price of around €5–10/tCO2 (2013–2017) to €96/tCO2, reported in February 2022. The high costs achieved could impact marginal abatement and new decarbonization policies in this industrial sector, in particular favoring the market penetration of carbon capture technologies.
The CaL process is therefore a good candidate for stimulating both CO2 market and circular economy as it uses a calcium-based material that can be reused in different industrial processes when its CO2 uptake decreases. This technology represents one of the most promising processes for decarbonization of power production and carbon-intensive industry. CaL, being based on the use of solid materials, fits particularly well in cement plants as they have the technologies and infrastructures for handling solid materials and can recirculate spent materials in the clinker production processes or reused as flux in steel- and iron-making processes. This feature of the CaL is complemented with the reuse of captured CO2. CaL process is characterized by a very high emission abatement potential, and it is based on the reversible carbonation reaction between calcium oxide (CaO) and CO2 at high temperatures (Abanades et al., 2015).
CaL was originally proposed by Shimizu et al. (1999) and it is normally constituted by two fluidized-bed reactors: a carbonator and a calciner. In the carbonator, operating at ~650°C, CO2 is exothermically combined with CaO. The solid stream rich in CaCO3 exiting the carbonator is then sent to a further reactor called calciner operating at around 900–950°C, where CaCO3 is split into CaO and CO2 according to the so-called reverse calcination reaction.
Thermal energy needed by the endothermic calcination reaction is supplied with oxy-combustion of fossil fuel to obtain a high-purity CO2 stream, with coal being normally used in cement industry applications. Because of high operating temperatures of the system, part of the additional heat generated during calcination can be recovered and used to produce electricity.
The calciner is also supplied with a continuous make-up of limestone to replace the sorbent that is purged from the CaL to (1) avoid build-up of coal ash and CaSO4 originating from the reaction between CaO and SOx, and (2) keep a proper activity of the sorbent, which decreases with the number of carbonation–calcination cycles. To this regard, the purged material can be conveniently used as raw material in the cement plant for clinker production, reducing costs and emissions related to the limestone supply chain. The level of improvement strongly depends on the proportion of spent sorbent utilized in clinker production. Since the application of CaL is one of the most promising techniques for the decarbonization of cement production, numerous studies have addressed the topic in the past. Recently, after being demonstrated by multiple pilot projects (Chang et al., 2014; Arias et al., 2017), CaL technology has reached TRL 7 and it is considered ready for larger scale demonstration (Jordal et al., 2017), although there is still a research gap to be fulfilled to identify the most viable and efficient solution for CaL integration. During the CEMCAP European project, CO2 capture from cement plants equipped with different technologies was addressed. Regarding CaL integration into the production process, the CEMCAP project, which ended in 2018, carried out detailed energy and economic analyses of the two main possible configurations, namely “tail-end CaL” and “integrated CaL” (De Lena et al., 2017, 2019).
Despite the large interest in this technology, in literature there is a lack of comprehensive studies reporting LCA or carbon footprint estimates regarding the environmental impacts avoided by integrating a CaL system into a cement plant. Rolfe et al. (2018) presented results obtained through LCA analysis concerning the application of CaL as an end of pipe carbon capture process: CO2 emissions and the primary energy demand were compared for three scenarios—the base case cement plant without CO2 capture, cement plant with integrated CaL, and oxy-fuel cement plant. They concluded that the CaL unit had a lower environmental impact than the oxy-fuel combustion, with 0.71 t CO2/tclinker and 3.31 GJ/t CO2, of specific CO2 emissions avoided and of specific energy consumption, respectively. Schakel et al. (2018) investigated the environmental impacts in terms of CO2 reduction due to CaL integration into cement plants by using different fuels (coal, natural gas, woody biomass, and a fuel mix), focusing on tail-end CaL applied to the clinker production at a cement plant in North-western Europe. This solution is proposed to counteract the additional coal consumption related to CaL. Results showed potential advantages of using natural gas or biomass instead of coal to drive tail-end CaL process in terms of CO2 emissions and energy consumption.
The present work represents the first LCA study that compares the two main CaL integration configurations. We focused on the evaluation of the carbon footprint as a consequence of the application of the CaL process into state-of-the-art plants, which are representative in size and type of common European cement plants. Two main configurations, “tail-end CaL” and “Integrated CaL,” are investigated. In the first option, the CaL is not deeply integrated with the clinker production process, but it is operated as end-of-pipe solution, while the latter is characterized by a full integration of the CaL system into the cement production chain. The key idea of this solution relies on switching the pre-calciner of the cement plant to oxy-fuel mode, so that it can be reused to regenerate the CaL sorbent. In addition to the carbon footprint, the resources depletion, both in terms of minerals and elements and primary energy demand, are assessed to identify potential trade-offs.
An environmental LCA was performed to evaluate the performance in terms of carbon footprint and resources depletion of different scenarios for a selected cement production process. Figure 1 exemplifies the methodological approach adopted in this study. The data needed to run the LCA analysis were obtained combining results from process simulations with commercial datasets (Ecoinvent, 2020) to fully account for all the relevant aspects involved. Aspen Plus software was used to carry out the process simulations. According to the international standard (“ISO 14040:2006,” 2006b; “ISO 14044:2006,” 2006) LCA was then performed and structured in 4 phases: goal and scope definition; life cycle inventory (LCI); life cycle impact assessment (LCIA); interpretation.
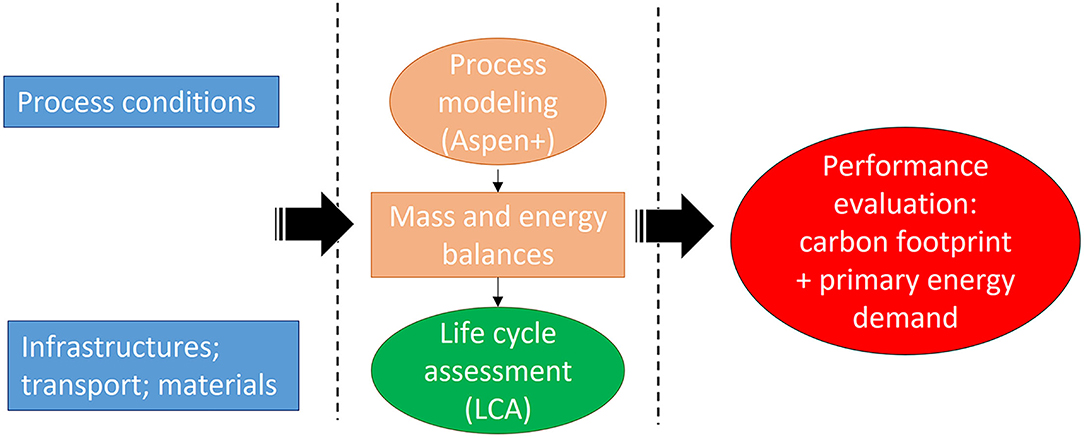
Figure 1. General methodological approach.
The mass and energy balances were estimated for three plant configurations: a conventional cement plant, a cement plant retrofitted with tail-end CaL, and a cement plant retrofitted by integrating CaL into the clinker production. The three case studies, described in more detail in the following three subsections, were modeled by adopting the commercial software ASPEN Plus v10.0. The main process units of the three systems, the clinker kiln, the CaL system, the CO2 compressors, and the steam Rankine cycle, were modeled with one or more Aspen Plus blocks. The reactions occurring in the clinker kiln pre-calciner and rotatory kiln, and in the CaL carbonator and calciner were simulated with standard models based on the minimization of Gibbs energy. The cyclones of the preheating tower and the CaL were modeled with fixed solid separation efficiencies. Power consumption for the CO2 compression was obtained considering 2 multi-stage inter-refrigerated compressors. Power production was modeled considering a simple steam Rankine cycle composed by a pump, a steam generator, a condenser, and a single-stage steam turbine.
The cement production characteristics of the benchmark system were based on the Best Available Technique (BAT) standard reported in the European BREF document for the manufacture of cement (Schorcht et al., 2013). In the state-of-the-art cement plant, limestone is first ground with clay and other minor components to form a blend with suitable composition, called raw meal. The composition of raw meal considered in this study is reported in Table 1.
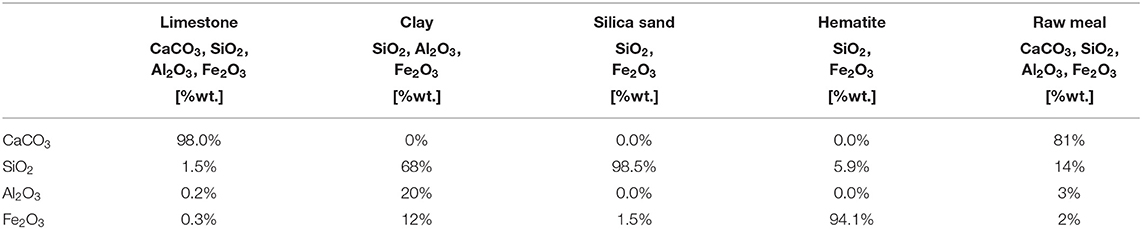
Table 1. Raw meal composition considered as input to the clinker production process.
This minerals mix is then fed to a particular kiln where clinker is produced. According to the BAT, the reference clinker kiln is further composed by a preheater, a pre-calciner, a rotatory kiln, and a clinker cooler. In the preheater, the raw meal is pre-heated in a series of 5 vertical cyclones by contact with the hot kiln exhaust gases that are recirculated.
At the bottom of the preheater, in the calciner, almost all the limestone, around 94% (De Lena et al., 2017), is calcinated to form lime, releasing CO2. The pre-calcined meal is then heated in the rotatory kiln to reach a sintering temperature, around 1,450°C, forming clinker. In this process unit, the calcination is completed, and the CaO reacts with silica, alumina, and iron oxides, to form the main components of clinker: (1) dicalcium silicate or belite (Ca2SiO4, symbolic notation in cement chemistry: C2S); (2) tricalcium aluminate (Ca3Al2O6, symbolic notation in cement chemistry: C3A); (3) tetracalcium alumino-ferrite (Ca4Al2Fe2O10, symbolic notation in cement chemistry: C4AF); (4) tricalcium silicate or alite (Ca3SiO5, symbolic notation in cement chemistry: C3S) (Atsonios et al., 2015). The thermal energy required in the calciner and rotatory kiln to heat the minerals and to carry out the reactions is usually obtained with the combustion of fossil fuels (typically coal) or alternative fuels. In this study, use of coal is assumed. At the rotary kiln outlet, the clinker is rapidly cooled down by venting ambient air, which is consequently heated and then recovered to be used for coal combustion. As a final step, the cooled clinker is mixed with gypsum and other correctives and ground into a powder, to produce Portland cement. The still hot flue gases exiting the preheater are often used to supply heat to the raw meal mill and are finally released into the atmosphere. A simplified illustration of the process is shown in Figure 2. In this study, mass and energy balances were built for a typical clinker kiln producing 2,825 tclinker/day, a clinker–cement ratio of 0.737, and a raw meal–clinker ratio of 1.55, with an estimated energy consumption of 121 kgcoal/tclinker and 132 kWhel/tclinker.
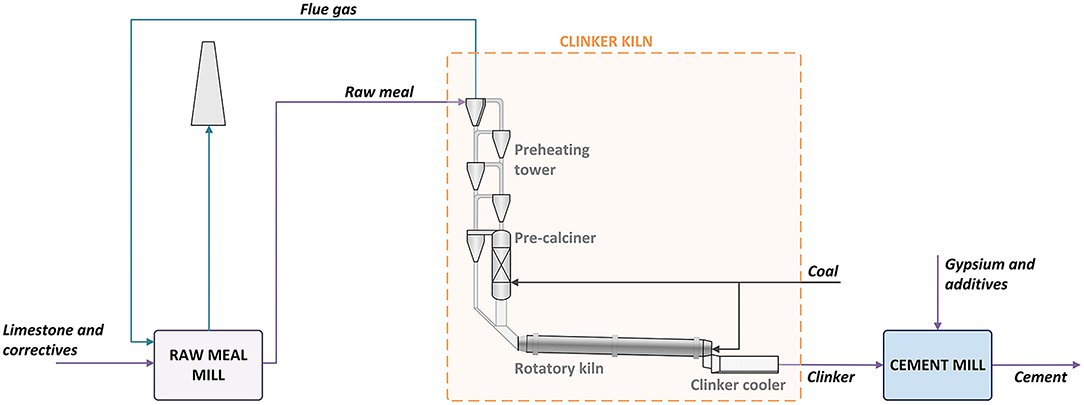
Figure 2. Conventional cement production process.
A schematic of the cement plant equipped with the tail-end CaL process is shown in Figure 3. In this configuration, the CaL system, characterized by two interconnected circulating fluidized bed reactors, is placed between the preheating tower and the raw mill (Spinelli et al., 2017). Flue gases exiting the preheater tower are sent to the carbonator where CO2 capture takes place. These flue gases from the carbonator, which have a reduced CO2 flow rate and a temperature of around 650°C, are cooled to 430°C, according to the requirements for the raw meal drying process. The output is a solid flow, constituted by CaO and CaCO3, formed during the carbonation process, which is subsequently sent to the calciner, where coal is burned with oxygen to generate the heat required for sorbent regeneration. In this process step, a working temperature of 920°C is assumed, corresponding to 35–40°C above the reaction temperature at equilibrium, which is considered sufficient for complete calcination (Hawthorne et al., 2009; De Lena et al., 2017). The sorbent outflowing from the CaL process can be fed to the cement kiln to partially replace the raw material supplied as input. However, it is important to consider that the average size of raw meal particles is normally in the range of 10–20 μm, while fluidized bed reactor typically operates with larger particle sizes of around 100–200 μm. Therefore, the CaL purge needs to be mixed and furtherly milled with fresh raw material constituents in the raw meal mill, to be recycled and reused as input. The ratio between the limestone fed to the CaL process and the total amount of limestone fed to the cement plant is defined as integration level (IL).
The value of IL strongly influences the mass and energy balance of the system. In particular, as shown by De Lena et al. (2017, 2019), at higher values of IL the total coal consumption of the system decreases and the global energy performance seems to increase. On the other hand, the amount of power produced through the associated steam Rankine cycle decreases, leading to a net reduction in the amount of indirect CO2 emissions avoided. Furthermore, from a retrofitting point of view, De Lena et al. (2017) also evidenced that operational efficiency of a pre-existing cement kiln should not be affected by the integration of a CaL system in case of low integration levels, while, at high integration levels, key parameters, such as gas flow rate and velocity in the pre-heating tower, may be substantially modified, thus, consequently, requiring to fine-tune the configuration design of the existing plant.
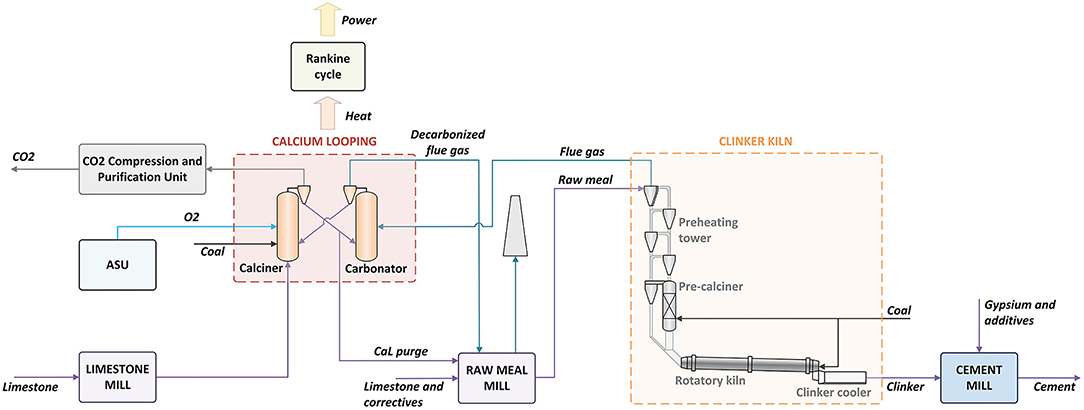
Figure 3. Calcium looping tail-end configuration.
To account for this phenomenon, the tail-end configuration of the system considered in this study assumes relatively low integration levels (i.e., IL = 20%) and a ratio of CO2 capture efficiency from the flue gas (Ecarb) of 90%. Ecarb can be obtained from the reactor mass balance as a function of the molar flows of CO2 (FCO2) and CaO (FR) entering the carbonator.
Where Xave represents the average fraction of active CaO reacting with CO2 to form CaCO3. For a typical end-of-pipe application with fluid bed calciner and carbonator, the value of Xave can be calculated as follows (Abanades et al., 2005; Zhai et al., 2016):
Where F0 is the molar flow rate of fresh sorbent, FSOx is the molar flowrate of SOx stream produced by coal combustion in the calciner, and FR is the molar flow rate of sorbent entering the carbonator. The values for fm and fw parameters are, respectively, set at 0.77 and 0.17.
Xave and FR were calculated according to Equations (4) and (5); FCO2, Ecarb, and F0 are determined by IL value. The fraction of sorbent purged, i.e., 3.4%, is thus obtained from the mass balance of the CaL system.
The oxygen used at the CaL calciner is supplied by means of an air separation unit (ASU) that produces a 95% pure oxygen with an electric consumption of 226 kWh/tO2 (De Lena et al., 2017). Part of the gas stream enriched in CO2 is recirculated back to the calciner to be used as temperature moderator, reducing the oxygen concentration of the oxidant stream by 50% of volume. The CO2 stream produced by the CaL process achieves a purity of around 90% by volume (dry basis) and needs therefore to be sent to a compression and purification unit (CPU) to reach the pressure and purity requirements for its proper transportation and storage. The energy consumption of this unit was modeled as electricity consumption for gas compression.
The heat recovered from the CaL process is assumed to be used to produce electricity in a superheated steam Rankine cycle. Input turbine temperature and pressure are assumed to be 530°C and 100 bar, values typical for Rankine cycles used for waste treatment plant, that have similar size, in terms of heat load and turbine power production, to the ones estimated for application to tail-end CaL (De Lena et al., 2017). In the estimations of heat recovery, the following heat sources were considered:
• Carbonator, where the heat produced by the exothermic reaction need to be removed to maintain the reactor working temperature at 650°C.
• Decarbonized flue gas, which exit the carbonator at 650°C and can be cooled down to 430°C before being sent to the raw meal mill where they are used to heat and dry the minerals.
• Purge sorbent, which exit the calciner at 920°C and assumed to be cooled down to 120°C before being sent to the raw meal mill, where it is mixed with the other minerals.
• CO2-rich stream, which exit the calciner at 920°C. This stream is cooled down to 400°C and then part of the flow is mixed with the oxygen to be recirculated back to the calciner, while the rest is cooled down to 80°C and sent to the CO2 purification and compression unit. Part of the heat is reused internally to preheat the oxygen from ambient temperature to 150°C.
A scheme of the integrated CaL configuration, the same proposed by De Lena et al. (2019), is shown in Figure 4. In this configuration, the CO2 sorbent used in the carbon capture process is the same raw meal fed to the clinker kiln and the system presents a single oxy-fuel calciner working both as cement kiln pre-calciner and CaL calciner (Spinelli et al., 2017). This process is characterized by an intrinsic value of IL of 100%. As regards the CaL reactor type, entrained flow reactors operating in the dilute pneumatic transport regime are preferred over fluidized beds because of the small particle size of the raw meal. For this kind of application, therefore, the mass and energy balance of the CaL system, FR and the fraction of sorbent purged, were estimated from Equation (4) assuming a Xave of 0.2.
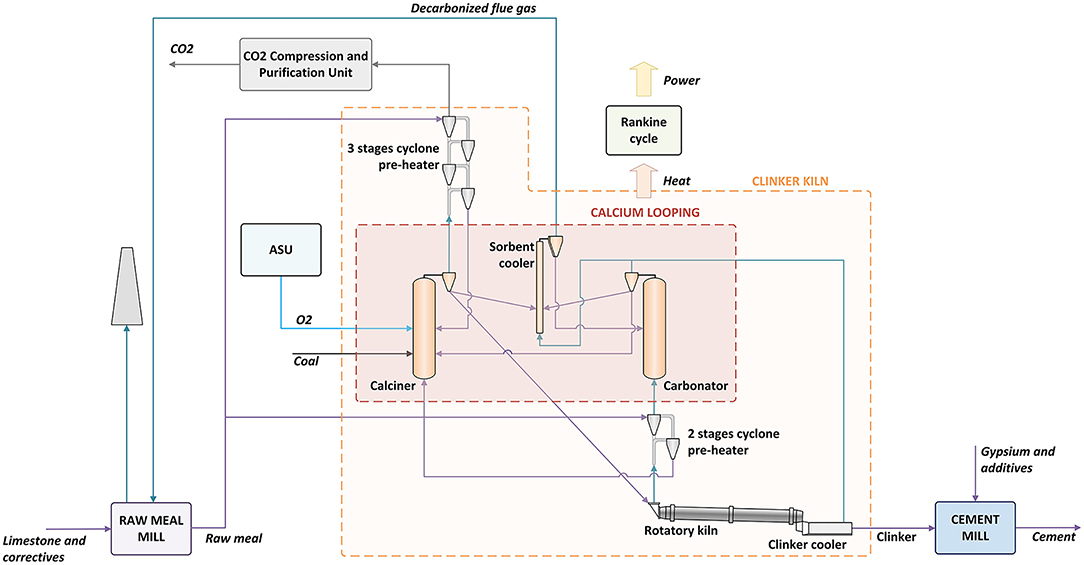
Figure 4. Calcium looping integrated configuration.
In this configuration, the 5-stage preheating tower is divided into a 2-stage preheater and a 3-stage pre-heater. The flue gas coming from the rotatory kiln is cooled down with raw meal into the 2-stage preheater before being sent to the carbonator, with an estimated CO2 capture efficiency of 80%. The amount of raw meal fed to this system unit is fine-tuned to keep the reactor working temperature at 650°C. The carbonated sorbent is divided into two parts; 30% is sent to the calciner while 65% is sent to the sorbent cooler to be recirculated into the carbonator itself. The residual amount is entrained with the decarbonated gases. The recirculation of internal sorbent increases the residence time of the particles in the reactor and therefore the average sorbent conversion (Spinelli et al., 2018; De Lena et al., 2019).
Likewise, in the tail-end CaL, coal is burned with oxygen into the calciner to provide the heat required for the calcination reaction. The calcined raw meal is in part sent to the rotatory kiln for clinker production (42%), in part sent to the sorbent cooler, and then to the carbonator (53%). The remaining part is entrained by CO2-rich gas. To modulate the sorbent temperature in input at the carbonator, a sorbent cooler reduced the temperature of solids entering the carbonator to 214°C (De Lena et al., 2019).
In the integrated CaL configuration also, a large amount of waste heat from CaL is recovered through a superheated steam Rankine cycle. In this case, however, the size of the Rankine cycle, in terms of heat load and power production, is smaller with respect to the tail-end CaL; the steam turbine input conditions of temperature and pressure were set, respectively, at 65.2 bar and 460°C, leading to smaller power generation efficiency, according to (De Lena et al., 2019).
The main goal of this study is to quantify the carbon footprint associated with a cement plant and the potential direct and indirect GHG emissions avoided by the application of the CaL CO2 capture at the tail end of the clinker production or integrated within the calcination process. The lifetime of the system is assumed to be 50 years, and different process units are considered to be replaced in due time (e.g., units with a lifetime of 20 years were counted 2.5 times). The system function is the production of cement, and the functional unit is 1 kg of cement at cement factory gate. The boundaries of the assessment were therefore set from cradle to gate. The phases of raw meal and fuel supply, construction, and operation of the plant were analyzed. Transport, storage, and use of the pure CO2 captured were not considered.
To allow for an improved understanding of the parameters most impacting in terms of carbon footprint, the systems were split into sub-systems, as follows:
Conventional (C1): supply transport and preparation of raw meal fed to the plant (raw meal); calcination and clinker production (clinker); cement production (cement).
Tail-end CaL (C2): supply transport and preparation of raw meal fed to the plant (raw meal); calcination and clinker production (clinker); cement production (cement); Rankine cycle; CO2 compression unit (CO2 CU); oxygen supply by an air separation unit (ASU); tail-end CaL (CaL).
Integrated CaL (C3:): supply transport and preparation of raw meal fed to the plant (raw meal); calcination and clinker production integrated with a CaL process (clinker + CaL); cement production (cement); Rankine cycle; CO2 compression unit (CO2 CU); oxygen supply by an air separation unit (ASU); tail end CaL (CaL).
The carbon footprint is complemented with the assessment of the resources depletion mineral and elements and the demand of primary energy.
LCI involves a systematic inventory of the input and output of energy and material flows during the entire life cycle and was compiled by coupling our data obtained from process simulations (mass and energy balance) with the most similar technology/process/material datasets available in the commercially available background database (Ecoinvent, 2020). The models of the three case studies analyzed were built as a function of the relevant subsystems.
The full inventory data including input, output, and detailed assumptions, organized in subsystem, and the specific phase of the process considered are reported for the three scenarios as supplementary information (Supplementary Tables S1–S3).
It is noticeable that electricity produced by the heat recovery steam cycle (Rankine) is mainly used for the operating activities of the plant (i.e., movement, grinding, and milling of the raw materials); therefore, the values reported refer to the net electricity produced. This means that the reuse of the waste heat was modeled in LCA analysis as avoided impacts from power production [i.e., the Italian Electricity Mix (EM) or a mix of Wind and Photovoltaic (W+PV)]. Table 2 summarizes the key process parameters considered for the three systems modeled for the LCA analysis.
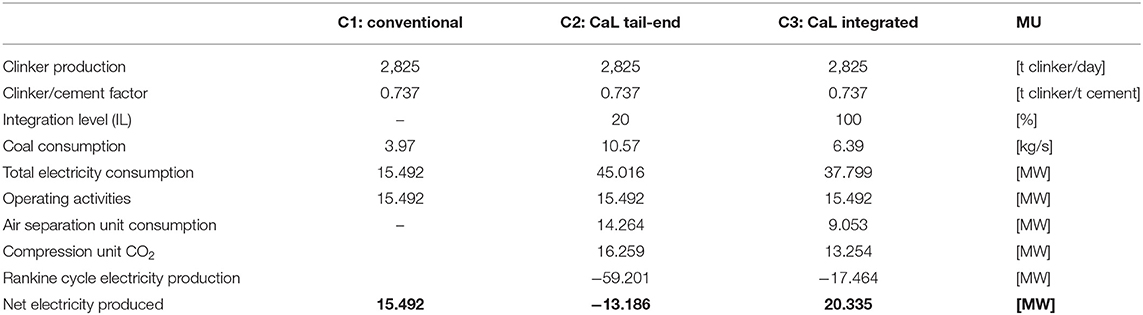
Table 2. Key process parameters of the three modeled systems.
The materials and energy flows identified in the life cycle inventory phase were categorized and assigned to the relevant impact category using the software GaBi (GaBi, 2021). The evaluation is at mid-point (i.e., the emission to the environment are quantified, not the impact at the end-point). The assessment method adopted is the International Life Cycle Data system—ILCD (JRC European Commission, 2013) recommended methods for global warming—GWP100 IPCC AR5 and GWP20 IPCC AR5. Also, resources depletion (environmental footprint EF 3.0) and primary energy demand (technical quantity) from non-renewables were evaluated to investigate the effects associated to additional raw materials and energy (electricity and heat) requirements for the CaL and Rankine cycle integration.
The metric used to measure climate change is Global Warming Potential with 100 years' timeframe (GWP100) and 20 years' timeframe (GWP20). The evaluation of GWP100 and GWP20 accounts for long-lived and short-lived climate forcers, both driving important effects on climate, but these occur on very different timescales. Short-lived climate forcers like CH4, ozone, and aerosols have a relatively shorter atmospheric lifetime (days to decades) than long-lived climate pollutants (CO2), and short-term effects on the climate system. This means that their presence in atmosphere drops rapidly after emissions cease, with a noticeable effect on global temperature within the following decades. In contrast, CO2, chlorofluorocarbons, and N2O have a long lifetime, so the majority of the climate benefits will take many decades to be seen after the reductions. The implementation of measures/technological solutions to mitigate short-lived climate forcers are fundamental to slow the rate of climate warming and improve the chances of staying below the 2°C target in the near term, while longer-term climate protection are pursued by realizing deep and persistent cuts in CO2 emissions (United Nations Environment Programme, 2011; Fu et al., 2020). In our evaluations, we have therefore included the estimation of GWP20, besides the more common GWP100, to provide hints on the impacts of the technologies analyzed is a relevant timeframe for climate change mitigation.
Figure 5 shows GHG emissions (GWP100) of the reference case and the CaL systems modeled in relation to the different phases and types of the processes considered. The reference system (C1) emits 0.98 kg CO2eq per kilogram of cement produced. Clinker production is the main contributor, accounting for 89% of total GHG emissions. Most emissions are therefore associated with the combustion of fossil fuel (coal) and the calcination of CaCO3 and other raw materials (Table 1). They are fed to the five-stage cyclone pre-heater and the rotary kiln, where, at high temperature, CaCO3 and, to a lesser extent, MgCO3 are decomposed into CaO and MgO, respectively, releasing CO2. At the same time, the remaining 11% are mostly due to cement production, which consists of grinding in a mill the clinker with variable quantities of calcium sulfates (gypsum), typically 0.05 t per tonne of cement (Schorcht et al., 2013), to obtain the desired cement quality. Other materials may be added (e.g., limestone, blast furnace slag, fly ash, natural or industrial Pozzolan materials) to further regulate the hardness properties of the final product. This final phase generally requires only electricity and absorbs ~38% of the electricity required by all activities throughout the entire production cycle of the plant (Cement Sustainability Initiative, 2017). To be noted, in our model the net electricity produced by the Rankine cycle associated with the CaL reported in the clinker production process is also used in the cement production process. The choice of the grinding system is driven by the type of cement to be produced. In this study, a typical vertical roller mill was considered as it enables the addition of significant amounts of minerals and it is identified as the most efficient technology, being characterized by an electricity consumption of ~7–8 kWh per tonne of treated material (Madlool et al., 2011; Cement Sustainability Initiative, 2017), much lower than the typical 14–15 kWh/t of ball mills.
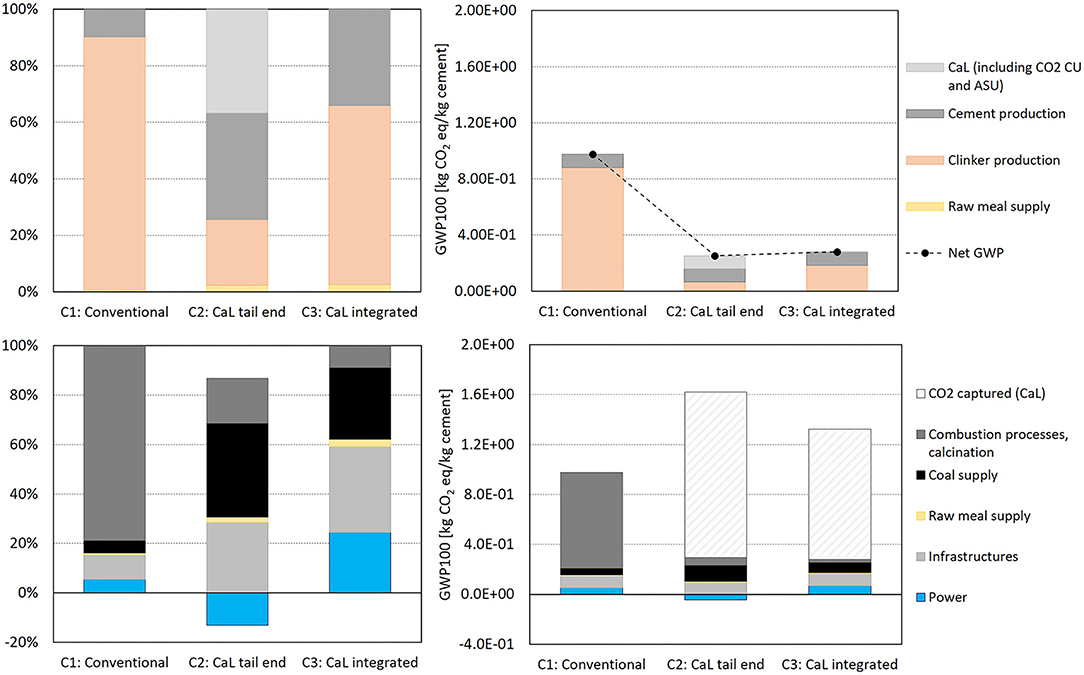
Figure 5. GWP100 contribution analysis and relative emissions of the systems analyzed per kg of cement produced by the different phases (upper panels) and type of processes (lower panels) of the entire cement production cycle.
The addition of CaL reduces the net GWP100 by 74 and 71% for the tail-end (C2) and integrated (C3) configurations, respectively. Therefore, the CaL process captures most of the direct CO2 emissions deriving from calcination and combustion processes (1.33 and 1.04 kg CO2eq per kg of cement produced for C2 and C3, respectively), despite the use of additional coal (which increases by 166 and 61%, in C2 and C3, respectively). In the CaL process, the regeneration of the CO2 sorbent during calcination requires a considerable amount of thermal energy, which is obtained from coal combustion, leading to an increase in fuel consumption with respect to C1. However, this increase is counterbalanced, in terms of kilograms CO2eq, by the CO2 captured from the exhaust gas line and the recovery of thermal energy converted into electricity through the Rankine cycle. One of the inherent advantages of this carbon capture technology is indeed that, chemical energy (coal) introduced into the calciner, can be recovered into electricity at high efficiency to be reused in the electrical energy–intensive steps, such as the mechanical treatment for grinding and leveling out materials to the proper particle size. GHG emissions associated with the reference case and the two CaL configurations are in good agreement with two studies presenting LCA results of cement production with and without tail-end CaL (Rolfe et al., 2018; Schakel et al., 2018). Schakel et al. presented further improvements by integrating tail-end CaL by using alternative fuels instead of coal.
Figure 5 also shows GWP100 reporting the net contribution of the Rankine cycle. The electricity used in the air separation unit (ASU) for oxygen production, CO2 compression, and purification (CO2 CU), and for the mechanical treatment of materials, was subtracted from the electricity produced. The Italian electricity production mix from 2017 (Ecoinvent, 2020) was considered as replaced. It is noticeable that the net GWP100 is lower for C2 than C3, despite the increase in coal consumption. Indeed, this is attributable to the Rankine cycle, which displaces grid electricity use and, in C2, the power produced exceeds the internal need for plant activities, which can therefore be potentially exported. The GWP associated to this process (power generation) is therefore intended as a negative contribution.
The main difference in terms of GWP between C3, where the CaL is integrated into clinker production, and C2, where C2 is added as an end-of-pipe technology essentially, resides in a different distribution of emissions. Given its highly integrated configuration, the C3 direct CO2eq emissions related to the clinker production are reduced by 45% with respect to C2. This comparison was performed for C2, grouping together clinker production and CaL process, while for C3, including only clinker production (as in C3 the CaL process is integrated into clinker production and consequently its inputs and outputs are modeled in the same block plan of Gabi tool). This result reflects that the integrated calcination generates fuel consumption savings, thus leading, for C3, to a smaller energy consumption per CO2 avoided.
The addition of CaL to the production chain determines an increase in emissions associated to the use of fuel and infrastructures, by 158 and 64%, in C2 and C3, respectively, but it is well-counterbalanced by the CO2 capture by means of the calcium-based sorbent.
Figure 6 shows the GHG emissions from the same systems but with a different metric, GWP20. The aim is to consider the short timeframe available for mitigating climate change. In particular, the GWP20 is useful to understand the impact of CH4 emissions, which is a powerful GHG with a relatively short atmospheric lifetime of ~12.4 years. According to IPCC AR5 (the same method used in GaBi) and including all halocarbons and the associated climate-carbon feedback, the GWP of CH4 is in fact 36 times that of CO2 for a 100-year time horizon, while it has a GWP 87 times higher than that of CO2 over a 20-year period (IPCC, 2016). In the cement production cycle, CH4 emissions are mostly attributable to fugitive emissions from coal mining. Indeed, in Figure 5, the contribution analysis shows that GWP20 presents higher proportions for coal supply with respect to GWP100. Coal supply accounts for 66 and 44% of GWP20 in C2 and C3, respectively. It is noticeable that the increased use of coal has a higher impact if we consider a shorter timeframe for climate change (GWP20 vs. GWP100), while the total GHG emissions result as being almost the same for both CaL configurations.
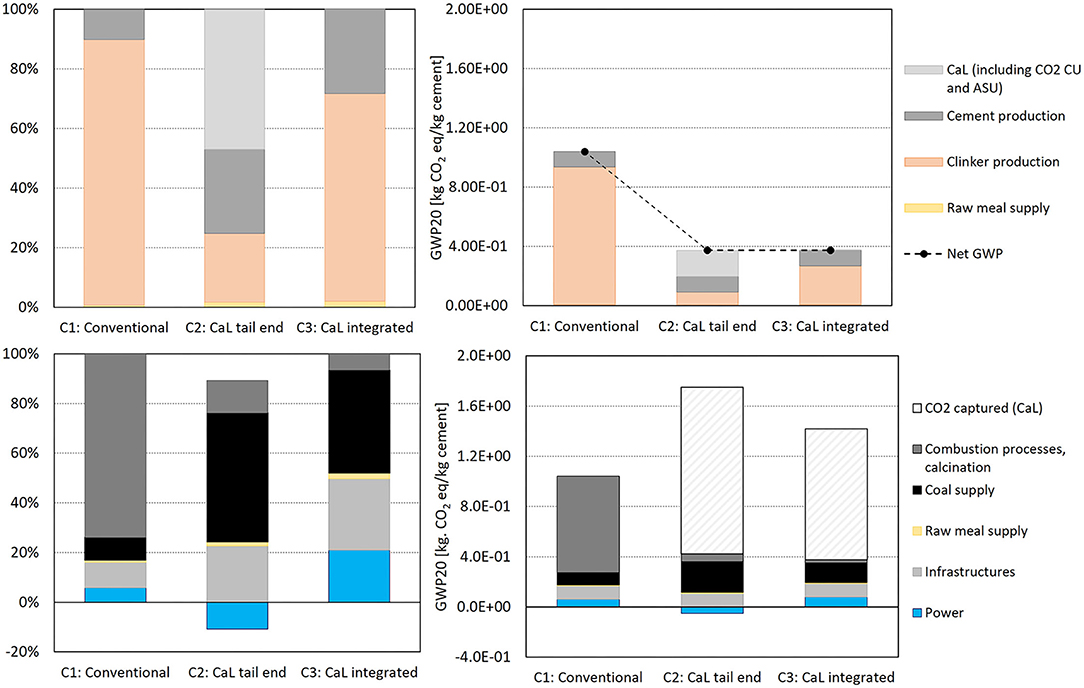
Figure 6. GWP20 contribution analysis and relative emissions of the systems analyzed per kg of cement produced by the different phases (upper panels) and type of processes (lower panels) of the entire cement production cycle.
Resources depletion is split into two different indicators: Resource depletion—Minerals and Metals (now based on ultimate reserves) and Resource depletion—Energy Carriers (based on fossil resources). Regarding the consumption of minerals and metals, the impacts are not plotted as they are mostly (>96%) attributable to the cement factory (Ecoinvent), which is characterized by the same materials and energy flows for the three systems analyzed, thus not presenting any substantial variation. In fact, the raw material are rather common minerals that have a very limited impact on a metric based on scarcity, while the elements used for the steel in the infrastructure are definitely scarcer, and therefore determine the results. The impacts in terms of energy consumption that is based on fossil resources depletion are presented in the next section in terms of primary energy demand from non-renewables.
A limitation of this study is that fly ash generated from calcination and combustion processes are assumed to be entirely collected and used in cement production, thus the consequent potential detrimental environmental impacts are not evaluated. Although their reuse in the cement production phase can be considered plausible, this particulate material enriched in heavy metals and other toxic waste can be partially released into the environment, in terms of toxic waste and of emissions of primary and secondary atmospheric particulate matter into the atmosphere, thus affecting human toxicity potential. Further studies are recommended with the aim of better characterizing those leaching/emissions and other potentially important environmental impact categories. This aspect could be crucial as the main gaseous or solid pollutants, affecting climate change and human health, are mostly emitted by the same sources and are strictly linked. There could be solutions that can mitigate both (win-win options), but there can be others that will improve one but make the other worse.
Figure 7A illustrates the change in net GHG emissions per kilogram of cement produced based on two scenarios differing in the characteristics of the electricity energy mix replaced or consumed: the Italian electricity production mix of 2017 (Ecoinvent, 2020), which is the same as the GHG emissions plotted in Figures 5, 6, and a hypothetical 100% “renewable energy resources (RES)” future scenario, characterized by a 50% share of wind and 50% of photovoltaics. Electricity market perspectives show substantial changes. As a consequence of the decline of fossil fuel, RES penetration to the electricity mix is expected to increase substantially in the time horizon 2020–2050 in Italy, with a 55% share by 2030 in its road map to full decarbonization by 2050. The deployment of novel technologies and decarbonization solutions needs therefore to take into account these upcoming structural changes (e.g., Carbone et al., 2021). In the RES scenario, the benefits discussed for the tail-end configuration in terms of CO2eq emissions related to the use of energy from waste heat show a much lower impact, with the contribution analysis showing that power accounts for around 1–2% of the overall CO2eq emissions. This is more pronounced for GWP20 because of the additional fossil fuel combustion and the associated CH4 emissions. The addition of CaL reduces the net GWP100 by 68 and 76% and the net GWP20 by 60 and 71% for C2 and C3, respectively, with respect to the reference case, with the CaL-integrated configuration thus exhibiting a substantially improved potential for decarbonization of the cement production cycle.

Figure 7. Sensitivity analysis. (A) GWP100 and GWP20 of the systems analyzed per kg of cement produced related to the scenario of the present (Ecoinvent, 2020) electricity production mix (EM) and to a scenario dominated by renewable energy resources (RES), i.e., 50% wind and 50% photovoltaics (W+PV). (B) Primary energy demand (PED) from non-renewables resources (non-RES) related to the same two different scenarios, i.e., EM and W+PV.
Figure 7B shows the primary energy demand (PED) from fossils required by the three systems in the same two scenarios mentioned previously: the Italian electricity production mix (Ecoinvent, 2020) and a future scenario characterized by a 50% share of wind and 50% of photovoltaics. GHG emissions are reduced by ~2/3, but energy consumption from non-renewables increases by 77 and 45% with CaL, for C2 and C3, respectively, reflecting the additional use of fuel (coal) and infrastructures. This phenomenon would be even amplified in the future scenario with a higher penetration of renewables (50% wind and 50% photovoltaics). Additional coal consumption can therefore have significant repercussions for the energy and economic footprint of a cement plant if coal is selected to cover heat needed for the CaL CO2 capture processes. To this regard, for instance, Maes et al. (2021) proposed examples to phase out fossil fuel with other fuels or electric heating and the use of carbon capture techniques.
An LCA based on process simulations of cement production was performed to evaluate the carbon footprint performance of two different CaL technology integration options into a cement production plant. Two CaL configurations differing in the level of integration between the CaL and the clinker production processes were investigated. In the tail-end configuration, the CaL process is intended as an end-of-pipe measure, intercepting exhaust gases from the rotary kiln in the carbonator. In the second configuration, the so-called CaL-integrated, the CaL oxy-calciner coincides with the plant pre-calciner and the carbonator intercepts only the flue gas coming from the rotatory kiln. In this way, CO2 produced in the pre-calciner from raw meal calcination and fuel combustion is made available as concentrate CO2 gas, while CO2 released from the air-blown rotatory kiln is captured in the CaL carbonator. The LCA results showed that the highest CO2 emissions are generally associated to fossil fuel combustion (coal) and production of clinker, which releases into the atmosphere the carbon content of CaCO3. The contribution analysis indicates that due to the integration of the CaL carbon capture system, calcination and combustion processes, which are dominant in the reference case, are almost completely abated and the not captured amount provides a limited contribution to GHG emissions, while infrastructures and coal transport/mining related emissions become responsible for the majority of GHG emissions in approximately equal parts. Notably, coal mining plays a major role if we consider the global warming potential with 20 years' timeframe. Raw meal supply, instead, provides an almost negligible contribution.
The global warming potential is strongly reduced both in the tail-end and integrated configurations (by 74 and 71%, respectively, with 100 years' timeframe) compared with the reference case. The higher electricity production of the CaL tail-end system, with respect to the CaL-integrated setting, pays back the additional GHG emissions related to the larger amount of fossil fuel (coal) consumption. On the other hand, in the frame of implementing the CaL process into the cement production cycle, a key aspect in terms of environmental impacts is represented by the reduction of fossil fuel consumption rather than using energy from waste heat, especially in the future perspective with an electricity mix based on renewable energy resources. Therefore, the CaL-integrated solution has been shown to be more efficient and may be recommended to be integrated into new concepts of production cycles, while tail-end CaL can be considered a valid retrofitting option for existing plants. Indeed, focusing on the global warming potential with 20 years' timeframe, the higher methane emissions associated to the activities for coal mining limit the advantages related to an enhanced energy recovery from waste heat. It is noticeable that these advantages completely disappear if we consider using only electricity from renewable energy resources, as shown by the sensitivity analysis. With a 20-year timeframe and a decarbonized power grid, the integrated system generates lower GHG emissions.
To evaluate trade-offs between impact categories, resource depletion and primary energy demand from non-renewables were also evaluated. Although mineral resources depletion are not substantially impacted by CaL, GHG emissions are considerably reduced, while the energy consumption is necessarily increased, with the integrated option using a lower amount of primary energy (coal). The possibility to select other fuels (e.g., natural gas, waste) than coal to drive CaL in the decision-making process can be interesting, as the detrimental environmental effects associated to coal production and combustion would be avoided. Alternatively, the cement sector and the application of CaL technologies can be very sensitive to the development of electricity market. An enhanced electrification and penetration of RES resources to phase out fossil fuels can play a role in improving environmental impacts, with cement plants starting to use more electricity for generating both the heat needed by calcination and CaL processes.
Finally, also the CO2 market is expected to play a crucial role to allow the full application of CaL technologies to this industrial sector since it is both highly CO2 intensive and relatively open to international trade. The EU has set in July 2021 the Carbon Boundary Adjustment Mechanism (CBAM) as key element of its strategy with the aim of avoiding any carbon leakage to countries with high CO2 emission rates. This measure will equalize the price of carbon between domestic products and imports. In addition, the substantial increases in the cost of CO2 emission credits in the last years may continue and lead, on the other hand, the CO2 capture costs to be more competitive if compared with the potential benefits, thus favoring new decarbonization policies for the penetration of carbon capture technologies into cement industry. As future challenge, a techno-economic evaluation coupled with policy analysis would be recommended to consider all the possible energy, fuel, and CO2 market scenarios and their progress in relation to the best available technologies, to finally identify the best trade-offs and steer a path through these complexities.
The original contributions presented in the study are included in the article/Supplementary Materials, further inquiries can be directed to the corresponding author.
SS: funds acquisition. CC, DF, SS, and AA: conceptualization, methodology, and supervision. CC and DF: writing the original draft. CC and AA: performed LCA analysis. DF and AL: performed process simulations. All authors contributed to writing review and editing of the article and approved the submitted version.
The authors declare that the research was conducted in the absence of any commercial or financial relationships that could be construed as a potential conflict of interest.
All claims expressed in this article are solely those of the authors and do not necessarily represent those of their affiliated organizations, or those of the publisher, the editors and the reviewers. Any product that may be evaluated in this article, or claim that may be made by its manufacturer, is not guaranteed or endorsed by the publisher.
The authors acknowledge the grant provided by the Italian Ministry of Economic Development to the project SFERO (Systems for Flexible Energy via Reuse of carbOn) within the work program: 1.6—Energy efficiency of products and industrial processes of the framework Ricerca di Sistema Elettrico.
The Supplementary Material for this article can be found online at: https://www.frontiersin.org/articles/10.3389/frsus.2022.809231/full#supplementary-material
Abanades, J. C., Anthony, E. J., Wang, J., and Oakey, J. E. (2005). Fluidized bed combustion systems integrating CO2 capture with CaO. Environ. Sci. Technol. 39, 2861–2866. doi: 10.1021/es0496221
Abanades, J. C., Arias, B., Lyngfelt, A., Mattisson, T., Wiley, D. E., Li, H., et al. (2015). Emerging CO2 capture systems. Int. J. Greenh. Gas Control 40, 126–166. doi: 10.1016/j.ijggc.2015.04.018
Arias, B., Alonso, M., and Abanades, C. (2017). CO2 capture by calcium looping at relevant conditions for cement plants: experimental testing in a 30 kWth pilot plant. Ind. Eng. Chem. Res. 56, 2634–2640. doi: 10.1021/acs.iecr.6b04617
Atsonios, K., Grammelis, P., Antiohos, S. K., Nikolopoulos, N., and Kakaras, E. (2015). Integration of calcium looping technology in existing cement plant for CO2 capture: process modeling and technical considerations. Fuel 153, 210–223. doi: 10.1016/j.fuel.2015.02.084
Carbone, C., Gracceva, F., Pierro, N., Motola, V., Zong, Y., You, S., et al. (2021). Potential deployment of reversible solid-oxide cell systems to valorise organic waste, balance the power grid and produce renewable methane: a case study in the southern italian peninsula. Front. Energy Res. 9, 1–17. doi: 10.3389/fenrg.2021.618229
Cement Sustainability Initiative (2017). Development of State of the Art-Techniques in Cement Manufacturing: Trying to Look Ahead. Duesseldorf; Geneva: European Cement Research Academy; CSI/ECRA- Technology Papers. Available online at: http://www.wbcsdcement.org/technology
Chang, M. H., Chen, W. C., Huang, C. M., Liu, W. H., Chou, Y. C., Chang, W. C., et al. (2014). “Design and experimental testing of a 1.9MWth calcium looping pilot plant,” in Energy Procedia (Elsevier), 2100–2108.
Climate Action (EU ETS) (2022). Available online at: https://ec.europa.eu/clima/eu-action/eu-emissions-trading-system-eu-ets_en
De Lena, E., Spinelli, M., Gatti, M., Scaccabarozzi, R., Campanari, S., Consonni, S., et al. (2019). Techno-economic analysis of calcium looping processes for low CO2 emission cement plants. Int. J. Greenh. Gas Control 82, 244–260. doi: 10.1016/j.ijggc.2019.01.005
De Lena, E., Spinelli, M., Martínez, I., Gatti, M., Scaccabarozzi, R., Cinti, G., et al. (2017). Process integration study of tail-end Ca-looping process for CO2 capture in cement plants. Int. J. Greenh. Gas Control 67, 71–92. doi: 10.1016/j.ijggc.2017.10.005
Demailly, D., and Quirion, P. (2008). European emission trading scheme and competitiveness: a case study on the iron and steel industry. Energy Econ. 30, 2009–2027. doi: 10.1016/j.eneco.2007.01.020
Ecoinvent (2020). v3.7.1. Available online at: https://ecoinvent.org/theecoinvent-database/data-releases/ecoinvent-3-7-1/
Fennell, P. S., Davis, S. J., and Mohammed, A. (2021). Decarbonizing cement production. Joule 5, 1305–1311. doi: 10.1016/j.joule.2021.04.011
Fu, B., Gasser, T., Li, B., Tao, S., Ciais, P., Piao, S., et al. (2020). Short-lived climate forcers have long-term climate impacts via the carbon–climate feedback. Nat. Clim. Chang. 10, 851–855. doi: 10.1038/s41558-020-0841-x
GaBi (2021). 10.5. Available online at: https://gabi.sphera.com/international/index/
García-Gusano, D., Garraín, D., Herrera, I., Cabal, H., and Lechón, Y. (2015). Life Cycle Assessment of applying CO2 post-combustion capture to the Spanish cement production. J. Clean. Prod. 104, 328–338. doi: 10.1016/j.jclepro.2013.11.056
Gardarsdottir, S. O., De Lena, E., Romano, M., Roussanaly, S., Voldsund, M., Pérez-Calvo, J. F., et al. (2019). Comparison of technologies for CO2 capture from cement production—part 2: cost analysis. Energies 12:542. doi: 10.3390/en12030542
Hawthorne, C., Trossmann, M., Galindo Cifre, P., Schuster, A., and Scheffknecht, G. (2009). Simulation of the carbonate looping power cycle. Energy Procedia 1, 1387–1394. doi: 10.1016/j.egypro.2009.01.182
Hills, T., Leeson, D., Florin, N., and Fennell, P. (2016). Carbon capture in the cement industry: technologies, progress, and retrofitting. Environ. Sci. Technol. 50, 368–377. doi: 10.1021/acs.est.5b03508
IEA (2019). Putting CO2 to Use. Available online at: https://www.iea.org/reports/putting-co2-to-use
IEA (2021). Cement. Paris. Available online at: https://www.iea.org/reports/cement
Ieaghg (2015). Integrated Carbon Capture and Storage Project at Saskpower' s Boundary Dam Power Station. Available online at: https://ieaghg.org/docs/General_Docs/Reports/2015-06.pdf
IPCC (2016). Global Warming Potential Values. Available online at: https://ghgprotocol.org/sites/default/files/ghgp/Global-Warming-Potential-Values(Feb162016).pdf
Jordal, K., Voldsund, M., Størset, S., Fleiger, K., Ruppert, J., Spörl, R., et al. (2017). “CEMCAP - making CO2 capture retrofittable to cement plants,” in Energy Procedia, eds T. Dixon, H. Herzog, and S. Twinnin (Lausanne), 6175–6180. doi: 10.1016/j.egypro.2017.03.1755
JRC European Commission (2013). ILCD. Available online at: https://eplca.jrc.ec.europa.eu/ilcd.html
Madlool, N. A., Saidur, R., Hossain, M. S., and Rahim, N. A. (2011). A critical review on energy use and savings in the cement industries. Renew. Sustain. Energy Rev. 15, 2042–2060. doi: 10.1016/j.rser.2011.01.005
Maes, B., Audenaert, A., Craeye, B., and Buyle, M. (2021). Consequential ex-ante life cycle assessment on clinker production in the EU: how will the future influence its environmental impact? J. Clean. Prod. 315, 128081. doi: 10.1016/j.jclepro.2021.128081
Miyamoto, O., Maas, C., Tsujiuchi, T., Inui, M., Hirata, T., Tanaka, H., et al. (2017). KM CDR ProcessTM project update and the new novel solvent development. Energy Procedia 114, 5616–5623. doi: 10.1016/j.egypro.2017.03.1700
Plaza, M. G., Martínez, S., and Rubiera, F. (2020). CO2 capture, use, and storage in the cement industry: state of the art and expectations. Energies 13, 5692. doi: 10.3390/en13215692
Rolfe, A., Huang, Y., Haaf, M., Pita, A., Rezvani, S., Dave, A., et al. (2018). Technical and environmental study of calcium carbonate looping versus oxy-fuel options for low CO2 emission cement plants. Int. J. Greenh. Gas Control 75, 85–97. doi: 10.1016/j.ijggc.2018.05.020
Schakel, W., Roxanne, C., Tokheim, L., Hammer, A., Worrell, E., and Ramírez, A. (2018). Impact of fuel selection on the environmental performance of post- combustion calcium looping applied to a cement plant. Appl. Energy 210, 75–87. doi: 10.1016/j.apenergy.2017.10.123
Schorcht, F., Kourti, I., Scalet, B. M., Serge, R., and Luis, D. S. (2013). Best Available Techniques (BAT) Reference Document for the Production of Cement, Lime and Magnesium Oxide. Seville: European Commission, Joint Research Centre, Institute for Prospective Technological Studies. Available online at: https://eippcb.jrc.ec.europa.eu/sites/default/files/2019-11/CLM_Published_def_0.pdf
Shimizu, T., Hirama, T., Hosoda, H., Kitano, K., Inagaki, M., and Tejima, K. (1999). A twin fluid-bed reactor for removal of CO2 from combustion processes. Chem. Eng. Res. Des. 77, 62–68. doi: 10.1205/026387699525882
Spinelli, M., Martínez, I., De Lena, E., Cinti, G., Hornberger, M., Spörl, R., et al. (2017). Integration of Ca-looping systems for CO2 capture in cement plants,” in Energy Procedia, eds. T. Dixon, H. Herzog, and S. Twinnin (Lausanne: The Author), 114, 6206–6214. doi: 10.1016/j.egypro.2017.03.1758
Spinelli, M., Martínez, I., and Romano, M. C. (2018). One-dimensional model of entrained-flow carbonator for CO2 capture in cement kilns by Calcium looping process. Chem. Eng. Sci. 191, 100–114. doi: 10.1016/j.ces.2018.06.051
United Nations Environment Programme (2011). Near-term climate protection and clean air benefits: actions for controlling short-lived climate forcers. Available online at: https://wedocs.unep.org/20.500.11822/8048
Voldsund, M., Gardarsdottir, S. O., De Lena, E., Pérez-Calvo, J. F., Jamali, A., Berstad, D., et al. (2019). Comparison of technologies for CO2 capture from cement production—part 1: Technical evaluation. Energies 12:559. doi: 10.3390/en12030559
Zhai, R., Li, C., Qi, J., and Yang, Y. (2016). Thermodynamic analysis of CO2 capture by calcium looping process driven by coal and concentrated solar power. Energy Convers. Manag. 117, 251–263. doi: 10.1016/j.enconman.2016.03.022
Zhao, J., Tong, L., Li, B., Chen, T., Wang, C., Yang, G., et al. (2021). Eco-friendly geopolymer materials: a review of performance improvement, potential application and sustainability assessment. J. Clean. Prod. 307, 127085. doi: 10.1016/j.jclepro.2021.127085
Keywords: cement production, calcium looping, global warming potential, resources depletion, industry decarbonization, carbon capture
Citation: Carbone C, Ferrario D, Lanzini A, Stendardo S and Agostini A (2022) Evaluating the Carbon Footprint of Cement Plants Integrated With the Calcium Looping CO2 Capture Process. Front. Sustain. 3:809231. doi: 10.3389/frsus.2022.809231
Received: 04 November 2021; Accepted: 23 February 2022;
Published: 05 April 2022.
Edited by:
Idiano D'Adamo, Sapienza University of Rome, ItalyReviewed by:
Alessandro Dal Pozzo, University of Bologna, ItalyCopyright © 2022 Carbone, Ferrario, Lanzini, Stendardo and Agostini. This is an open-access article distributed under the terms of the Creative Commons Attribution License (CC BY). The use, distribution or reproduction in other forums is permitted, provided the original author(s) and the copyright owner(s) are credited and that the original publication in this journal is cited, in accordance with accepted academic practice. No use, distribution or reproduction is permitted which does not comply with these terms.
*Correspondence: Claudio Carbone, Y2xhdWRpby5jYXJib25lQGVuZWEuaXQ=
Disclaimer: All claims expressed in this article are solely those of the authors and do not necessarily represent those of their affiliated organizations, or those of the publisher, the editors and the reviewers. Any product that may be evaluated in this article or claim that may be made by its manufacturer is not guaranteed or endorsed by the publisher.
Research integrity at Frontiers
Learn more about the work of our research integrity team to safeguard the quality of each article we publish.