 Andrea Winterstetter
 Joana Mira Veiga
 Anastasiia Sholokhova
 Gašper Šubelj4
95% of researchers rate our articles as excellent or good
Learn more about the work of our research integrity team to safeguard the quality of each article we publish.
Find out more
ORIGINAL RESEARCH article
Front. Sustain. , 09 January 2023
Sec. Waste Management
Volume 3 - 2022 | https://doi.org/10.3389/frsus.2022.1039149
This article is part of the Research Topic The Sustainability Series: The Plastics Problem - Investigating Socio-economic Dimensions of Plastic Pollution View all 5 articles
Land-based litter and leakages from inadequate waste management are among the primary sources of marine litter. Plastic packaging and small non-packaging plastic items (PPSI) represent the most extensive application of virgin plastics produced and the largest fraction of post-consumer plastic waste. Moreover, PPSI are amongst the top recognizable litter items recorded on European beaches. This study aimed to estimate mismanaged PPSI waste generated in 33 countries in Europe, as well as in coastal territories bordering European seas. A material flow analysis was performed for each country for 2012 and 2018. The results indicate that most countries generated higher amounts of PPSI waste in 2018, both in absolute amounts and per capita. We estimate that 26.1 million tons of PPSI waste were generated in 2018 in the whole region, corresponding to 42.9 kg per capita (compared to 38.7 kg in 2012). This was also the case for mismanaged PPSI waste, with 3.01 million tons estimated for 2018, compared to 2.90 million tons in 2012, even if most countries managed to reduce their shares of mismanaged PPSI waste. Furthermore, differences in litter pressure around the regional seas are clear, with 90% of the estimated mismanaged PPSI in European coastal territories being generated in the Mediterranean and the Black Sea regions. Limitations related to data gaps and reporting lead to significant uncertainties in our estimations, even if the study made use of officially reported data from European countries. Our study suggests that reductions in the share of mismanaged PPSI waste seem to be mainly driven by efforts at the end-of-life stages of plastics (i.e., waste collection, recycling, disposal) but that these were not sufficient to offset higher amounts of PPSI waste generated in 2018, compared to 2012. Furthermore, exports of plastic waste, including from EU countries, may result in intensified shares of mismanaged PPSI. Responses on both waste management and waste prevention are needed to transition to a circular economy and to reduce the amount of plastic waste that ends up in the marine environment.
Marine litter, particularly the dominant plastic fraction, has significant harmful implications for marine life (Kühn et al., 2015; Werner et al., 2016; Angiolillo and Fortibuoni, 2020) and for our socio-economic spheres (McIlgorm et al., 2011; Newman et al., 2015; Diggle and Walker, 2022). Plastic marine litter can originate from a wide range of sources, from activities both on land and in the sea. Most mismanaged plastic waste (MPW) results from a lack of waste collection services, inadequate or uncontrolled waste disposal, illegal dumping and littering, and unsanitary landfills (Velis et al., 2017; Kaza et al., 2018; Woods et al., 2021). Plastics can escape from uncontained landfills and dumpsites, mobilized by environmental factors such as wind, surface runoff, coastal erosion and flooding or scavenging activities, and slope failure (Fei et al., 2022). In addition, leakage of plastics can occur during waste management activities, including collection, transport, handling, storage, and treatment (Renaud et al., 2018; Ryberg et al., 2018). Littering by citizens usually occurs shortly after the use phase, often despite existing waste management infrastructure, and can be associated e.g., with tourism (Wilson and Verlis, 2017), large public events, and busy urban areas (Grelaud and Ziveri, 2020). Part of this litter can be captured by cleaning services, but data are lacking and estimates of losses due to littering are highly uncertain (Ryberg et al., 2019).
Acknowledging that plastic litter pollution is a consequence of the way we produce, use, dispose, and manage plastics, several European policies have been designed and amended to prevent plastic pollution. A transition to a circular economy is one of the cornerstones of the European Green Deal and aims at adjusting the entire lifecycle of materials, in sectors that include plastics, packaging, and waste. Enhanced measures to prevent and manage plastic waste, and in particular plastic packaging, are reflected in the revised Waste Framework Directive (2008/98/EC, amend 2018/851) and the Packaging and Packaging Waste Directive (94/62/EC, amend 2018/852/EU). The Directive on Single-Use Plastics (SUP) (2019/904/EU) restricts the consumption of the most abundant plastic items found on European beaches, a.o. cotton bud sticks, plastic cutlery, plates, straws, stirrers, and sticks for balloons. More recently, the European Commission defined ambitious targets pertaining to waste and plastics for 2030, namely the recycling of 55% of plastic packaging (European Commission, 2020), the significant reduction of waste generation and the reduction by half of the plastic litter at sea [Zero Pollution Action Plan (ZPAP), European Commission, 2021a].
Most of the studies to date that estimate leakages of plastic litter into the sea (e.g., Jambeck et al., 2015; Lebreton et al., 2017; Lebreton and Andrady, 2019) make use of MPW data from global datasets (e.g., World Bank, Waste Atlas). Limited reliability associated with the underlying waste management data leads to high uncertainties and significant differences in the national and global estimates among these studies (Edelson et al., 2021). In Europe, countries are required to report on waste management indicators, which have shown improvements in waste collection coverage, recycling, and disposal among European Member States in recent years (Eurostat, 2022b). Remarkably few studies exist on the amount and trends of plastic waste that is mismanaged and has the potential to end up in the environment and, ultimately, the sea. The recent study by Hsu et al. (2021) aimed to address this gap by quantifying plastic flows for Europe, including the end-of-life routes for over 400 plastic-containing products.
Plastic packaging and other consumer plastics represent the largest application of virgin plastic production and the largest fraction of post-consumer plastic waste (Geyer et al., 2017; Ryberg et al., 2019; Plastics Europe, 2020), largely due to their short lifetime and single-use nature. According to Plastics Europe (2019), packaging constitutes 61% of post-consumer waste generated, while small non-packaging items, including consumer and medical items, sum up to 17%. Moreover, these categories encompass litter items most frequently recorded on European beaches (Addamo et al., 2017), namely those targeted by the European SUP Directive.
The general objective of this study was to strengthen the knowledge about the sources of a critical fraction of plastic marine litter in Europe, corresponding to plastic packaging and small non-packaging plastic items (PPSI). Specifically, our study aimed at providing a detailed whilst region-wide quantification of the amount of PPSI waste generated and mismanaged in Europe by applying country-specific material flow analyses of this type of waste for the years 2012 and 2018.
The assessment covered the 27 EU Member States plus Iceland, Liechtenstein, Norway, Switzerland, Turkey, and the United Kingdom (UK), and was further detailed for each regional sea coastal territory. Some non-European countries bordering the Baltic Sea, the Black Sea, and the Mediterranean Sea were also considered in some elements of the analysis, namely Russia and the Balkan States.
Material flow analysis (MFA) was performed for each country for 2012 and 2018, to compare the situation at two points in time. These years were selected as defining the first implementation cycle of the Marine Strategy Framework Directive (MSFD, 2008/56/EC), a European policy instrument specifically addressing marine litter. Furthermore, 2018 provided the most up-to-date datasets of reported EU waste data when this study was conducted.
The PPSI fraction assessed accounts for all the plastic packaging waste, from both consumer and industrial sources, as defined in the Waste Framework Directive, and small non-packaging plastic items, i.e., household, leisure, sports, and medical items, e.g., cigarette filters, cotton-bud sticks, and tooth-brushes (as considered by Plastics Europe, 2019). Excluded are plastic wastes from agriculture, automotive, electrical and electronic appliances, construction, and textiles. For each country and year, mismanaged PPSI waste was estimated and expressed as a total national amount, per capita (based on population data of 2012 and 2018; World Bank, 2022), and as a share of the total PPSI waste generated.
The fraction considered as “mismanaged” includes all the non-collected PPSI waste; littered waste; losses from collection (e.g., overflowing bins, fly-off from sorting, transport); as well as the PPSI waste that is disposed of in non-sanitary landfills (i.e., poorly managed landfills, active, and/or illegal dumpsites).
Country-specific per capita estimates were used to calculate amounts of mismanaged PPSI generated in coastal territories bordering the four European regional seas, based on the population of the coastal European Nomenclature of Territorial Units for Statistics—level 3 (NUTS 3) for the two reference years (data by Eurostat, 2022a; supplemented by EEA—European Environment Agency, 2010).
Data on plastic packaging placed on the market, plastic packaging waste generated, recovered, and recycled were retrieved from Eurostat, as reported by the EU countries under the EU Packaging and Packaging Waste Directive (94/62/EC, amend 2018/852/EU). These data account for all packaging, whether it originates from industrial or commercial sources, offices, shops, services, households, or any other entities (Eurostat, 2022b). Small non-packaging plastic items were added with a 17:61 ratio, following the average fraction of plastic waste generated of 61% to packaging, 4% to household items, and 13% to other small items (Plastics Europe, 2019). Data on collection rates of municipal solid waste (MSW) were based on countries' factsheets (EEA—ETC/WMGE, 2016). The share of uncollected PPSI waste is assumed to be the same as for MSW. Landfilling was based on the share of post-consumer plastic waste going to landfills in each EU Member State in 2012 (Plastics Europe, 2013) and 2018 (Plastics Europe, 2019).
To account for non-sanitary final disposal, we considered a share of 1–10% of collected waste but still disposed of in non-sanitary landfills. This range was applied only to those countries that either have open infringement procedures initiated by the European Commission, concerning poorly managed landfills and/or active dumpsites (European Commission, 2021b) or from reported evidence on the existence of active illegal dumpsites (e.g., Kubásek., 2013; Renaud et al., 2018). Data on losses from collection and littering in Europe are scarce or inexistent. Therefore, we have assumed losses from collection to be 1% and a littering rate of 2% (as in Jambeck et al., 2015) of the national PPSI waste generated. For Austria, we used a littering rate of 1% instead, since more detailed information was available (Stoifl and Oliva, 2020) and extrapolated it to countries with similar recycling rates.
For non-EU countries (e.g., Switzerland and Turkey), which are not required to report on packaging waste, data on MSW generation, uncollected waste, and share of plastics (12% for high-income and upper middle-income countries; 10% for low-income countries; assuming 50% uncertainty) were retrieved from the World Bank database (Kaza et al., 2018) and country-specific studies (Kawecki and Nowack, 2019; Syversen, 2019). For the plastic fraction present in MSW, a share of 78% was assumed to be PPSI (Plastics Europe, 2019). For the specific case of Turkey we accounted for the plastic waste imports, which increased from 260 thousand tons in 2012 to 440 thousand tons in 2018, as reported by TÜIK—Türkiye Istatistik Kurumu (2021a,b). The imported plastic waste was assumed to be primarily plastic packaging (EEA—European Environment Agency, 2019a). These imports were added to the fraction of plastic in solid waste generated as retrieved from the World Bank database with a share of 78% assumed to be PPSI.
The MFA was performed using the software STAN (Cencic and Rechberger, 2008) (Figure 1) and mismanaged PPSI waste is calculated according to the following formula:
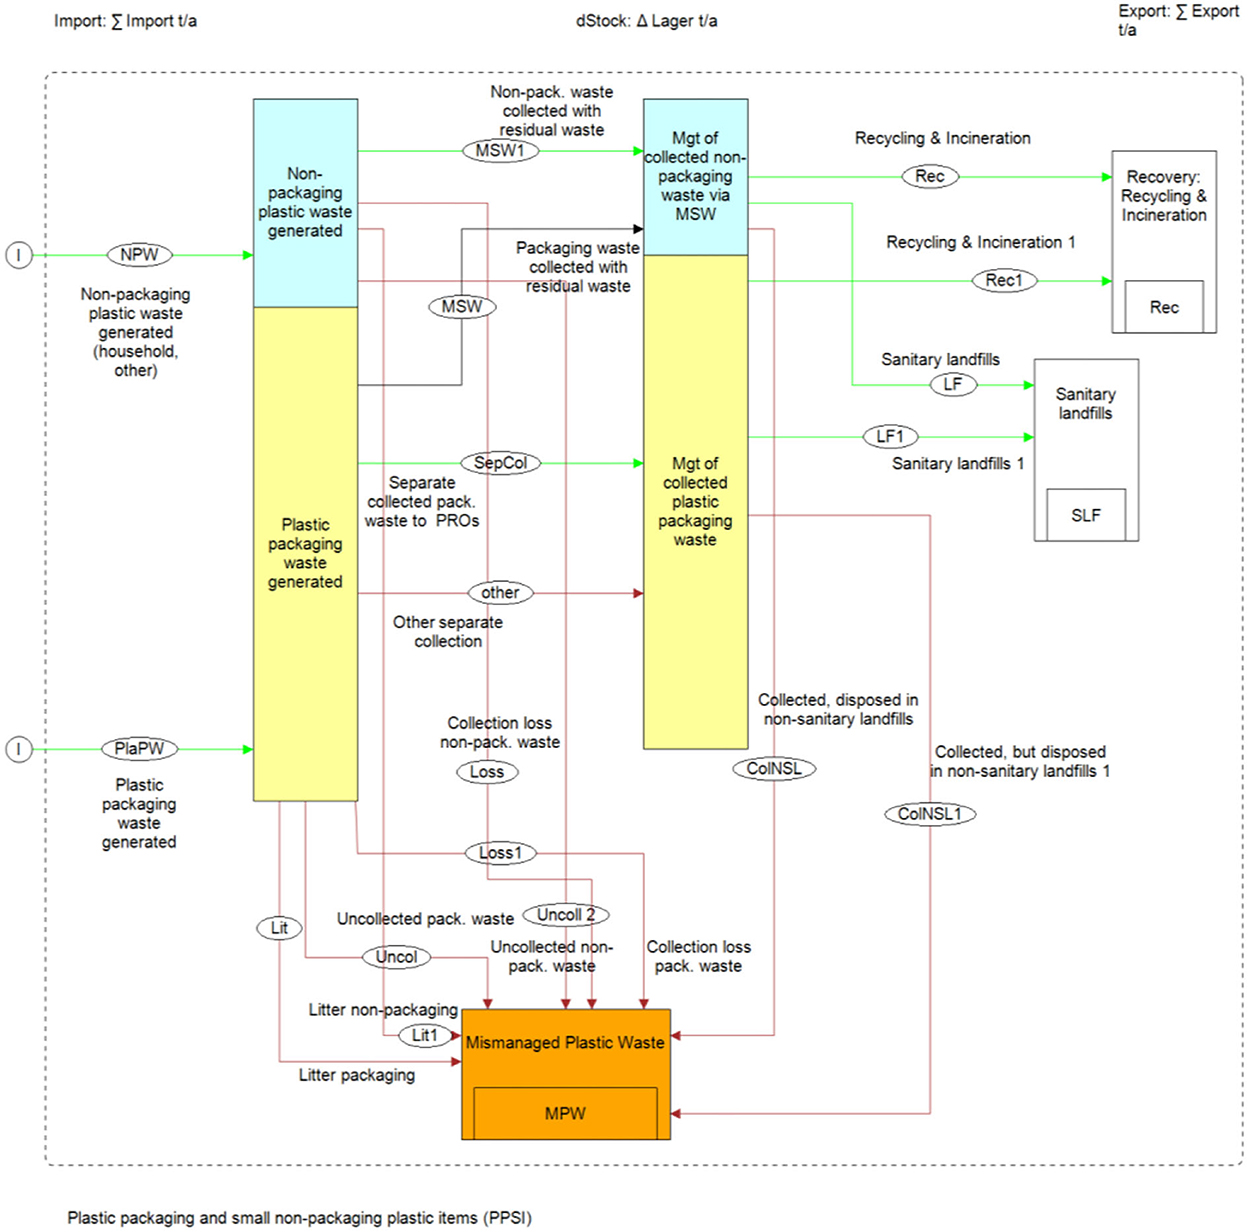
Figure 1. Conceptual material flow model to quantify mismanaged PPSI waste (STAN software, Cencic and Rechberger, 2008). PPSI, plastic packaging and small non-packaging plastic items.
To assess the pressure of mismanaged PPSI waste in coastal territories, the NUTS 3 and available population data for the two reference years were used. The population data (Eurostat, 2022a) exist for all the EU countries and the comparable regional units of the Balkan States, Iceland, Norway, Turkey, and the UK. Data for two NUTS 3 regions in Estonia, five in Italy, one in Lithuania, four in the Netherlands, and eight in Norway were not available. For those, a spatial raster dataset of the population in 2008 (EEA—European Environment Agency, 2010) was used to extract the sum of population by NUTS 3 unit. The estimation of the coastal PPSI waste in the 2 years is thus a function of national per capita PPSI waste estimates and population change in respective NUTS 3 region, particularly prominent in the areas of coastal urban development with a substantially increasing population.
Data gaps required a number of assumptions, which have been described above. Still, it can be expected that accessed data has also a variable range of uncertainty associated. Due to various issues with collecting data on packaging, some countries either under-report quantities of packaging materials placed on the market and/or over-report the amounts of recycled materials (Eurostat, 2020). To account for these reporting uncertainties, we cross-checked the share of plastics in residual municipal waste (Eunomia CRI, 2014; EEA—ETC/WMGE, 2018), assuming that 61% of these plastics represented packaging waste and added the separately collected plastic packaging waste. This calculated amount was compared to the data reported to Eurostat and the difference was applied an uncertainty range in the MFA inputs. In addition, many other data are linked to different types of uncertainties (e.g., from measurements or different degrees of reliability). To assess the quality of data sources and their translation to different levels of uncertainty, the pedigree matrix, and uncertainty factors by Weidema and Wesnæs (1996) were used and incorporated in the MFA (see example in Supplementary Table S4).
Estimates of total PPSI waste generated varied widely among European countries, mainly as a reflection of the size of their population. When comparing the two selected years, our results indicate that, except for the UK, all countries generated higher amounts of PPSI waste in 2018 than in 2012 (Figure 2). The difference between the 2 years can be substantial, with nine countries presenting increments of over 30% or more, as is the case of Norway (40.3%), Malta (42.1%), Iceland (46.0%), and Ireland (56.6%) (see Supplementary Table S1). Similarly, the amount of annual PPSI waste generated per capita varies significantly between countries, from 20 kg (Croatia) to 69 kg (Ireland), estimated for 2018, and, with a few exceptions, these are consistently higher than in 2012 (Figure 3).
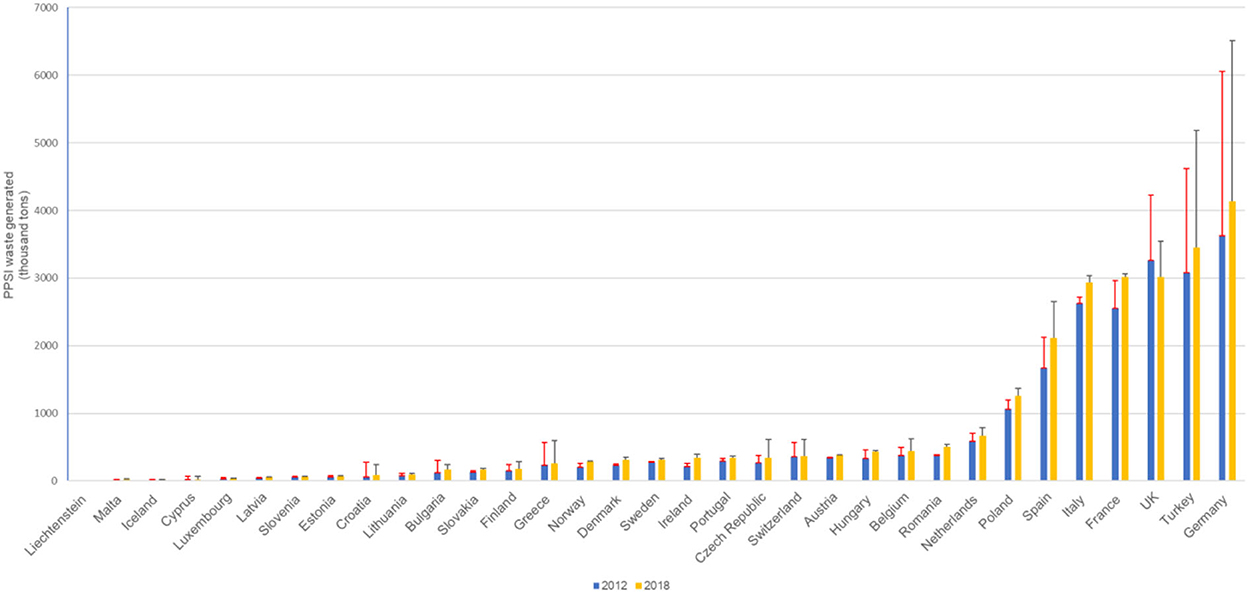
Figure 2. Total amounts of PPSI waste generated (thousand tons, kton) in the EU-27 plus Iceland, Liechtenstein, Norway, Switzerland, Turkey, and the UK, in 2012 and 2018. Uncertainties are represented in the bars. PPSI, plastic packaging and small non-packaging plastic items.
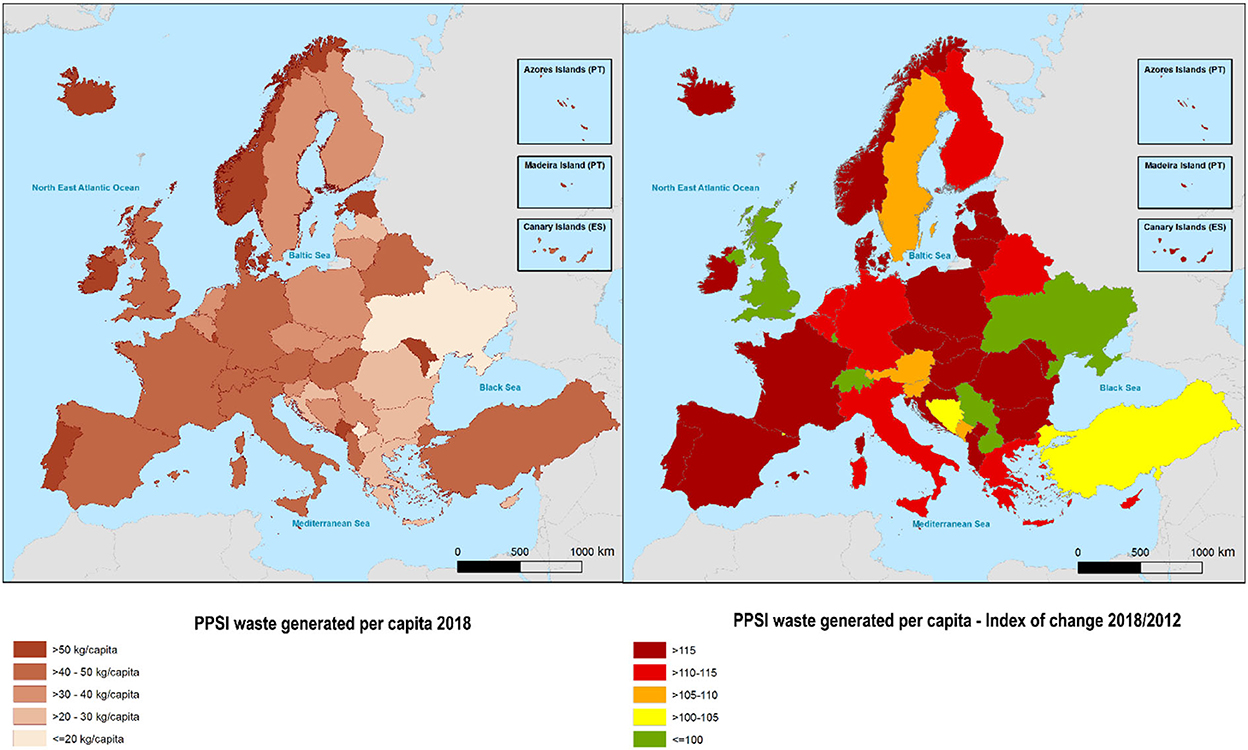
Figure 3. PPSI waste generated (kg per capita) in 2018 (left) and index of change 2018/2012 (right) in the EU-27 plus Iceland, Liechtenstein, Norway, Switzerland, Turkey, and the UK (estimates for other countries displayed are based on World Bank data). PPSI, plastic packaging and small non-packaging plastic items.
Considering the whole region, the total PPSI waste generated in the 33 countries assessed was estimated at 22.94 million tons in 2012 and 26.09 million tons in 2018, an increment of 13% in relation to 2012. The average per capita PPSI waste generation in the region was estimated at 38.7 kg in 2012 and 42.9 kg in 2018. Aggregating the results of the EU27 countries, the total PPSI waste generated was estimated at 16.01 million tons in 2012 and 18.94 million tons in 2018.
The results of the assessment of mismanaged PPSI waste for individual countries for 2012 and 2018 are presented as share of total PPSI waste generated and total amounts. National shares of mismanaged PPSI waste in 2018 range between 2% and 49% (Figure 4). Compared to 2012, several countries managed to reduce the share of mismanaged PPSI waste in 2018. In some cases, these reductions have been significant, as it is the case of Poland, Ireland, Lithuania, Finland, Slovenia, and Croatia. In most countries, however, the percentage of mismanaged PPSI waste remained relatively unchanged. Only in Turkey the share of mismanaged PPSI waste is relatively higher in 2018, compared to 2012.
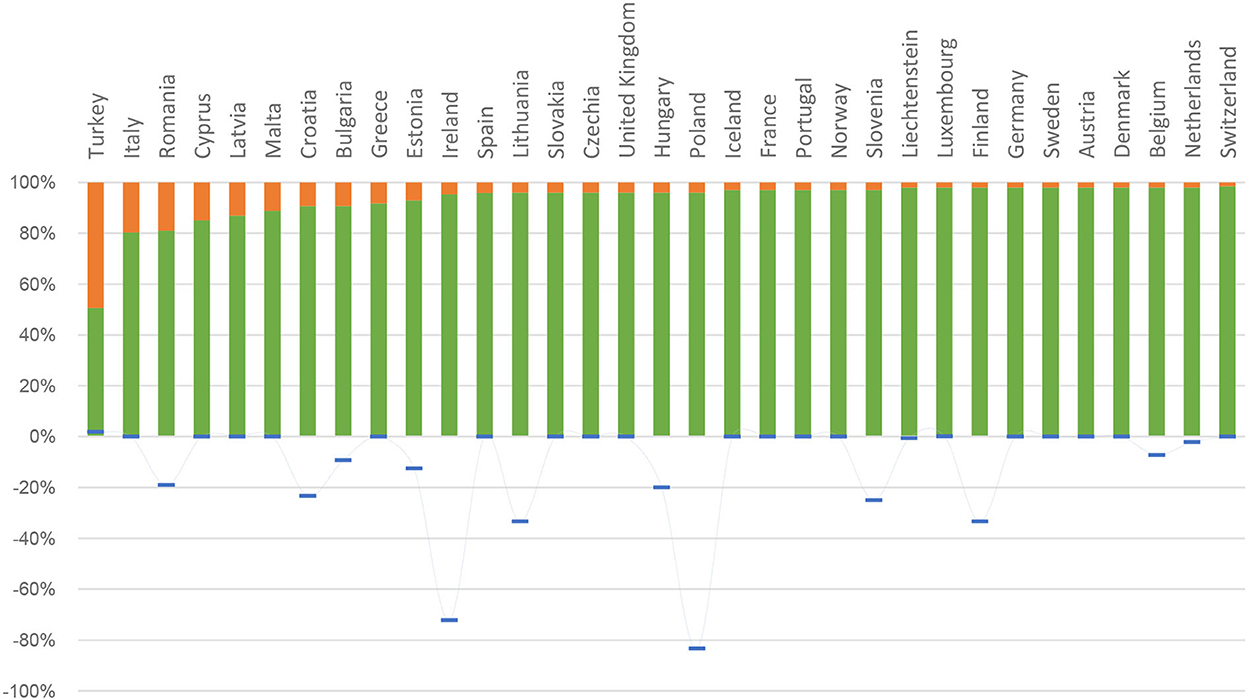
Figure 4. Share (%) of managed (green stacked bar) and mismanaged (orange stacked bar) fractions of total PPSI waste generated in 2018; and change in the share of mismanaged PPSI in relation to 2012 (blue dash) in the EU-27 plus Iceland, Liechtenstein, Norway, Switzerland, Turkey, and the UK.
Figures 5, 6 show the estimated amounts of mismanaged PPSI waste estimated for 2012 and 2018 and the comparison between these years. The total amount of mismanaged PPSI in the overall assessed area was estimated at 2.90 million tons (1.75–4.04 million tons) in 2012 and 3.01 million tons (1.89–4.12 million tons) in 2018, which represents an increment of almost 4%. This results from a higher amount of mismanaged PPSI waste in most individual countries (27 out of 33) in 2018, when compared to 2012. Finland, Ireland, Lithuania, Slovenia, Poland, and the UK were the only countries where the total amount of mismanaged PPSI was effectively lower in 2018 than in 2012. Considering the EU27 countries, we estimated a total of 1.26 million tons of mismanaged PPSI waste in 2012 and 1.17 million tons in 2018.
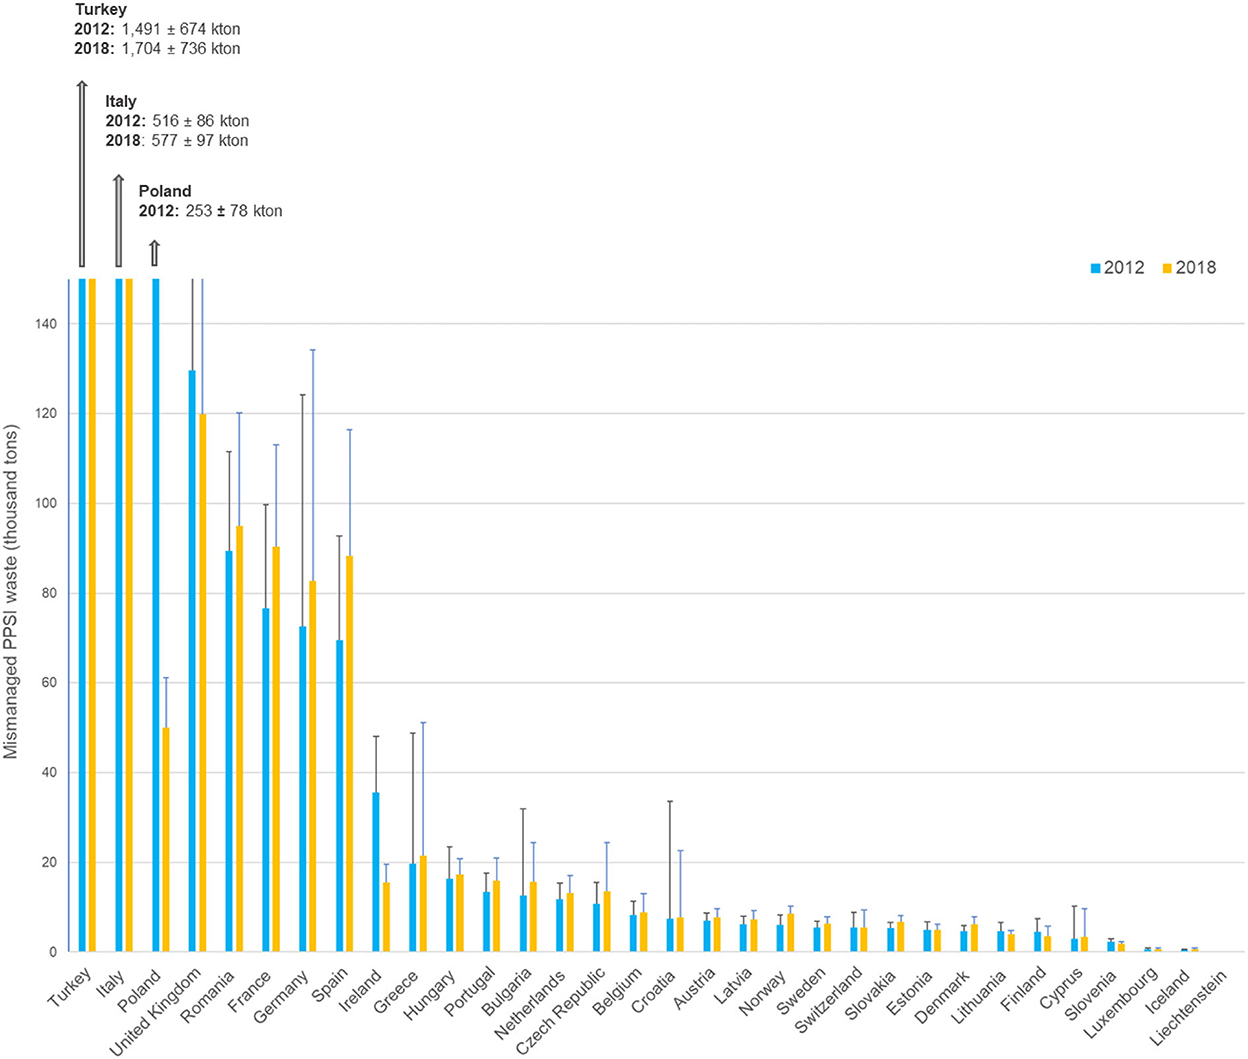
Figure 5. Total amount of mismanaged PPSI waste (thousand tons, kton) estimated for 2012 (blue bars) and 2018 (yellow bars) in the EU-27 plus Iceland, Liechtenstein, Norway, Switzerland, Turkey, and the UK. Uncertainties are represented in the bars. Note the difference in the scale for Turkey, Italy, and Poland. PPSI, plastic packaging and small non-packaging plastic items.
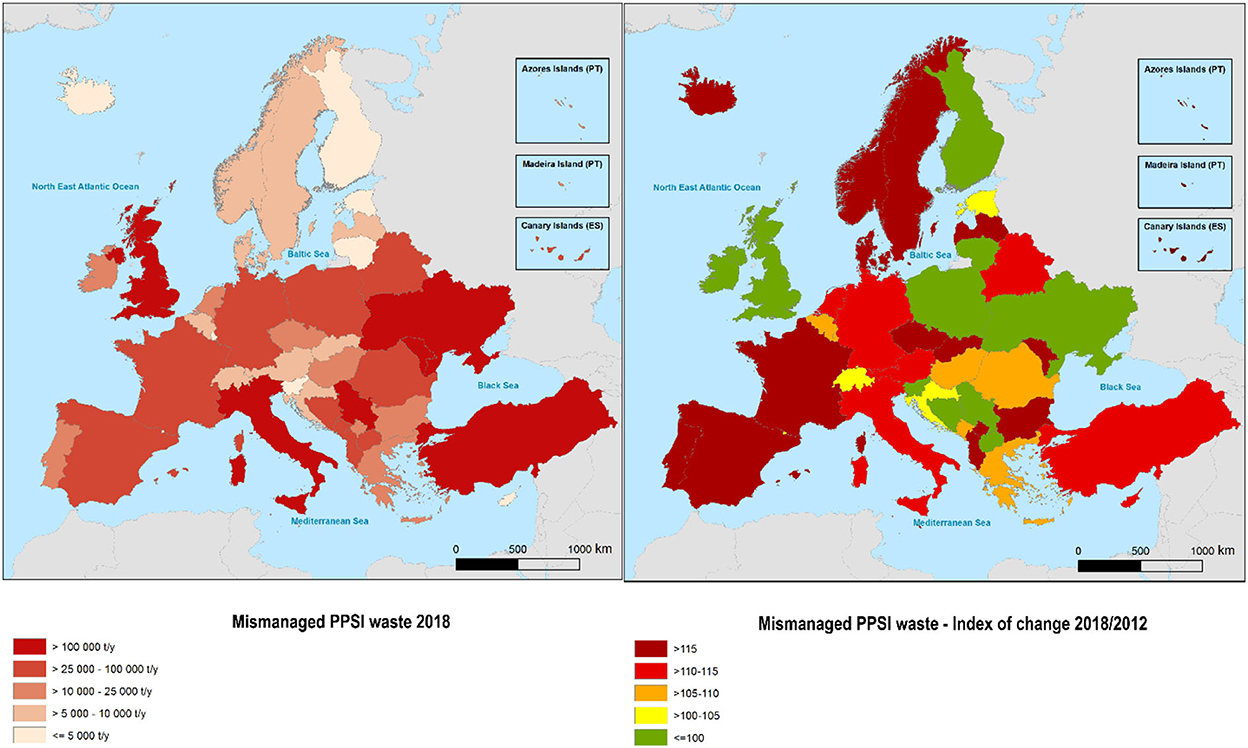
Figure 6. Total estimated amounts of mismanaged PPSI waste in 2018 (tons per year, t/y) (left) and index of change 2018/2012 (right) in the EU-27 plus Iceland, Liechtenstein, Norway, Switzerland, Turkey, and the UK (estimates for other countries displayed are based on World Bank data). PPSI, plastic packaging and small non-packaging plastic items.
The mismanaged PPSI waste computed for the NUTS 3 coastal units in 2018 shows wide spatial variations (Figure 7), with Southern European territories presenting generally higher amounts than Northern ones. Aggregation at the European regional seas level show that the Mediterranean and Black Seas collectively make 90% of the total mismanaged PPSI waste generated in all the European coastal NUTS 3. The total mismanaged PPSI waste in aggregated European NUTS 3 coastal units was estimated at 1.47 million tons in 2012 and 1.64 million tons in 2018, corresponding to an increment of 12%. Comparing 2018 to 2012, the total mismanaged PPSI waste in coastal NUTS 3 seems to have increased substantially in coastal territories of both the Mediterranean and Black Seas, while for the Baltic Sea and the North-East Atlantic (NEA), the total amounts remained relatively unchanged or even decreased slightly (details in Supplementary Tables S2, S3).

Figure 7. Amounts of mismanaged PPSI waste in 2018 in coastal NUTS 3 (tons per year, t/y) (left); and total amounts in NUTS 3 (thousand tons per year, ktons/year) aggregated by European regional sea in 2012 and 2018 (right): North-East Atlantic Ocean (NEA, including the Atlantic archipelagos of Azores, Madeira, and Canary Islands), Baltic Sea (BAL), Black Sea (BS), and Mediterranean Sea (MED). PPSI, plastic packaging and small non-packaging plastic items.
Limitations related to data availability and reliability lead to high uncertainties in our estimations, an issue prevalent in other plastic flows studies (Laner et al., 2016; Edelson et al., 2021; Hsu et al., 2021). Our study relied to a large extent on Eurostat data, which are reported by official statistical bodies of European countries and, as such, is a data source considered to be highly reliable (Hsu et al., 2021). Nevertheless, it is known that some countries under-report on (waste) packaging materials, e.g., due to online sales and cross-border trade or due to inaccurate or incomplete industry data (Eurostat, 2020), which would lead to an underestimation of PPSI waste generated and thus mismanaged. This issue was accounted for by applying uncertainty ranges based on cross-checks with the sum of plastic shares in a country's residual waste plus separately collected amounts. For most countries, the uncertainties associated with estimates of PPSI waste generated decreased in 2018, compared to 2012 for most (24) countries. This suggests an improvement in the accuracy of the reported data, likely due to enhanced reporting following the implementation of Extended Producer Responsibility (EPR) schemes and better monitoring programs in place (Ahlers et al., 2021).
Moreover, data on plastic production and conversion of polymers to specific applications provided by the industry do not always account for synthetic fibers (Bartl, 2020; EEA—European Environment Agency, 2021). Therefore, the fraction of plastic production and post-consumer plastic waste attributed to plastic packaging based on Plastics Europe may be overestimated. Hsu et al. (2021) modeled the plastic polymers' flows for different applications, resulting in 26% of plastic and plastic-containing products being consumed as packaging, 25% as “other,” and 6% as textiles. More accurate and transparent data on plastic production are needed to enhance plastic flows analyses and reduce the levels of uncertainty.
Significant data gaps exist, which relate to crucial end-of-life pathways that plastic waste may take, namely littering rates, losses from collection, and reporting of unsanitary landfills. This required several assumptions to be made, which are inherently uncertain and consequently lead to high levels of uncertainty in the resulting estimates. The share of uncollected PPSI waste in generated plastic waste is assumed to equal the share of uncollected waste in total MSW generated. This is likely an overestimate, as the situation is likely more favorable, at least for industrial/trade plastic packaging waste. Recycling rates for the latter, representing 36% of overall plastic packaging waste, are higher than for packaging from household sources, which also implies higher collection rates (EPRO Statistics, 2016).
Finally, although many EU Member States report high recycling rates for plastic waste, significant amounts of plastic waste are exported to developing countries for recycling, where the rejects can end up in waterways and the ocean (Bishop et al., 2020). In 2015 and 2016, plastic waste monthly exports from the EU were 300 thousand tons (about 3.6 million tons per year), according to (EEA—European Environment Agency, 2019b). After the import restrictions by China in 2017/2018, the EU still exported around 150 thousand tons of plastic waste per month in early 2019, corresponding to about 1.8 million tons per year. However, there is limited reliable data about how plastic waste exported from the EU is managed in other countries (EEA—European Environment Agency, 2019b), which was therefore not accounted for in this study.
The analysis by Hsu et al. (2021) estimated 34.36 million tons of post-consumer plastic waste for the EU27+UK, with packaging making up 47% of that waste. Even if this corresponds to the largest plastic flow, it is lower than the fraction assumed upfront in our study, as reported by Plastics Europe. This may be partially explained by the fact that Hsu and colleagues accounted for textiles and other plastic-containing products, which are not included in the data provided by the industry. Nevertheless, in terms of amounts, our results are in line with Hsu et al. estimates of 16.12 million tons of plastic packaging waste generated in 2016, considering the ratio of 17:61 and thus assuming that approximately 78% of our PPSI waste estimations correspond to plastic packaging (15.08 million tons in 2012 and 17.17 million in 2018 for the EU27+UK). In terms of mismanaged amounts, Hsu and colleagues estimate 3.38 million tons of mismanaged post-consumer overall plastic waste in the EU27+UK for 2016, including cross-contamination and illegal dumping, deposits in non-compliant landfills, and the littering of single-use plastic packaging. Our aggregated estimates of mismanaged PPSI waste for the EU27+UK are 1.39 million tons in 2012, and 1.29 million tons in 2018, which are naturally lower as these refer to a sub-category of plastic waste.
Differences in waste management performances across countries are visible regarding the shares of mismanaged PPSI waste estimated in our study. They are generally in line with regional differences highlighted by previous publications that use waste performance indicators (e.g., Castillo-Giménez et al., 2019). Eastern European countries generally present higher fractions of mismanaged PPSI waste, compared to Western and Northern European countries. By comparing 2 years, our results provide evidence of the impact of improvements in the waste management sectors in reducing the share of mismanaged PPSI waste across many of the countries assessed, as well as in the European region as a whole. These achievements were likely driven by the expansion in waste collection coverage, programs against illegal dumping, and enhancement in landfill management (as in Poland, Ireland, Slovenia, and Lithuania) (EEA—ETC/WMGE, 2016); a reduction in the overall generation of plastic waste, combined with reduction in illegal dumping and poorly managed landfills (as in the UK) (EEA—ETC/WMGE, 2016); and implementation of preventive actions to reduce leakages from waste management operations (as in Finland) (Dahlbo, 2019).
However, according to our analysis, only six out of the 33 countries assessed show an effective reduction in the absolute amounts of mismanaged PPSI waste in 2018, compared to 2012, without a clear regional pattern. This suggests that, despite improvements in waste management, those efforts were insufficient to offset higher amounts of PPSI waste generated across Europe when comparing these 2 years. Considering only the EU27, higher amounts of total PPSI waste generated did not result in overall higher amounts of mismanaged PPSI waste when comparing the 2 years, showing that waste management policies were effective in enhancing recycling and end-of-life of plastic waste. Nevertheless, even if waste management performances are already quite optimal in many of these countries, relatively small shares of mismanaged waste are still translated in substantial amounts of PPSI waste that may end up in the environment, e.g., as a result of littering.
Following China's ban on plastic waste imports in 2017/2018, Turkey has become one of the main alternative destinations for the global plastic waste trade (Gündogdu and Walker, 2021). This may help explain the high share of mismanaged PPSI waste obtained for Turkey in 2018, despite the share of uncollected waste decreasing from 23% in 2012 to 12% in 2018. According to the Turkish Court of (Turkish Court of Accounts., 2022), Turkey imported 277 thousand tons of plastic waste in 2017, while in 2018, after China's ban, the import was 437 thousand tons. This waste entered Turkey's waste handling system, which includes a strong informal sector and where non-sanitary landfilling and illegal dumping are still frequent, resulting in high rates of mismanaged MSW in the country (Kaza et al., 2018). In the specific case of Turkey, this study shows the link between the plastic waste trade and MPW. Nevertheless, when it comes to responsibility, it could be argued that at least part of the MPW attributed to Turkey should be instead attributed to the exporting EU countries where that waste was generated. This would, in turn, mean that actual recycling rates in the EU may deviate significantly from the reported rates, as waste exports are usually declared as “recycled” by the EU Member States (Bishop et al., 2020). Taking into account total plastic waste exports from the EU to third countries, which amounted to about 1.8 million tons in 2019 (EEA—European Environment Agency, 2019b), the EU's mismanaged fraction of PPSI waste is most likely underestimated, particularly for those EU countries that export plastic waste to countries with worse waste management performances. However, according to (EEA—European Environment Agency, 2019b), the knowledge about how plastic waste imported from the EU is managed in other countries is very limited. Assuming that all exported waste will be mismanaged would most likely not adequately reflect reality either, since (at least parts) of these waste materials do enter local recycling processes.
Given its importance in the plastic mass flows (Ryberg et al., 2019), the fraction of PPSI waste is relevant to be monitored in terms of production, consumption, and end-of-life management, as well as its occurrence in the environment. The abundance of marine litter that can be classified as PPSI varies widely between and within marine regions but they are consistently reported among the top identifiable litter items in the NEA (OSPAR, 2017; Maes et al., 2018), the Mediterranean Sea (Vlachogianni et al., 2018; Fortibuoni et al., 2019; Lambert et al., 2020), the Baltic Sea (HELCOM., 2018), and the Black Sea (Simeonova et al., 2017; Chuturkova and Simeonova, 2021), as well as in observations of riverine floating litter across Europe (González-Fernández et al., 2021).
Our study analyzed the level of mismanaged PPSI waste in coastal territories to assess regional differences in the intensity of this type of litter in these areas. As concluded in the recent study by González-Fernández et al. (2021), small coastal drainage basins (<100 km2) can be very significant in discharging litter into European seas. Our results indicate that the pressure on the coast from mismanaged PPSI waste is particularly intense in the Mediterranean Sea and the Black Sea, which collectively make most of the total mismanaged PPSI waste estimated for the coastal territories in Europe. This results from the higher amounts of mismanaged PPSI per capita in Southern and Eastern Europe countries, and from the littoralization of the Mediterranean Sea, which concentrates a higher share of the population along the coast. Furthermore, these results may also be explained by the enormous influx of tourists to the Southern regions, particularly the Mediterranean (UNEP/MAP-Plan Bleu., 2020), which may generate substantial amounts of waste and be accounted for in the reported waste data used. Even if the studies detailing the specific impact of tourism on waste generation in Europe are sparse, the tourism sector is known to exert intense environmental pressure in terms of solid waste, including packaging and other disposable items (Muñoz and Navia, 2015). According to Mateu-Sbert et al. (2013), each additional tourist in Menorca Island will generate 1.3 kg of MSW per day, while Martins and Cró (2021) estimate that the tourism sector is responsible for approximately 45% of the solid waste generated per capita in Madeira Island (Portugal). In fact, seasonal fluctuations are visible in reported accumulation rates of beach litter in the Mediterranean, particularly in what concerns consumer-related items such as PPSI (Grelaud and Ziveri, 2020). It is worth noting, though, that our estimations in coastal regions are computed as a function of the permanent population only and do not specifically capture seasonally increased population in tourist areas. This, however, would be an important subject of future research. Moreover, country-based analyses of MPW can be further refined by using sub-national waste data and thus map plastic waste flows with more spatial accuracy. Subsequent studies can make use of MPW estimates to model plastic emissions from land into the sea and to assess how those correlate with levels of environmental plastic pollution.
Our results suggest that improvements in the proportion of plastic waste being adequately managed in Europe are mainly driven by interventions at the end-of-life stages of plastics (i.e., waste management—collection, recycling, disposal). Contrastingly, an increase in plastic packaging production seems to have led to an intensification in the generation of plastic waste, and in turn to higher amounts of plastic waste that is mismanaged in many of the countries assessed. In fact, according to data from Eurostat (2022b), plastic packaging waste generated in EU27 presents an increasing trend between 2012 and 2019, even if many European Member States have identified plastic waste as a priority in their waste prevention programs (EEA—European Environment Agency, 2019a). An increasing trend in waste generation contrasts with the European policy ambition of preventing (plastic) waste and applying the waste hierarchy, as formulated in the Waste Framework Directive (2008/98/EC, amend 2018/851), the European Circular Economy Action Plan (European Commission, 2020), and more recently the 8th Environmental Action Programme (EU Decision 2022/591) and the ZPAP (European Commission, 2021a). Responses in both waste prevention (upstream) and management (downstream) are needed to transition to a circular economy and reduce the amount of plastic waste that ends up in the marine environment.
The original contributions presented in the study are included in the article/Supplementary material, further inquiries can be directed to the corresponding author/s.
AW: conceptualization, methodology, data collection, material flow analyses, and writing—original draft, review, and editing. JV: conceptualization and writing—original draft, review, and editing. AS: data collection and writing—original draft. GŠ: spatial visualization and writing—original draft, review, and editing. All authors contributed to the article and approved the submitted version.
This study was funded by the European Environment Agency through the European Topic Center (ETC) on Waste and Materials in a Circular Economy and ETC on Inland, Coastal, and Marine Waters 2021–2022.
The authors would like to thank Almut Reichel and Mustafa Aydin from the European Environment Agency for the support of this study and VITO – Flemish Institute for Technological Research for supporting its publication. In addition, the authors would like to thank Kat Heinrich from Rawtec for constructive criticism of the manuscript.
The authors declare that the research was conducted in the absence of any commercial or financial relationships that could be construed as a potential conflict of interest.
All claims expressed in this article are solely those of the authors and do not necessarily represent those of their affiliated organizations, or those of the publisher, the editors and the reviewers. Any product that may be evaluated in this article, or claim that may be made by its manufacturer, is not guaranteed or endorsed by the publisher.
The Supplementary Material for this article can be found online at: https://www.frontiersin.org/articles/10.3389/frsus.2022.1039149/full#supplementary-material
BAL, Baltic Sea; BS, Black Sea; EEA, European Environment Agency; Eionet, European Environment Information and Observation Network; EU, European Union; MED, Mediterranean Sea; MFA, material flow analysis; MSFD, Marine Strategy Framework Directive; MSW, municipal solid waste; NEA, North-East Atlantic Ocean; NUTS 3, Nomenclature of Territorial Units for Statistics—level 3; PPSI, plastic packaging and small non-packaging plastic items; UK, United Kingdom; ZPAP, Zero Pollution Action Plan.
Addamo, A. M., Laroche, P., and Hanke, G. (2017). Top Marine Beach Litter Items in Europe: A Review and Synthesis Based on Beach Litter Data. Publications Office, LU.
Ahlers, J., Hemkhaus, M., Hibler, S., and Hannak, J. (2021). Analysis of Extended Producer Responsibility Schemes Assessing the Performance of Selected Schemes in European and EU Countries with a Focus on WEEE, Waste Packaging and Waste Batteries. Adelphi. Available online at: https://erp-recycling.org/de-at/wp-content/uploads/sites/5/2021/07/adelphi_study_Analysis_of_EPR_Schemes_July_2021.pdf (accessed September 2, 2022).
Angiolillo, M., and Fortibuoni, T. (2020). Impacts of marine litter on mediterranean reef systems: from shallow to deep waters. Front. Mar. Sci. 7:581966. doi: 10.3389/fmars.2020.581966
Bartl, A. (2020). “Textiles production and end-of-life management options,” in Plastic Waste and Recycling, ed T. Letcher (London, UK: Academic Press Elsevier), 251–279. doi: 10.1016/B978-0-12-817880-5.00010-4
Bishop, G., Styles, D., and Lens, P. N. L. (2020). Recycling of European plastic is a pathway for plastic debris in the ocean. Environ. Int. 142:105893. doi: 10.1016/j.envint.2020.105893
Castillo-Giménez, J., Montañés, A., and Picazo-Tadeo, A. J. (2019). Performance in the treatment of municipal waste: are European Union member states so different? Sci. Total Environ. 687, 1305–1314. doi: 10.1016/j.scitotenv.2019.06.016
Cencic, O., and Rechberger, H. (2008). Material flow analysis with software STAN. J. Environ. Eng. Manage. 18, 3–7.
Chuturkova, R., and Simeonova, A. (2021). Sources of marine litter along the Bulgarian Black Sea coast: identification, scoring and contribution. Mar. Pollut. Bull. 173:113119. doi: 10.1016/j.marpolbul.2021.113119
Dahlbo, H. (2019). “Closing plastic circles in Finland – policy and research activities,” Presentation given at: Saubere Stoffkreisläufe - Schad- und Störstoffe in der Kreislaufwirtschaft TU Wien (Vienna) (April 29, 2019).
Diggle, A., and Walker, T. R. (2022). Environmental and economic impacts of mismanaged plastics and measures for mitigation. Environments 9:15. doi: 10.3390/environments9020015
Edelson, M., Håbesland, D., and Traldi, R. (2021). Uncertainties in global estimates of plastic waste highlight the need for monitoring frameworks. Mar. Pollut. Bull. 171:112720. doi: 10.1016/j.marpolbul.2021.112720
EEA—ETC/WMGE (2016). Country Factsheets on Municipal Waste Management. Available online at: https://www.eionet.europa.eu/etcs/etc-wmge/products/country-profiles (accessed November 19, 2021).
EEA—ETC/WMGE (2018). Scenarios for Municipal Waste Recycling Based on the European Reference Model on Municipal Waste – A Contribution to the First Early Warning Report. Annex 2 – Development of New Baselines and Data Reconciliation and Update. Eionet Report. European Topic Centre for Waste and Materials in Green Economy (accessed June 17, 2021).
EEA—European Environment Agency (2010). EEA Population Grid 1 x 1 km (Hermann Peifer Methodology), based on Landscan Global Population 2008 Dataset.
EEA—European Environment Agency (2019a). Preventing Plastic Waste in Europe. Publications Office, LU.
EEA—European Environment Agency (2019b). The Plastic Waste Trade in the Circular Economy. Briefing no. 7/2019. Publications Office, LU.
EEA—European Environment Agency (2021). Plastics, the Circular Economy and Europe's Environment: A Priority for Action. Publications Office, LU.
EPRO Statistics (2016). EPRO - European Association of Plastics Recycling and Recovery Organizations. Available online at: https://www.epro-plasticsrecycling.org (accessed June 17, 2022).
Eunomia and CRI (2014). Development of a Modelling Tool on Waste Generation and Management (No. Final Report for the European Commission DG Environment under Framework Contract No ENV.C.2/FRA/2011/0020) (accessed June 17, 2021).
European Commission (2020). A New Circular Economy Action Plan - For a Cleaner and More Competitive Europe. Communication from the Commission to the European Parliament, the Council, the European Economic and Social Committee and the Committee of the Regions COM/2020/98, European Commission, Brussels.
European Commission (2021a). EU Action Plan: ‘Towards Zero Pollution for Air, Water and Soil'. Communication from the Commission to the European Parliament, the Council, the European Economic and Social Committee and the Committee of the Regions COM/2021/400 - European Commission, Brussels. Available online at: https://eur-lex.europa.eu/legal-content/EN/TXT/?uri=CELEX%3A52021DC0400&qid=1623311742827 (accessed November 18, 2021).
European Commission (2021b). EU Infringement Database. Available online at: https://ec.europa.eu/atwork/applying-eu-law/infringements-proceedings/infringement_decisions/index.cfm?lang_code=ENandtypeOfSearch=trueandactive_only=0andnoncom=0andr_dossier=anddecision_date_from=anddecision_date_to=andEM=ELandDG=ENVandtitle=andsubmit=Search (accessed November 18, 2021).
Eurostat (2020). Energy, Transport and Environment Statistics 2020 Edition. Available online at: 06ddaf8d-1745-76b5-838e-013524781340 (europa.eu) (accessed September 2, 2022).
Eurostat (2022a). Population Change – Demographic Balance and Crude Rates at Regional Level (NUTS 3) (demo_r_gind3). Available online at: https://ec.europa.eu/eurostat/cache/metadata/en/demo_r_gind3_esms.htm (accessed June 12, 2022).
Eurostat (2022b). Packaging Waste Statistics. Available online at: https://ec.europa.eu/eurostat/statistics-explained/index.php?title=Packaging_waste_statistics (accessed August 25, 2022).
Fei, X., He, H., Pi, X., Lu, X., Chen, Q., Ma, J., et al. (2022). The distribution, behavior, and release of macro- and micro-size plastic wastes in solid waste disposal sites. Crit. Rev. Environ. Sci. Technol. 2022, 1–24. doi: 10.1080/10643389.2022.2054649
Fortibuoni, T., Ronchi, F., Mačić, V., Mandić, M., Mazziotti, C., Peterlin, M., et al. (2019). A harmonized and coordinated assessment of the abundance and composition of seafloor litter in the Adriatic-Ionian macroregion (Mediterranean Sea). Mar. Pollut. Bull. 139, 412–426. doi: 10.1016/j.marpolbul.2019.01.017
Geyer, R., Jambeck, J. R., and Law, K. L. (2017). Production, use, and fate of all plastics ever made. Sci. Adv. 3, e1700782. doi: 10.1126/sciadv.1700782
González-Fernández, D., Cózar, A., Hanke, G., Viejo, J., Morales-Caselles, C., Bakiu, R., et al. (2021). Floating macrolitter leaked from Europe into the ocean. Nat. Sustain. 4, 474–483. doi: 10.1038/s41893-021-00722-6
Grelaud, M., and Ziveri, P. (2020). The generation of marine litter in Mediterranean Island beaches as an effect of tourism and its mitigation. Sci. Rep. 10:20326. doi: 10.1038/s41598-020-77225-5
Gündogdu, S., and Walker, T. R. (2021). Why Turkey should not import plastic waste pollution from developed countries? Mar. Pollut. Bull. 171:112772. doi: 10.1016/j.marpolbul.2021.112772
HELCOM. (2018). “State of the Baltic Sea – second HELCOM holistic assessment 2011–2016,” in Baltic Sea Environment Proceedings 155 (Baltic Marine Environment Protection Commission – HELCOM). Available online at: http://stateofthebalticsea.helcom.fi/ (accessed July 8, 2022).
Hsu, W.-T., Domenech, T., and McDowall, W. (2021). How circular are plastics in the EU? MFA of plastics in the EU and pathways to circularity. Clean. Environ. Syst. 2, 100004. doi: 10.1016/j.cesys.2020.100004
Jambeck, J. R., Geyer, R., Wilcox, C., Siegler, T. R., Perryman, M., Andrady, A., et al. (2015). Plastic waste inputs from land into the ocean. Science 347, 768–771. doi: 10.1126/science.1260352
Kawecki, D., and Nowack, B. (2019). Polymer-specific modeling of the environmental emissions of seven commodity plastics as macro- and microplastics. Environ. Sci. Technol. 53, 9664–9676. doi: 10.1021/acs.est.9b02900
Kaza, S., Yao, L. C., Bhada-Tata, P., and Van Woerden, F. (2018). What a Waste 2.0: A Global Snapshot of Solid Waste Management to 2050. Washington, DC: Urban Development; World Bank. Available online at: https://openknowledge.worldbank.org/handle/10986/30317
Kubásek. (2013). “Mapping of illegal dumps in the Czech Republic – using a crowd-sourcing approach,” in Environmental Software Systems. Fostering Information Sharing. ISESS 2013. IFIP Advances in Information and Communication Technology, Vol. 413, eds J. Hrebíček, G. Schimak, M. Kubásek, and A. E. Rizzoli (Berlin, Heidelberg: Springer), 177–187. doi: 10.1007/978-3-642-41151-9_17
Kühn, S., Bravo Rebolledo, E. L., and van Franeker, J. A. (2015). “Deleterious effects of litter on marine life,” in Marine Anthropogenic Litter, eds M. Bergmann, L. Gutow, and M. Klages (Cham: Springer), 75–116. doi: 10.1007/978-3-319-16510-3_4
Lambert, C., Authier, M., Dorémus, G., Laran, S., Panigada, S., Spitz, J., et al. (2020). Setting the scene for Mediterranean litterscape management: the first basin-scale quantification and mapping of floating marine debris. Environ. Pollut. 263:114430. doi: 10.1016/j.envpol.2020.114430
Laner, D., Feketitsch, J., Rechberger, H., and Fellner, J. (2016). A novel approach to characterize data uncertainty in material flow analysis and its application to plastics flows in Austria: characterization of uncertainty of MFA input data. J. Indus. Ecol. 20, 1050–1063. doi: 10.1111/jiec.12326
Lebreton, L., and Andrady, A. (2019). Future scenarios of global plastic waste generation and disposal. Palgrave Commun. 5:6. doi: 10.1057/s41599-018-0212-7
Lebreton, L. C. M., van der Zwet, J., Damsteeg, J.-W., Slat, B., Andrady, A., and Reisser, J. (2017). River plastic emissions to the world's oceans. Nat. Commun. 8:15611. doi: 10.1038/ncomms15611
Maes, T., Barry, J., Leslie, H. A., Vethaak, A. D., Nicolaus, E. E. M., Law, R. J., et al. (2018). Below the surface: twenty-five years of seafloor litter monitoring in coastal seas of North West Europe (1992–2017). Sci. Total Environ. 630, 790–798. doi: 10.1016/j.scitotenv.2018.02.245
Martins, A. M., and Cró, S. (2021). The impact of tourism on solid waste generation and management cost in Madeira Island for the period 1996–2018. Sustainability 13:5238. doi: 10.3390/su13095238
Mateu-Sbert, J., Ricci-Cabello, I., Villalonga-Olives, E., and Cabeza-Irigoyen, E. (2013). The impact of tourism on municipal solid waste generation: the case of Menorca Island (Spain). Waste Manage. 33, 2589–2593. doi: 10.1016/j.wasman.2013.08.007
McIlgorm, A., Campbell, H. F., and Rule, M. J. (2011). The economic cost and control of marine debris damage in the Asia-Pacific region. Ocean Coast. Manage. 54, 643–651. doi: 10.1016/j.ocecoaman.2011.05.007
Muñoz, E., and Navia, R. (2015). Waste management in touristic regions. Waste Manag. Res. 33, 593–594. doi: 10.1177/0734242X15594982
Newman, S., Watkins, E., Farmer, A., ten Brink, P., and Schweitzer, J. P. (2015). “The economics of marine litter,” in Marine Anthropogenic Litter, eds M. Bergmann, L. Gutow, and M. Klages (Cham: Springer), 367–394. doi: 10.1007/978-3-319-16510-3_14
OSPAR (2017). OSPAR Intermediate Assessment 2017 – Marine Litter. Available online at: https://oap.ospar.org/en/ospar-assessments/intermediate-assessment-2017/pressures-human-activities/marine-litter/ (accessed April 15, 2021).
Plastics Europe (2013). Plastics – The Facts 2013. An Analysis of European Latest Plastics Production, Demand and Waste Data. Available online at: https://plasticseurope.org/wp-content/uploads/2021/10/2013-Plastics-the-facts.pdf (accessed September 2, 2022).
Plastics Europe (2019). The Circular Economy for Plastics - A European Overview. Available online at: https://plasticseurope.org/knowledge-hub/the-circular-economy-for-plastics-a-european-overview/ (accessed June 20, 2021).
Plastics Europe (2020). Plastics – The Facts 2020. An Analysis of European Plastics Production, Demand and Waste Data. Available online at: https://plasticseurope.org/knowledge-hub/plastics-the-facts-2020/ (accessed June 25, 2021).
Renaud, P., Stretz, J., Lateheru, J., and Kerbachi, R. (2018). Marine Litter Prevention - Reducing Plastic Waste Leakage into Waterways and Oceans through Circular Economy and Sustainable Waste Management. Eschborn: Deutsche Gesellschaft für Internationale Zusammenarbeit (GIZ) GmbH. Available online at: https://www.giz.de/de/downloads/giz2018_marine-litter-prevention_web.pdf (accessed June 25, 2021).
Ryberg, M., Laurent, A., and Hauschild, M. (2018). Mapping of Global Plastics Value Chain and Plastics Losses to the Environment: With a Particular Focus on Marine Environment. United Nations Environment Programme.
Ryberg, M. W., Hauschild, M. Z., Wang, F., Averous-Monnery, S., and Laurent, A. (2019). Global environmental losses of plastics across their value chains. Resour. Conserv. Recycl. 151:104459. doi: 10.1016/J.RESCONREC.2019.104459
Simeonova, A., Chuturkova, R., and Yaneva, V. (2017). Seasonal dynamics of marine litter along the Bulgarian Black Sea coast. Mar. Pollut. Bull. 119, 110–118. doi: 10.1016/j.marpolbul.2017.03.035
Stoifl, B., and Oliva, J. (2020). Littering in Österreich (No. Volume 0730). Vienna: Umweltbundesamt GmbH. p. 172 (accessed June 13, 2021).
Syversen, F. (2019). Recycling of Plastic Packaging in the Nordic Countries. Presentation at Long Live Plastics, Finland.
TÜIK—Türkiye Istatistik Kurumu. (2021a). Municipal Waste Statistics, 2018 and 2012. Available online at: https://data.tuik.gov.tr/Bulten/Index?p=Municipal-Waste-Statistics-2018-30666
TÜIK—Türkiye Istatistik Kurumu. (2021b). Istalat Istatistikleri 2017–2021 [WWW document]. Available online at: http://rapory.tuik.gov.tr/05-07-2021-10:35:48-15419450471818344161236958068.html
Turkish Court of Accounts. (2022). Plastik Atiklarin Yönetimi – Sayiştay Raporu. Available online at: https://sayistay.gov.tr/reports/download/3961-plastik-atik-yonetimi (accessed July 1, 2022).
UNEP/MAP-Plan Bleu. (2020). State of the Environment and Development in the Mediterranean. United Nations Environment Programme/Mediterranean Action Plan, Athens, Greece.
Velis, C., Lerpiniere, D., and Tsakona, M. (2017). How to Prevent Marine Plastic Litter - Now! An ISWA Facilitated Partnership to Prevent Marine Litter, with a Global Call to Action for Investing in Sustainable Waste and Resources Management Worldwide. Report prepared on behalf of the International Solid Waste Association (ISWA). An output of ISWA Marine Litter Task Force. ISWA September 2017. Vienna, p.75. Available online at: http://marinelitter.iswa.org/marine-task-forcereport-2017/ (accessed January, 2022).
Vlachogianni, T., Fortibuoni, T., Ronchi, F., Zeri, C., Mazziotti, C., Tutman, P., et al. (2018). Marine litter on the beaches of the Adriatic and Ionian Seas: an assessment of their abundance, composition and sources. Mar. Pollut. Bull. 131, 745–756. doi: 10.1016/j.marpolbul.2018.05.006
Weidema, B. P., and Wesnæs, M. S. (1996). Data quality management for life cycle inventories—an example of using data quality indicators. J. Clean. Prod. 4, 167–174. doi: 10.1016/S0959-6526(96)00043-1
Werner, S., Budziak, A., van Freneker, A., Galgani, F., Maes, T., Matiddi, M., et al. (2016). Harm Caused by Marine Litter: MSFD GES TG Marine Litter: Thematic Report. Publications Office of the European Union, LU.
Wilson, S. P., and Verlis, K. M. (2017). The ugly face of tourism: marine debris pollution linked to visitation in the southern Great Barrier Reef, Australia. Mar. Pollut. Bull. 117, 239–246. doi: 10.1016/J.MARPOLBUL.2017.01.036
Woods, J. S., Verones, F., Jolliet, O., Vázquez-Rowe, I., and Boulay, A.-M. (2021). A framework for the assessment of marine litter impacts in life cycle impact assessment. Ecol. Indic. 129:107918. doi: 10.1016/j.ecolind.2021.107918
World Bank (2022). World Development Indicators – Population, Total, by Country, by Year (Indicator SP.POP.TOTL). Available online at: https://databank.worldbank.org/reports.aspx?source=2andseries=SP.POP.TOTL (accessed July 30, 2022).
Keywords: plastic packaging, marine litter, material flow analysis, plastic waste management, sustainable resource management, mismanaged plastic waste, Europe, circular economy
Citation: Winterstetter A, Veiga JM, Sholokhova A and Šubelj G (2023) Country-specific assessment of mismanaged plastic packaging waste as a main contributor to marine litter in Europe. Front. Sustain. 3:1039149. doi: 10.3389/frsus.2022.1039149
Received: 07 September 2022; Accepted: 02 December 2022;
Published: 09 January 2023.
Edited by:
Mateo Cordier, Université de Versailles Saint-Quentin-en-Yvelines, FranceReviewed by:
Emenda Sembiring, Bandung Institute of Technology, IndonesiaCopyright © 2023 Winterstetter, Veiga, Sholokhova and Šubelj. This is an open-access article distributed under the terms of the Creative Commons Attribution License (CC BY). The use, distribution or reproduction in other forums is permitted, provided the original author(s) and the copyright owner(s) are credited and that the original publication in this journal is cited, in accordance with accepted academic practice. No use, distribution or reproduction is permitted which does not comply with these terms.
*Correspondence: Andrea Winterstetter,  YW5kcmVhLndpbnRlcnN0ZXR0ZXJAZ29vZ2xlbWFpbC5jb20=
Disclaimer: All claims expressed in this article are solely those of the authors and do not necessarily represent those of their affiliated organizations, or those of the publisher, the editors and the reviewers. Any product that may be evaluated in this article or claim that may be made by its manufacturer is not guaranteed or endorsed by the publisher.
Research integrity at Frontiers
Learn more about the work of our research integrity team to safeguard the quality of each article we publish.