 Pietro Portolani1,2
 Andrea Vitali1
 Simone Cornago3,4*
 Davide Rovelli1
 Carlo Brondi1
 Jonathan Sze Choong Low3
 Seeram Ramakrishna4Andrea Ballarino1
- 1Institute of Intelligent Industrial Technologies and Systems for Advanced Manufacturing (STIIMA), National Research Council of Italy (CNR), Milan, Italy
- 2Department of Electronics, Informatics and Bioengineering, Politecnico di Milano, Milan, Italy
- 3Singapore Institute of Manufacturing Technology (SIMTech), Agency for Science Technology and Research (A*STAR), Singapore, Singapore
- 4Department of Mechanical Engineering, National University of Singapore, Singapore, Singapore
Conventional Life Cycle Assessment (LCA) that relies on static coefficients is usually based on yearly averages. However, the impacts of electricity supply vary remarkably on an hourly basis. Thus, a company production plan is reassessed to reduce selected LCA impacts due to electricity consumption. To achieve this, the company will need a forecast of hourly LCA impacts due to electricity consumption, which can be directly forecast with the Direct Forecasting (DF) approach. Alternatively, the Electricity Technological Mix Forecasting (ETMF) forecasts the electricity production of the technologies in the mix and subsequently linearly combines it with unitary LCA impact indicators. Here, we assessed different machine learning models to forecast two LCA impact indicators for the consumption of electricity in the Italy-North control zone. The feed-forward neural network (NN) with the ETMF approach was the best perfomer among the assessed forecasting models. In our dataset, recurrent neural networks (RNNs) performed worse than feed-forward neural networks. Due to its better forecasting performance, the ETMF approach was preferred over the DF approach. This was due to its flexibility and scalability with easy updates or expansion of the selected forecast indicators, and due to its ability to assess technology-specific errors in the forecasting. Finally, we propose to adopt the correlation of LCA impact indicators within the dataset to select indicators while avoiding unconscious burden-shifting.
1. Introduction
This paper works at the intersection of two fields: Life Cycle Assessment (LCA) and machine learning. Databases used in LCA studies, such as ecoinvent (Ecoinvent, 2019), provide Life Cycle Inventory (LCI) data that is often averaged over 1 year or more, and allow for estimates of potential environmental impacts of products and services (Treyer and Bauer, 2016; Wernet et al., 2016). However, the electricity production process varies over time and space. Electricity consumption constitutes one of the main drivers of LCA impacts and has been identified as an area where machine learning can be applied to potentially reduce Climate change impact (Cornago et al., 2022; Rolnick et al., 2022). This is especially true for countries with a high penetration of electricity produced by non-dispatchable renewable sources, such as solar and wind energy (Laurent and Espinosa, 2019). A company could schedule its production plan in advance to reduce the specific environmental impact indicators by consuming cleaner electricity, if the varied LCA impacts of electricity consumption can be tackled through LCA data of higher resolution, across both space and time. This has been demonstrated with various case studies, such as electricity storage systems (Elzein et al., 2019), households (Roux et al., 2016; Kopsakangas-Savolainen et al., 2017; Riekstin et al., 2020), electric vehicles (Zivin et al., 2014), and data centers (Dandres et al., 2017).
Therefore, the variability of the impacts of the electricity technology mix enable the rescheduling of power-intensive processes aimed at reducing potential environmental impacts. Among the assessed impacts, the user could focus on a target environmental performance for a specific LCA impact category. Attempts to forecast medium-term system-wide energy mixes have been reported (Sowiński, 2019). Nonetheless, short-term forecasts are still required to allow for provisioning and rescheduling of energy resources on electricity markets.
Within this context, the LCA Aware Scheduling framework aims to enable efficient management of electricity consumption of plants to reduce their consequent LCA impact (Cornago et al., 2020). First, the framework relies on the possibility to forecast the day-ahead hourly average impacts of electricity consumption, focusing particularly on part of scope 2 emissions, as referred by the GHG Protocol (Sotos, 2015). Second, the forecast will be used in the next step of the framework, i.e., the scheduling based on minimizing one or more LCA impacts indicators. Here, the optimization of the production scheduling is aimed at reducing the LCA impacts due to electricity consumption, while respecting traditional scheduling constraints, such as production goals, physical, and safety limitations. The updated scheduling translates into a new day-ahead electricity consumption profile. This new profile will be communicated to the energy providers, who will then consider the information when formulating bids for the day-ahead market. These bids, after market closure and optimization, determine the operation identity, capacity, and schedule of the power plants required. Finally, the transmission system operator (TSO) or ENTSO-E publishes the ex-post hourly technology mixes that will substitute the forecasts in a Dynamic Life Cycle Inventory (DLCI). The LCA impact indicators obtained by ex-post values can then have two functions. An LCA report, for certification purposes, can be produced, as it requires transparent data sources and therefore cannot rely on the outputs of an in-house forecasting model. Second, they can be compared to the forecasts and used to assess and improve the accuracy of the forecasting model.
The forecasted environmental impacts should be made available before the actual definition of the production plan for two reasons. First, it should take into consideration the operational constraints of the implementation of the production scheduling into the production plant. Second, it should allow for the provision of energy resources on a day-ahead market-regulated electricity auctions and the possible modification of their profile through intra-day purchases in order to follow the optimized schedule. If the user of this framework fail to communicate the variation in the electricity consumption profile in time, it could result in hefty fees from the TSO.
Various studies have recently proposed models to address this issue. Tranberg et al. (2019) proposed an accounting method driven by flow tracing, that leveraged on power flows between market zones in Europe to take into account the marginal carbon intensity of each market. The said method was thereafter employed by Bokde et al. (2021) and Leerbeck et al. (2020) to achieve predictions through statistical modeling, in a Direct Forecasting (DF) approach, where the forecasting parameter was the hourly environmental impact intensity of a market zone. Wang et al. (2016) chose a machine learning model to predict the hourly marginal greenhouse gas emissions due to electricity consumption in a East USA market area with a DF approach. Additionally, Riekstin et al. (2020) adopted a database generated with a previous work (Milovanoff et al., 2018) to forecast the impact of electricity consumption in France on Climate change with a DF approach, through a machine learning model and obtained better results than in Wang et al. (2016). Hawkes (2010) focused on Marginal Emission Factors (MEFs) estimates which measured the Climate change impact signal related to a modification of the demand-supply energy curve, using a statistical DF approach.
In all the works that deploy DF approaches, the forecasting parameter is limited to a single LCA impact indicator related to the Climate change impact category (Hawkes, 2010; Wang et al., 2016; Leerbeck et al., 2020; Riekstin et al., 2020; Bokde et al., 2021). On the other hand, the Electricity Technological Mix Forecasting (ETMF) (Cornago et al., 2020) predicts part of the foreground system of the LCI, the hourly average technology mix for electricity production. Subsequently, the output of the ETMF approach can be linearly combined with unitary LCA impact indicators for each technology, which are deterministic values, to calculate hourly LCA impact indicator averages. Even if Cornago et al. (2020) only deals with the Climate change impact category, the ETMF approach can easily consider additional impact categories, due to the computationally efficient linear combination step.
The consideration of all the impact categories of an LCIA method avoids unintentional burden shifting between impact categories, i.e., reducing a single impact indicator while increasing those of other categories. Given that the DF approach requires the development of a new forecasting model for every LCA impact indicator, it would be useful to find a methodology to select a small number of impact indicators to curb coding and computational efforts, while trying to limit unintentional burden shifting issues.
Berger and Finkbeiner (2011) studied the correlation between individual LCA impact indicators. However, it was not clear how to support the selection of a subset of LCA impact indicators from an LCIA method, while limiting burden shifting. Moreover, a limitation of the LCA Aware Scheduling approach is its reliance on the fitness of the forecasting of the LCA impact indicators. However, it is not clear which machine learning or statistical method should be adopted to obtain the most accurate trajectories of day-ahead hourly LCA impact indicators, nor the preferred approach (ETMF or DF).
To address these research gaps, we describe a methodology to select LCA impact indicators to reduce the number of forecasting models while limiting burden shifting issues. Additionally, we compare the performance of different models while using ETMF and DF forecasting approaches, to understand a potential solution to the problem. To test the forecast model, we considered the Italy-North control zone of the Italian electricity market as case study, due to its diversified electricity technology mix. We limited our study on ETMF and DF only, and obtained the absolute best possible forecasting model for the case study will be beyond the scope of this work. We also evaluated the advantages and disadvantages of the ETMF and DF approaches but not limited to their forecasting accuracy.
2. Methods and modeling
In Section 2.1, we discuss the choice of attributional or consequential modeling, which impacts both the calculation of the unitary LCA impacts and the forecasting models. Section 2.2 describes the computation of unitary LCA impacts for electricity consumption, following the choice made in Section 2.1. In Section 2.3, we define the methodology to select LCA indicators needed by the DF approach to contain computational resources while limiting unconscious burden-shifting. Subsequently, in Section 2.4, we analyze the database used to train and validate and test the forecasting models, while in Section 2.5, we describe the forecasting models in detail. Finally, in Section 2.6, we describe the metrics used to assess the forecasting performances of the different models.
2.1. Attributional vs. consequential forecasting
The choice to implement either an attributional or a consequential assessment for potential impacts of electricity consumption is important. Attributional assessment focuses on the average electricity technology mix, while consequential assessment deals with the marginal electricity technology mix, even though the distinction is a general rule and not a strict delimitation (Schaubroeck et al., 2021). In this section, we discuss the advantages and disadvantages of the two modeling alternatives and subsequently explain our choice to implement an attributional assessment.
Table 1 lists the differences in the meaning of the LCA Aware Scheduling and the advantages and disadvantages of the two approaches. An LCA Aware Scheduling with an attributional forecasting would aim to minimize the electricity consumption-related LCA impacts of the user. In contrast, a consequential approach (Hawkes, 2010; Wang et al., 2016; Leerbeck et al., 2020; Bokde et al., 2021) would forecast which marginal technology mix is actually being turned online or put offline, respectively, for a higher or lower electricity demand at a given hour, as a consequence of the new scheduling plan. Therefore, using an attributional approach can potentially result in an increase in LCA impacts at the system level across the following day, as demonstrated in the case of data centers (Dandres et al., 2017).
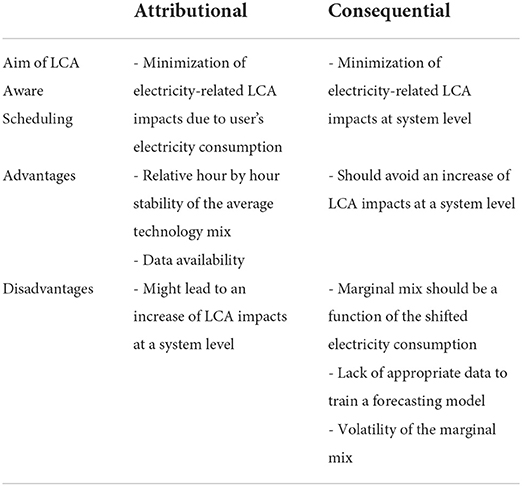
Table 1. Differences between an attributional and a consequential approach for the forecasting.
Though the consequential approach seems to be ideally preferred, obstacles in its implementations limit its application and led us to pursue the attributional approach. First, the non-linearity of the environmental impact of the marginal mix LCA stems from the fact that the order in the production curve is based on the bid cost, and not on the consequent environmental impact. Indeed, the production curve producers are listed with an order of increasing bid value. However, this economic evaluation does not fully reflect the LCA impact order (Brondi et al., 2019). Therefore, bids of technologies responsible for significantly different LCA impacts (i.e., a coal plant and a pumped-hydro plant) could be priced similarly. The environmental impact of the marginal mix is a non-linear function of the consequent shifted consumption, and has not been assessed as all previous approaches assumed a linear function. Indeed, Mathiensen et al. (2009) detailed three alternatives from literature to select the marginal technologies for LCA studies: it could be the same technology, a different single technology every hour or a mix of technologies that changes every hour. Mathiensen et al. (2009) also concluded that the first two option were too simple and should only be considered for decisions involving small electricity demand. Dandres et al. (2017) built upon this finding and proposed the marginal mix as the sum of the hourly variations in production for each technology. This method was then improved by adding regional import and export of electricity to the electricity mix calculation (Milovanoff et al., 2018), resulting in a regional marginal mix, which was not dependent on the amount of electricity consumption shifts over time. However, a consequential LCA Aware Scheduling would need to assess a marginal mix as a function of the electricity consumption shifted by the users. Indeed, a large scale implementation of LCA Aware Scheduling based on the consequential approach, without solving the issue of the non-linearity of the environmental impacts of the marginal mix, might be victim of its own success. A linear approximation for the environmental impact of the marginal mix might work well for a kWh or even a MWh of shifted demand, but it might not be robust for a shifted demand of GWh scale. The result could be an increase of LCA impacts at a system level, even though the consequential approach is ideally designed to avoid it.
Second, for the case of North Italy during the considered years, the time series of the marginal technology is not continuous, as it was not identified for many hours of the dataset. This would severely hamper the development of DF models, which require a continuous time series input. Due to the non-linearity of the marginal technology mix, hourly data for technologies that are cut off from the merit order curve is needed. These technologies would be employed to enter the market with an increase in electricity demand and an increased data availability would enable the modeling of the marginal technology mix. However, the incomplete time series represents only a single marginal technology, and not a mix of them.
Third, though used in previous studies (Hawkes, 2010; Wang et al., 2016; Leerbeck et al., 2020; Bokde et al., 2021), the high volatility of marginal mixes and the related LCA impacts results in difficulties in accurate forecasting. This disadvantage of the consequential approach was acknowledged in Dandres et al. (2020). The relatively high volatility of LCA impacts linked to marginal mixes as opposed to attributional ones is highlighted for the Italian market in Brondi et al. (2019). Indeed, gas plants and hydroelectric plants often represent the marginal technology in this market, producing a signal that fluctuates significantly due to the relevant difference among the environmental impact of these technologies (Brondi et al., 2019). On the other hand, an advantage of the attributional approach is that an average forecast is considered more robust than the marginal one. This is due to the difference in order of magnitude between the electricity production shifted by the LCA Aware Scheduling and the remaining electricity production within the selected market. Even if the shifted electricity were to reach a few GWh per hour, most of the electricity demand (in the order of tens of GWh per hour) is linked to activities that cannot be rescheduled. However, the same variation would affect the marginal mix composition significantly, where impact is not averaged with the unchanged regional demand.
Marginal forecasting risks providing to the user of the LCA Aware Scheduling framework highly uncertain information at best, until these three issues can be integrally addressed. In a worst case scenario, the widespread use of LCA Aware Scheduling based on the consequential approach might even result in an increase of LCA impacts at system level.
Therefore, we temporarily solve this research gap by implementing an attributional forecasting approach. As previously mentioned, the main disadvantage of this approach is that it cannot exclude increases in LCA impacts at system level, as demonstrated in Dandres et al. (2020). This is because the objective function would be the minimization of the LCA impacts specific to the individual user, and not the overall minimization of LCA impacts. However, it relies on available data to train, forecast, and validate forecasting models, as well as a relative hour by hour stability of the average technology mix.
The Guarantee of Origin system is another tool that targets a user-centered approach (Parliament and of the European Union, 2009). It aims to create a market of renewable electricity certificates so that users can buy them to reduce their own impact on Climate change. An attributional LCA Aware Scheduling would bring forward an improvement relative to other attributional schemes in the European electricity market. Currently, Guarantee of Origin can be used in countries whose electricity grid is not connected to the producing one (i.e., Iceland and continental Europe). Additionally, the production and consumption of the unit of electricity can be up to 12 months apart (Parliament and of the European Union, 2009). On the other hand, attributional LCA Aware Scheduling would require production and consumption of electricity coupled to location and time.
Moreover, unless the dispatchment of renewable electricity is not a constraint, increasing demand tends to result in an increasing share of electricity generated from fossil fuels, as described in Rovelli et al. (2021). However, as production peaks of dispatchable technologies increase with the increasing capacity of non-dispatchable renewable electricity, matching demand, and supply will become increasingly difficult, which might lead to curtailment of said renewable electricity and increased network costs (Denholm et al., 2015). Attributional LCA Aware Scheduling could help enabling the shift of consumption toward hours in which a high amount of electricity responsible for low LCA impacts is available, helping to match the demand with the available production.
2.2. Computation of the environmental impacts of the technologies of the electricity mix
In this study, as well as in Elzein et al. (2019), Roux et al. (2016), Kopsakangas-Savolainen et al. (2017), Riekstin et al. (2020), and Zivin et al. (2014), the LCA is partially dynamic, as defined in Sohn et al. (2020). For this study, only the production of the technologies of the electricity mix was temporally resolved. Since the Life Cycle Impact Assessment (LCIA) phase is not dynamic, LCA impacts per unit of consumed electricity are constant coefficients, as in static LCA studies. Life Cycle Assessment impacts related to the production of a kWh of electricity are assumed to take place during the hour of production. This simplification is common in static LCA, where all impacts occur at the time of the production of the functional unit. This can be justified with our forecasting horizon of 24 h. A difference in impact within this forecasting horizon will not affect categories, such as Climate change, in which the time horizon considered is usually 100 years. We acknowledge that the same might not hold true for toxicity-related impact categories, whose results are strongly dependent on the chosen temporal differentiation and on the related modeling (Shimako et al., 2018).
We excluded the electricity generation plant construction phase from the system boundaries, as this event would happen well before any scheduling decision informed by the forecasting model. Any scheduling decision based on the forecast model will not impact the construction phase as it would have happened in the relative past (Schaubroeck et al., 2021). Processes linked to fuels production (extraction of raw materials, transformation, transportation, and storage) will be included in the system boundaries, for two reasons. First, there is no systematic data to place these processes on the timescale, compared to the moment of electricity production. This makes it difficult whether the scheduling decision does affect the generation and timing of fuel related impacts. Second, excluding these processes would over complicate the modeling of pumped-hydro plants. Under this assumption, only the LCA impacts due to pumping taking place in the 24 h between the scheduling decision and the electricity production would be included. Such level of detail is outside the scope of this paper. We assume that the electricity used in the pumping phase of pumped-hydro plants has yearly average LCA impact, disregarding of the time it happened. Therefore, the system boundaries for each technology in this study include processes linked to fuels production and fuel consumption to produce electricity.
The final step of LCA Aware Scheduling is the comparison between forecast and retrospectively measured LCA impacts (Cornago et al., 2020). Ex-post data is also available for the electricity technology mix after electricity consumption. The linear combination of the consumption and of the dynamic LCA impact results in the effective cumulative LCA impacts. The scope of this step is not the assessment of the fitness of the forecasting models, but rather the computation of ex-post LCA impacts where cradle-to-grave impacts are preferred. Ex-post reporting is not influenced by a potential rescheduling decision and needs to comply with reporting standards, which are usually cradle-to-grave or cradle-to-gate. Since the scope of this work is limited to the assessment of the fitness of the forecasting models, this step of the LCA Aware Scheduling framework is excluded.
The LCA database considered for the present study is the ecoinvent 3.6 cut-off database (Ecoinvent, 2019) and the LCIA indicators consist of the 19 International Reference Life Cycle Data System (ILCD) 2.0 2018 midpoint indicators (Fazio et al., 2018). Fuel extraction, transportation, and electricity production are included. Plant construction and electricity network losses are not included.
2.3. Selection of LCA indicators
The DF approach requires a selection of impact categories to limit the computational effort. Since a new model needs to be trained for each LCA impact category for the DF approach, the user could be unconscious of potential burden-shifting if only one model was created. The selection of a small number of categories that will be able to assess such burden-shifting should be made to support decisions. A user may want to constrain LCA indicators that are worsening due to burden-shifting to a set value. The selection of LCA indicators is therefore supported by the following four criteria.
First, we will select the Climate change total impact category, as it is debated most. To select relevant impact categories while limiting burden shifting, we aimed to assess the impact categories that correlated less with the Climate change total impact category. Therefore, the unitary electricity LCA impact indicators, computed in Section 2.2, are linearly scaled for each hour of the dataset, based on each technology's hourly production. We then performed a correlation analysis between the Climate change total indicator and the other 18 ILCD midpoint indicators for the hourly impacts of electricity consumption throughout the full dataset. The correlation analysis was customized as much as possible by limiting it to our case study with the system boundaries and the temporal boundaries, implied in the dataset. The customized correlation analysis will provide a fitter decision support in the selection of LCA indicators.
The Pearson coefficient was chosen to support the selection methodology and identify the most suitable LCA impact category in addition to the Climate change total. The Pearson coefficient indicates the strength of the linear correlation among two variables X and Y, and it is defined as the ratio between their covariance and the product of their standard deviation:
The results will always have a value between −1 (inverse linear dependency) and +1 (direct linear dependency). In the case of no linear dependency between the variables, the result is 0.
Second, we will refine the selection by considering the role of the most impacting technologies for each LCA impact indicator. It is interesting to investigate data points for which the market share of said technology is high. We suggest the selection of LCA impact indicators for which such data points do not cluster in the correlation graph. This criterion is further discussed in Section 3.1.
Third, we will evaluate the relevance of absolute LCA impacts for a certain category within the specific geography of the control zone.
Finally, we will look at the ILCD (Fazio et al., 2018) classification of LCA categories, in terms of impact assessment recommendation level, to further support our selection.
2.4. Data analysis of the dataset for the forecasting models
The dataset used to train, validate, and test the model that was retrieved from widely accessible sources, namely the ENTSO-E Transparency Platform (ENTSO-E, 2019), which provides open electricity generation data, and the ILCD 2.0 2018 midpoint indicators (Fazio et al., 2018) for the unitary LCA impacts obtained in Section 2.2. Two separate approaches are taken into consideration. In the first instance, we analyze and forecast independent time series, each one referred to the electricity production of a specific technology. For the second approach, we aim to directly forecast the linear combination of the electricity mix with the chosen set of LCA coefficients, according to the formula:
where iCO2,i is the unitary impact for the i-th hour of the following day, while kLCA,j and Ej,i the LCA coefficient and the system hourly generation, respectively, for the j-th technology. Once the forecast indicator is obtained, it was then divided by the respective hourly overall energy load for the Italy-North control zone, which is provided on a day-ahead basis through forecasts made by TSOs, Terna in our case. Therefore, for the impact category Climate change total, the unit of measure is tCO2eq per MWh, and analogously for other impact categories.
In this study, we considered the electricity demand of the Italy-North control zone, which is available on a day-ahead basis, instead of the Terna forecast. This is to provide metrics that reflect the actual performance of our model rather than indicators that are influenced by the quality of the Terna forecasts. Additionally, we excluded imports and exports from the electricity demand of the zone, allowing for a more detailed analysis to future developments. This is due to relevant gaps in the ENTSO-E dataset for such electricity flows that would significantly hinder the exploitation of machine learning algorithms. It is a simplification, since 12% of the electricity demand in Italy is fulfilled by imports coming from abroad (TERNA, 2019), leading to conflation of regional demand and consumption. Italy is characterized by a heterogeneous electricity mix, with 35.9% of local renewable generation, with a large portion of the thermoelectric, hydroelectric, and solar available capacity located in the Italy-North control zone (TERNA, 2019). A display of the hourly distribution of Climate change total impact indicator for the for the full dataset is shown in Figure 1. The lower distributions in the central hours of the the day highlight the role of Solar generation in the electricity mix.
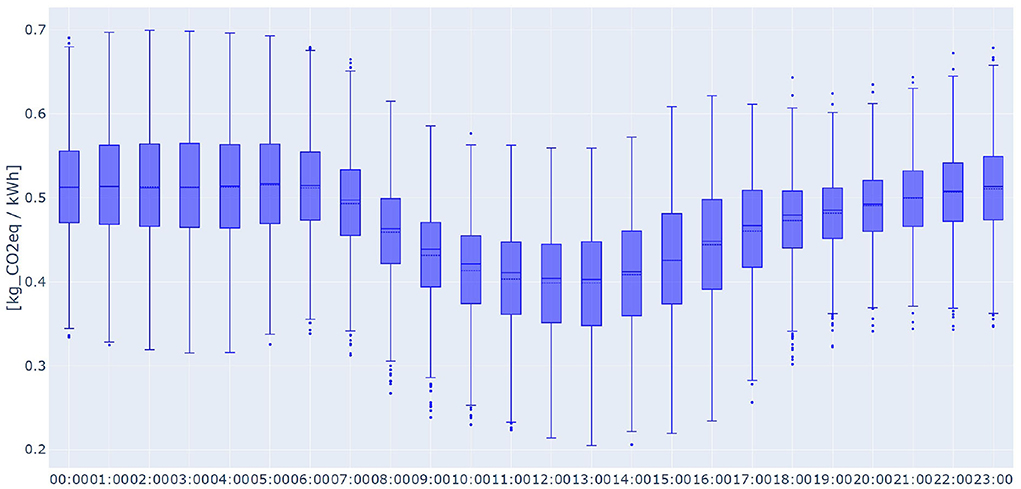
Figure 1. Hourly distributions of the Climate change total impact indicator for the electricity mix of the Italy-North control zone, samples from the full dataset. The continuous line at the center of each boxplot is the median of the distribution, while the dotted line is the mean.
In Figure 2, the box plots represent the distribution of hourly share of LCA impact of a certain technology on the total hourly LCA impact, for each LCA impact category. Technologies such as Geothermal, Solar, Wind onshore, and Hydro have a negligible contribution to all LCA impact categories, due to our assumption of the system boundaries to exclude the phase of construction of the electricity generating plants. The sole exception is the significant share of impact on the Dissipated water category due to Hydro generation. In particular, Biomass drives most of the impact for the Climate change biogenic and Land use categories. Fossil natural gas and/or Fossil hard coal are major drivers of impact, for 17 out of the 19 impact categories.
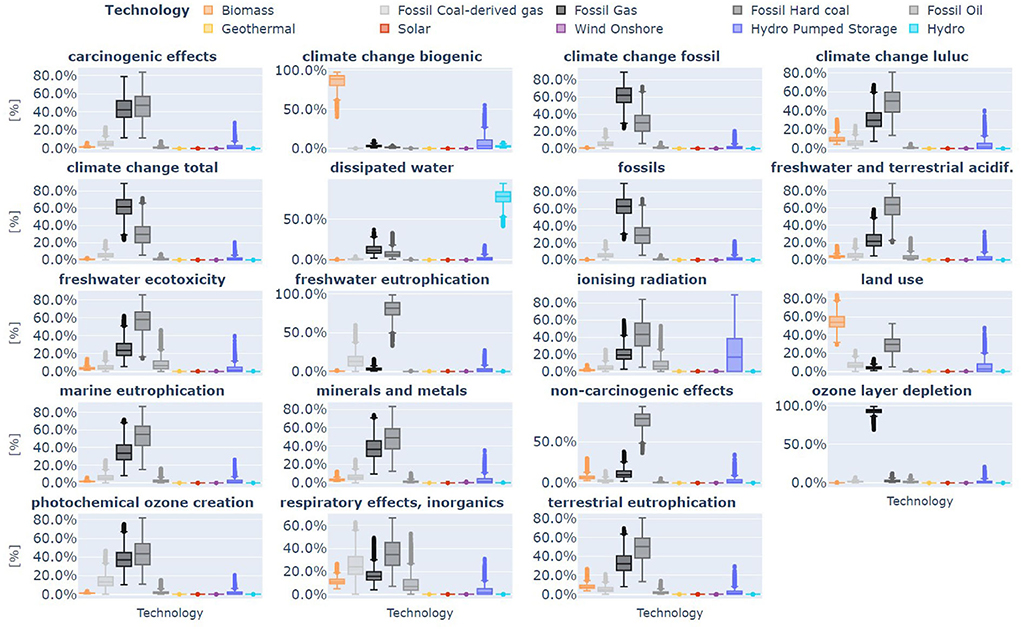
Figure 2. The distribution of hourly share of LCA impact of a certain technology on the hourly LCA impact represented by box plots, for each LCA impact category.
To cover a substantial set of states of the electricity grid, we gathered data from 1 January 2016 to 15 September 2019, resulting in a dataset composed by 1,346 hourly samples after data cleaning, preprocessing, and standardization. The dataset undergoes a conventional 80/10/10 split for training, validation, and testing purposes. It is worth noting that missing data and outliers were accounted for in the preprocessing phase, as missing hours and days appear quite frequently in the database. To avoid a drastic reduction of database size, missing hours were replaced performing a linear interpolation on neighboring timestamps, while missing days were superseded by data with the same weekday belonging to the previous week.
After standardizing and removing outliers from the available dataset, we select the set of endogenous features for each time series for inclusion in the model's input variables, by analyzing the partial auto-correlation. Exogenous variables were not considered and will be investigated in the future. Partial auto-correlation is widely used to determine the order of auto-regressive models, where the correlation between two time steps is measured, conditioned on the interval in the middle. In general, when machine learning methods are applied to data structured as time series, this indicator identifies the maximum lag used by the model as a predictor, namely its input. Figure 3 represents the partial auto-correlation function of the Climate change total indicator. It is worth noting that the majority of the correlation lies in the first 48 time steps with spikes every 24 lags up until the 168th. Following this indication, we use an input of 7 days of consecutive time step of the variable to be predicted. For example, if we want to forecast the production of natural gas, the only inputs we take for the natural gas production model will be the 168 time steps before the forecasting moment of the natural gas production time series.
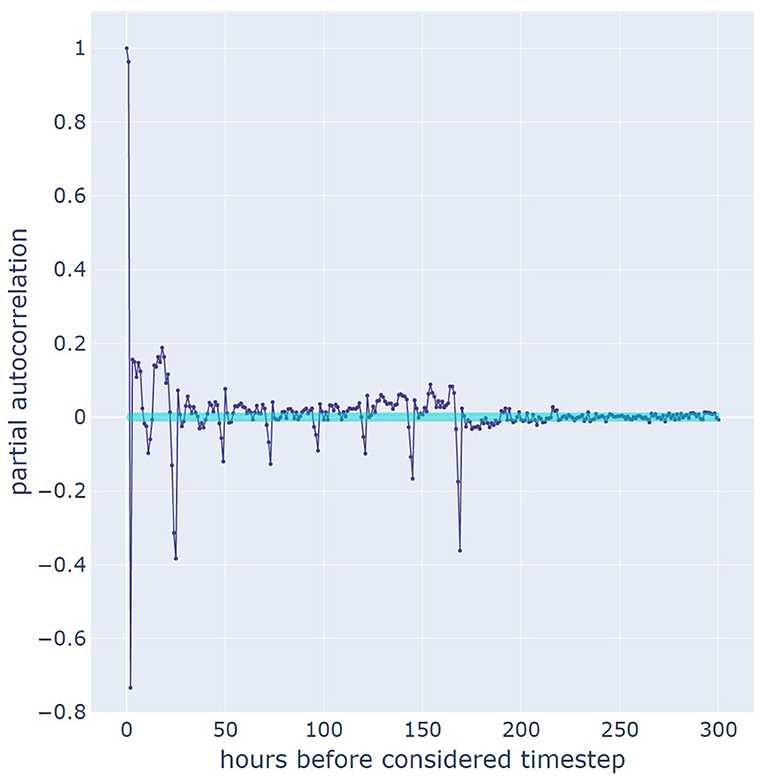
Figure 3. Partial auto-correlation function of the Climate change total impact time series. X-axis represents the hours that precede the hour where the forecasting for the following day is performed. The area highlighted in light blue represents the interval where the auto-correlation of the signal is not considered relevant.
Therefore, the input is defined as 7 days, starting from 00.00 a.m. of the first day to 11.00 p.m. of the 7th, divided hourly, and the output returned by the model will be a forecast of the next 24 h. This approach is needed by the framework, which will use the output forecast in order to optimize the industrial footprint, placing bids on hours with cleaner energy in the day-ahead energy market.
The list of conditioning variables, the results of the feature selection process, and the full dataset are available on GitHub.
2.5. Forecasting models description
Three types of forecasting models were considered: a feed-forward neural network (NN), a recurrent neural network (RNN), and a linear regression (LR). These three types of models have been applied to two different forecasting approaches, namely DF and ETMF. In the former, the output of the model is directly the indicator of the LCA impact category. Therefore, one model accounts for each LCA impact category. In the latter, the final output is composed by the forecast of the electricity mix technology, with a model for each technology, which are then linearly combined by the related unitary LCA impacts (Cornago et al., 2020).
A LR model was chosen because of its simplicity and low computational complexity for problems of this size. This model fits the coefficient of a linear combination of the input to estimate the output.
Neural networks are universal approximators (Hornik et al., 1989). They are theoretically able to represent every possible function passing the input through subsequent layers, each of them composed by a linear combinations of the model weights followed by non-linear activation functions. More recently, these algorithms have been widely used in various applications from computer vision (Pham et al., 2020) to natural language processing (Brown et al., 2020), achieving state-of-the-art results thanks to advances in computational technologies, and the diffusion of easy-to-use software. The training of the model consists in the optimization of a loss function, i.e., changing the weights according to its gradient, which has to be chosen while considering the type of output that the model has to estimate. In this work, the mean square error was used as loss function, commonly adopted in the case of regression and time series forecasting (Woschnagg and Cipan, 2004).
Recurrent neural networks are a special type of neural networks particularly suited for time-series data. Instead of computing the output based only on the input, it also uses an internal representation of the past data. A problem of the vanilla RNNs applied to long sequences is the vanishing gradient, which makes learning long-term dependencies difficult. This issue has been solved by the Long-Short Term Memory (LSTM) RNNs (Hochreiter and Schmidhuber, 1997), in which gates are used to decide how much of the past has to be remembered and forgotten, along with a cell that allows the gradient to back-propagate and to train the model. The modeling power of a model depends on the number of training weights (units in the case of a neural network). Using too many units in comparison to the number of training data will result in overfitting of the dataset, resulting in the model's inability to generalize the prediction to cases not present in the examples used in the training phase. However, using too few units leads to not fully utilizing the models' expressive power also called underfitting. Usually, to better use the GPU, multiples of eight are used as the number of weights. According to the dataset dimension, we used two models with few units, respectively, 32 and 64, as in the case of NN, to check if there are appreciable improvements. In the ETMF case, every technology model has the same number of units.
None of the models used exogenous inputs to estimate the forecast and the inputs of all the models have been selected through the analysis of the partial auto-correlation as stated in Section 2.4. Limiting the size of the feature space avoids well-known issues that arise when dealing with datasets with a considerable feature space, such as the course of dimensionality and the introduction of noise that may compromise the model's training phase.
All models have been developed in Python, using the Tensorflow library for the neural networks and scikit-learn for the LR. They are available on GitHub.
2.6. Forecasting performance metrics
To assess which of the models described in Section 2.5 has a better forecasting performance, we evaluated metrics on the test set prediction. The choice of said metrics fell on the Symmetric Mean Absolute Percentage Error (SMAPE), widely used in regression tasks and proven to provide unbiased benchmarks when dealing with day-ahead point forecasts in the energy field (Weron, 2014). Results with another common metric, Normalized Root Mean Squared Error (nRMSE), are discussed in Supplementary material. SMAPE is defined as:
and takes in consideration both the error magnitude and the absolute value of the time series. This metrics has both an upper and lower bound, providing interpretable results in the range 0–100%. Additionally, having a in denominator the sum of the absolute values of the forecasted and of the actual value of the time series avoids hardly-explicable values above 100% typical of metrics such as the Mean Average Percentage Error (MAPE).
In order to quantify the contributions of each technology in terms of the share on the overall SMAPE, we defined the Relative Importance (RI) metric as:
with N total number of technologies considered, sharei fraction of the electricity production for the −ith technology, impacti LCA coefficient for the −ith technology for the considered impact. Eventually, the result is normalized with respect to the sum of the other technologies processed with the same computations.
3. Results
This section is composed of two parts. In the first part, we show how hourly electricity impacts of different LCA impact categories correlate to those of the respective hour for the Climate change total indicator. Based on these findings, we justify our decision of selecting the Respiratory effects, inorganics indicator as the second indicator of the DF. In the second part of the section, we assess which model best forecast the LCA impact of hourly electricity consumption, with both DF and ETMF approaches. Additionally, we investigate reasons that would make one of these forecasting approaches preferable.
3.1. Impact indicators selection
Figure 4 shows the correlations between the Climate change total indicator and the remaining 18 impact indicators of the LCIA method (ILCD 2.0 midpoint), for the hourly impacts of electricity consumption throughout the full dataset. The gradient from purple to yellow signals an increasing share of Fossil natural gas plants in the electricity mix.
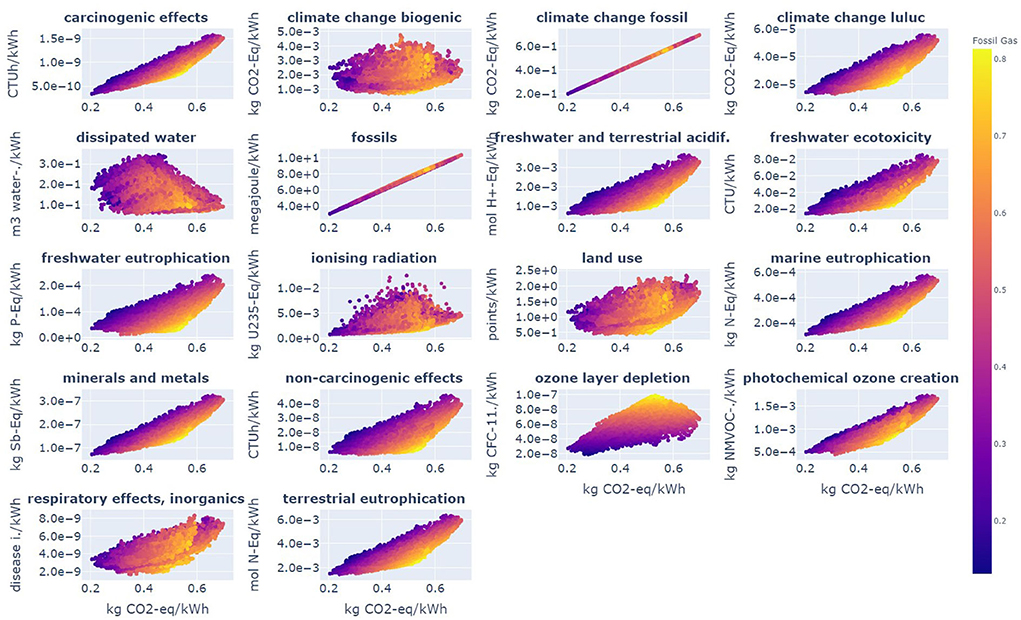
Figure 4. Scatter plots correlating the hourly impacts per kWh of electricity for Climate change total indicator (x-axis) and the remaining 18 impact indicators. The graphs cover the full dataset, from 1 January 2016 to 15 September 2019. The gradient from purple to yellow signals an increasing share of fossil natural gas in the electricity mix, from 10% to 80%. LULUC, Land Use and Land Use Change.
It is important to highlight that Figure 4 does not represent the general correlation between impact indicators. It only focuses on the correlation between the indicator of Climate change total and others, for each hour of the datatset. Since our system boundaries only include the electricity generation sector (see Section 2.2), it is not surprising to see that the Climate change Fossil and Fossils indicators show a perfect linear correlation with the Climate change total indicator. Within the assessed system, Climate change total impact is made up by:
• Climate change fossil: the main contributor to impact within the assessed technologies (even for bioenergy);
• Climate change LULUC: negligible contributor to impact within the assessed technologies;
• Climate change biogenic: negligible contributor to impact within the assessed technologies, apart from bioenergy, where it accounts for about 48% of the impact.
Since most of Climate change total impact in Italy are determined by fossil fuels (because bio-energy share is very low), it made sense that Climate change fossil is the main driver of Climate change total impact. To a lesser extent, Carcinogenic effects, Marine eutrophication, Minerals and metals, Photochemical ozone creation also showed a clear correlation with the Climate change total indicator within the assessed system.
The share of Fossil natural gas plants in the electricity mix was chosen as secondary variable to further differentiate interesting trends within the correlation graphs. Indeed, Fossil natural gas production averages the highest share of impact among all technologies, as shown in Figure 4. When assessing the share of impacts at hourly level, electricity production from Fossil natural gas or from Fossil hard coal were responsible for the highest median share of hourly impacts in 16 of the 18 couples, as shown in Figure 4. Furthermore, one of these two technologies was responsible for the highest variability of share of hourly impacts in 15 of the 18 couples and assessed as the distance between the box plot whiskers. However, the variable of the share of Fossil natural gas production was preferred to that of Fossil hard coal as data points in which the production of Fossil natural gas was high did not cluster much. Supplementary Figure S1 describes the equivalent of Figure 4 for Fossil hard coal. This is particularly true for the scatter plots correlating Climate change total, Climate change biogenic, Dissipated water, Ionizing radiation, Land use, and Respiratory effects, inorganics, as shown in Figure 4. A second LCA impact category other than Climate change total for the forecasting models should be chosen among these four LCA impact categories. The influence of other variables, as the share of electricity production from renewable sources and night vs. day, on the correlations between the Climate change total indicator and the remaining 18 impact indicators was investigated (respectively, Supplementary Figures S2, S3). However, the high clusterization of the data points relative to a high share of electricity production from renewable sources or relative to the night/day alternative did not translate into additional useful insights.
With Pearson coefficient value of -0.35, Dissipated water shows a negative correlation with the Climate change total indicator. This can be attributed to the significant role of Hydro in the dissipated water category and, conversely, to the fact that Hydro drives a low share of impact for the Climate change total category. In Italy-North, where the production of hydro is significant, the production of Hydro tends to compete with Fossil natural gas and Fossil hard coal. Ionizing radiation did not strongly correlate with Climate change total (0.37). It is mostly driven by Nuclear power production, which is not present in the Italian production mix. Therefore, the absolute impact for this category was low, in comparison to other control zones. Climate change biogenic had a Pearson coefficient with Climate change total of 0.16, which is the closest to zero among all LCA impact indicators, indicating a low correlation between the two time series. However, the electricity production from Biomass, which drives the majority of the impact in this LCA impact category, is not relevant.
Looking at impact assessment classification of the four LCA impact categories under consideration, Dissipated water is the least recommended (or recommended, but to be applied with caution), while Climate change biogenic, Respiratory effects, inorganics are the most recommended (recommended and satisfactory) (Fazio et al., 2018).
Having excluded three of the remaining four LCA impact categories under consideration, we select the Respiratory effects inorganic category. The unitary impacts of electricity for the Respiratory effects inorganics indicator were driven by different technologies, as presented in Figure 2. Fossil hard coal and Fossil coal-derived gas drive the majority of the shares of hourly impacts, while Fossil natural gas and Fossil oil both contribute with a significant amount of outliers. Table 2 shows the correlations between the Climate change total impact and Respiratory effects, inorganics indicators and the remaining 18 impact indicators. The correlation was computed with the Pearson coefficient, with the hourly impacts of electricity consumption accounted for throughout the full dataset.
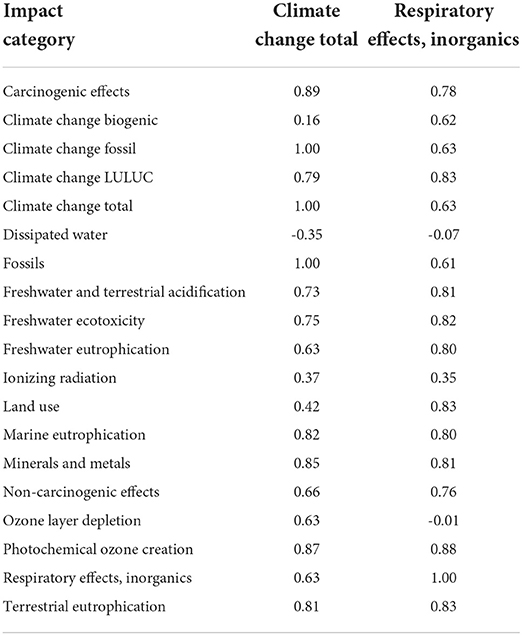
Table 2. Summary of the analyzed correlations between the Climate change total impact and Respiratory effects, inorganics indicators, and the remaining 18 impact indicators for the hourly impacts of electricity consumption throughout the full dataset, computed with the Pearson coefficient.
By considering all the Pearson coefficients of the two selected impact categories, an assessment of a third LCA impact category can be performed. The LCA indicator selection methodology could be repeated iteratively. However, the choice to stop after the selection of a certain number of LCA impact categories will ultimately depend on the user. In particular, it is critical how much the user is determined to avoid unconscious burden shifting. In this work, we limit the selection to the two mentioned LCA impact categories, to prevent excessive complexity in the presentation of the results.
3.2. Assessment of the forecasting models
Given the selection of impact indicators necessary for the DF approach made in Section 3.1, we evaluated the forecasting models' daily predictions both for the Climate change total and the Respiratory effects, inorganics impact categories on the test set. Therefore, we obtain the average of daily SMAPE values reported in Table 3.
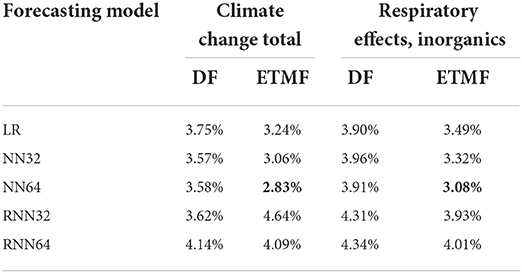
Table 3. Average test set performances for the daily SMAPE: Climate change total and Respiratory effects, inorganics categories. For each impact category, the value obtained with the best performing forecasting model are shown in bold.
While an exhaustive comparison between model architectures and hyperparameters search for the models is beyond the scope of this article, the results reported above show similar average performances between all the models under study. The best outcomes were associated to the NN with 64 units (NN64) model, particularly in its ETMF version. It is worth noting that for the Climate change total category, NN32 was the most accurate of the DF alternatives, barely outperforming NN64. For the Respiratory effects inorganics category, LR slightly edges out NN64 as most accurate among the DF alternatives.
Nonetheless, ETMF models always outperform their DF counterparts in all the experiments taken into consideration, with RNN32 in the Climate change total category as an exception.
Figure 5 represents the daily SMAPE over the test set for the different models utilized in the present work both for the Climate change total and Respiratory effects, inorganics impact indicators, to graphically assess the robustness of such metric. The box plot distributions were similar among all the models under study, except for the RNN32 with ETMF approach, which shows higher forecasting volatility and therefore wider quantile ranges. In the Supplementary material, we report the same box plot graphs for the nRMSE (Supplementary Figure S4).
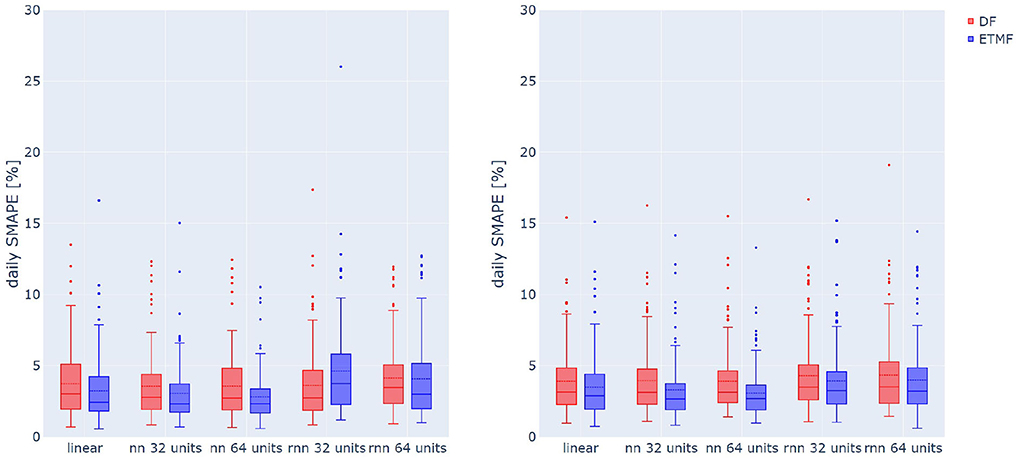
Figure 5. Box plots of the SMAPE for the Climate change total (left) and Respiratory effects, inorganics (right) LCA impact indicators. DF approach is shown in red, while ETMF in blue. The continuous line at the center of each boxplot is the median of the distribution, while the dotted line is the mean.
The distribution of daily SMAPE for the NN64 model's forecasts that leverages the ETMF approach had both the lowest and the most concentrated values among all the ones recorded in the Climate change total impact category. Indeed, the 25th and 75th quantiles statistics reach values of, respectively, 1.69% and 3.39%, with a relative difference of 1.7% that contains half of the population of the test set. The second-best performing model for robustness was the NN32 model, which had the same architecture of NN64 but different parameterization, with a 25th percentile of 1.75% and 75th percentile of 3.73%.
The NN64 with ETMF approach displayed robust forecasting performances in the Respiratory effects, inorganics category as well: half of the data points in the test set have a SMAPE between 1.91% (25th percentile) and 3.65% (75th percentile), representing the tightest interval among all the assessed models. For this category impact, the second-most robust model is NN32 ETMF, with 25th and 75th percentile metrics equal to 1.92% and 3.75%, respectively. It is worth noting that in both assessed LCA impact categories NN32 ETMF has a median value slightly lower than NN64.
A model's residuals are defined as the difference between the predicted values and the actual time series, namely yh−ŷh. The distribution of a model's residuals is indicative of the amount of useful information exploited. A model that fully utilizes the useful information should have random noise residuals, which follow a zero mean gaussian distribution. Using the python library SciPy, we performed a normality test based on (D'Agostino and Pearson, 1973). None of the residual distributions passed the test with a significance level of 0.001, implying that the they were not zero mean gaussian distributions and that the forecasting performances can be improved. This could be done by including other meaningful predictors within the set of input variables or by implementing different preprocessing techniques to handle missing data, which is left for future developments. A discrete visualization of the distributions of the ETMF and DF model residuals can be found in Supplementary Figures S6, S7, respectively.
Figure 6 shows the RI of the different technologies toward the daily SMAPE of the NN64 ETMF model, for the assessed LCA impact categories.
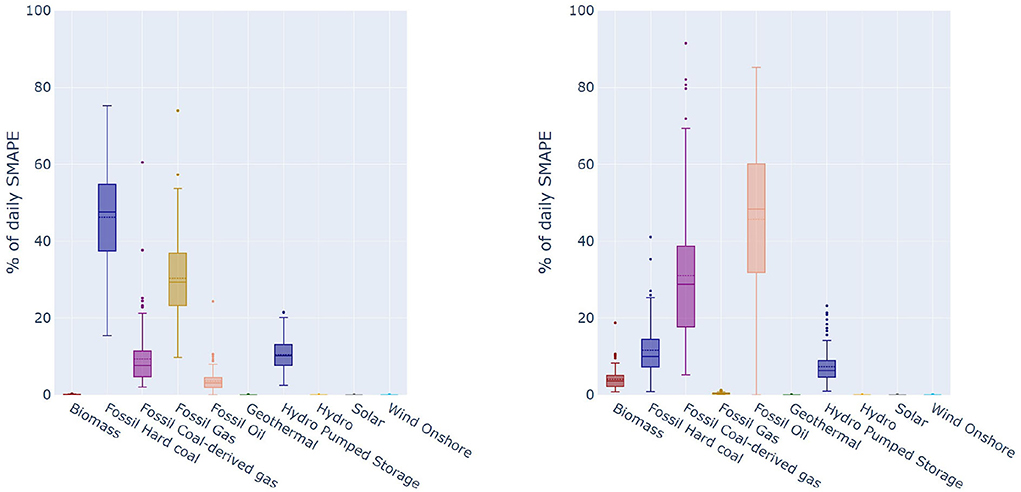
Figure 6. Box plots representing the relative importance (RI) of the different technologies toward the daily SMAPE of the NN64 ETMF model. On the left, the Climate change total category and on the right the Respiratory effects, inorganics category. The continuous line at the center of each boxplot is the median of the distribution, while the dotted line is the mean.
The greatest contributions in terms of prediction error for the Climate change total category comes from the Hard Coal and Fossil Gas technologies, both of which have a high penetration in the North Italian energy mix (TERNA, 2019) and a relatively high unitary impact. Despite having a substantial share in the control zone under study, renewable energy sources, such as solar, wind, and hydro have minor contributions on the overall forecasting error due to their low Climate change total impact, particularly under our system boundaries assumption.
Considering the Respiratory effects, inorganics category, we can see how important unitary impacts are in the determination of the single RIs: while hard coal still plays an important role, fossil gas shows a remarkable reduction. RI is the highest for fossil oil, despite its low penetration in the energy mix, due to its high unitary impact in this category and to the high number of outliers in the distribution of hourly share this impact (see Figure 2).
4. Discussion
The full exploitation of LCA aware scheduling is dependent on the availability of reliable data sources, both for the unitary LCA impacts and the electricity productions by technology. First, unitary LCA impacts are represented by static data: an update would only be needed if a new version of the LCA database or LCIA method is released. Second, the missing timestamps and outliers in the ENTSO-E database will need to be preprocessed appropriately. However, this preprocessing reduces the overall number of available samples for models' training, validation, and testing. Forecasting performance can be reasonably improved without these issues.
The availability of data that spans over several years will result in a database of a considerable size. This could enable the use of models characterized by a higher number of learnable parameters, and be able to encapsulate a wider variety of states of the generating processes under study (i.e., the electricity technology mix or the LCA impact of the desired category). The application of the models under study on mature energy markets, such as the DK2's zone in the NordPool grid analyzed in Leerbeck et al. (2020) and Bokde et al. (2021), where the energy generation mix is relatively stable over the years, will benefit from an increase of the database size. Indeed, the stability of the underlying processes over time allows one to fully leverage the increased number of learnable states while keeping the generalization performances on the test set. On the contrary, due the continuous evolution of the Italian technology mix, this market is not stable and an increase in the dataset size (i.e., collecting more years worth of data) may not result in an increase of model performances.
In light of the results reported in Section 3.2, the NN architecture seems to be the one that produces the best results for the forecasting problem, if correctly parameterized. Moreover, it was again surprising that the LR performance was almost in line with NN and even better than RNN. The simplicity of implementing LR models could attract users with moderate risk tolerance toward forecasting errors. However, in the case of very risk adverse users of the LCA Aware Framework, further hyperparameter optimization and dataset preprocessing could lead to improve NN and RNN performances. In the case of LR, the improvement potential would be limited to that related to dataset preprocessing. Finally, it was surprising to see RNN models as the worst performers, as they were specifically developed to deal with time-series. However, the relatively small dataset seems to hinder their performance.
The ETMF approach has three advantages over the DF approach. First, with the sole exception of the RNN for the Climate change total category, ETMF models perform better than the corresponding DF models. This is clear from Figure 5, considering mean, median, and distance between the 25th and the 75th percentiles.
Second, the ETMF approach guarantees increased flexibility and scalability in the choice of the assessed LCA impact indicators. Indeed, the ETMF approach allows for a change of LCA indicators or LCIA methods at any time of the development and application of the LCA Aware Scheduling framework. This is because the ETMF approach leaves this step outside of the data preprocessing phase and limits its implementation to a mere linear combination between the forecast production of each technology with their respective unitary LCA impacts. The DF forecast approach, on the other hand, required selecting the LCIA method and the LCA impact indicators during the preprocessing phase. This approach was not flexible because an update of the LCIA method would result in the need to retrain the model. Moreover, the DF approach was not scalable as the implementation of any additional LCA impact indicator would require the training, validation, and testing of an additional model. However, in our study, the contextual requirement for said flexibility and scalability translated in a more demanding computational burden for the ETMF approach, since it implies the training of a dedicated model for every technology. In contrast, the DF approach requires to train just one model for every LCA category. This is a disadvantage for the DF approach only if the number of forecast LCA impact indicators is higher than the number of technologies considered in the ETMF. Otherwise, the DF approach implied fewer models to train. However, it is worth noting that this should not be a significant issue when considering a possible application in a real environment. The limited size of the models means that the training phase is in the order of minutes (with a computer with CPU Intel i7, a 16 GB RAM, and a NVIDIA 1050Ti GPU), which is a reasonable amount of time if the prediction is needed once a day.
Third, the ETMF approach makes the separate accounting and quantifying the error of the forecast of each technology in the electricity mix possible. This could be useful to debug and improve the forecasting models for each technology. It could also support a prioritization of resources, where those models that were responsible for high shares of the overall forecasting error can be addressed early and adequately for improvement. Therefore, the ETMF can be used to assess the relevance of a technology on the LCA impacts resulting from the technology mix, something that would not be possible with the DF approach.
We recommend the use of the ETMF approach as the advantages of the ETMF approach are not solely dependent on the dataset. However, more comparison studies like the present one are needed to confirm if the superior accuracy of the ETMF model over the DF ones can be generalized. Since the accuracy and reliability of the forecast is the most important parameter for the diffusion of LCA Aware Scheduling, the DF approach should not be abandoned yet. The DF approach could prove to be more accurate for certain datasets or be more convenient for users that do not value avoiding unforeseen burden shifts among impact categories.
It is worth noting that our prediction performances are of the same order of magnitude with the ones obtained by Leerbeck et al. (2020), with a nRMSE in the 0.095–0.183 range reached by the MWA1, 2, MARIMA6, and MWA7 − 24 models that is close to the 0.073 for NN64 (see Supplementary Table S1). However, we highlight that the results are referring to different zones, Italy-North instead of DK2, and therefore cannot be directly compared. For the same reason, we cannot directly compare our results to the forecasts obtained in other studies that focus on other market zones (Hawkes, 2010; Wang et al., 2016; Riekstin et al., 2020; Bokde et al., 2021).
Our findings on the better performance of NN models, and in general, the ETMF approach over their respective DFs cannot be generalized without proof from other datasets with different geographic or temporal boundaries. Conversely, the methodology to select LCA indicators to support the DF approach can be considered valid for other datasets. The fact that the ETMF approach is preferred over the DF approach, even for other datasets, represents the desired advantages of the flexibility and scalability, as well as for the possibility to account and quantify the error of the forecast of each technology in the mix.
Finally, we should highlight a limitation in the ENTSO-E dataset, which we hope could be addressed. In the Italian case study, the gas production is a relevant source of variability, also because two different technologies—Combined Cycle Gas Turbine plants (CCGT) and Open Gas Turbine plants (OGT) are represented under the same “Gas-fossil” label. However, the two technologies provide starkly different functions. Indeed, OGT mainly operates during peak demand hours with high electricity prices, due to their high operational costs and capability to steeply ramp-up and rump-down production. This would not be profitable with CCGT plants, due to the thermal inertia of the combined steam cycle. Hence, they mainly provide the base load production. However, these two technologies are characterized by significantly different LCA impacts per kWh. Using the ecoinvent database (version 3.6, allocation, cut-off by classification) (Wernet et al., 2016), it can be seen that CCGT and OGT technologies show a cradle-to-gate Climate change total impact indicator of 0.46 and 0.78 kg CO2-eq, respectively, when evaluated with the IPCC 2013 method. Therefore, a more detailed data reporting for different technologies could reduce the model's simplification while improving its robustness and accuracy.
5. Conclusion
The present study focused on two aims. First, we aimed to define a methodology to select LCA impact indicators, which was necessary in the DF approach to limit computational effort and issues of unconscious burden-shifting. Second, we aimed at comparing 10 different machine learning models for the forecast of the hourly average LCA impacts due to electricity consumption. The models include LR, two variants of feed-forward neural networks (with 32 or 64 units) and two variants of RNN (with 32 or 64 units). For each of these models, both the ETMF and the DF approaches have been implemented.
Our contribution is three-fold. First, we propose a methodology to select LCA impact indicators in the DF approach, in which the modeling of all the categories of a LCIA method was too computationally heavy. We decided to select two of the 19 ILCD 2.0 2018 midpoint indicators, one of which would be the Climate change total, since it is the most widely used. The first criterion of the methodology directly aims to limit problems of burden shifting across impact categories. Thus, we propose to use the Pearson correlation coefficient between indicators for each hour of the electricity production dataset. Visualization of the correlation between Climate change total and the other indicators was then possible. The second criterion relied on the role of technologies that drive a significant portion of LCA impacts. Investigation of the data points for technologies with high market share proved to be interesting. We suggest the selection of LCA impact indicators for which such data points do not cluster in the correlation graph. Third, we evaluated the relevance of absolute LCA impacts for a certain category within the specific geography of the control zone. Finally, we considered the recommendation level of the LCA impact indicators according to the ILCD classification. Based on the this methodology, we selected the Respiratory effects inorganics impact indicator.
Second, we compared the 10 models and we demonstrated that both for the Climate change total and Respiratory effects, inorganics indicators, the NN64 with ETMF approach was on average the best performing model, with SMAPE values for the test set that are, respectively, 2.83% and 3.08%. This model was least prone to outliers in the daily SMAPE, which leads to a lower average, and it was also more robust. Significantly, the distributions of the daily SMAPE for the feed-forward neural network with 64 units are the ones in which the difference between the 75th and 25th percentiles of the distribution is lower.
Third, we show how the ETMF approach was preferable to the DF one for three reasons. For our dataset, the ETMF models were generally more accurate and robust than the respective DF models. Then, we considered the ETMF more flexible and scalable as the LCIA methods can be changed without model retraining, and it can consider all LCA indicators simultaneously, without adding significant computational effort. Finally, the ETMF approach enables the accounting and quantification of the error of the forecast of each technology in the electricity mix.
In our future work, we aim to apply the outcomes of this work on the best performing forecasting model within a full modeling of LCA Aware Scheduling, to test the potential of LCA impacts reduction within a specific case study. Further developments also include the application of forecasting models on other countries and the inclusion of exogenous variables. To better test the efficiency of NNs for this forecasting task, it would be interesting to evaluate the influence of variables such as the quality of the input parameters, the quantity of available data, the pattern of NNs, the number of neurons, and choice of the training algorithm. Finally, we aim to study the performance of the LCA impacts reduction, within the LCA Aware Scheduling framework, in case the same forecast model is available to several companies with a significant cumulative demand. Consequently, these companies would use the outputs of the forecast to independently reschedule several plants, potentially increasing the distance between forecast and actual LCA impact indicators.
Data availability statement
The datasets analyzed for this study, as well as the Python code to calculate the unitary LCA impacts and the forecasting models are not available in the Supplementary material, due to the significant size of the files. They can be found on GitHub (https://github.com/piepor/LCA-aware-scheduling.git). Interactive HTML graphs are available at the same link.
Author contributions
PP, AV, SC, and DR contributed to the conceptualization of the study, to the methodology, to the formal analysis, and to data presentation. PP and AV curated the data collection, data analysis, and coding for the forecasting models. PP produced metadata for this section of the work. DR set up the Brightway2 model in Python to calculate LCA unitary impacts. PP, AV, SC, and DR contributed to write the manuscript original draft. PP, AV, SC, DR, CB, and JL helped in reviewing the manuscript. SC edited the manuscript. CB, JL, SR, and AB supervised the work. JL and AB were responsible for funding acquisition. AV and SC were responsible for project management. AV particularly for the tasks related to the forecasting models. All authors contributed to the article and approved the submitted version.
Funding
This research is supported by A*STAR under the AME Individual Research Grant (IRG) Thematic Grant Call on Cleaner Manufacturing (Grant No. A20E7c0110). This research is partially supported by the E2COMATION project. E2COMATION has received funding from the European Union's Horizon 2020 research and innovation programme under grant agreement No. 958410.
Conflict of interest
The authors declare that the research was conducted in the absence of any commercial or financial relationships that could be construed as a potential conflict of interest.
Publisher's note
All claims expressed in this article are solely those of the authors and do not necessarily represent those of their affiliated organizations, or those of the publisher, the editors and the reviewers. Any product that may be evaluated in this article, or claim that may be made by its manufacturer, is not guaranteed or endorsed by the publisher.
Supplementary material
The Supplementary Material for this article can be found online at: https://www.frontiersin.org/articles/10.3389/frsus.2022.1037497/full#supplementary-material
Abbreviations
LCA, Life Cycle Assessment; LCI, Life Cycle Inventory; LCIA, Life Cycle Impact Assessment; DLCI, Dynamic Life Cycle Inventory; DF, Direct Forecasting; ETMF, Electricity Technology Mix Forecasting; ILCD, International Reference Life Cycle Data System; LR, Linear Regression; NN, Feed-forward Neural Network; RNN, Recurrent Neural Network; NN32, Neural Network with 32 nodes; NN64, Neural Network with 64 nodes; RNN32, Recurrent Neural Network with 32 nodes; RNN64, Recurrent Neural Network with 64 nodes; SMAPE, Symmetric Mean Absolute Percentage Error; nRMSE, Normalized Root Mean Squared Error; RI, Relative Importance; CCGT, Combined Cycle Gas Turbine plants; OGT, Open Gas Turbine plants.
References
Berger, M., and Finkbeiner, M. (2011). Correlation analysis of life cycle impact assessment indicators measuring resource use. Int. J. Life Cycle Assess. 16, 1735–1780. doi: 10.1007/s11367-010-0237-7
Bokde, N. D., Tranberg, B., and Andresen, G. B. (2021). Short-term CO2 emissions forecasting based on decomposition approaches and its impact on electricity market scheduling. Appl. Energy 281:116061. doi: 10.1016/j.apenergy.2020.116061
Brondi, C., Cornago, S., Piloni, D., Brusaferri, A., and Ballarino, A. (2019). “Application of LCA for the Short-Term Management of Electricity Consumption, Chapter 4,” in Life Cycle Assessment of Energy Systems and Sustainable Energy Technologies. Green Energy and Technology, eds R. Basosi, M. Cellura, S. Longo, and M. Parisi (Cham: Springer), 45–59. doi: 10.1007/978-3-319-93740-3_4
Brown, T. B., Mann, B., Ryder, N., Subbiah, M., Kaplan, J., Dhariwal, P., et al. (2020). “Language models are few-shot learners,” in NIPS'20: Proceedings of the 34th International Conference on Neural Information Processing Systems (Vancouver, BC), 1877–1901.
Cornago, S., Tan, Y. S., Brondi, C., Ramakrishna, S., and Low, J. S. C. (2022). Systematic literature review on dynamic life cycle inventory: towards industry 4.0 applications. Sustainability 14, 1–22. doi: 10.3390/su14116464
Cornago, S., Vitali, A., Brondi, C., and Low, J. S. C. (2020). Electricity technological mix forecasting for life cycle assessment aware scheduling. Proc. CIRP 90, 268–273. doi: 10.1016/j.procir.2020.01.099
D'Agostino, R., and Pearson, E. S. (1973). Tests for departure from normality. Empirical results for the distributions of b2 and . Biometrika 60, 613–622. doi: 10.1093/biomet/60.3.613
Dandres, T., Farrahi Moghaddam, R., Nguyen, K. K., Lemieux, Y., Samson, R., and Cheriet, M. (2017). Consideration of marginal electricity in real-time minimization of distributed data centre emissions. J. Clean. Prod. 143, 116–124. doi: 10.1016/j.jclepro.2016.12.143
Dandres, T., Langevin, A., Walzberg, J., Abdulnour, L., Riekstin, A. C., Margni, M., et al. (2020). Toward a Smarter Electricity Consumption. Technical Report, ETS, Synchromedia, Polytechnique Montreal Technological University, CIRAIG.
Denholm, P., O'Connell, M., Brinkman, G., and Jorgenson, J. (2015). Overgeneration from Solar Energy in California: A Field Guide to the Duck Chart. Technical Report, National Renewable Energy Laboratory. doi: 10.2172/1226167
Ecoinvent (2019). Ecoinvent Database. Available online at: https://www.ecoinvent.org/
Elzein, H., Dandres, T., Levasseur, A., and Samson, R. (2019). How can an optimized life cycle assessment method help evaluate the use phase of energy storage systems? J. Clean. Prod. 209, 1624–1636. doi: 10.1016/j.jclepro.2018.11.076
ENTSO-E (2019). European Network of Transmission System Operators for Electricity - Transparency Platform.
Fazio, S., Castellani, V., Sala, S., Schau, E., Secchi, M., Zampori, L., et al. (2018). Supporting Information to the Characterisation Factors of Recommended EF Life Cycle Impact Assessment Method. Technical Report, JRC.
Hawkes, A. (2010). Estimating marginal CO2 emissions rates for national electricity systems. Energy Policy 38, 5977–5987. doi: 10.1016/j.enpol.2010.05.053
Hochreiter, S., and Schmidhuber, J. S. (1997). Long short-term memory. Neural Comput. 9, 1735–1780. doi: 10.1162/neco.1997.9.8.1735
Hornik, K., Stinchcombe, M., and White, H. (1989). Multilayer feedforward networks are universal approximators. Neural Netw. 2, 359–366. doi: 10.1016/0893-6080(89)90020-8
Kopsakangas-Savolainen, M., Mattinen, M. K., Manninen, K., and Nissinen, A. (2017). Hourly-based greenhouse gas emissions of electricity - cases demonstrating possibilities for households and companies to decrease their emissions. J. Clean. Prod. 153, 384–396. doi: 10.1016/j.jclepro.2015.11.027
Laurent, A., and Espinosa, N. (2019). Environmental impacts of electricity generation at global, regional and national scales in 1980–2011: What can we learn for future energy planning? Energy Environ. Sci. 8, 689–701. doi: 10.1039/C4EE03832K
Leerbeck, K., Bacher, P., Junker, R. G., Goranović, G., Corradi, O., Ebrahimy, R., et al. (2020). Short-term forecasting of CO2 emission intensity in power grids by machine learning. Appl. Energy 277, 1–13. doi: 10.1016/j.apenergy.2020.115527
Mathiensen, B. V., Münster, M., and Fruergaard, T. (2009). Uncertainties related to the identification of the marginal energy technology in consequential life cycle assessments. J. Clean. Prod. 17, 1331–1338. doi: 10.1016/j.jclepro.2009.04.009
Milovanoff, A., Dandres, T., Gaudreault, C., Cheriet, M., and Samson, R. (2018). Real-time environmental assessment of electricity use: a tool for sustainable demand-side management programs. Int. J. Life Cycle Assess. 23, 1981–1994. doi: 10.1007/s11367-017-1428-2
Parliament and of the European Union. (2009). Directive 2009/28/EC on the Promotion of the Use of Energy from Renewable Sources. Technical Report, EU.
Pham, H., Dai, Z., Xie, Q., Luong, M.-T., and Le, Q. V. (2020). “Meta pseudo labels,” 2021 IEEE/CVF Conference on Computer Vision and Pattern Recognition (CVPR) (Nashville, TN). doi: 10.1109/CVPR46437.2021.01139
Riekstin, A. C., Langevin, A., Dandres, T., Gagnon, G., and Cheriet, M. (2020). Time series-based GHG emissions prediction for smart homes. IEEE Trans. Sustain. Comput. 5, 134–146. doi: 10.1109/TSUSC.2018.2886164
Rolnick, D., Donti, P. L., Kaack, L. H., Kochanski, K., Lacoste, A., Sankaran, K., et al. (2022). Tackling climate change with machine learning. ACM Comput. Surv. 55, 1–96. doi: 10.1145/3485128
Roux, C., Schalbart, P., and Peuportier, B. (2016). Accounting for temporal variation of electricity production and consumption in the LCA of an energy-efficient house. J. Clean. Prod. 113, 532–540. doi: 10.1016/j.jclepro.2015.11.052
Rovelli, D., Cornago, S., Scaglia, P., Brondi, C., Low, J. S. C., Ramakrishna, S., et al. (2021). Quantification of non-linearities in the consequential life cycle assessment of the use phase of battery electric vehicles. Front. Sustain. 2:631268. doi: 10.3389/frsus.2021.631268
Schaubroeck, T., Schaubroeck, S., Heijungs, R., Zamagni, A., Brand, M., and Benetto, E. (2021). Attributional and consequential life cycle assessment: definitions, conceptual characteristics and modelling restrictions. Sustainability 13:7386. doi: 10.3390/su13137386
Shimako, A. H., Tiruta-Barna, L., Bisinella de Faria, A. B., Ahmadi, A., and Spérandio, M. (2018). Sensitivity analysis of temporal parameters in a dynamic LCA framework. Sci. Total Environ. 624, 1250–1262. doi: 10.1016/j.scitotenv.2017.12.220
Sohn, J., Kalbar, P., Goldstein, B., and Birkved, M. (2020). Defining temporally dynamic life cycle assessment: a review. Integr. Environ. Assess. Manag. 16, 314–323. doi: 10.1002/ieam.4235
Sotos, M. (2015). An Amendment to the GHG Protocol Corporate Standard GHG Protocol Scope 2 Guidance. Technical Report, Greenhouse Gas Protocol, World Resources Institute.
Sowiński, J. (2019). Model of medium-term forecasting of energy mix in Poland. E3S Web Conf. 108, 01002. doi: 10.1051/e3sconf/201910801002
Tranberg, B., Corradi, O., Lajoie, B., Gibon, T., Staffell, I., and Andresen, G. B. (2019). Real-time carbon accounting method for the European electricity markets. Energy Strat. Rev. 26, 100367. doi: 10.1016/j.esr.2019.100367
Treyer, K., and Bauer, C. (2016). Life cycle inventories of electricity generation and power supply in version 3 of the ecoinvent database-part II: electricity markets. Int. J. Life Cycle Assess. 21, 1255–1268. doi: 10.1007/s11367-013-0694-x
Wang, C., Wang, Y., Miller, C. J., and Lin, J. (2016). “Estimating hourly marginal emission in real time for pjm market area using a machine learning approach,” in 2016 IEEE Power and Energy Society General Meeting (PESGM) (Orland, FL), 1–5. doi: 10.1109/PESGM.2016.7741759
Wernet, G., Bauer, C., Steubing, B., Reinhard, J., Moreno-Ruiz, E., and Weidema, B. (2016). The ecoinvent database version 3 (part I): overview and methodology. Int. J. Forecast. 21, 1218–1230. doi: 10.1007/s11367-016-1087-8
Weron, R. (2014). Electricity price forecasting: a review of the state-of-the-art with a look into the future. Int. J. Forecast. 30, 1030–1081. doi: 10.1016/j.ijforecast.2014.08.008
Woschnagg, E., and Cipan, J. (2004). Evaluating Forecast Accuracy. Technical Report, University of Vienna.
Keywords: life cycle assessment, machine learning, electricity, forecasting, dynamic life cycle inventory, dynamic LCA, scheduling
Citation: Portolani P, Vitali A, Cornago S, Rovelli D, Brondi C, Low JSC, Ramakrishna S and Ballarino A (2022) Machine learning to forecast electricity hourly LCA impacts due to a dynamic electricity technology mix. Front. Sustain. 3:1037497. doi: 10.3389/frsus.2022.1037497
Received: 05 September 2022; Accepted: 14 October 2022;
Published: 11 November 2022.
Edited by:
Mario Martín Gamboa, Rey Juan Carlos University, SpainReviewed by:
Mo Li, General Dynamics Information Technology, Inc., United StatesFlavio Scrucca, Italian National Agency for New Technologies, Energy and Sustainable Economic Development (ENEA), Italy
Copyright © 2022 Portolani, Vitali, Cornago, Rovelli, Brondi, Low, Ramakrishna and Ballarino. This is an open-access article distributed under the terms of the Creative Commons Attribution License (CC BY). The use, distribution or reproduction in other forums is permitted, provided the original author(s) and the copyright owner(s) are credited and that the original publication in this journal is cited, in accordance with accepted academic practice. No use, distribution or reproduction is permitted which does not comply with these terms.
*Correspondence: Simone Cornago, c2ltb25lLmNvcm5hZ29AdS5udXMuZWR1