 Sven G. Sommer
 Leif Knudsen
- 1Faculty of Technical Sciences, Department of Biotechnology and Chemical Engineering, Aarhus University, Aarhus, Denmark
- 2SEGES, Aarhus, Denmark
Reduction of nitrate (NO3) and ammonia (NH3) emission to the environment has, since the 1980s, been targeted by Danish environmentally friendly regulations. Nitrate pollution of aquifers and surface waters caused by farming was observed at the start of the 1980s, and in the mid-1980s, NH3 emission was known to contribute reactive nitrogen (N) to the environment. Manure is a significant source of plant nutrient loss, because there might be a lack of economic incentives and knowledge for the farmers to obtain a high nutrient utilization of the manure. This article gives a presentation of the initiatives and regulations intended to reduce the emission, the actual reduction in emission achieved, and the effect of the regulation on farmers' economy, which is considered important in the discussion about how we can reduce pollution of the environment and at the same time have an economically sustainable agriculture. In the 1980s, the Ministry of Environment and the farmers' union agreed on launching a “good agricultural practice” program, aimed at reducing N loss by increasing N use efficiency and reducing fertilizer N import. This had no or limited effect on emission, and in the late 1980s, regulations were introduced with mandatory stipulations on manure storage capacity, application of manure during the growing season, and limitation on the number of animals per hectare agricultural land (Harmony Rules). Early introduction of the Harmony Rule in 1985 has since prevented very high local surpluses of N and phosphorus. In 1993/94, legislation was introduced for a system of farm-specific N quotas and minimum requirements for utilization of N in animal manure, controlled by the Ministry of Agriculture and Environment based on fertilizer accounts for each farm. The legislation requirements for utilization of N in manure were based on research at the universities and a large number of trials on commercial farms conducted by the Danish extension service (SEGES). These convinced most farmers of the potential manure N fertilizer efficiency. From 1993/94, the N quotas were based on optimal N levels to the crops, but from 1998/99 to 2016/17, they were reduced to 10–20% below the economically optimal rate. From 2016/17, the reduced N quotas were replaced by an expansion of the catch crop requirement in the legislation. The effect is that leaching has been reduced by 45% by restricting manure application to the period with crop demand for plant nutrients, by undersupplying with N as related to the economically optimum application rate, and by compulsory cultivation of crops that take up N during most of the year. Regulation has resulted in a 51% reduction in NH3 emission from livestock buildings, manure stores, and manure application. In 2020/21, the required N fertilizer efficiency of manure N (equivalence to N in mineral fertilizers) is 75% of N in cattle slurry and 80% for pig slurry, higher than in any other countries known to us. The N quotas are based on the optimal level, and the requirement for compulsory catch crops is 40–50% for the main part of the country. The farmers can use alternatives to catch crops like a reduced N quota or early establishment of winter cereals. The revision of the “regulation system” was intended to improve the economy of the crop production, but the effect was that complexity and volume of legislation have increased significantly, without much effect on farmers' economy. It is recommended that the regulation is kept simple and that it reflects the processes leading to plant uptake and emissions.
Introduction
Livestock manures represent a valuable resource, which can increase crop yield significantly, help maintain soil fertility, and replace significant amounts of chemical fertilizers. Used incorrectly, manure is a major source of air pollution and a threat to aquifers and surface waters in areas with a high density of livestock (Steinfeld et al., 2006; Sutton et al., 2013). The concentration of plant nutrients and organic matter in manure is low; the costs related to the handling of the manure to avoid loss of nutrients can therefore be higher than the cost of buying mineral fertilizer. Consequently, manure is often mismanaged and is a source of pollutants to air, ground, and surface waters.
Nitrogen (N) in animal manure is in inorganic ammonium () and organic forms, and the N fertilizer value is lower and more variable than in commercial fertilizers. Manure organic N has to be mineralized before it is available to plants, and this transformation takes place both during and outside the crop growing season. For the farmer, it is important to know the availability of the manure N to crops during the growth season to ensure that the right amount of manure and supplementary mineral fertilizer is added to the field in order to avoid overfertilization and reduce leaching losses.
Until the 1980s, liquid manure overflow from stores was discharged directly to surface waters, a procedure that was lethal to fish due to the content of ammonia (NH3), which caused eutrophication and depletion of oxygen (Anonymous, 1984). The increased field application of N in manure and mineral fertilizer (Figure 1) increased the amount of N emission to coastal waters, causing several incidences of algal blooms, anoxic conditions, and fish kills. Agriculture contributed 70% of the total N input to Danish coastal waters in 2007–2011 (Dalgaard et al., 2014) and leaching and runoff of nitrate (NO3)-contaminated groundwaters.
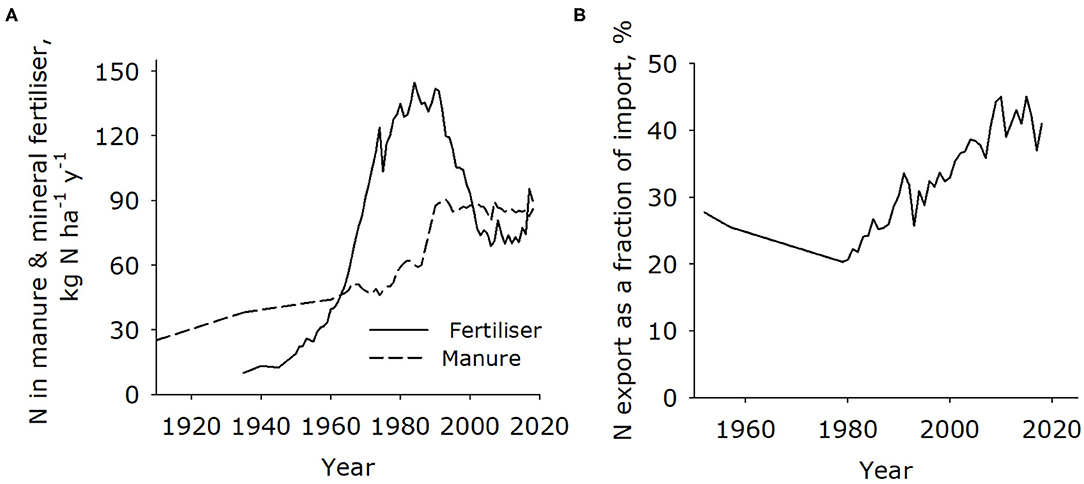
Figure 1. Nitrogen use and balances in Danish agriculture. (A) Mineral fertilizer and manure N application to fields from 1910 till 2010 (Statistics Denmark, 1910-2006; Blicher-Mathiesen et al., 2019). (B) N use efficiency presented as N exported in products as a percentage of N imported in fertilizer and feed (Kyllingsbæk, 1995, 2005; Vinther and Olsen, 2011; Blicher-Mathiesen et al., 2019).
Emission inventories show that livestock housing, manure stores, and applied manure contributed 70–80% of the anthropogenic NH3 emissions in Denmark and Europe (Beusen et al., 2008; Amann et al., 2013). In the atmosphere, NH3 readily forms particles, which can be a health hazard (Wang et al., 2017; Giannadaki et al., 2018), and deposition of particulate and gaseous NH3 may cause eutrophication of natural ecosystems (Duce et al., 2008).
Since the mid-1980s, the loss of N to the environment from farming has been reduced by increasing plant uptake, reducing overfertilization, and improving the efficiency of manure recycling—a trend driven by a combination of agronomic and environmental concerns.
Denmark is often referred to as a country that has successfully managed to reduce pollution from agriculture. This review assesses this by linking the methods used with the aim to reduce pollution to the reduction in NO3 and NH3 emissions and to the concentration of N in recipient waters. The costs to farmers are also presented.
Recognizing Pollution Caused by Agriculture
At the beginning of the twentieth century, most N in agriculture originated from N fixation in leguminous plants. Some of this N was ingested by grazing livestock, and N excreted in animal houses provided manure for plant production (Dalgaard et al., 2014). Negligible amounts of fertilizer were used in Danish agriculture up to the mid-twentieth century (Figure 1). Nitrogen fertilizer consumption increased from 1960 due to a reduction in cost, and to some extent animal manure became a waste product. Lack of storage capacity, unpredictability, and poor knowledge of the manure N fertilizer efficiency led to an oversupply of mineral fertilizer, which was reflected in the surplus use of N in relation to crop demand being larger in regions with dense livestock production than in regions with little livestock production (Sommer, 1982).
In the 1980s, time series studies showed increases in NO3 concentrations in rivers (Hagebro et al., 1983), in groundwater (Anonymous, 1983), and ammonium () in rainwater (Sommer, 2013) (Table 1). This caused a steady growth in the extent and persistence of eutrophic, hypoxic, and anoxic coastal waters during the 1980s. The observation of dead lobsters in the sea of Kattegat in 1986 triggered the political decision to instigate the Action Plan on the Aquatic Environment I (Vandmiljøhandlingsplan I) in 1987, which aimed to enforce a 50% reduction in leaching of N from agriculture.
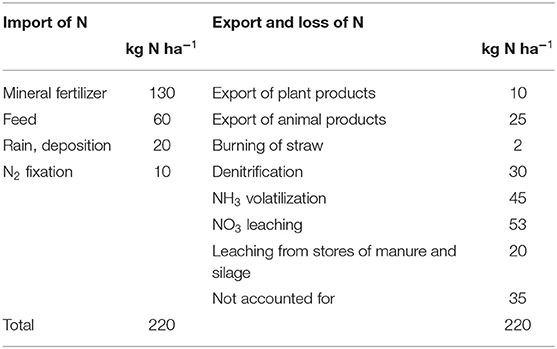
Table 1. Mass balance of N in Danish agriculture, 1981–1982 (Anonymous, 1984).
The Danish Environmental Protection Agency published in 1984 the NPO report (Anonymous, 1984) about fluxes of nitrogen (N), phosphorous (P), and organic matter (O) to ground and surface water, which showed that N losses from farming were the largest source of N to the environment (Table 1) and that wastewater was the largest source of P to surface waters. This report provided information about methods to reduce the pollution and the knowledge needed for developing regulation of agriculture and wastewater treatment. In 1985, the NPO research program provided more information about NO3 and P leaching and NH3 volatilization from agriculture, and it contributed to an understanding of fluxes of nutrients (Dyhr-Nielsen et al., 1991).
Direct discharge of manure to surface waters was forbidden in 1949 but was not controlled, and in 1980, much of the N from manure was discharged (Andersen and Jensen, 2019) or slurry applied to frozen soils, causing surface runoff in spring. In 1982, new regulations banned direct discharge of manure to recipients and application of manure to frozen soils, and this improved water quality by 25% in regions where officials controlled the adherence to the regulations by livestock farmers (unpublished information, S.G. Sommer). In 1985, the parliament implemented the NPO action plan, in which the two most important elements were the requirement for 6 months' manure storage capacity and the Harmony Rules. The 6-month storage capacity meant that manure could be applied in the crop growing period, and the Harmony Rules required a minimum of land for spreading animal manure per livestock unit, which gave a balance between supply of nutrients with animal manure and the removal of nutrients by the crops. There was an agreement between the farmers' union and the government that good agricultural practice would make management of manure and mineral fertilizers significantly more efficient and lead to a reduced flux of N and P to the environment—the slogan “manure is as good as gold” (in Danish: gylle er guld) was coined by the farmers' extension service (SEGES).
These initiatives did not result in an improved environment, and this led to the Action Plan on the Aquatic Environment I (Vandmiljøplan I) in 1987, requiring N leaching to be reduced by 50%. The requirement for storage capacity was increased to 9 months for most farms, and it was mandatory for each farm to establish plans for crop rotation and use of fertilizers, and these should include a minimum area of fields to be grown with “winter-green crops,” i.e., catch crops, winter cereals, and crops with a high N uptake in autumn.
New regulations aiming at reducing pollution from agriculture are built on research, field trials, and experience carried out by the extension service with a focus on improving manure management and introducing crop rotations that reduce leaching. The farmers' association (Landbrug og Fødevarer) and the farmer-owned extension service (SEGES) have, since 1983, had a focus on improving uptake of N from animal manure, and this included the research and demonstration program entitled “Action plan for better utilization of N in animal manure,” which was financially supported by the government.
The goal of reducing N leaching by 50% was not fulfilled by the start of the 1990s, and the government launched the “Plan for sustainable Agriculture” in 1992. Application of liquid manure from harvest till spring was prohibited, with the exception of grass and winter oilseed rape to which manure can be applied until October 1. Maximum N quotas for application of mineral fertilizer and manure N were assigned at farm level, and there were requirements for a minimum utilization of N in animal manure, which was controlled through the annual mandatory fertilizer plans and accounts made by farmers and submitted to the authorities.
The 50% N leaching reduction goal was not reached, and anoxic coastal waters led in 1997 to the Action Plan on the Aquatic Environment II. This resulted in rules that, for example, set N quotas 10% below the economically optimal amount of fertilizer N for crop yield production, a new demand that catch crops should be grown on at least 6% of the farmed area, and requirement for greater utilization efficiency of N in animal manure. Establishing wetlands and planting more forest were also part of the plan. In 2002, the NO3 leaching was reduced to 50% of the 1987 level, and the Action Plan on the Aquatic Environment III was introduced in 2003 with the aim of reducing N leaching by an additional 13%. Farmers were required to increase the utilization of N in animal manure, introduce more catch crops, and establish wetlands.
From 2009, the regulation has focused on fulfilling the demands in the EU Water Framework Directive (EU, 2020), and the focus changed from reducing N leaching from the root zone to targeting N fluxes to coastal water, i.e., 30% of N leached from the root zone reaches coastal waters, while 70% is denitrified during the transport through ground or surface water (Højberg et al., 2015). The new concept led to the “Green Growth Plan” in 2009 where the N flow to coastal water was set to be reduced by 9,000 tons, corresponding to a 15% N flow reduction. The methods consisted of an increase in catch crop area, buffer zones along streams, wetlands, and revisions of N use regulations. In 2014, the “Water Plan I” changed the concept from identical regulations throughout the country to a more locally targeted regulation based on the sensitivity of the recipients according to the principles in the EU Water Framework Directive (EU, 2020), and this led to an expansion in the area needed for catch crops to 140,000 ha. The demands for buffer zones along streams, greater use of catch crops, and a suboptimal N quota were heavily opposed by farmers, and in 2016, the government launched the “Feed and Agricultural Plan,” in which the N quotas were increased to an economically optimal level—corresponding to a 25% increase in fertilizer N allowance and no buffer strips, and the targeted catch crops were subsidized.
The 2019 Regulation: Environmentally Friendly Agriculture
The regulations concerning agricultural production are laid down by law to fulfill objectives in the Nitrates and Water Framework Directive and to meet the good ecological condition stipulated for coastal waters (EU, 2020). The EU has set a ceiling for NH3 emission, which for Denmark must be below 60,000 t NH3-N year−1 (EP, 2016). This section provides an overview of the regulation applicable in Denmark in 2019/2020 (Anonymous, 2020).
Harmony Rules
Since 1986, there has been a minimum requirement for the land area needed for application of animal manure (Table 2). The intention is to limit excessive applications of plant nutrients. In 2017, the regulation was changed from a limit on the size of the livestock units per hectare per year to a limit on the rate of manure applied per hectare per year as determined by its N and P contents. From standard values of nutrients excreted by the different animal types (Table 2), the land requirement for spreading manure can be calculated.
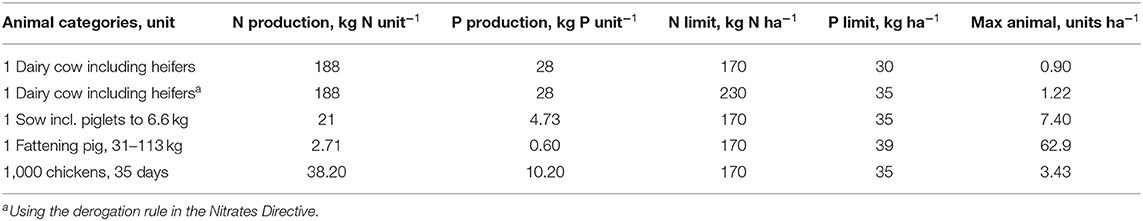
Table 2. Annual amount of N leaving storages for main livestock categories and maximum number of animals (units) per hectare to fulfill the limits for application of N and P.
At farm level, the amount of N supplied in animal manure to fields must not exceed 170 kg N ha−1 year−1 in accordance with the EU Nitrates Directive (Landbrugsstyrelsen, 2019) and 230 kg N ha−1 year−1 on farms where two-thirds of N is in cattle manure and the crop cover is a minimum of 80% beets, grass, grass undersown in cereals, or catch crops (autumn and winter). These fields must be owned or rented by the farm or by nearby farms with whom there is a signed agreement for applying the slurry within the regulations given by law. From 2018/19 to 2022, limits for application of P in manure, fertilizer, or organic waste have been introduced (Table 3), and if soil P is low in a field, then more P can be applied.
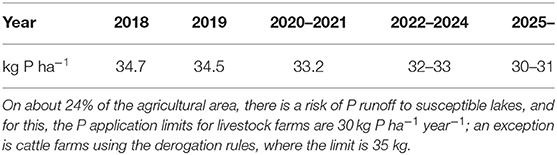
Table 3. P Harmony Rules in the form of average limits for P application to fields.
Manure Storage Capacity and Restriction in Time and Techniques for Manure Application
In Denmark, there is a surplus of precipitation in winter and limited or no N uptake by crops; consequently, N is leached out of the root zone at rates affected by the concentration in late autumn. Therefore, regulations have focused on reducing in soils in late autumn. From 1986 to 1993, manure application to bare soil in autumn was forbidden, and in 1993, liquid manure application to winter cereals in autumn was also prohibited due to the low uptake of N in autumn by winter cereals. From 2019/2020, no liquid manure can be applied to fields after harvest, except to grass or winter oilseed rape until October 1. Solid manure can be applied in autumn to fields before sowing winter crops and to bare soils from October 20 to November 15. In consequence, 92% of liquid manure was spring-applied in 2018, increasing from 55% in 1990 (Blicher-Mathiesen et al., 2019).
Sufficient manure storage capacity is a prerequisite for complying with this regulation, and in 1993, the requirement was a minimum 9-month storage capacity or 6 months on farms where late application of manure was acceptable within the limits of manure application rules. The requirement for storage capacity did not increase in 1993, nor in 2018, because storage capacity for 81% of the manure was more than 9 months, which was an increase from 38% in 1990 (Blicher-Mathiesen et al., 2019). Requirement regarding application technique is implemented primarily to reduce NH3 emission, but it is important that with trail hose or injection application, the slurry is distributed evenly and cereal lodging is avoided. Simple and cheap broadcasting spreads the manure unevenly, and since 2002, this technology has been banned and replaced by the trail hose application technology. The requirements have since been further tightened, and from 2019/20, slurry must be applied by injection to grassland and bare soils. Alternatively, acidified slurry may be applied with trail hoses to grassland, but acidified slurry must be injected to bare soil. Adding acid may take place in animal houses, during storage or while applying the liquid manure.
Minimum Requirements for Utilization of N in Animal Manure
The right timing of manure application and use of efficient application technologies increase the N use efficiency of manure N and reduce the mineral N fertilizer use. To force farmers to reduce their addition of mineral N to crops, a minimum requirement for N use efficiency (RNU) of animal manure was introduced in the legislation in 1993/1994, and there were set limits to the total amount of “efficient N” and fertilizer N application to fields, i.e., the farm N quota. Each spring, the requirements for plant-available N in manure and mineral fertilizer are calculated for the farm, with the amount of plant-available N in manure calculated as the product of the total amount of manure N applied to fields with the required N use efficiency (Table 4 and Figure 2; see the Requirement for Using Catch Crops and Restriction in Soil Tillage section for the procedure for calculating the N quota and use of manure and mineral fertilizer on a farm). The sum of plant-available manure N and fertilizer N applied in the fields owned or rented by the farm must not exceed the farm's quota of N.
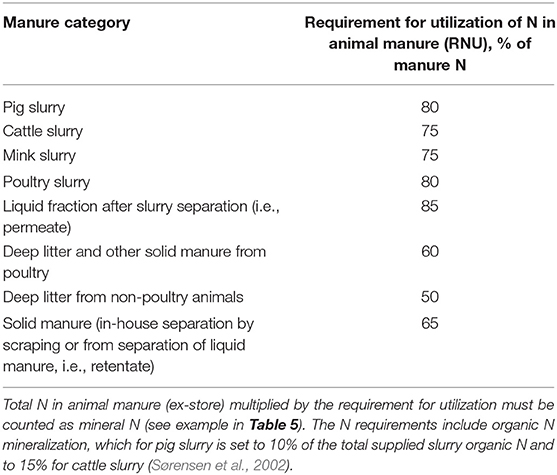
Table 4. Requirement for N utilization (RNU) of N in animal manure.
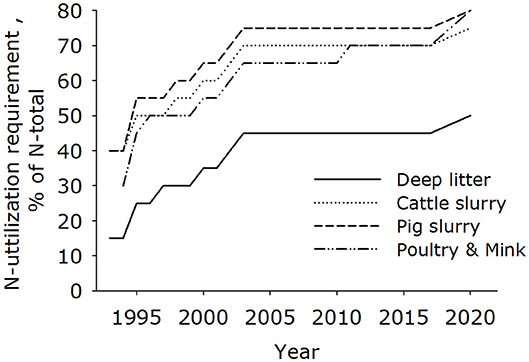
Figure 2. Requirement of N utilization (RNU) in Danish law for a range of animal manures. The requirements include the first-year and long-term effects of N in animal manure. Data from Anonymous (2015, 2017).
The amount of manure applied to fields is calculated with national manure norms for all relevant housing systems and manure categories. The national norms for N and P in manure transported from stores are given for each category of animal at a certain production level (e.g., milk yield, slaughtering weight, and protein in feed). A farmer can correct the national norms using correction factors for a given production level. The manure collected in the different housing systems is calculated with a dynamic model, which in the calculation includes excretion and addition of water in the animal building. The model then calculates losses of NH3 during storage in the house and in outside stores, calculates dry matter loss due to organic matter transformation to carbon dioxide and methane and denitrification loss, and deducts these emissions from the amount excreted. Further precipitation and evaporation during storage are included in the calculation of the amount of manure.
The amount of N on a farm may be reduced by export of manure to biogas plants or to fellow farmers having a need for the plant nutrients. According to the “circular economy regulations,” incineration of untreated animal manure is not allowed. An exemption from this rule is incineration of the retentate from separated slurry that has been digested in a biogas plant.
The requirement for utilization of N in animal manure expressed as requirement for N utilization (RNU) is given for different categories of manure and animals (Table 4). The RNU has gradually been increased from the introduction in 1993/94 to 2020/21 (Figure 2) due to reduced NO3 leaching losses and NH3 volatilization, and a more even distribution of manure on fields. These requirements are the highest in the European Union (Klages et al., 2020). In practice, farmers apply manure to different crops on the farm; therefore, an average requirement for utilization is given for the farm.
The requirement for N utilization is equivalent to the concept of calculating the percentage utilization obtained from field trials carried out by SEGES and Aarhus University, which is given as the amount of N in mineral fertilizer that can be replaced by 100 kg of total N in animal manure to give the same yield or N uptake. Still, the RNU is higher than the mineral fertilizer equivalent (), because the estimated fertilizer effect of mineralized organic N in applied manure is included in the RNU (Table 4).
Until 2020, the requirement for N utilization was equivalent to the mineral fertilizer efficiency measured in trials and could be obtained by a good agricultural practice. The increase in the requirement in 2020/21 makes it difficult to reach the RNU in practice, and the new rules may result in an under-fertilization (Figure 3).
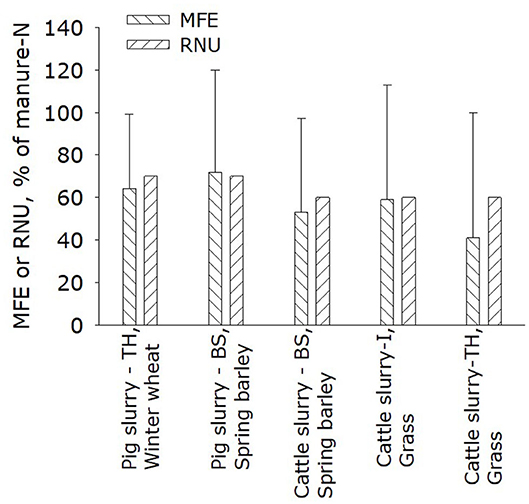
Figure 3. Summary of trials with slurry from 1989 to 1996. Mineral fertilizer equivalent (MFE) calculations include error bars showing standard deviation (data from Pedersen, 1996). TR, trailing hoses; I, injected; BS, broadspread. Slurry applied before sowing spring barley was broadspread and harrowed down quickly. Today, slurry applied to bare soil must be injected, trailing hose application of untreated slurry to grass is banned, and the slurry applied to grass must now be injected or acidified if using a trailing hose. The bars without error bars represent the requirement for N utilization (RNU) in the legislation in 2020/21, which excluded the long-term effect of mineralization of organic N in slurry.
Maximum Quotas for Supply With N at Farm Level
Oversupply with N has been prevented since 1993/1994 by limiting (quotas) the amount of N that a farmer may apply to the fields. These quotas have, since 2020/2021, been revised every 3 years. The quota is set according to a protocol made by a board appointed by the government and with members from the Ministries of Agriculture and Environment, the universities, and SEGES (Anonymous, 2018). The board must set the economically optimal N norms for each crop. The Ministry can reduce these economical N norms and decide to include different N quotas in the legislation.
For each of the main crops, the economically optimal N application is estimated using data from field trials where yield response related to N application rates is measured, and the calculation includes the average price for crops and N in mineral fertilizers for the last 5 years. The target is the N application level at which the cost of using an additional amount of N is equal to the increased value of the yield. For cereals, grass, and maize, the value of the protein content is included in the calculation. In addition to calculating the economically optimal N application for the current crop, the residual effect of N for the following crop is also calculated. The quotas for each crop are calculated for six soil types at a standard yield for each crop. The quotas express the optimal N application rate on fields without residual effect of N from application of manure in the preceding years. Farmers can increase the N quota, if they have documentation for a higher average yield for the last 5 years than the estimated standard crop yield.
The maximum fertilizer use allowed on the farm is calculated from the total N quota for the farm given by the distribution of crops and soil type minus the manure requirement for N utilization (RNU), the residual N effect of catch crops, and a correction for not having the required area with catch crops (see Table 5). Each farmer must annually submit a fertilizer account to the Ministry. In this account, the N quota, the use of mineral N, the crop production, use and requirement for utilization of N in animal manure, and the balance between the farm quota and actual use of N are reported. Fertilizer retailers must report to the Ministry the sale of fertilizer to each farmer, so the Ministry can verify the farmer's data for use of fertilizer. The farmer's calculation of N in animal manure can be verified with data from, e.g., slaughterhouses and dairies. Farms where the quota is exceeded will be fined, and EU subsidy by cross compliance may be reduced.
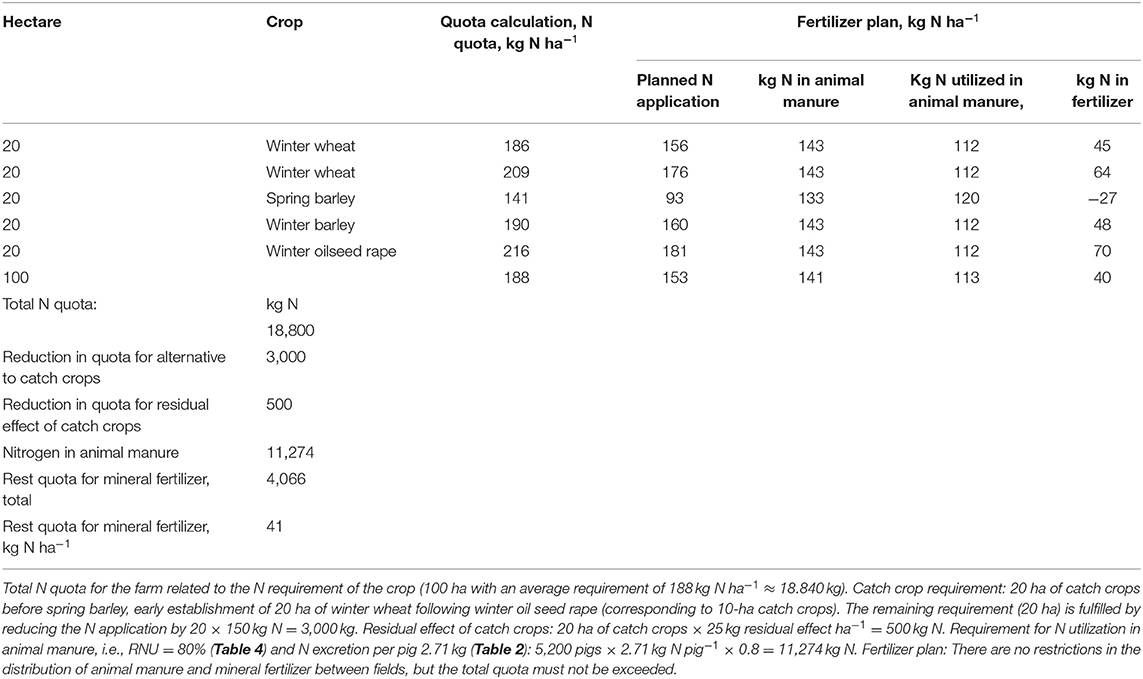
Table 5. A simplified example on how to calculate the need for catch crop and highest acceptable use of mineral fertilizer N on a farm producing 5,000 fattening pigs (31–113 kg) with 100-ha sandy loam fields and a catch crop requirement at 50%.
In 1999, the N quotas to crops were reduced to 10% below the economically optimal N addition rates, because the effect on yield and quality of the crops was perceived to be limited—an assumption based on evaluation of 1-year N field trials. From 1999 to 2015, under-fertilization increased to 20%, because the total quota for all Danish farms was set 10% lower than the total economically optimal quota in 1998 (Figure 4). This increase in under-fertilization was due to an increase in the economically optimal N application rate caused by increasing yield potential and higher prices on protein. In addition, the termination of the EU set-aside scheme in 2007/08 resulted in an increased cropping area and a need for a higher total optimal N quota for the country, which was not given, and this meant a higher reduction percentage to 10% below the 1998 quota.
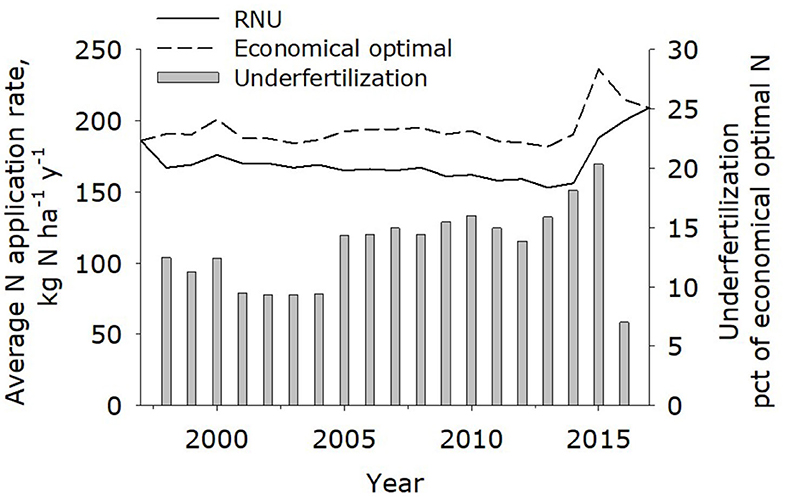
Figure 4. The requirement for N utilization (RNU) and the economically optimal N application rates from 1994 to 2017. The relative under-fertilization due to an RNU in relation to the optimal N application level is given for winter wheat. Data from Landbrugsstyrelsen (2019).
In 2016/17, the under-fertilization was stopped (Anonymous, 2015), and the resulting increase in NO3 leaching due to increased quotas should be counteracted by a requirement for more catch crops. In addition, the rules were made more individual, and this means that farmers can choose between alternatives to the requirements for catch crops.
Requirement for Using Catch Crops and Restriction in Soil Tillage
From 1990, regulations stipulated that 65% of Danish fields should be covered by a crop during winter, a demand met using winter cereals that were included in the list of winter crops. In 1998/99, it was realized that winter cereals sown in autumn did not significantly reduce NO3 leaching during winter, and it was decided that farmers should grow catch crops (undersown grass, cruciferous) covering soil in autumn/winter and efficiently reducing NO3 leaching and that these should account for 6% of the area of cereals, oilseed rape, and other crops with a short growing season, increasing to 10% for farms with <0.8 livestock units ha−1 and 14% for farms with more than 0.8 livestock units ha−1.
The catch crop rules were revised in 2015 with a focus on fulfilling the EU Water Framework Directive (EU, 2020) to obtain Good Ecological Status in the waterbodies. With the use of model calculations, the requirements for extra so-called targeted catch crops were applied in the upland to 90 coastal waterbodies with the aim that NO3 leaching from the fields should not result in an outlet of N above a maximum acceptable level to maintain Good Ecological Status. It was assumed that catch crops reduced leaching of NO3 from the root zone to 33 kg N ha−1. The maximum requirement for targeted catch crops was set to 32.6% of the area farmed with crops with a short growing season, and for the targeted uplands with the 90 waterbodies, this requirement varied from 0 to 32.6% of the area with crops with a short growing season. It is projected that in these uplands, ca. 70% of the agricultural land will be require 32.6% catch crop cover in 2020/21. The requirement for extra catch crops was applied to all farms with animal production depending on the sensitivity of the coastal water and the development of the livestock production. The extra requirement for catch crops for animal farms varies from 0 to 6% depending on the status of the catchment.
The requirement to grow catch crops is calculated as a percentage of the area of cereals, maize, oilseed rape, and other crops with a short growing season. The total area with catch crops, or alternatives to catch crops, was 650,000 ha in autumn 2020, corresponding to 25% of the total agricultural area.
The regulation is complicated in that on 70% of the farming area with the highest demands for catch crops, this requirement is 41% on farms with <80 kg N ha−1 in animal manure, and on farms with more than 80 kg N ha−1 in animal manure, the requirement is 50%.
The regulation is made more flexible by enabling farmers to grow a higher proportion of winter cereals on the farm, or the farmer has to choose alternatives to catch crops from those given by law. The most important alternative is the early establishment of 2 ha of winter cereals (before September 7) instead of 1 ha of catch crops, or a reduction in N quota of 93 kg N per hectare if not using catch crops on arable farms and 150 kg for animal farms (Table 5).
The catch crops are undersown grass, grass, wheat, and chicory established before August 1 and crucifers, phacelia, barley, rye, and oat established before August 20. The catch crops must not be incorporated before October 20 and must be followed by a spring-sown crop.
Ammonia Emission
The Danish rules for implementation of NH3-reducing technologies rely on the documentation given in a test and validation for best available technologies (BATs; Santonja et al., 2017), which is a system accepted by all EU countries and incorporated in EU and Danish environmental legislation. In short, BAT is defined as the most efficient, reliable, and economically sustainable technology on the market. A committee of experts is continuously evaluating new technologies that may be added to the list, and the demand is for a prototype the reliability and efficiency is tested for about a year.
A Danish farmer who wishes to increase the livestock production must construct animal buildings and use spreading technologies that keep the total NH3 emission from the enlarged part of the farm to a level equivalent to the emission from the animal housing type and manure store and application technology in the BAT list. This regulation is expected to reduce NH3 emission from Denmark by 25–35% in the period from 2005 to 2020 to below 67,400 t NH3 (Nielsen et al., 2018). This is also the emission ceiling given by the EU, i.e., the National Emission Ceilings Directive (NECD, total emission from all sectors).
Ammonia emission may affect deposition of NH3 significantly at distances up to 300–500 m from livestock housing, and this calls for a stricter reduction in emission if there are “N-vulnerable” ecosystems near these production units (Anker et al., 2019). The regulation intends to guarantee that NH3 deposition falls below the critical load capacity of the ecosystem, which is defined as the capacity of the system to assimilate N without concurrent changes in the flora and fauna (Fisher et al., 2007; De Vries et al., 2010). An increase in livestock production has to meet the requirements that keep deposition of NH3 to the ecosystems below the critical load capacity. The deposition limit spans from 0.2 to 1.0 kg NH3 ha−1 year−1 for the most vulnerable ecosystems.
For animal housing, the NH3 emission from the houses should be low; therefore, the construction must follow the designs given in the Danish technology list, which corresponds to the BAT list of the European Union (Anonymous, 2020). The listed emission factors for the specific house construction and animal category are calculated as an emission rate per manure-covered surface and according to management (acidified, scraped, cooled, etc.). This is a novelty, as emission from animal housing was previously based on emission factors for a given livestock house design and given as a percentage of total ammoniacal N (TAN) in liquid manure and a percentage of total N in solid manure. An average emission from a BAT-livestock building is about 15–25% lower than from standard livestock buildings.
Liquid stores must, by law, be protected with a cover consisting of a floating natural crust, made up of straw and organic matter or burned clay granules, creating a barrier to NH3 emission, or an NH3-impermeable cover material, such as a floating plastic cover, a polyvinyl chloride (PVC) tent construction, or something similar. Acidification of stored slurry to below pH 6 is included in the directive as a method to reduce NH3 emission.
Emission from slurry applied in field must be reduced by the use of trailing hoses, trailing shoe, or injection. Slurry must be applied by injection to bare soil and grassland, but on grassland, slurry may be trail-hose applied if the slurry is acidified prior to application (ca. below pH 6.4). Acidified slurry must be incorporated if applied to bare soil. Slurry may be applied to growing crops, except grass, with trailing hoses. Solid manure applied to bare soils must be incorporated into the soil within 4 h of application. Urea and di-ammonium sulfate supplied after April 1 must be injected into the soil or, if applied on the soil surface, must be incorporated. Urea mixed with urease inhibitor may be applied on the soil surface.
Effect On the Environment
The quality of the water environment has been monitored by Aarhus University in a number of catchments since 1990 (Blicher-Mathiesen et al., 2019). In these catchments, N and P are measured as follows: leaching from the root zone in ca. 30 fields with ceramic suction cups; N and P concentrations and water flow in streams; NO3 concentration in groundwater; and discharge of N and P to coastal water. In addition to these measurements, environmental quality parameters are measured in lakes and seas.
The effectiveness of the regulations aimed at reducing pollution from agriculture at national scale can be depicted as a reduction in the use of N at country level or as an increase in N use efficiency (Sassenrath et al., 2013; EUN-, Expert Panel, 2015). Fertilizer N consumption has been reduced by using the N imported more efficiently as shown by a reduction in total N applied to fields in manure and mineral fertilizers (Figure 1), and the export of N as a fraction of total N imported has been doubled, reducing surplus of N by 50% from 1980 to 2020.
This is partly due to an increase in the efficiency of plant uptake of manure N, which was low in the beginning of the 1980s and increased to 50% uptake of N applied to crops in manure 30–40 years later (Figure 5). The uptake varies over the years and was low in 1987, 1992, and 2018 because yields were low due to unfavorable weather conditions. It is seen that the average Danish MFE for N in manure is 70% of the N uptake in mineral fertilizer, which corresponds to the average utilization efficiency given in the regulations until 2020/2021.
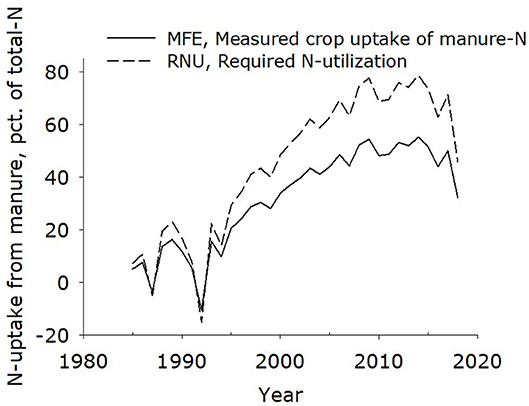
Figure 5. Required N utilization (RNU) by law and the average uptake of N in crops as a percentage of N supplied in manure [mineral fertilizer equivalent (MFE)] assessed using data from field experiments published by Blicher-Mathiesen et al. (2019). The MFE is calculated for the whole country as an average of the uptake of N in all crops harvested, from which is subtracted (1) the uptake of N in mineral fertilizer, which is assumed to be 70%, (2) deposition from the air (NH3, NO3) and N in organic waste products at 15%, and (3) N fixation by leguminous crops corresponding to 80% of fixed N.
The nitrate concentration in water leaching from the root zone has declined in the period from 1990 to 2018 on both loamy sand and sandy soils. In layers 1.5–5.0 m below the soil surface of fields on loamy sand, the NO3 concentration in soil and groundwater is lower than in the root zone due to denitrification. The NO3 concentration declines from about 50 to 30 mg NO3 L−1 during transport in the soil. In contrast, the concentration in the upper groundwater is similar to the concentration of NO3 in the root zone in sandy soils, because denitrification rates are low. In the same period, the NO3 concentration in groundwater declined from 100 to 58–77 mg NO3 L−1 (Blicher-Mathiesen et al., 2019). Most drinking water in Denmark is extracted from deep anoxic aquifers, and 78% of the water from the drinking water wells has an NO3 concentration below 1 mg L−1 and 1% exceeds a concentration of 50 (Thorling et al., 2019).
The amount of total N and NO3 in ca. 50% of discharge water to the sea is measured by determining the water flow and the total N and NO3 concentrations in streams, and the N discharge from the remaining parts of streams is modeled. The discharge from point sources (water treatment plants, industry) is measured. The discharge of N is correlated to the discharge of water and is therefore normalized to an average discharge of water for the year. The total discharge of N decreased from about 100,000 t in 1990 to 55,000 t in 2010 (Figure 6). In the 1990s, some of the reduction was the result of reducing discharge from point sources, but most of the reduction derives from agriculture.
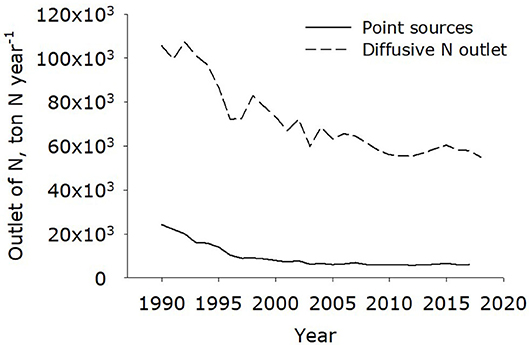
Figure 6. Discharge of N to coastal water. Discharge of water and N concentration are measured in streams (figure is based on data from Thodsen et al., 2019).
Several thousands of square kilometers of coastal waters still have anoxic conditions, but the area has decreased since the 1980s, although anoxic conditions still recur in large areas in some years. The oxygen concentrations at the bottom of the sea show no significant changes (Hansen and Høgslund, 2019).
In the period from 1985 to 2005, agricultural NH3 emissions (excluding crops) were reduced by 36% as an effect of the many initiatives in late 1980 and the start of 1990 (see Appendix 1), and from 2005 to 2018, emission of NH3 from agriculture was reduced by 15% (Figure 7). The total emission from agriculture in 2018 was 67,400 t (not including crops) and 72,800 t when including emission from crops (5,400 t) and emission from other sources (transport, wood burners, and organic waste management such as composting; 4,200 t) (Nielsen et al., 2018). Denmark included NH3 emission from crops (Sommer et al., 2004) in the national inventory in the late 1980s and is probably one of the only EU countries doing so. The Danish national emission reduction commitment for both 2020 and 2030 is 24% compared with the emission level in 2005, which corresponds to 68,500 t (Nielsen et al., 2018). So there is a need to reduce emissions, and most of this reduction must come from agriculture. Nielsen et al. (2018) projected that acidification of slurry in-house will contribute to reducing emissions from livestock houses by 10% (3,659 t) from 2016 until 2030. It is assumed that low emission application technologies (acidification, injection of slurry) will avoid an increase in NH3 emission from field-applied manure caused by a higher TAN amount being applied so that the increase is reduced to 4% (765 t). It is further estimated that emission from mineral fertilizers will increase by 15% (1,079 t) due to an increased mineral fertilizer consumption and greater use of urea. Therefore, further initiatives to reduce emission will be introduced in 2021/2022.
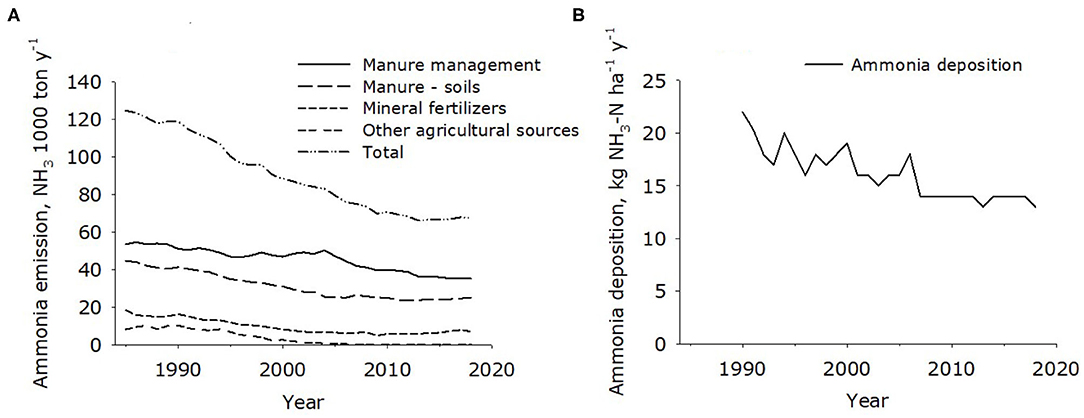
Figure 7. (A) Ammonia emission from Danish agriculture (data from Nielsen et al., 2018). Manure management encompasses emission from animal houses and stored manure; manure—soils are solid and liquid manures applied to fields and urine and feces excreted by outdoor animals; mineral fertilizers are fertilizers applied to fields; and other agricultural sources are mainly NH3-treated straw (practice stopped in late 1990s). Ammonia emission from crops (ca. 5,500 t year−1) is recorded in the inventory but not included in this figure. (B) Deposition of NH3 to Danish land (data from Blicher-Mathiesen et al., 2019).
Economy
Additional manure handling requirements result in extra costs for the farmer for increased storage capacity and more expensive manure application technologies. On the other hand, the farmer saves money on mineral fertilizer. The manure utilization requirements might, in combination with the reduced quotas for N in the period from 1999 to 2017, have resulted in a yield reduction and lower quality of the crops. Farmers also face costs associated with the use of catch crops.
Cost of Handling Manure
Farmers have had to invest in storage capacity to fulfill the requirements for 6–9 months' storage capacity introduced in the 1980s and 1990s. At that time, livestock holdings on many farms were relatively small, and the turnover was low. The investment required to comply with the requirement was about €19,000 per farm for 30,000 farms (Dubgaard, 1991). The government subsidized 30% of the costs (Miljøministeriet, 1987). Today, the investment needed to establish a 4,000 m3 storage capacity for liquid manure is about €70,000, corresponding to €1.62 m−3 for a year's storage capacity (Højholt, 2019). It has been economically advantageous to increase the slurry storage capacity to 9–12 months and to establish a natural crust in the form of a straw cover (Table 6). The extra cost involved in spreading slurry with trailing hoses rather than broadspreading is estimated to be €0.27 m−3 and €0.81 m−3 for direct injection and are jobs that often require the expenditure of hiring a contractor to apply the slurry. For small-scale farmers, the cost per ton of slurry is higher, and establishment of extra storage capacity can result in net costs, because the reduced need for mineral fertilizer cannot fully compensate for the increased costs of liquid manure management.
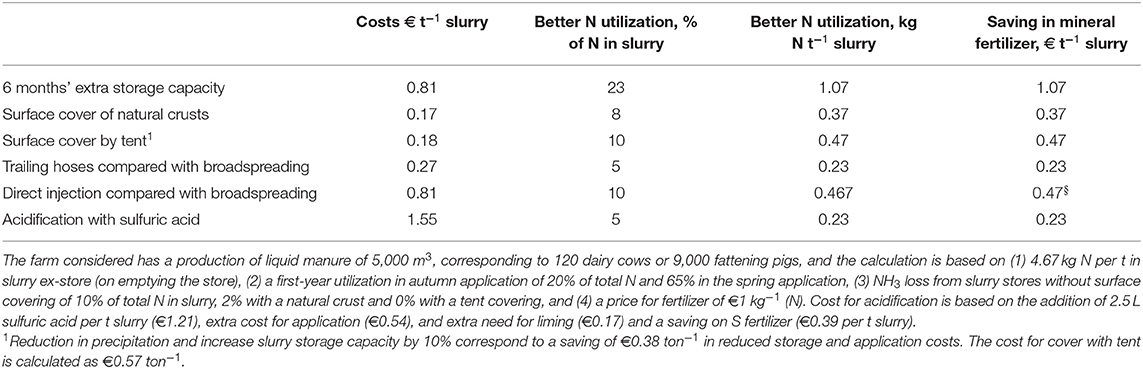
Table 6. Change in costs for managing manure according to regulations imposed since the start of the 1980s.
Loss of Income Related to Under-Fertilization
During the period from 1994 to 1998, and from 2017, the N fertilizer quotas for the crops were based on the economically optimal N rates calculated from trials with market prices of fertilizer and crop grain, and on average, the quota system should not result in loss of yield or reduced crop quality. Optimal N rates vary from field to field and from farm to farm, and the average quotas have resulted in loss of income on some farms. Under-fertilization with plant-available N in manure and mineral fertilizer will be the effect if the farmer cannot achieve the required degree of utilization of N in animal manure (RNU). Until 2020, the requirements for utilization of N in manure could be achieved by farmers with a normal good manure handling practice. This means that on average there have been no losses of yield and quality as a consequence of the requirement to utilize N in manure.
The loss of income related to the suboptimal N norms has been heavily discussed among farmers, SEGES, and the universities. Copenhagen and Aarhus universities as well as SEGES have carried out several analyses of the consequences of under-fertilization. The key questions have been the degree of under-fertilization on farms, the long-term effect, and the effect on quality and price of the crops.
The effect on yield and quality is often calculated from 1-year trials with increasing rates of N applied to a crop. The first-year yield loss in 101 winter wheat trials have been calculated to be 0.47 t ha−1 due to the quota being ca. 40 kg N ha−1 lower than the economically optimal level (Knudsen, 2013). In 1-year trials, the accumulated or long-term effect of N application levels is not measured. For 30 years, SEGES has estimated the long-term effect of under-fertilization using data from field trials with different levels of N (Petersen et al., 2012). Their studies indicate a yield reduction of 0.15–0.3 t ha−1, which is lower than the 1-year figure, due to the effect of under-fertilization apparently diminishing over time (Knudsen, 2013). One may estimate the effect of under-fertilization by comparing the average winter wheat yield in Germany and Denmark from 1980 until 2017. In this period, German farmers had a higher yield increase than Danish farmers (FAO STAT, 2020). In Germany, there have been no limits for N use, and the data indicate that the quotas in Denmark from 1994 and the suboptimal quotas from 1999 to 2016 have had a negative impact on winter wheat yields.
Knudsen (2013) concluded based on the trials mentioned above that in the period up to 2010, the loss of yield due to the reduced N quotas was 0.6 t ha−1, and this estimate increased to 0.73 t ha−1 in 2014, because under-fertilization had increased slightly (Knudsen, 2015). These estimates are higher than the 0.3 and 0.5 t ha−1 loss of yield in cereals due to the reduction of the N quota calculated in 2013 by, respectively, Aarhus University and the University of Copenhagen (Anonymous, 2013).
The Impact of Reduced N Supply on the Protein Content in Cereals
Since the 1980s, the protein content of grain collected from all regions across Denmark has been analyzed to provide pig producers with information about protein (Figure 8). The protein content has decreased by approximately two percentage points from the mid-1990s to the 2010s and contributed to a loss of income. The protein price has increased since 2008 due to a wider price span between winter wheat and soya protein. For feed cereals, the two percentage-point loss of protein has resulted in a financial loss close to €70 ha−1 at a yield of 7.5 t ha−1; i.e., a 2% protein reduction corresponds to 128 kg protein at a value of €0.55 kg−1. For winter wheat to be used for bread, an extra N quota of ~70 kg N ha−1 could be applied to 40,000 ha, which enables production of flour with a high gluten content.
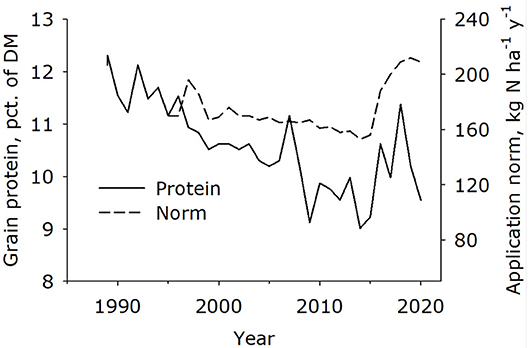
Figure 8. Protein content in grain of winter wheat monitored from 1986 to 2020 by SEGES (Sloth and Poulsen, 2020).
From 2014/2015, the N quotas and, in consequence, the protein concentration have increased. An exception is a low protein concentration in 2020 due to high yields for which the addition of N was not sufficient. A more detailed study of the reasons for the variation in concentration of protein in cereals in Denmark is given by Styczen et al. (2020).
Loss of Income Due to Reduced N Quotas
Total income loss for Danish agriculture due to reduced yield and quality has been estimated to be €120 ha−1 year−1 (Knudsen, 2015), €70 100 ha−1 year−1 (Jacobsen, 2016), €28–52 ha−1 year−1 (Vinther et al., 2013), and €180 ha−1 year−1 (Troelsen, 2016). The assessment of the total loss due to reduced N quotas varies quite markedly between different institutes. Some of the differences are due to using different methods for the calculation. An underestimation is primarily due to an underestimation of the value of protein and the effect on yield of a long-term reduction in soil N supply. SEGES (Leif Knudsen) has claimed that the universities underestimate the losses and that reduced N quotas are a more costly instrument for reducing leaching than the estimates from the universities—upon which the Ministry bases its decisions.
Costs for the Farmers Related to Demands for Catch Crops
The suboptimal N quotas were replaced in 2016/17 by the requirement to expand the area growing catch crops to reduce the increase in N leaching caused by an increase in N application. The cost for the farmer related to this is €18–26 ha−1 when corrected for the residual effect of N if the crop rotation does not need to be changed when including catch crops (Eriksen et al., 2020). According to the legislation, catch crops must be succeeded by a spring-sown crop.
If the area with catch crops prevents the establishment of a winter cereal, there will be an additional loss of income from the difference in income between winter cereals and spring cereals. The total cost for catch crops including the cost for changing the crop rotation is calculated to be €200 to €360 ha−1 (Eriksen et al., 2020). On pig production farms on sandy loam, the crop rotations with a high proportion of winter cereals give the highest income. To avoid the need for changing the crop rotation, the farmers use the alternatives to catch crops given in the legislation. This means early establishment of winter cereals and a reduction of the N quota by up to 10%.
Discussion
Overall, the simplest and most efficient instrument for reducing N and P pollution turned out to be the ban on direct discharge of manure to recipients and instigating an efficient control of the discharge. We could not find any information about the effect of this, but in 1984, it was mentioned that in one Jutland region, water quality in rivers improved by 25% after starting an efficient control of manure and silage stores (Sven G. Sommer, personal communication).
Important sources of information about the problems related to mineral fertilizer and manure use are the research and surveys carried out, which made farmers, and not least society, aware of the problems. Initially in the early 1980s, the first of three policy instruments used was Communication in form of consultancy and communication through increasingly precise decision support tools aiming at informing the farmers about the fertilizer efficiencies and timing of manure application. The extension service SEGES launched the slogan “manure is as good as gold” (in Danish: gylle er guld). This did not result in a change in farming that significantly reduced the pollution of the environment. Still, reliable communication is most important to make farmers comply with the regulations, and the core of this is decision support about mineral fertilizer efficiency related to management of manure and mineral fertilizers.
Regulations and control were successfully introduced to reduce N emissions in late 1980 by setting rules for management of manure, mineral fertilizers, crop rotations, etc. If the regulations force the farmers into a less profitable practice, they must be in a form that enables compliance with the rules to be controlled, and there must be authorities that control the rules. The farmers are using manure and mineral fertilizer in accordance with the regulations, because the use of N is similar to the crop N requirement, which is calculated using information about crop distribution, the N quota for each crop, and the amount of N in animal manure (Blicher-Mathiesen et al., 2019). All regulation initiatives are based on the concept of maximal plant nutrient recycling through efficient use of feed in livestock production, plant nutrient use in crop production, and plant nutrients in animal manure. This includes feed N used in animal production, which has efficiently reduced excretion of N per production unit and reduced the potential of losses to air and water. The Harmony Rules are the backbone for having reduced N release to the environment, because it has facilitated a cost-efficient recycling of plant nutrients in manure. This has contributed to livestock farms having enough land for application of manure at rates below crop need and to cheap and efficient use of the manure, because long distance transport is avoided. In the Netherlands, livestock farms may regionally produce a surplus of plant nutrients in relation to crop need, and from these farms, about 24.5 million tons of livestock manure (800,000 transports) is transported from livestock farmers to crop farms and neighboring countries (Uenk, 2018). Dutch pig producers pay €5–20 per ton slurry transported (de Buisonjé, 2013). In Denmark, the cost of applying slurry is relatively low (Table 6). The success of the harmony regulation, regulation of N use, and crop production has helped increase the Danish national NUE to an average of 40%, which is one of the highest globally (de Klein et al., 2017; Liu et al., 2017).
Economic instruments in the form of subsidies have been used to promote environmentally friendly technologies. An example is the economic support to farmers to increase their liquid manure store capacity to the 9 months demanded in the action plan for the aquatic environment. When this support was removed, the cost price for constructing the store was reduced, which could very well be an effect of the reduced financial support to construct the slurry stores. Economic instruments like tax on N in mineral fertilizer or tax on N surpluses at farm level have been discussed as a supplement or an alternative to the current very detailed regulations but have never been implemented.
With time, the regulations have become increasingly complex, as indicated by the increase in the number of pages from 25 to 250 (Figure 9) and also the number of staff employed by the farmers' extension service reporting for farmers to the Food Agency (Landbrugsstyrelsen) and by the Food Agency monitoring the farmers. One of the big problems when developing the regulations is that farmers want a high flexibility to be able to adapt their practice to the conditions on individual farms and to weather conditions in different years. But flexibility also means complexity, and the regulations concerning catch crops are a good example of this.
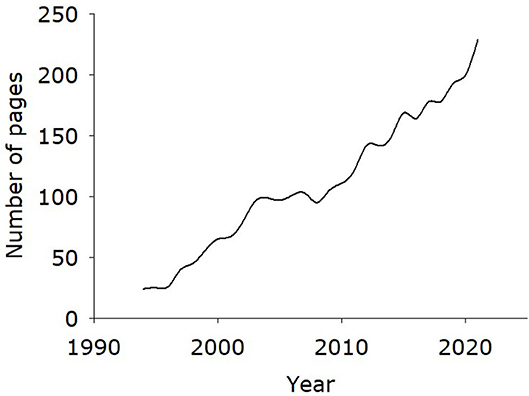
Figure 9. Increase in number of pages in the Danish manure regulations (data provided by Torkild Birkmose, SEGES).
The development in NH3 emission, N in groundwater, and discharge of N to coastal waters shows significant reductions. But problems such as decreasing biodiversity and anoxic conditions in coastal waters are still reported to be caused by emissions from agriculture.
Farm economy must be considered when developing and implementing regulations with the aim of promoting environmentally friendly farming. The limit to implementation of new regulations without investments is when these make farming non-profitable and when either farming must be subsidized or the production closed down.
Conclusion
The two most important regulations that have been implemented are the ban on direct discharge of manure to recipients and the ban of application of manure in the autumn (read before a period without or limited plant nutrient uptake). The harmony regulations reduced livestock production to a maximum number per unit land area, has reduced the cost of transport and manure application, and contributes to an efficient and correct use of manure combined with mineral fertilizers.
A high utilization efficiency of N in manure force farmers is required to manage manure with an aim to increase plant uptake of the applied N and reduce the leaching and discharge of N to coastal waters. This must be combined with implementation of improved manure management technologies.
Valid estimates of the mineral fertilizer efficiency of the applied manure are of utmost importance in ensuring that farmers do not overfertilize, and this significantly reduces leaching losses. Establishing cover crops after harvest reduces mineral N in soil and nitrate (NO3) leaching during winter, and together with the higher utilization of manure, this has reduced NO3 leaching by 45%.
There is a push from farmers to develop regulations that support individual manure, fertilizer, and crop management. This approach is not recommended because it makes the regulation very complex, difficult to use correctly in practice, and expensive to control.
Author Contributions
Both authors listed have made a substantial, direct and intellectual contribution to the work, and approved it for publication.
Conflict of Interest
LK was employed by company SEGES, Aarhus, Denmark.
The remaining author declares that the research was conducted in the absence of any commercial or financial relationships that could be construed as a potential conflict of interest.
The handling editor declared a past co-authorship with one of the authors, SS.
References
Amann, M., Klimont, Z., and Wagner, F. (2013). Regional and global emissions of air pollutants: recent trends and future scenarios. Ann. Rev. Environ. Res. 38, 31–55. doi: 10.1146/annurev-environ-052912-173303
Andersen, J. M., and Jensen, P. M. (2019). Danske vandløb ca. 1970 til 2018. I miljøets fodspor, nr. 4. Miljøstyrelsen, DK-Copenhagen, Denmark.
Anker, H. T., Backes, C. W., Baaner, L., Keessen, A. M., and Mockel, S. (2019). Natura 2000 and the regulation of agricultural ammonia emissions. J. Eur. Environ. Plan Law 16, 340–337. doi: 10.1163/18760104-01604003
Anonymous (1983). Nitrat i drikkevand og grundvand (Nitrate in drinking water and groundwater). DK-Copenhagen, Denmark.
Anonymous (1984). Kilder til NPO-belastning (N, P and Organic matter sources to the environment). NPO-redegørelse. Miljøstyrelsen, DK-Copenhagen, Denmark.
Anonymous (2013). Landbrugets omkostninger ved den nuværende normreduktion. Københavns Universitet, Aarhus Universitet, Notat 24.
Anonymous (2015). Danish Nitrate Action Programme 2008-2015, Regarding the Nitrates Directive; 91/676/EEC. Miljøstyrelsen, DK-Copenhagen, Denmark. Available online at: https://eng.mst.dk/trade/agriculture/nitrates-directive/nitrate-action-programme/ (accessed October 21, 2020).
Anonymous (2017). Oversigt over den danske regulering af næringsstoffer i landbruget og det danske nitrathandlingsprogram. Miljøstyrelsen 2017. DK-Copenhagen, Denmark. Available online at: https://mst.dk/media/133515/oversigt-over-den-danske-regulering-af-naeringsstoffer-i-landbruget-og-det-danske-nitrathandlingsprogram.pdf (accessed June 23, 2020).
Anonymous (2018). Procedurer for indstilling af kvælstof- og udbyttenormer, Gældende fra november 2018. Aarhus University, Aarhus, Denmark.
Anonymous (2020). Miljøstyrelsens teknologiliste (Danish Environmental Agency's List about environmental friendly technologies). DK-Copenhagen, Denmark. Available online at: https://mst.dk/erhverv/landbrug/miljoeteknologi-og-bat/teknologilisten/ (accessed November 26, 2020).
Beusen, A., Bouwman, A., Heuberger, P., Van Drecht, G., and Van Der Hoek, K. (2008). Bottom-up uncertainty estimates of global ammonia emissions from global agricultural production systems. Atmos. Environ. 42, 6067–6077. doi: 10.1016/j.atmosenv.2008.03.044
Blicher-Mathiesen, G., Holm, H., Houlborg, T., Rolighed, J., Andersen, H. E., Carstensen, M. V., et al. (2019). Landovervågningsoplande 2018. NOVANA. Aarhus Universitet, DCE—Nationalt Center for Miljø og Energi, 241 s.—Videnskabelig rapport nr. 352. Available online at: http://dce2.au.dk/pub/SR352.pdf (accessed January 1, 2021).
Dalgaard, T., Hansen, B., Hasler, B., Hertel, O., Hutchings, N. J., Jacobsen, B. H., et al. (2014). Policies for agricultural N management—trends, challenges and prospects for improved efficiency in Denmark. Environ. Res. Lett. 9:115002. doi: 10.1088/1748-9326/9/11/115002
de Buisonjé, F. (2013). “Manure management and processing,” in Presentation at Rednex Bucharest, 16–17 May 2013. Available online at: https://docplayer.net/24055295-Manure-management-and-processing.html. (accessed July 1, 2018).
de Klein, C. A. M., Monaghan, R. M., Alfaro, M., Gourley, C., Oenema, O., and Powell, J. M. (2017). N performance indicators for dairy production systems. Soil Res. 479–488. doi: 10.1071/SR16349
De Vries, W., Wamellink, G. W. W., Van Dobben, H., Kros, J., Reinds, G. J., Dijkstra, J. P., et al. (2010). Use of dynamic soil-vegetation models to assess impacts of N deposition on plant species composition: an overview. Ecol. Appl. 20, 60–79, doi: 10.1890/08-1019.1
Dubgaard, A. (1991). The Danish Nitrate Policy in the 1980s. Statens Jordbrugsøkonomiske Institut. Rapport fra Statens Jordbrugsøkonomiske Institut, No. 59. DK-Copenhagen, Denmark.
Duce, R. A., LaRoche, J., Altieri, k., Arrigo, K. R., Baker, A. R., Capone, D. G., et al. (2008). Impacts of atmospheric anthropogenic non the open ocean. Science 320, 893–897. doi: 10.1126/science.1150369
Dyhr-Nielsen, M., Hansen, E., Holter, V., Krag-Andersen, K., and Iversen, R. M. (1991). Kvælstof, fosfor i jord og vand—Transport, omsætning og effekt (Nitrogen, phosphorous in soil and water-Transport, transformation and effect on the environment). Miljøministeriet, Miljøstyrelsen, DK-Copenhagen, Denmark. p 152.
EP (2016). Directive (EU) 2016/2284 of the European Parliament and of the Council of 14 December 2016 on the Reduction of National Emissions of Certain Atmospheric Pollutants, Amending Directive 2003/35/EC and Repealing Directive 2001/81/EC. Brussels: European Council.
Eriksen, J., Thomsen, I. K., Hoffmann, C. C., Hasler, B., and Jacobsen, B. H. (2020). Virkemidler til reduktion af kvælstofbelastningen af vandmiljøet. Aarhus Universitet. DCA – Nationalt Center for Fødevarer og Jordbrug. 452 s. – DCA rapport nr. 174. Aarhus Denmark. Available online at: https://dcapub.au.dk/djfpdf/DCArapport174.pdf (accessed December 20, 2020).
EU (2020). Water Framework Directive. Uploaded 24 November 2020. Available online at: https://www.eea.europa.eu/themes/water/interactive/by-category/wfd (accessed January 2, 2021).
EUN-Expert Panel. (2015). N Use Efficiency (NUE)—an Indicator for the Utilization of N in Agriculture and Food Systems. Wageningen University, Alterra, PO Box 47, NL-6700 Wageningen, Netherlands.p. 47. Available online at: http://www.eunep.com/wp-content/uploads/2017/03/Report-NUE-Indicator-N-Expert-Panel-18-12-2015.pdf (accessed November 1, 2020).
FAO STAT (2020). Crops. Downloaded December 2020. Available online at: http://www.fao.org/faostat/en/#data/QC (accessed November 21, 2020).
Fisher, L. S., Mays, P. A., and Wylie, C. L. (2007). An overview of N critical loads for policy makers, stakeholders, and industries in the United States. Water Air Soil Pollut. 179, 3–18. doi: 10.1007/s11270-006-9235-6
Giannadaki, D., Giannakis, E., Pozzer, A., and Lelieveld, J. (2018). Estimating health and economic benefits of reductions in air pollution from agriculture. Sci. Tot. Environ. 622–623, 1304–1316. doi: 10.1016/j.scitotenv.2017.12.064
Hagebro, C., Bang, S., and Somer, E. (1983). “Nitrate load/discharge relationships and nitrate load trends in Danish rivers. Dissolved Loads of Rivers and Surface Water Quantity/Quality relationships,” in Proceedings of the Hamburg Symposium, August 1983. IAHS 377–385.
Hansen, J. W., and Høgslund, S. (2019). Marine områder 2018. NOVANA. Aarhus Universitet, DCE–Nationalt Center for Miljø og Energi, 156 s—Videnskabelig rapport fra DCE nr. 355, Aarhus, Denmark. Available online at: http://dce2.au.dk/pub/SR355 (accessed October 21, 2020).
Højberg, A. K., Windolf, J., Børgesen, C. D., Troldborg, L., Tornbjerg, H., Blicher-Mathiesen, G. B., et al. (2015). National kvælstofmodel. Oplandsmodel til belastning og virkemidler. Metode rapport. De Nationale Geologiske Undersøgelser for Danmark og Grønland. DK-Copenhagen, Denmark.
Jacobsen, B. H. (2016). Analyse af omkostningerne ved scenarier for en reduktion af N-tabet i relation til Fødevare- og Landbrugspakke 2015, 34 s., apr. 09, 2016. IFRO Udredning, Nr. 2016/09. Aarhus University, Aarhus, Denmark.
Klages, S., Heidecke, C., Osterburg, B., Bailey, J., Calciu, I., Casey, C., et al. (2020). N surplus—a unified indicator for water pollution in Europe? Water 12:1197. doi: 10.3390/w12041197
Knudsen, L. (2013). Hvad koster de underoptimale kvælstofnormer dansk landbrug?. Planteavlsorientering nr. 137, SEGES 2013. Aarhus, Denmark.
Kyllingsbæk, A. (1995). Kvælstofoverskud i dansk landbrug (N surplus in Danish agriculture). SP-rapport 23, Landbrugs- og Fiskeriministeriet Statens, Planteavlsforsøg, DK-Copenhagen, Denmark. Pp 61. Summary and legends in English.
Kyllingsbæk, A. (2005). Næringsstofbalancer og næringsstofoverskud i dansk landbrug 1979-2002 (Plant nutrient balances and surplus in Danish agriculture 1979-2002). DJF rapport 116, 100pp.
Landbrugsstyrelsen (2019). Vejledning om gødsknings og harmoniregler. Planperioden 1. august 2019 til 31. juli 2020. Landbrugsstyrelsen 2019, DK-Copenhagen, Denmark.
Liu, Q., Wang, J. M., Bai, Z. H., Ma, L., and Oenema, O. (2017). Global animal production and N and phosphorus flows. Soil Res. 55 451–462. doi: 10.1071/SR17031
Miljøministeriet (1987). LOV nr 392 af 10/06/1987 Lov om ændring af lov om miljøbeskyttelse og lov om støtte til miljøforbedrende investeringer i mindre landbrug m.v. DK-Copenhagen, Denmark.
Nielsen, O.-K., Plejdrup, M. S., Winther, M., Mikkelsen, M. H., Nielsen, M., Gyldenkærne, S., et al. (2018). Annual Danish Informative Inventory Report to UNECE. Emission Inventories From the Base Year of the Protocols to Year 2016. Aarhus University, DCE—Danish Centre for Environment and Energy, 495 pp. Scientific Report from DCE—Danish Centre for Environment and Energy No. 267. Aarhus, Denmark. Availble online at: http://dce2.au.dk/pub/SR267.pdf
Pedersen, C. A. (1996). Oversigt over Landsforsøgene 1996. Landbrugets Rådgivningscenter. Aarhus, Denmark.
Petersen, J., Thomsen, I. K., Mattsson, L., Hansen, E. M., and Christensen, B. T. (2012). Estimating the Crop Response to Fertilizer Nitrogen Residues in Long-Continued Field Experiments. Aarhus University, Aarhus Denmark. doi: 10.1007/s10705-012-9482-4
Santonja, G. G., Georgitzikis, K., Scalet, B. M., Montobbio, P., Roudier, S., and Sancho, L. D. (2017). Best available techniques (BAT), reference document for the intensive rearing of poultry or pigs. doi: 10.2760/020485
Sassenrath, G. F., Schneider, J. M., Gaj, R., Grzebisz, W., Grzebisz, W., Halloran, J. M., et al. (2013). N balance as an indicator of environmental impact: toward sustainable agricultural production. Ren. Agric. Food Syst. 28, 276–289. doi: 10.1017/S1742170512000166
Sloth, N. M., and Poulsen, J. (2020). Næringsstofindhold i korn 2020. SEGES svineproduktion nr. 2026. Aarhus.
Sommer, S. (1982). Plantenæringsstoffer—En kilde til vandforurening (Plant nutrients—a source of water pollution). Ugesk. Jord. 18, 349–353.
Sommer, S. G. (2013). Ammonia Volatilization from Livestock Slurries and Mineral Fertilizers. Dr. Techniques thesis published by University of Southern Denmark, Odense Denmark. p.128. (ISBN 978 87 7674 712 1).
Sommer, S. G., Schjørring, J. K., and Denmead, O. T. (2004). Ammonia volatilization from mineral fertilizers and plants in fields amended with ammoniacal fertilizers. Adv. Agron. 82, 557–662. doi: 10.1016/S0065-2113(03)82008-4
Sørensen, P., Thomsen, I. K., Jensen, B., and Christensen, B. T. (2002). “Residual nitrogen effects ofanimal manure measured by 15N,” in Optimal Nitrogen Fertilization -Tools for Recommendation, eds H. S. Østergård, G. Fystro and I. K. Thomsen, Proceedings from NJF seminar 322. Danish Institute of Agricultural Sciences, DIAS Report Plant Production no. 84., pp. 37–41. Aarhus University, Aarhus Denmark.
Steinfeld, H., Gerber, P., Wassenaar, T., Castel, V., Rosales, M., and de Haan, C. (2006). Livestock long shadow—Environmental Issues and Options. Rome: Food and Agriculture Organization of the United Nations.
Styczen, M. E., Abrahamsen, P., Hansen, S., and Knudsen, L. (2020). Model analysis of the significant drop in protein content in Danish grain crops from 1990-2015. Eur. J. Agron. 118:126068. doi: 10.1016/j.eja.2020.126068
Sutton, M. A., Bleeker, A., Howard, C. M., Bekunda, M., Grizzetti, B., de Vries, W., et al. (2013). Our Nutrient World: The Challenge to Produce More Food and Energy with Less Pollution. Global Overview of Nutrient Management. Centre for Ecology and Hydrology, Edinburgh on behalf of the Global Partnership on Nutrient Management and the International N Initiative. ISBN: 978-1-906698-40-9.
Thodsen, H., Tornbjerg, H., Rasmussen, J. J., Bøgestrand, J., Larsen, S. E., Ovesen, N. B., et al. (2019). Vandløb 2018. NOVANA. Aarhus Universitet, DCE - Nationalt Center for Miljø og Energi, 70 s. - Videnskabelig rapport nr. p. 353. Available online at: http://dce2.au.dk/pub/SR353.pdf (accessed November 15, 2020).
Thorling, L., Ditlefsen, C., Ernstsen, V., Hansen, B., Johnsen, A. R., and Troldborg, L. (2019). Grundvandsovervågning, Status og udvikling 1989–2018. De Nationale Geologiske Undersøgelser for Danmark og Grønland. Copenhagen, Denmark.
Uenk, J. (2018). Solutions in practice for manure surplusses in the Netherlands (Powerpoint presentation). Available online at: https://www.holanda.es/media/52522/present.%20j.%20uenk%20pdf.pdf. (accessed July 1, 2018).
Vinther, F. P., Kristensen, E. S., Kristensen, K., Jacobsen, B. H., and Ørum, J. E. (2013). Landbrugets omkostninger ved den nuværende normreduktion, nr. 62716, p.19. Aarhus University, Aarhus, Denmark.
Vinther, F. P., and Olsen, P. (2011). Næringsstofbalancer og næringsstofoverskud i landbruget 1988-2009, Intern rapport, nr. 102. Aarhus University, Aarhus Denmark.
Keywords: regulation, nitrate, ammonia, livestock, environmental friendly
Citation: Sommer SG and Knudsen L (2021) Impact of Danish Livestock and Manure Management Regulations on Nitrogen Pollution, Crop Production, and Economy. Front. Sustain. 2:658231. doi: 10.3389/frsus.2021.658231
Received: 25 January 2021; Accepted: 17 March 2021;
Published: 10 May 2021.
Edited by:
Tom Misselbrook, Rothamsted Research, United KingdomReviewed by:
Rekha Guchhait, Yonsei University, South KoreaBikash Koli Dey, Hongik University, South Korea
Copyright © 2021 Sommer and Knudsen. This is an open-access article distributed under the terms of the Creative Commons Attribution License (CC BY). The use, distribution or reproduction in other forums is permitted, provided the original author(s) and the copyright owner(s) are credited and that the original publication in this journal is cited, in accordance with accepted academic practice. No use, distribution or reproduction is permitted which does not comply with these terms.
*Correspondence: Sven G. Sommer, c2dzQGVuZy5hdS5kaw==