- 1Vulcan Analogue Sample Facility, European Space Agency (ESA), European Centre of Space Applications and Telecommunications (ECSAT), Oxfordshire, United Kingdom
- 2Mars Science Team, European Space Agency (ESA), European Space Research and Technologies Centre (ESTEC), Noordwijk, Netherlands
- 3X-Ray Mineral Services Ltd., Colwyn Bay, United Kingdom
- 4Norwegian Geotechnical Institute (NGI), Oslo, Norway
- 5Faculty of Computing, Engineering and Science, University of South Wales, Pontypridd, United Kingdom
- 6Petrolab Ltd., Cornwall, United Kingdom
- 7Luna Analog Facility, European Space Agency (ESA), European Astronaut Centre (EAC), Cologne, Germany
The Luna Analog Facility, a joint ESA-DLR endeavour, consists of three components and spans an area of 1,000 m2, providing testbeds of simulated lunar environments. The main sections within the facility are a large area filled with lunar mare regolith simulant resembling mare regions and a smaller, individual “Dust Chamber”. The latter replicates highland conditions and contains approximately 20 tons of material, specifically simulating the fine-particle lunar regolith portion up to 250 µm. The Dust Chamber serves as a platform for testing various technologies, such as mechanical tools, robotic operations, in-situ resource utilization activities, and astronaut attire, as well as different procedures including rover and astronaut tasks. This work represents the geotechnical, geochemical and mineralogical characterization of the Lumina Sustainable Materials Ltd. 2023 batch highland simulants, from which Lunar250 is intended for use in the Luna Dust Chamber. Additionally, this work provides new results for ESA’s mare simulant, EAC-1. We provide data on particle size distribution, particle shape, abrasivity, density, water content, major and trace element geochemistry and modal mineralogy. As the simulants in the Luna Facility will be constantly overseen, this work organized by the Vulcan Facility (ESA) intends to support the monitoring of the geotechnical property variations of the simulants over time. Ultimately, we analysed several properties with different tools to emphasize how different methods and instruments affect the variability and reliability of the results.
1 Introduction
The European Space Agency (ESA) is committed to advancing human and robotic exploration, with a primary focus on lunar exploration in the light of the Terra Novae (E3P) program and Explore 2040 (https://esamultimedia.esa.int/docs/HRE/Explore_2040.pdf). In alignment with preparations for future lunar habitation, construction ended for the Luna Analog Facility (LAF; www.luna-analog-facility.de) at the European Astronaut Centre (EAC) in Cologne, Germany. The LUNA facility serves as a crucial resource for fostering the development, testing, and simulation of innovative tools, equipment, and operational strategies tailored for forthcoming human expeditions to both the Moon and Mars. Leveraging its tight integration within the infrastructure of the German Aerospace Center (DLR) and the European Space Agency (ESA), the facility draws upon the collective experiences and expertise of diverse institutes and centres. Comprising a regolith hall and a technology centre, the facility is intricately linked to key establishments including the European Astronaut Centre (EAC), the Microgravity User Support Center (MUSC), and the German Space Operations Center (GSOC).
The mare regolith area, spanning 750 m2 with a depth of 60 cm, features a suspension unit enabling astronauts and equipment to experience one-sixth of their terrestrial weight, mimicking lunar conditions, alongside a smaller, isolated “Dust Chamber” accurately replicating specific lunar highland conditions. The Dust Chamber houses approximately 20 tons of material, simulating the fine-particle fraction of lunar highland regolith.
The Vulcan Analogue Sample Facility (based in the United Kingdom) plays a critical role in supporting the establishment of the LAF. This support is provided through its contributions to scientific guidance and the provision of analogue sample advisory, aiding in the advancement of lunar exploration and research on the testbeds at LAF. The preparation for human and robotic exploration at LAF evidently advances scientific topics on extraterrestrial simulants (synonymously, analogue samples) establishing the success of lunar missions by the validation of robotics (e.g., Huang et al., 2022; Cloud et al., 2023; Zhang et al., 2023), engineering activities and SRU challenges (e.g., Cannon et al., 2022; Kalapodis et al., 2020; Toklu and Akpinar, 2022; Williams, 2023; Singh et al., 2021; Zhang et al., 2022).
This work represents new, updated geotechnical, geochemical and mineralogical data of the highland (Lunar; www.luminamaterials.com) and mare (EAC-1; Engelschiøn et al., 2020) simulants that fill up the regolith hall and the Dust Chamber, correspondingly. This simulant characterization data should be used to inform and support future activities on the LAF testbeds.
2 Materials and methods
2.1 Preparation
Lunar highland simulants were purchased from Lumina Sustainable Materials Ltd. (n = 3; https://www.luminamaterials.com/about-us; Batch of 2023) and were received at the Vulcan Analogue Sample Facility in June 2023 (Table 1). The lunar mare simulant, EAC-1, was received from EAC in June 2023 (Table 1). The samples were carefully labelled, packed, and weighed with the bags they were delivered in (Table 1). The samples were unpacked, smoothened in a plastic tray, then poured into the riffle splitter one by one to prepare representative sub-samples (subsample weights of 50 g and 1 kg; Supplementary Figures S1, S2) for the different laboratories for analyses. The flow of analyses and the laboratories carrying out the measurements can be found in Supplementary Figure S4. The geotechnical properties were analysed at the Vulcan Analogue Sample Facility (www.vulcan.esa.int) and at the Norwegian Geotechnical Institute (NGI; www.ngi.no), while the geochemical and mineralogical properties were measured at X-Ray Mineral Services and partner laboratories (www.xrayminerals.co.uk; XMS) and at Petrolab (www.petrolab.co.uk).

Table 1. The three lunar highland simulants purchased from Lumina Sustainable Materials Ltd. and the lunar mare simulant EAC-1 received from the European Astronaut Centre (EAC).
2.2 Particle size distribution (PSD)
2.2.1 NGI
According to NS-EN ISO 14688-2:(2018), the grain size distribution is presented as percentages of the various grain sizes present in the soil as determined by sieving and sedimentation. For the soil description based on grain size distributions, NGI adopted ISO terminology (NS-EN ISO 14688-1:2018; NS-EN ISO 14688-2:2018). The particle size distribution (PSD) was determined on all simulants. Particle size distributions are determined using the falling drop method (Moum, 1965) for the clay and silt fractions, and wet/dry sieving for the coarser fractions (Supplementary Material). The particle size distributions are reported in accordance with NS-EN ISO 17892-4:(2016).
2.2.2 Vulcan Facility
PSD characterization was carried out at the Vulcan Facility on the simulants received. In total, 7 bags (including the fines from the receiver pan) were prepared from Lumina90, 5 bags from Lumina250 and 3 bags from Lumina2000 samples. These were based on the top cut grainsize as specified by the manufacturer of the material with suggested mesh size intervals recommended by the British Geological Survey (BGS) and NGI.
2.3 Particle shape
2.3.1 NGI
X-ray Computed Tomography (CT) scans were conducted to generate three-dimensional (3D) images of solid particles. The samples were placed in polyimide kapton tubes for scanning. The sand particles were scanned using a microCT scanner located at NGI in Oslo, Norway. Morphological characteristics of the particles were obtained from the 3D scans using image analysis. The scans were performed at a final isotropic resolution of 4 μm per voxel, with a camera binning of 1 × 1, an accelerating voltage of 90 kV, a current of 80 μA, and no filter placed in front of the camera-ray source. The samples underwent a 360° rotation about the vertical axis during scanning, with an exposure time of 1,000 ms per projection. An average of 3 frames were captured, totalling 3,400 ms per projection. The total scan time per sample was approximately 3 h. Image reconstruction was carried out using VG-Studio Max software (v.3.4.5 μCT from Volume Graphics) employing a filtered back projection algorithm with a ring artifact correction of 11 and no beam hardening correction was needed. Further details regarding image analysis and computed morphology analysis can be found in the Supplementary Material.
2.3.2 Vulcan Facility
Particle shape analysis using the VisiSize P-15 was conducted based on Particle/Droplet Image Analysis (PDIA), which employs light scattering and obscuration techniques for imaging and recording particles via the camera system’s sensors. This method was utilized to obtain high-resolution data between sieve mesh sizes and particle size distribution (PSD) data for fines collected in the receiver pan at the base of the stack. The inclusion of VisiSize analysis at selected mesh sizes allowed for the determination of whether significant quantities of smaller particles were retained by larger mesh sizes.
Approximately 0.07 g of material was used for each analysis, measured with a Sartorius MSE balance. Given the sensitivity of the balance, achieving the exact mass was not possible; a slightly higher mass (e.g., ∼0.075 g) was acceptable to account for any ultrafine material left on the weigh boat during transfer to the cuvette. Each VisiSize run was conducted for 10 min. Between runs, the cuvette was thoroughly cleaned and rinsed to ensure no residual material from previous runs was present.
2.4 Abrasivity
Soil abrasion was measured at SINTEF (www.sintef.no) using the Soil Abrasion Test™ (SAT™) in accordance with the method described by Nilsen et al. (2007). The SAT™ is based on the Abrasion Value Cutter Steel (AVS) test, which is used to assess the abrasiveness of rock. The SAT™ equipment consists of a rotating steel disc, a vibrating feeder, a suction assembly, a wear piece, and a 10 kg weight. During the test, the weight is lifted by the sample material as it passes over the rotating steel disc. The material is either crushed or momentarily lifted when passing under the SAT™ wear piece. Each material was tested twice, and the average weight loss was reported. Additionally, the percentage of the total sample greater than 4 mm and less than 1 mm after preparation was recorded. Abrasivity is reported as weight loss in milligrams (mg) and categorized as low (≤7.0 mg), medium (7.1–21.9 mg), or high (≥22 mg).
2.5 Particle density
The density of solid particles (ρs) was determined using the pycnometer method at NGI, as detailed in NS-EN ISO 17892-3:(2015). This method involves measuring the difference in the volume of liquid required to fill the pycnometer with and without the sample material. The density of the solid particles is calculated from the dry mass of the soil particles and the volume difference of the liquid. The unit weight of solid particles (γs) is calculated as ρs ⋅ g, where g = 9.807 m/s2. Two determinations were made for each test, and the average value was reported, provided the difference between the two measurements was less than 0.3 kN/m³.
2.6 Maximum and minimum dry unit weight
The maximum and minimum dry unit weight of soil specimens for each regolith were determined at NGI using an in-house method. This NGI-specific procedure is used to ascertain the maximum and minimum dry densities, which are method-dependent. The minimum dry density (γd,min) was determined by filling a 200 cm³ mould with the simulant. The mould, with an internal diameter of 72 mm, was centrally fitted with a tube through which the simulant was poured. The tube was raised slowly, allowing the sand to flow into the mould and fill it completely. Excess sand heaped above the mould’s top was carefully levelled with a straight edge before weighing the material. This procedure was repeated five times, and the average value was calculated and reported.
The maximum dry density (γd,max) was determined using a dry method. Dry regolith was placed into the mould in thin layers, each consisting of 20–25 g of soil. Each layer was subjected to vertical vibration for 30 s with a surcharge of 4.2 kN/m2 applied during the vibrations. The vibrator was applied on top of the surcharge. For this work, only the dry method was used, which involves vibrating each layer to achieve maximum compaction before weighing the material.
2.7 Loose and tapped bulk density
The loose and tapped bulk densities of dry lunar regolith specimens were determined at NGI following ASTM (2018), which is strictly applicable to powder samples. A 100 mL graduated cylinder was used to ensure compliance with the maximum allowable particle size limit (D50 < 1.3 mm or max. 2.5 mm). The volume of sample used was always within the recommended value (>50 mL) for a 100 mL cylinder (ASTM, 2018).
The loose bulk density (γd,L) was determined by funnelling dry sample in powder form into a 100 mL graduated cylinder. To prevent agglomeration and segregation, the sample was passed through a 1 mm screen mesh before being centrally placed into the cylinder. The sample surface was levelled if it was heaped above the cylinder’s rim, and the volume was read to the nearest 0.5 mL, given that the cylinder had 1 mL marking intervals. The total mass of the cylinder and sample was then measured using a scale with an accuracy of 0.01 g. This procedure was repeated five times, and the average mass was calculated.
The tapped bulk density was determined using the ASTM (2018) method. The sample-filled graduated cylinder was placed in a mechanical tapper with a fixed amplitude of 3 mm. The volume of the sample in the cylinder was measured after 500, 750, and 1,250 taps. If the volume difference between successive measurements was less than 2%, the tapping was considered complete; otherwise, additional tapping was performed until this criterion was met.
2.8 Water content
The water content (w) is defined as the mass of water in the sample, expressed as a percentage of the mass of solids. This method, detailed in NS-EN ISO 17892-1:(2014), was performed at NGI. To determine the water content, a representative portion (>50 g) of the samples were weighed before (at 20°C) and after oven drying for 40 h at approximately 50°C.
2.9 Bulk rock chemistry
2.9.1 XRF
At XMS, samples for major element analysis were oven-dried at 80°C and milled to a fine powder using a pestle and mortar. A 1.2 g portion of this material was calcined at 1,050°C for 1 h in a muffle furnace to determine the loss on ignition (LOI). Subsequently, 5 g of lithium borate (LiBO₂) flux was mixed with 0.5 g of the calcined sample in a platinum crucible, and a fused bead was produced using a Vulcan Automatic Fusion Machine. This fused bead was analysed using a Rigaku Supermini 200 Wavelength Dispersive X-Ray Fluorescence (WD-XRF) spectrometer, followed the procedures after Norrish and Hutton (1969), calibrated with geologically relevant reference materials to ensure accurate and repeatable results. Instrument performance was monitored daily using PHA adjustments and three monitoring standard beads.
For trace element analysis, samples were also oven-dried at 80°C and milled in an agate ball mill. A 10 g portion of the milled sample was combined with a polyvinyl alcohol binder (1% Moviol), and the mixture was pressed at 15 tons for 2 min using polished stainless-steel plates to produce a 32 mm pellet. The pellets were then oven-dried at 80°C for 2 h and analysed using a Rigaku NEX-DE Energy Dispersive X-Ray Fluorescence (ED-XRF) spectrometer, also calibrated with geologically relevant reference materials to ensure accurate and repeatable analyses.
2.9.2 ICP-OES and ICP-MS
Inductively-Coupled Plasma–Optical Emission Spectrometry and Mass Spectrometry (ICP-OES and MS) analysis were undertaken by XMS sister lab Origin Analytical, Welshpool by Lithium Metaborate Fusion following the method presented in Finlay et al. (2023). Both instruments analyse samples in solution, therefore all solid samples need to be dissolved prior to analysis. All samples were then ground to a fine powder in agate mortars. Following preparation, the samples were prepared for ICP analyses by using the lithium metaborate (alkali) fusion procedure, as advocated by Jarvis and Jarvis (1992a) and Jarvis and Jarvis (1992b). The flux was mixed with the sample in a carbon crucible with a 5:1 ratio and heated to 1,050°C in a muffle furnace. The molten bead was then tipped into dilute nitric acid (2%) and allowed to dissolve. The chemical composition of the dissolved samples were determined using a Thermo iCAP 7000 ICP-OES and Thermo iCAP RQ ICP-MS instruments, with quantitative data being acquired for forty-eight elements, which include ten major elements, e.g., Al, Si, Ti, Fe, Mn, Mg, Ca, Na, K and P, twenty-four trace elements.The precision of the geochemical data acquired by the ICP analyses is determined by replicate analyses of multiple preparations of certified rock standard reference materials (SRMs), along with triplicate preparations of the samples. With reference to the SRMs, the absolute accuracy of all the data are generally considered to lie within the range of error achieved for multi-determinations of the same sample.
2.10 Mineralogy
2.10.1 AMICS automated SEM-EDS (XMS)
Automated scanning electron microscopy with linked energy dispersive spectrometers (SEM-EDS) is a widely used tool for quantitative mineral analysis (e.g., Pirrie et al., 2004; Schultz et al., 2020). A range of automated SEM-EDS hardware and software configurations are available, and in this paper, samples have been analysed using two such platforms; AMICS and Mineralogic. Previous studies have used automated SEM-EDS in the analysis of lunar materials (e.g., Bell et al., 2020). The mineralogy of four samples was determined using automated SEM-EDS analysis based on an AMICS (Automated Mineral Identification and Characterization) system operated by Vidence Inc. Approximately 1 g of each sample was dispersed with a filler, resin-impregnated, cured, cross-sectioned, and remounted in a resin block. The cross-sectioned surfaces were polished to expose both areas of the cross section for analysis, allowing for the detection of particle segregation within the resin. The polished surfaces were then carbon-coated prior to analysis.
The mineralogy and texture of the samples were quantified through automated SEM-EDS mineral analysis (Pirrie et al., 2004; Schultz et al., 2020). The analysis was conducted using a Hitachi SU3900 SEM equipped with a large area (60 mm2) Bruker SDD EDS and the AMICS software. Optimized beam conditions included an accelerating voltage of 20 kV and a beam current of approximately 15 nA. Samples were analysed in a segmented field image mode, which divides the BSE image into domains of similar brightness corresponding to different mineral grains or crystals. A representative EDS X-ray spectrum was acquired from each segment, and the identified mineral was assigned to the entire segment. Resolutions of 0.8 µm for fine fractions and 2 µm for coarse fractions were used to highlight both textural and modal mineralogical information.
The EDS spectra were compared with a library of measured and synthetic standards for mineral identification, with new phases added to the standards list as needed. For synthetic materials, the mineral names correspond to chemical compositional groups. Data outputs included modal data expressed as area percentages, particle size data, mineral association data, and AMICS false-colour mineralogical particle images of the measured areas. Additionally, a full-area SEM-BSE montage was captured for each analysed area during the automated mineralogy analysis.
2.10.2 XRD (XMS)
The XRD measurements were undertaken at XMS. The samples were first disaggregated using a pestle and mortar. A 2 g split of this material was micronized in water using a McCrone Micronizing Mill. The gentle size reduction process used by this mill preserves the crystal lattice of the sample producing a powder with a mean particle diameter of 5–10 μm. The slurry was dried overnight at 80°C, re-crushed to a fine powder and backpacked into a steel sample holder, producing a randomly orientated powder for presentation to the X-ray beam. Whole rock samples were scanned on a PANalytical X’Pert3 diffractometer using CuKα radiation at 40 kV and 40 mA. The diffractometer is equipped with Automatic Divergence Slits (10 mm irradiated area), sample spinner and PIXcel 1-D detector. Whole rock samples were scanned from 4.5° to 75° (2θ) at a step size of 0.013 for 2 h.
The samples were analysed before and after being spiked with a silicon crystalline powder used as internal standard, for the determination of the amorphous content. If the samples have amorphous phases, the standard phase fraction would be overestimated, and the crystalline phases recalculated to account for the amorphous content.
The qualitative analysis of whole rock diffractograms to identify the minerals present, was carried out using HighScore Plus (v.4.9) by Malvern PANalytical equipped with ICSD and PDF-4 Minerals databases. XRD quantitative phase analysis on whole rock samples was performed using the Rietveld method (Post and Bish, 1989) with BGMN Autoquan software.
For the clay fraction analysis, a 5 g split of the sample that was disaggregated at the first stage of the whole rock preparation (see above) was accurately weighed and recorded. Separating the <2 μm fraction was achieved with ultrasound and centrifugation by suspending the sample in a weak sodium hexametaphosphate solution. The total weight of clay extracted was determined by removing a 20-25 g aliquot of the final clay suspension and evaporating to dryness at 80°C. The initial and final weights of the beaker used were also recorded in the register. The clay XRD mount was obtained by filtering the clay suspension through a Millipore glass micro-fibre filter and drying the filtrate on the filter paper. The samples were analysed as an untreated clay, after saturation with ethylene glycol vapour overnight and following heating at 380°C for 2 h, with a further heating to 550°C for 1 hour (Moore and Reynolds, 1997). The clay filters were scanned on a Philips PW1730 Generator with a CuKα radiation at 40 kV and 40 mA. from 3° to 35° (2θ) at a step size of 0.05° and 2 s step time.
Identification and characterization of clay minerals in the <2 μm fraction was performed following the guidelines described by Moore and Reynolds (1997) and overlaying the diffractograms from the four clay treatments.
2.10.3 FTIR (XMS)
FTIR analysis was carried out on the same split as the XRD analyses to ensure that the results are directly comparable to the XRD data. The samples were analysed with a compact Bruker Alpha FTIR spectrometer which was initially set-up to collect a background spectrum with a clear sample plate. Once this was collected, approximately 50 mg of the powdered sample was put on the sample window and analysed (Apeiranthitis et al., 2022). The instrument then calculates and presents the spectrum. Upon data collection, the different vibrating bands are qualitatively assigned to the structures/stretching and bending vibrations of molecules that are expected to be present based on the XRD results, e.g., Si-O for silicates, CO3 for carbonates, Al-O for aluminosilicates. The FTIR range is used for the analysis of the samples is from 4,000 cm-1 to 400 cm-1, 32 scans with a spectral resolution of 4 cm-1.
2.10.4 Mineralogic automated SEM-EDS (petrolab)
Quantitative mineralogical analysis was performed using ZEISS Mineralogic Mining, a system that integrates a mineral analysis engine with a scanning electron microscope (SEM) and energy dispersive spectrometers (EDS) for automated analysis. For each sample fraction, a polished block was prepared and carbon-coated to a thickness of 10 nm. Whilst sample preparation protocols are typically proprietary the essential principle of ensuring representative aliquots are correctly prepared from representative samples has been outlined in numerous papers (see Brough et al., 2019 and references therein). Sample preparation must be cognisant of the risks of density settling either of dense grains from less dense grains, or through incorrect resin-matter ratios allowing for sliding or agglomeration. Samples are also mixed with a filler to aid particle separation, and subject to a vacuum to remove excess bubbles. The analysis was conducted using a ZEISS EVO MA 25 SEM at Petrolab Ltd. (Redruth, United Kingdom), equipped with a Bruker xFlash 6|60 x-ray detector for EDS. The Mineralogic Mining 1.6 software controlled the SEM and facilitated the acquisition of morphology and X-ray data. Graham et al. (2015) outlines the workflow for the utilisation of the software to ensure the optimum running conditions for the samples to collect statistically valid data. The calculations for valid particle statistics are described by Brough et al. (2019) allow for 2,500 analysed grains in most operational contexts. A phase classification scheme was developed within the Mineralogic Mining software, which delineates grains into different phase classes by matching quantitative measurements of elemental composition from the EDS spectrum with standard mineral composition data. Mineral identification is based on the best match with the acquired chemical data, unless otherwise stated. When specific mineral identification is not possible due to a range in elemental composition, a mineral group name or a general name based on dominant elements is used. Mass values are estimated from measurements of particle or grain areas, without correction for stereological error, and an assumed phase density. The mapping mode was employed to determine the overall abundance of major and minor phases. This mode acquires data at a defined pixel spacing, adjusted to account for mineral grain size and texture in combination with the SEM magnification settings.
3 Results
3.1 Particle size distribution (PSD)
A summary of the PSD data (carried out at NGI and Vulcan Facility) is shown in Figure 1. Based on the fall-drop and dry/wet technique at NGI, the gain sizes of Lumina samples span from fine silt fraction to coarse silt for Lumina90, fine silt to medium sand for Lumina250 and coarse sand to fine gravel for Lumina 2000. EAC-1 grain size spans from fine silt to coarse sand.
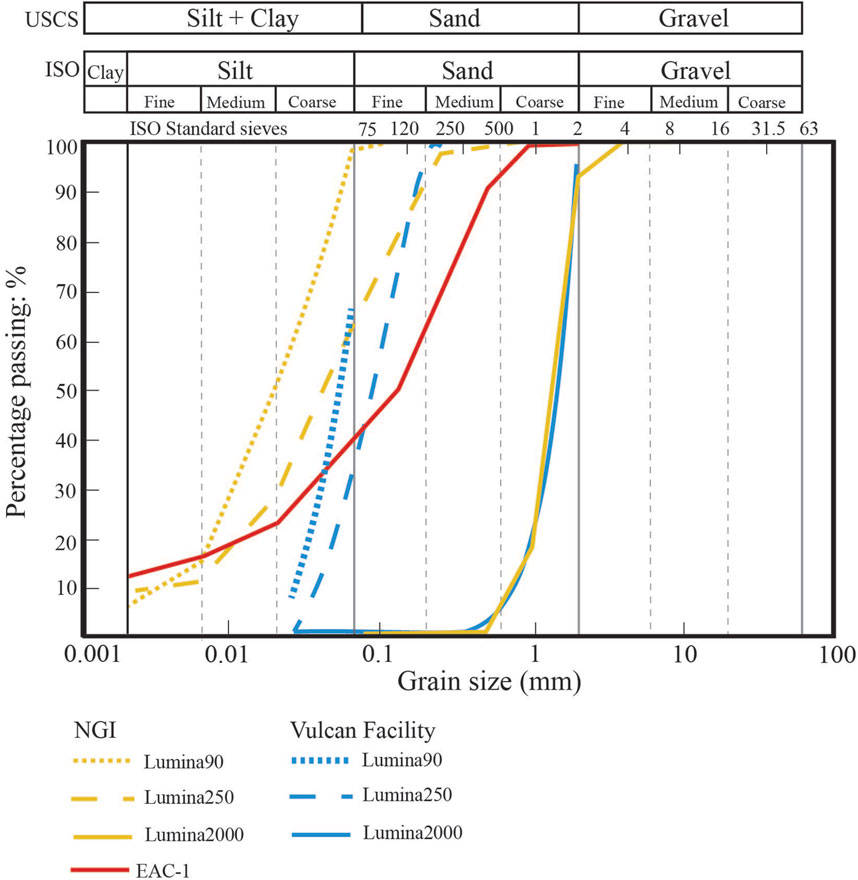
Figure 1. Summarized PSD curves of the Lumina and EAC-1 samples measured by NGI and Vulcan. The soil description based on grain size distribution is according to NS-EN ISO 14688-1:2018 (E) and NSEN ISO 14688-2:2018 (E). The silt and clay fractions were measured by the falling drop method at NGI, whereas coarser fractions were analysed by wet/dry sieving. Solid grey lines indicate the ISO categories, while dashed grey lines indicate the ISO subcategories.
The five subsamples of each parent sample analysed at the Vulcan Facility followed almost identical paths in terms of the quantities of material held by each mesh size (Supplementary Table S1). Lumina2000 was listed as having a top cut of 2000 μm. By mass, only a very small portion of each subsample was 2000 μm, whereas the largest percentage of each subsample fell into the 1,000 μm and the 500 μm mesh stopped the second largest portion of the subsample. The smaller mesh sizes tended to stop only minute masses of material. Overall, the Lumina2000 PSD trend is very consistent across all 5 subsamples.
Lumina250 was listed as having a top cut of 250 μm. Similarly, to Lumina 2000, only a small proportion of each Lumina250 subsample meets the 250 μm top cut. The bulk of the material by mass falls into the 125 μm, 63 μm, and 25 μm mesh sizes, with 63 μm material representing approximately half of this material. The PSD was less consistent with Lumina 250. There was a wider spread of percentage of the material passing for the 25 μm, 63 μm and 125 μm mesh sizes (Figure 1). This was particularly evident with the 25 μm material, which passed ca. 30% of material.
Lumina90 was listed as having a top cut of 90 μm. Due to the stated top cut falling between the 125 μm and 63 μm meshes available, it was only possible to measure the material stopped by the 63 μm and 25 μm meshes. The quantities of material accumulating as fines in the receiver pan was significantly greater than occurred with the Lumina2000 and Lumina250 subsamples (Supplementary Material). Similarly, to Lumina250, there was a wider spread of the percentage of the material passing for the 25 μm and 63 μm mesh sizes, but there were no significant outliers and no minus values.
3.2 Particle shape
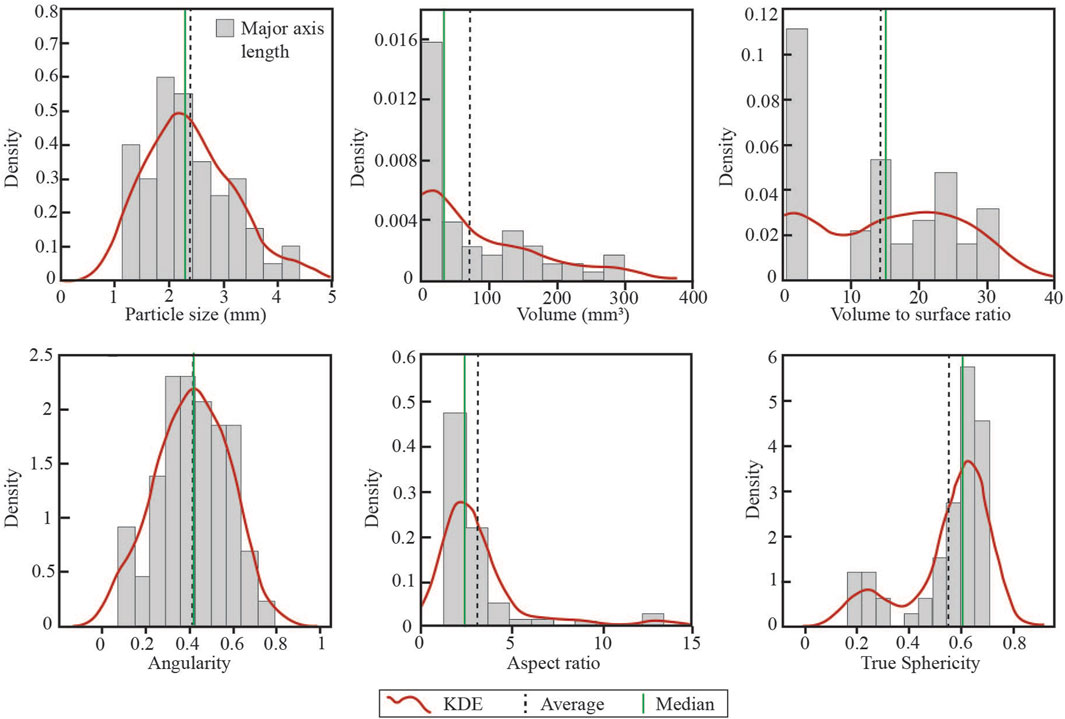
Three-dimensional particle shape analysis was carried out by NGI on the Lumina 2000 sample. Figure 2 shows summary plots of the morphological characteristics of the grains. The average particle size is 2.4 mm, the average volume is 73 mm3, the average volume to surface ratio is ca. 14, while the average angularity is 0.41. The average aspect ratio is 2.14, and the average sphericity is 0.55.
To acquire sphericity data of the Lumina parent samples, three subsamples (01, 02 and 03) from each parent sample were tested using VisiSize (2D analysis) at the Vulcan Facility (Supplementary Table S2). The average sphericity is 0.51 for Lumina 2000, 0.47 for Lumina250 and 0.46 for Lumina90 (Figure 3).
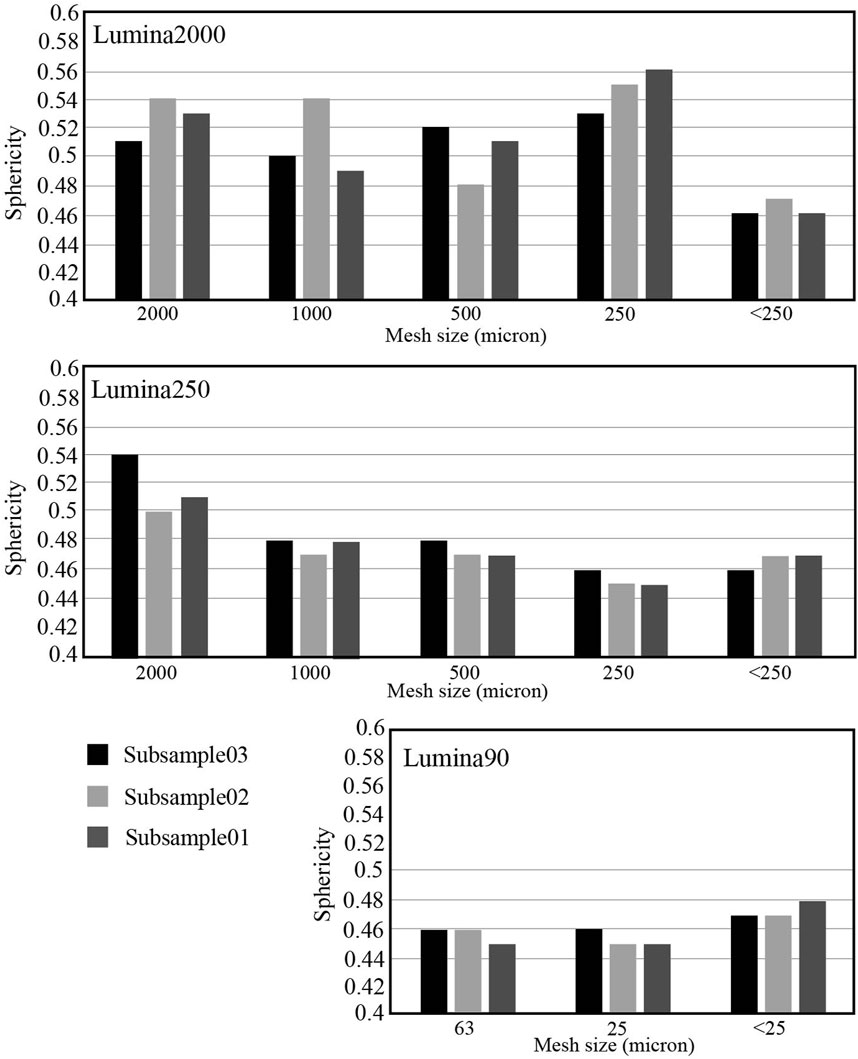
Figure 3. The sphericity results analysed by VisiSize: 3 subsamples of each of the three parent samples: Lumina 2000, Lumina250, and Lumina90.
3.3 Abrasivity
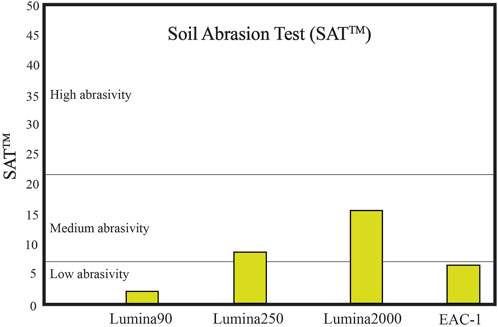
Lumina90 abrasion is classified as low (2), while Lumina250 (9) and Lumina 2000 (15) are classified as medium. EAC-1 represents low abrasiveness (6.5), being close to the low-medium boundary. A summary of the results is given in Figure 4 and details can be found in Supplementary Table S3.
3.4 Minimum and maximum dry unit weight
Both the minimum/maximum dry unit weight (and tapped/loose bulk density; Figures 5A, B) indicate strong correlation with increasing particle size of the Lumina samples. Lumina90 has minimum and maximum dry unit weight as of 9.26 and 15.43 kN/m3, Lumina250 has values of 11.87 and 18.67 kN/m3, and Lumina2000 has values of 13.10 and 17.63 kN/m3, respectively. EAC-1 has the highest values of 15.36 and 22.17 kN/m3.
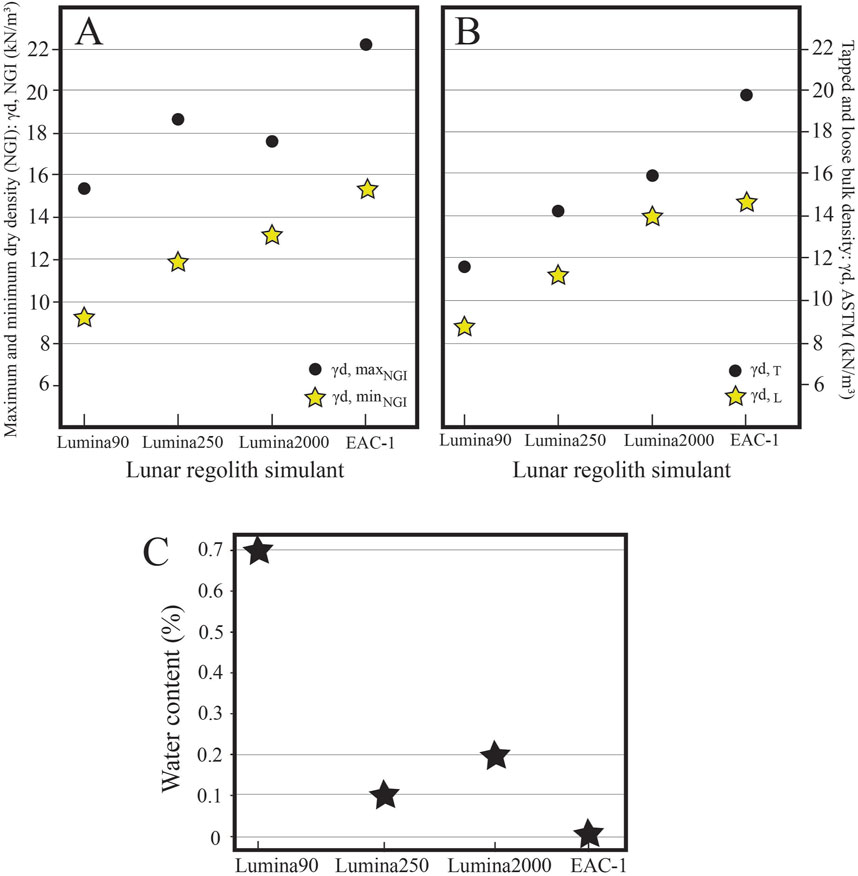
Figure 5. Limiting densities as (A) maximum (filled circles) and minimum (filled stars) dry unit weight after NGI method; (B) tapped (filled circles) and loose (filled stars) bulk density after ASTM, 2018; (C) Water content of the Lumina and EAC-1 samples determined at NGI.
3.5 Water content
The determination of water content (Figure 5C) of the different lunar highland samples indicate 0.1%–0.2% water presence, excluding sample Lumina90 containing 0.7%. EAC-1 suggests no water content.
3.6 Bulk rock chemistry and mineralogy
The whole-rock major element (and trace elements; Supplementary Material) geochemical measurements were carried out by XMS using XRF (Supplementary Table S4) and ICP-OES/MS (Supplementary Table S5; Figure 6). Based on the XRF measurements, the SiO2 content of the Lumina samples have values between 48.4-49.8 wt%, TiO2 contents of 0.05–0.1 wt%, MgO contents of 0.1–0.4 wt%, Al2O3 as of 30-31.2 wt%, CaO of 14.9–15.5 wt% and Na2O compositions of 2.3–2.5 wt%. The values carried out by ICP-OES analysis are highly similar to the XRF compositions. The less deviation between compositions carried out by different instruments occur in the case of MgO, Al2O3 and TiO2.
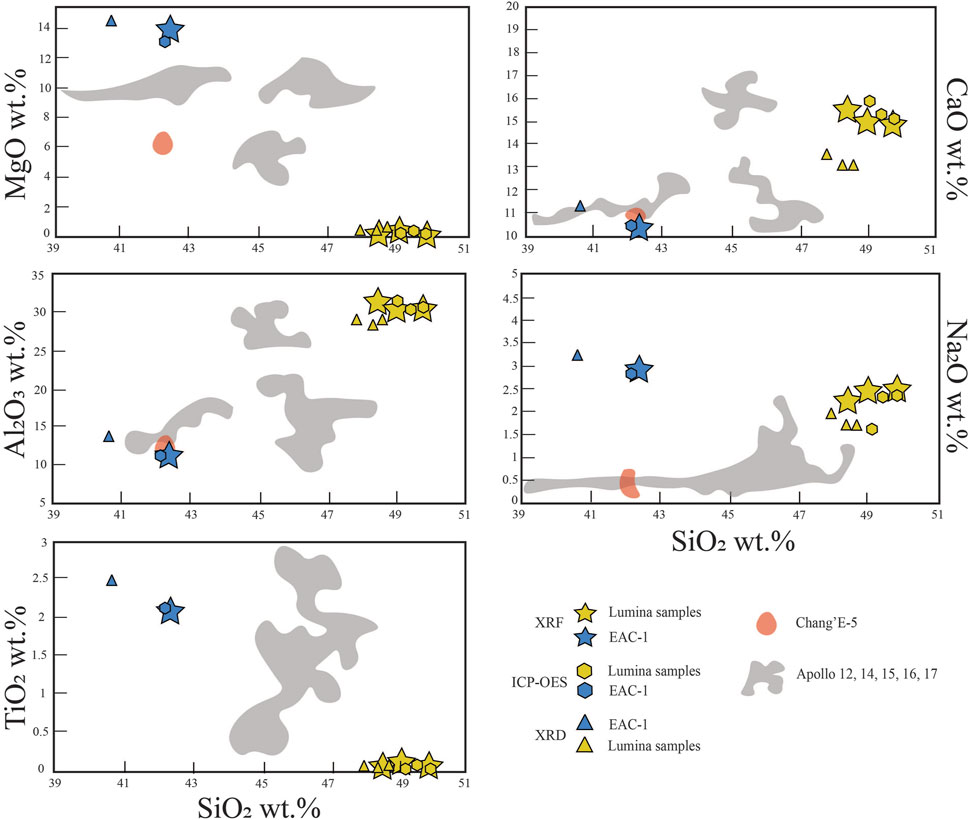
Figure 6. The bulk rock chemistry of the Lumina and EAC-1 samples carried out using XRF and ICP-OES analysis along with Apollo 12, 14, 15, 16, 17 and ChangE′5 data (summarized in Taylor et al., 2019) for comparison.
EAC-1 compositions measured by the two instruments are characterized by low SiO2 contents (between 42.1-42.3 wt%) compared to the Lumina samples, further high TiO2 (2.1 wt%) and MgO values (13.1–13.8 wt%), higher Na2O (2.8–2.9 wt%) and relatively low Al2O3 (11.2wt%) and CaO (10.4 wt%).
3.6.1 AMICS automated SEM-EDS (XMS)
The modal mineralogy data (Figure 7A B; Supplementary Tables S6, S7) are shown as area percentage (%), with major minerals defined as those constituting more than 10%, minor minerals as 1%-10%.
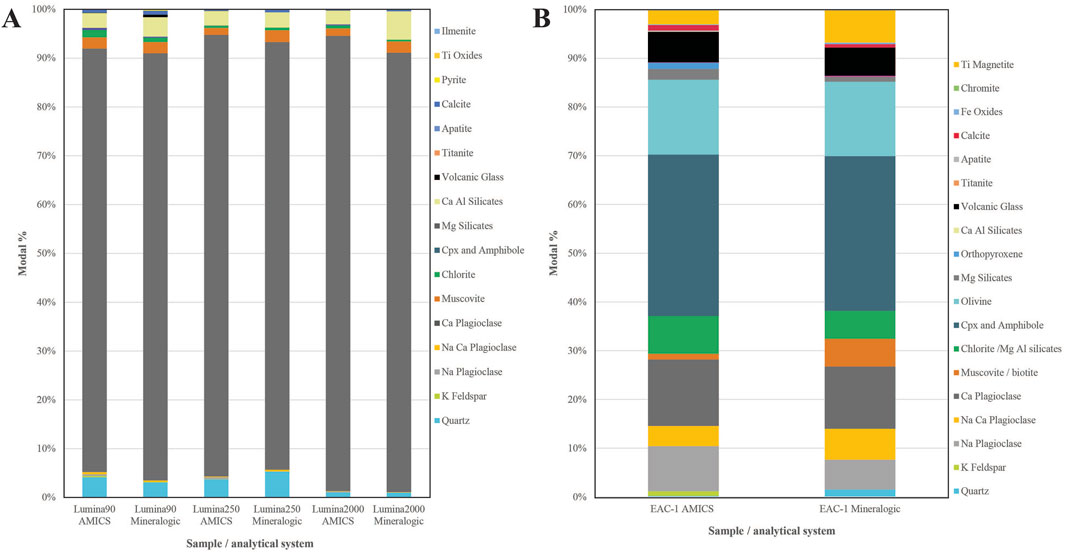
Figure 7. Modal mineralogy results of the lunar highland and mare simulants. (A) Modal mineralogy of the three Lumina samples analysed using (i) AMICS and (ii) Mineralogic SEM-EDS analysis systems. (B) Modal mineralogy of the EAC-1 sample analysed using (i) AMICS and (ii) Mineralogic SEM-EDS analysis systems.
Lumina90 (Supplementary Figure S5) consists of Ca plagioclase (86.67%) as the only major mineral phase and quartz (4.14%), muscovite (1.91%), Mg-Al silicates (1.06%), Ca-Al silicates (3.02%) as minor phases. Furthermore, K feldspar, Na plagioclase, Na-Ca plagioclase, biotite, chlorite, clinopyroxene and amphibole, Mg silicates, volcanic glass, titanite, apatite, calcite, pyrite, Ti oxides and ilmenite were present as trace mineral phases. The AMICS particle images and mineral association data indicate that the mineral grains in Lumina90 are typically well-liberated, meaning the particles are mostly monomineralic. The Ca plagioclase particles show no evidence of chemical zonation. Mineral association data reveal that 97.4% of the Ca plagioclase is associated with “background” (liberated), and 1.2% is associated with the Ca-Al silicate mineral group.
Lumina250 (Supplementary Figure S6) is comprised of Ca plagioclase (90.39%) as the major phase, quartz (3.74%), muscovite (1.30%), Ca-Al silicates (3.01%) as minor phases and K feldspar, Na plagioclase, Na-Ca plagioclase, biotite, chlorite, Mg-Al silicates, clinopyroxene and amphibole, volcanic glass, titanite and calcite as trace minerals. The Lumina250 sample is a uniform, fine-grained powdered rock product (Supplementary Figure S1). AMICS particle images and mineral association data show well-liberated mineral grains. The Ca plagioclase particles exhibit no chemical zonation. Mineral association data indicate that 97.3% of Ca plagioclase is associated with “background” (liberated), along with 1.0% associated with the Ca-Al silicate mineral group.
Lumina 2000 (Supplementary Figure S7) represents Ca plagioclase (93.24%) as the major phase, quartz (1.03%), muscovite (1.31%), Ca-Al silicates (2.85%) as minor phases, and K feldspar, Na plagioclase, Na-Ca plagioclase, biotite, chlorite, Mg-Al silicates, clinopyroxene, amphibole, volcanic glass, titanite and calcite as trace minerals. AMICS particle images and mineral association data show a mix of well-liberated mineral grains and numerous polymineralic grains (rock fragments). The Ca plagioclase particles do not show evidence of chemical zonation. Mineral association data indicate that 72.8% of Ca plagioclase is associated with “background” (liberated). Other associations include quartz (3.3%), K feldspar (0.5%), Na plagioclase (1.9%), Na-Ca plagioclase (1.3%), muscovite (5.7%), biotite (0.6%), chlorite (0.6%), Mg-Al silicates (1.4%), clinopyroxene and amphibole (0.5%), Ca-Al silicates (8.3%), and calcite (2.8%).
EAC-1 (Figure 7B) is composed of major clinopyroxene and amphibole (33.09%), olivine (15.37%) and Ca plagioclase (13.60%) along with minor Na plagioclase (9.23%), NaCa plagioclase (4.16%), chlorite (2.79%), MgAl silicates (4.95%), Mg silicates (2.19%), orthopyroxene (1.30%), volcanic glass (6.25%), calcite (1.13%) and Ti magnetite (2.89%). Trace phases present are quartz, K feldspar, muscovite, biotite, CaAl silicates, titanite, apatite, Fe oxides, chromite, ilmenite and “undifferentiated”. The AMICS and SEM-BSE particle images (Supplementary Figure S8) show that the larger particles have interlocking crystalline textures; most grains are interpreted to be fine grained mafic igneous rock fragments.
3.6.2 XRD (XMS)
Based on the XRD results (Supplementary Table S8), plagioclases comprise the bulk of the mineralogy in all samples analysed that appear to be bytownite (An85), while in the EAC-1 sample it appears to be andesine (An50). The Lumina samples together with the plagioclase, are composed of quartz, clinozoisite, chlorite, muscovite, biotite, and trace amount of amphibole. EAC-1 sample is dominated by clinopyroxene together with forsterite, plagioclase, nepheline, analcime, chlorite with minor biotite, apatite, ilmenite, serpentine and quartz. Smectite is also present in the sample, but its peak was not resolved in the whole rock diffractogram and therefore the quantification of smectite is obtained from the clay fraction analysis. An amorphous phase was also quantified in EAC-1 sample.
3.6.3 FTIR (XMS)
The FTIR spectra of all the Lumina samples are presented in Figure 8A, where the 1,200–400 cm-1 region is displayed. Only EAC-1 (Figure 8B) shows a clear difference in the spectral pattern when compared to the rest of the samples. This spectral difference suggests that at least a qualitative separation of the samples using IR spectra is possible.
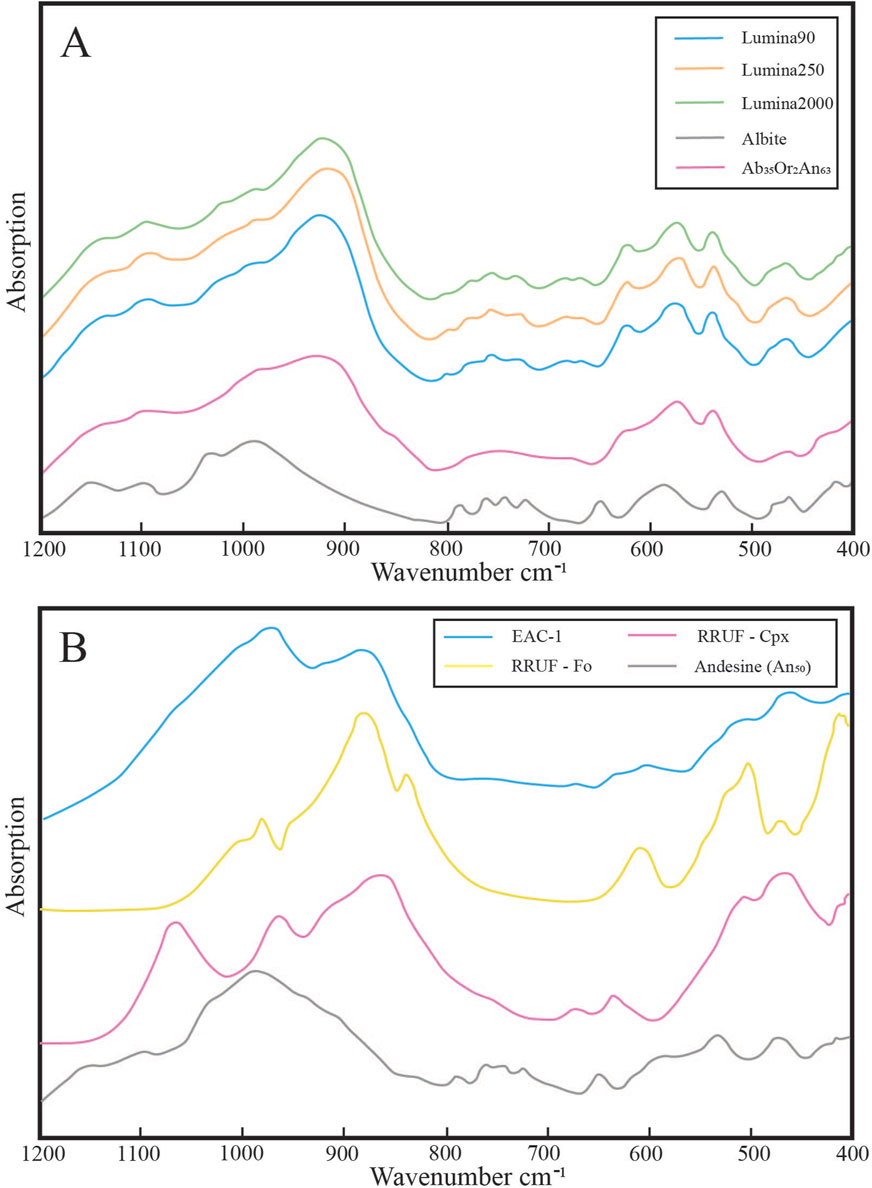
Figure 8. (A) FTIR spectra of Lumina90, Lumina250 and Lumina2000 and reference spectra of labradorite (An63) and albite internal standards. (B) FTIR spectrum of EAC-1 along with reference spectra of forsterite, clinopyroxene (augite; from RRUF database), and andesine (An50; internal standard).
The Lumina samples are highly similar and can be grouped and interpreted together. The EAC-1 clearly deviated from the others and is interpreted separately. In addition, the EAC-1 sample has some additional spectral information at the region of ∼1,450 and ∼1,600 cm-1, which is not seen on the other samples. These two regions correspond to the presence of carbonate and most likely adsorbed water due to clay minerals, respectively.
The FTIR spectra of the Lumina samples are shown (Figure 8A) along with two nominal (reference) spectra of two plagioclases, namely, albite and labradorite (An63). It can be observed that the simulant spectra fall in between the two reference spectra suggesting a combination of the two mineral phases. The XRD results show the presence of other phases such as clinozoisite, together with small amounts of quartz, micas and chlorites. The strong plagioclase signal, however, is masking the signal of the other minerals and therefore the accurate identifications of the other phases is complicated. Wavelengths from 1,200 to 850 cm-1 show a combination pattern of the two plagioclases with the main Si-O2 peak bond expressed better by a Ca-rich plagioclase (labradorite spectrum). The region 850–670 cm-1 is more characteristic of Na-rich plagioclase together with a diagnostic 4-peak pattern between 700-800 cm-1. Below the region of 650 cm-1, the simulant spectra are similar to Ca-rich plagioclase. Minor deviation from the clean spectral pattern of plagioclase is observed in the region of 650–700 cm-1.
In Figure 8B, the EAC-1 sample is shown with three reference spectra of forsterite, clinopyroxene and andesine. Based on the XRD results, these three minerals constitute ∼60% of the mineral composition of the sample. When the sample spectrum is compared to the reference spectra, it can be observed that no distinct peaks can be assigned to any of the three references. The signal in the region of 1,200–850 cm-1 seems to be a combination of all three mineral references. Forsterite is likely to have a major contribution on the peak at ∼ 900 cm-1, while the peak closer to 1,000 cm-1 is more likely to be controlled by the presence of andesine and clinopyroxene. Subregions (shoulders bands and peaks) within wavelengths 1,200–850 cm-1 comprise the signal of the three main phases together with the other minor phases present in the sample. A similar observation can be made for the rest of the M-IR region from 850–400 cm-1. The high concentration of the main phases makes the distinction of the minor phases a challenge. More advanced techniques such as normalisation could potentially reveal the spectral pattern of the minor mineral phases.
3.6.4 Mineralogic automated SEM-EDS (petrolab)
The primary mineral phases identified in the Lumina samples (Supplementary Table S9) are feldspar phases–anorthite in majority, and anorthoclase as trace phase - alongside quartz (Figure 7A). The samples predominantly consist of anorthite, which comprises 87.4–89.9 wt% of the samples. Andesine is only detected as a trace component, constituting less than 0.4 wt%, while anorthoclase is present at even lower levels, up to 0.1 wt%. Quartz is a minor component, found in Lumina90 and Lumina250 at concentrations of 3.1 wt% and 5.3 wt%, respectively, and in Lumina2000 at 1.0 wt%.
Other mineral phases within the Lumina samples are clinozoisite, present at 3.1–5.8 wt%. Additional minor to trace phases consist of mica group minerals, clay minerals, carbonates, basaltic glass, sulphides, augite, accessory phases, iron oxides, and enstatite. Anorthite is the primary host for aluminium in the Lumina samples, with clinozoisite and mica group minerals serving as minor hosts. The overall aluminium content in the samples ranges from 17.8 to 18.8 %Al. For calcium, anorthite is again the principal host, with clinozoisite and carbonates as minor hosts. Other minor to trace hosts include accessory phases, andesine, anorthoclase, and clay minerals, with a total calcium content ranging from 12.8 to 13.8 %Ca. Potassium is primarily hosted by mica group minerals, with clay minerals serving as trace hosts, resulting in a potassium content of less than 0.2 %K. Sodium is primarily hosted by anorthite, with the overall sodium content in the samples ranging from 1.2 to 1.3 %Na.
Sample EAC-1 is reported to be a mare simulant, rather than a highland simulant, and this is reflected in the modal mineralogy (Figure 7B; Supplementary Figure S9). The feldspar phases vary from the highland simulants, in that anorthite is still the most abundant feldspar, present at 12.6 wt%; however, andesine and anorthoclase are present in higher abundances, 6.3 wt% and 6.0 wt% respectively. Titanomagnetite is also present at a higher abundance of 6.7 wt%; however, quartz is similar at 1.5 wt%. The sample is instead dominated by other mafic/ultramafic minerals, primarily augite (31.3 wt%) and olivine (15.1 wt%). Basaltic glass, mica and clay minerals also comprise 5.6–5.7 wt% each, with the clay minerals primarily comprising alterations of olivine. Other notable differences include the decrease in clinozoisite and slight increase in enstatite.
4 Discussion
4.1 Geotechnical results comparison to apollo samples
According to the analysis of the returned regolith samples from the lunar surface, it is observed that the lunar regolith predominantly consists of fine-grained particles, with over 90% of the particles being smaller than 1 mm in size. The average diameter (D50) of these particles is approximately 72 μm (Carrier, 2003; Carrier et al., 1973; Graf, 1993). The particle size distribution (PSD) of lunar regolith ranges from 0.002 mm to 4 mm, with the majority of particles falling within the range of 0.02 mm–0.13 mm. Applying the Unified Soil Classification System (USCS) to classify the samples, it aligns with the category of Sandy Silt (ML) soil. Based on both the internal (Vulcan Facility) and external (NGI) analyses of the Lumina samples, it can be stated, that Lumina250 approximates best to the average PSD curve of the lunar regolith data (Figure 9A). However, Lumina90 shares similarities with the shape of the average lunar regolith PSD curve (Figure 9A), representing similar PSD ratios within the fine fractions, whereas Lumina2000 represents the coarse fraction of the lunar regolith.
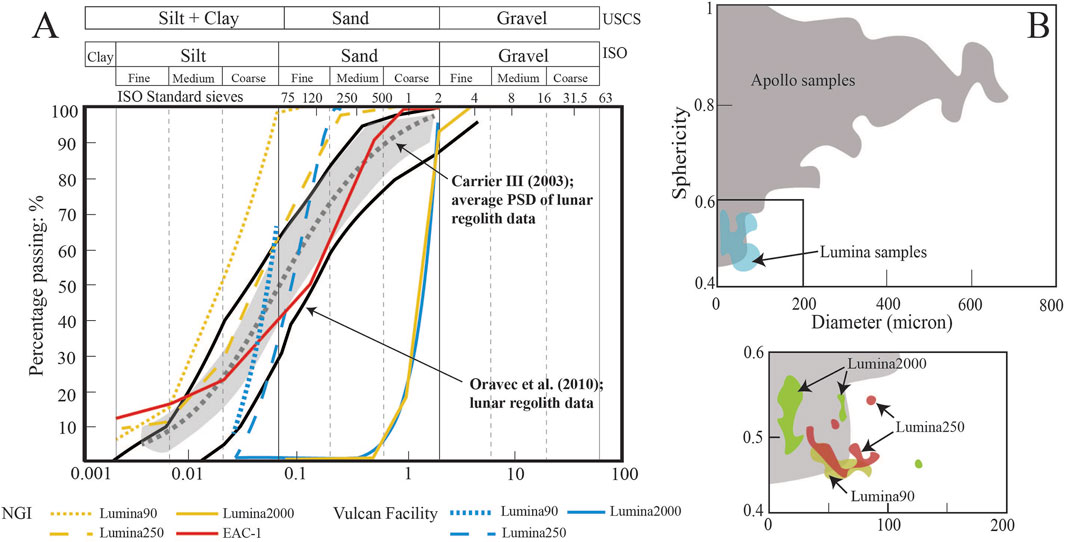
Figure 9. (A) PSD curves of the Lumina and EAC-1 samples. Grey field: +/- 1STD of the average lunar regolith PSD data (Carrier, 2003). (B) Sphericity data of the Apollo samples (grey field): 10,084 (mature mare), 15,601 (immature mare), 64,501 (mature highland) and 67,461 (immature highland). Sphericity data of the Lumina samples (blue field; Lumina90, Lumina250, Lumina 2000) analysed at the Vulcan Facility by VisiSize. Inset: The different Lumina PSR sphericity results carried out at the Vulcan Facility based on the VisiSize 2D data.
Mature regolith is characterized by prolonged exposure to micrometeorite impacts and solar wind activity, leading to the fragmentation and rounding of particles over time (McKay et al., 1991). Consequently, mature Apollo samples exhibit smaller particle sizes and higher sphericity values compared to the immature samples, reflecting their advanced maturity levels (Tsuchiyama et al., 2022). Additionally, the aspect ratio values are not influenced by maturity but are determined by the terrain type (Deitrick and Cannon, 2022). The lower aspect ratio values observed in highland samples may be attributed to their higher plagioclase content, which consists of elongated particles that are more resistant to breakdown compared to pyroxenes or olivines typically found in mare regolith. The Lumina samples analysed plot to the lowest sphericity/diameter portion of the Apollo samples. The Lumina samples therefore represent the immature counterpart of the lunar regolith, with irregular/angular (<0.6) shapes (Figure 9B).
Findings presented by Cole et al. (2010), concerning the mechanical strength of lunar regolith grains in comparison to terrestrial materials of analogous composition, have elucidated that in the case of the lunar highlands, plagioclase grains may exhibit mechanical strengths two to three times lower than their terrestrial counterparts under compression. The study also underscores the disparity in robustness between lunar and terrestrial materials, attributing it to the composition of lunar grains, which seem to comprise smaller fragments fused or sintered together. This structural configuration manifests as significantly weaker at the boundaries of the fragments than the internal crystal energies that bind mineral crystals grains, resulting in increased friability, which influences the abrasive behaviour. Pure alumina or silica (as shown in Figure 10), being closer to the compositional characteristics of lunar regolith, could serve as worst-case scenario abrasives, endmembers on the abrasion spectrum. Regarding the Lumina samples, Lumina2000 is the most abrasive, while Lumina250 and EAC-1 shows medium abrasiveness and Lumina90 is the least abrasive. Silica on 1,018 and 1,045 steel has abrasiveness of 0.005 cm3, similarly to Lumina 2000. The lunar simulant NU-LHT-2M (Martin et al., 2022) is similarly abrasive on 1,018 steel as Lumina 2000, while on 1,045 steel, it shows similarity to Lumina90.
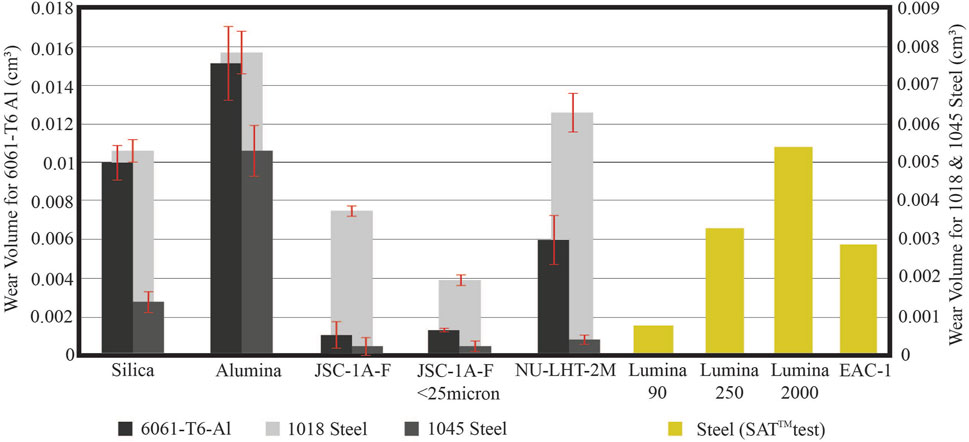
Figure 10. Modified figure after Kobrick et al. (2010). Grey scale: Wear volume of metals abraded with tribotester by various lunar simulants (JSC1-1A-F and NU-LHT-2M) and abrasives (silica, aluminium). Yellow: Wear volume of steel (low alloy steel containing nickel, chromium and molybdenum), abraded by the Lumina and EAC-1 samples calculated from the SAT™ measurements by SINTEF (Figure 6).
Based on data from lunar missions conducted on the nearside (Table 2), the bulk density of lunar regolith typically ranges from 0.8 to 2.3 g/cm³, with variability influenced by factors such as depth and location, particularly in intercrater regions. The dry unit weight values for Lumina simulants range from 0.9 to 1.86 g/cm³, with loose and tapped bulk densities between 0.89 and 1.81 g/cm³, while EAC-1 displays higher dry unit weight values, ranging from 1.5 to 2.2 g/cm³, and loose and tapped bulk densities between 1.46 and 1.99 g/cm³. These values align with the bulk density range of lunar regolith (Table 2). As shown in Figure 11 (data used can be found in Supplementary Figure S10), the Lumina and EAC-1 simulants plot within the minimum dry unit weight ranges of terrestrial sands and soils (Cubrinovski and Ishihara, 2002) with higher maximum dry unit weight estimates. Lumina samples exhibit trends consistent with lunar soil regression data (Quinteros et al., 2024) supporting the simulant validity for replicating lunar regolith compaction and density behaviour. On the other hand, EAC-1 aligns closer to the lunar simulants (LMS and LHS; Long-Fox et al., 2023) displaying the highest maximum dry unit weight values.
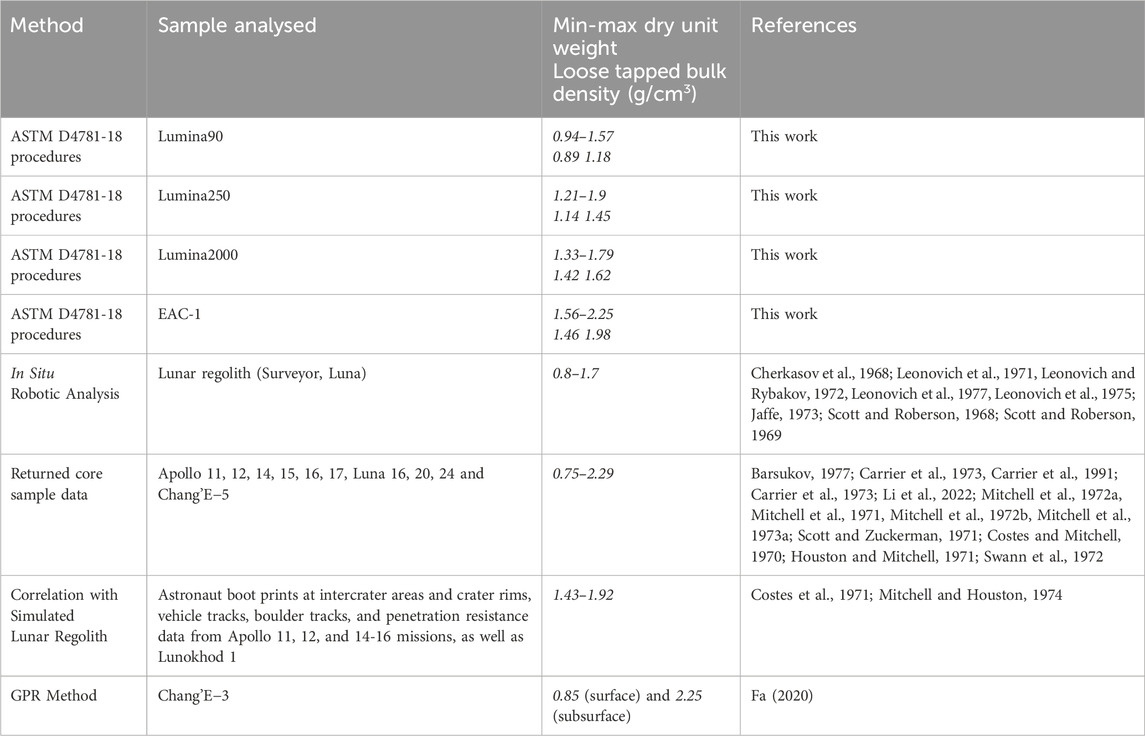
Table 2. Summary of dry unit weight and bulk density data for the Lumina and EAC-1 samples analysed by NGI and known bulk density values of Surveyor, Luna, Apollo, Chang′E−3 and -5 returned or in-situ analysed samples.
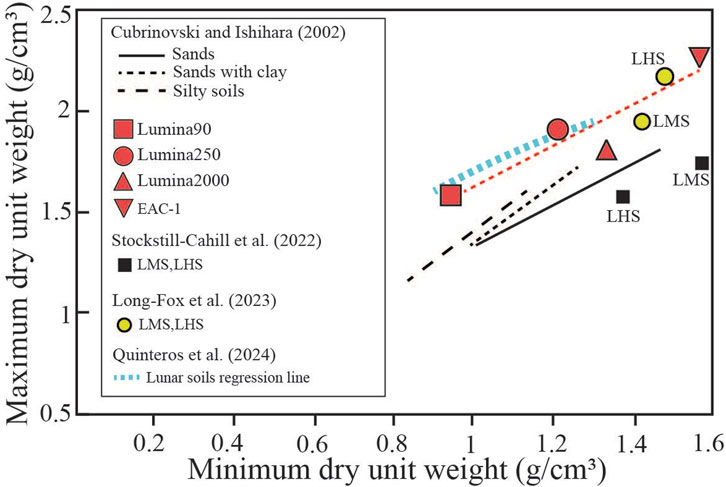
Figure 11. Correlations between the maximum and minimum dry unit weight of the mare and highland simulants of this work, LHS and LMS simulant values (Stockstill-Cahill et al., 2022; Long-Fox et al., 2023) for comparison, and calculated regression line of lunar soils (Quinteros et al., 2024) based on Apollo 11, 14, 15 data (Carrier et al., 1991). Additional regression lines of sands, sands with clay and silty soils are presented for comparison to Earth regolith data (Cubrinovski and Ishihara, 2002). The red dashed regression line was calculated using the Lumina and EAC-1 results of this work. Data used is presented in Supplementary Table S10.
4.2 Geochemical results comparison to lunar samples
The results of the Lumina samples analysed are shown in Figure 12. The Lumina simulants display almost identical Al2O3, TiO2, and CaO values to the Apollo-16 (highland) samples (Figure 12) that show 2 wt% less silica. However, the MgO and FeO (not shown) contents of the Lumina samples are significantly low, while Na2O compositions are higher than for the Apollo samples. In general, the geochemical difference between Lumina and Apollo 15, 16, Luna-20 and Surveyor major element values are below 10 wt%, excluding Al2O3 composition of Apollo 15 samples, that display relatively low values (Figure 12). The most significant diversity is represented in the Na2O compositions, where all the lunar samples show low values, whereas the Lumina samples have Na2O compositions of 2-2.5 wt%. These differences might be attributed to the modal mineralogy (i.e., ratio of minerals in the samples) of the different simulants. In summary, there is significant compositional deviation between lunar and simulant samples in the case of SiO2, MgO and Na2O contents. EAC-1 share some similarities with the Change’E−5 compositions, namely, in the case of CaO and Al2O3. There are significant discrepancies considering the Na2O and TiO2 compositions and there is a significant 8 wt% difference in MgO contents.
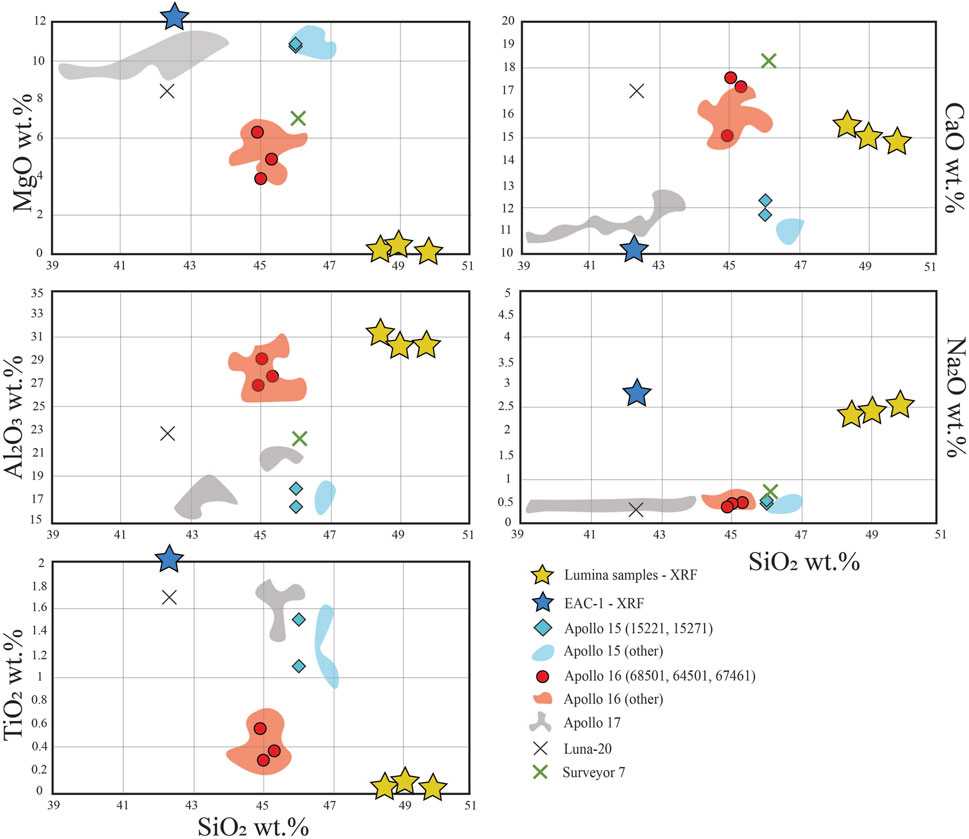
Figure 12. Major element compositions (based on the XRF measurements) of the Lumina, EAC-1 and lunar samples (Apollo 15, 16, Luna-20 and Surveyor 7).
Due to comparability, only the main and minor phases are shown regarding the Apollo and the analysed simulant samples in this work (Figure 13). Both the results of the Lumina and EAC-1 samples and the data (summarized by Taylor et al. (2019) were carried out using XRD to produce quantitative data of the soil samples. Moreover, the cross validation of XRD with other instruments is discussed in Section 4.3.

Figure 13. Main and minor phase modal mineralogy (in mass%) of the Lumina, EAC-1 (XRD quantitative method by volumetric whole-rock mass fraction) and Apollo samples (XRD analysis; Taylor et al., 2019).
The Lumina samples represent significantly higher plagioclase content (>85 wt%) and contain less than 15 wt% of other (major or minor) mineral phases that are present in the lunar regolith sampled by the Apollo missions. Nonetheless, the Lumina samples are comparative to some of the Apollo-16 samples regarding the high plagioclase contents. EAC-1 on the other hand, displays significant resemblance to Apollo 12, 14 and 15 samples and to some Apollo 17 samples, clearly simulating mare origins with relatively low plagioclase contents and high pyroxene and olivine abundance (Figure 13).
4.3 Cross validation of the results
The multidisciplinary characterization of these lunar simulants provides a robust dataset that can be used to cross validate the techniques and highlight the optimized combination of method for accurate analysis of these sample types.
Mineralogical data acquired using AMICS by Vidence Inc. for XMS was compared and cross-validated with quantitative mineralogical data acquired by XRD (Supplementary Figures S10, S11–13). Given that the analyses were not conducted on the same sub-sample and appreciating the differences in analysis type (2D surface area vs. volumetric whole rock mass fraction), reconciliation is good for the major and minor minerals. Some variance is expected due to the difference in sample splits and the fact that the AMICS analysis is conducted on a bulk sample and not on a homogenized whole rock sample as used for XRD. AMICS, was able to identify trace amounts of titanite, calcite, pyrite, Fe oxides, and chromite which are not seen in the XRD data because of their low concentrations. These trace phases generally account for less than 1% (1.4% in EAC-1) of the identified mineral phases in the AMICS data.
Generally, XRD quantifies the minerals present in a bulk sample when compared to AMICS, as it represents a homogenized whole rock sample, but lacks the resolution to detect low concentrations and does not provide textural information. AMICS on the other hand, can identify minerals present at low concentrations and offers textural characterization and data on mineral affinities, but benefits from the external calibration of the XRD to validate the data. Nevertheless, each dataset should be considered reliable on the subsample which was analyzed. Hence, these techniques should be considered complementary and used together to accurately analyse simulant samples.
The accuracy of the phase quantification given by XRD has been verified using a mass balance calculation. Simplified mineral formulas have been used to calculate bulk chemical composition of the samples from the quantification of the minerals obtained by XRD and compared with the ICP-OES measured results (Supplementary Figure S14). The scope of the mass balance calculation is to identify any discrepancies between the measured chemical composition of a sample and the mineral content. There is a good correlation between the chemistry measured by ICP and the chemistry calculated using a mass balance calculation. The quantification of the silicates is accurate as shown by the good correlation of alumina and silica. Fe2O3 show a good correlation for the Lumina samples while there is a mismatch for the EAC-1 sample, this is due to the amorphous content present. P2O5, K2O, TiO2 and Mn2O3 are not shown in the figure for clarity because they are low in concentration and therefore not very relevant.
The FTIR interpretation was based on the main mineral phases identified by XRD at XMS. As FTIR is primarily a qualitative technique and requires bespoke data analytical procedure to acquire quantitative data, it can be considered as a complimentary tool to the XRD data. Based on the results presented above, FTIR spectra can be used to qualitatively compare lunar simulants. Usage of the reference spectra allows better understanding and interpretation of the spectral characteristics of the samples and should therefore be utilized whenever available.
5 Conclusion
The Luna Analog Facility provides a scientifically characterized environment to support a wide range of studies and technology development efforts for lunar exploration. The comprehensive geotechnical, geomechanical, geochemical and mineralogical characterization of the highland simulants (Lunar90, -250 and −2000) and mare simulant (EAC-1) presented in this work offers valuable baseline data for future experimental, scientific or engineering applications.
Data availability statement
The datasets presented in this study can be found in online repositories. The names of the repository/repositories and accession number(s) can be found in the article/Supplementary Material.
Author contributions
AZ: Conceptualization, Data curation, Investigation, Methodology, Resources, Visualization, Writing–original draft, Writing–review and editing, Formal Analysis, Supervision. LS: Data curation, Formal Analysis, Writing–review and editing, Methodology, Software. SQ: Data curation, Formal Analysis, Writing–review and editing, Methodology. TM: Data curation, Formal Analysis, Methodology, Writing–review and editing. DP: Data curation, Formal Analysis, Methodology, Writing–review and editing, Software. LR: Data curation, Formal Analysis, Methodology, Writing–review and editing, Software. AC: Resources, Writing–review and editing. KM: Resources, Writing–review and editing, Funding acquisition, Project administration.
Funding
The author(s) declare that financial support was received for the research, authorship, and/or publication of this article. Funding was administered via ESA’s Exploration, Preparation, Research, and Technology (ExPeRT) Programme (reference E3CX-014), as part of the Terrae Novae European Exploration Envelope Programme (E3P).
Acknowledgments
We would like to extend our gratitude to Bent O. Jensen and Andrew J. Fagan (Lumina Sustainable Materials Ltd.) for their generous hospitality during our visit to the anorthosite mine in Qaqortorsuaq in the Kangerlussuaq Fjord, Greenland. Their assistance in facilitating the visit to observe the anorthosite outcrops and the overall production process is greatly appreciated. Lumina Sustainable Materials Ltd. is also thanked for providing the lunar highland samples. Juergen Schlutz is appreciated for his supervisory support on this work. The authors would like to thank Andrew Townley for his detailed work on the sphericity and particle size distribution analysis at the Vulcan Facility. Daniel Voll is thanked for the abrasivity measurements at SINTEF. X-ray Mineral Services are thanked for carrying out the thorough geochemical and mineralogy analyses, especially Johanna Tepsell and Nikolaos Apeiranthitis. NGI is appreciated by the authors for the comprehensive geotechnical characterization of all samples, and Petrolab is acknowledged by providing thin sections and detailed mineralogy results.
Conflict of interest
Author LS was employed by X-Ray Mineral Services Ltd. Author LR was employed by Petrolab Ltd.
The remaining authors declare that the research was conducted in the absence of any commercial or financial relationships that could be construed as a potential conflict of interest.
Generative AI statement
The author(s) declare that no Generative AI was used in the creation of this manuscript.
Publisher’s note
All claims expressed in this article are solely those of the authors and do not necessarily represent those of their affiliated organizations, or those of the publisher, the editors and the reviewers. Any product that may be evaluated in this article, or claim that may be made by its manufacturer, is not guaranteed or endorsed by the publisher.
Supplementary material
The Supplementary Material for this article can be found online at: https://www.frontiersin.org/articles/10.3389/frspt.2024.1510635/full#supplementary-material
References
Apeiranthitis, N., Greenwell, C. H., and Carteret, C. (2022). Far- and mid-infrared examination of nontronite-1 clay mineral – redox and cation saturation effects. Appl. Clay Sci. 228 (2022), 106628. 0169-1317. doi:10.1016/j.clay.2022.106628
ASTM (2018). ASTM D7481−18 (2018). standard test methods for determining loose and tapped bulk densities of powders using a graduated cylinder. West Conshohocken, PA: ASTM International.
Barsukov, V. L. (1977). Preliminary data for the regolith core brought to earth by the automatic lunar station luna 24. Proc. Lunar Sci. Conf. 8th, 3303–3318.
Bell, S. K., Joy, K. H., Pernet-Fisher, J. F., and Hartley, M. E. (2020). QEMSCAN as a method of semi-automated crystal size distribution analysis: insights from Apollo 15 Mare basalts. J. Petrology 61, egaa047. doi:10.1093/petrology/egaa047
Brough, C., Strongman, J., Fletcher, J., Zając, M., Garside, R., Garner, C., et al. (2019). “Operational mineralogy: an overview of key practices in sample analysis, sample preparation and statistics,” in Proceedings of the 15th SGA biennial meeting (Glasgow, UK), 27–30.
Cannon, K. M., Dreyer, C. B., Sowers, G. F., Schmit, J., Nguyen, T., Sanny, K., et al. (2022). Working with lunar surface materials: review and analysis of dust mitigation and regolith conveyance technologies. Acta Astronaut. 196, 259–274. doi:10.1016/j.actaastro.2022.04.037
Carrier, W. D. (2003). Particle size distribution of lunar soil. J. Geotechnical Geoenvironmental Eng. 129, 956–959. doi:10.1061/(asce)1090-0241(2003)129:10(956)
Carrier, W. D., Bromwell, L. G., and Martin, R. T. (1973). Behavior of returned lunar soil in vacuum. J. Soil Mech. Found. Div. 99, 979–996. doi:10.1061/jsfeaq.0001966
Carrier, W. D., Olhoeft, G. R., and Mendell, W. (1991). Physical properties of the lunar surface. Lunar Sourceb. a user's guide moon, 475–594.
Cherkasov, I. I., Vakhnin, V. M., Kemurjian, A. L., Mikhailov, L. N., Mikheyev, V. V., Musatov, A. A., et al. (1968). Determination of the physical and mechanical properties of the lunar surface layer by means of Luna 13 automatic station. Moon Planets II, 70–76. doi:10.1080/00206816809474995
Cloud, J. M., Tram, M. Q., Beksi, W. J., and DuPuis, M. A. (2023). Lunar excavator mission operations using dynamic movement primitives in IEEE/RSJ International Conference on Intelligent Robots and Systems (IROS), 25-30 Sept. 2011 (IEEE), 10708–10715.
Cole, D. M., Taylor, L. A., Liu, Y., and Hopkins, M. A. (2010). “Grain-scale mechanical properties of lunar plagioclase and its simulant: initial experimental findings and modeling implications,” in Earth and Space 2010: engineering, science, construction, and operations in challenging environments, 74–83.
Costes, N. C., Cohron, G. T., and Moss, D. C. (1971). Cone penetration resistance test-an approach to evaluating in-place strength and packing characteristics of lunar soils. In Proc. Lunar Sci. Conf., vol. 2, p(Vol. . 1973).
Costes, N. C., and Mitchell, J. K. (1970). “Apollo 11 soil mechanics investigation,” in Proc. Apollo 11 Lunar Sci. Conf., Oxford, 01 October 1971, 2025–2044.
Cubrinovski, M., and Ishihara, K. (2002). Maximum and minimum void ratio characteristics of sands. Soils Found. 42 (6), 65–78. doi:10.3208/sandf.42.6_65
Deitrick, S. R., and Cannon, K. M. (2022). “Characterizing detailed grain shape and size distribution properties of lunar regolith,” in 53rd Lunar and Planetary Science Conference, USA, March 7–11, 2022.
Engelschiøn, V. S., Eriksson, S. R., Cowley, A., Fateri, M., Meurisse, A., Kueppers, U., et al. (2020). EAC-1A: a novel large-volume lunar regolith simulant. Sci. Rep. 10 (1), 5473. doi:10.1038/s41598-020-62312-4
Fa, W. (2020). Bulk density of the lunar regolith at the Chang'E-3 landing site as estimated from lunar penetrating radar. Earth Space Sci. 7 (2), e2019EA000801. doi:10.1029/2019ea000801
Finlay, A. J., Wray, D. S., Comfort, G., and Moore, J. K. (2023). Radioactive heat production variations in the Faroe-Shetland Basin: key new heat production, geological and geochronological data for regional and local basin modelling. Pet. Geosci. 29. petgeo2022-039. doi:10.1144/petgeo2022-039
Graham, S. D., Brough, C., and Cropp, A. (2015). An introduction to ZEISS mineralogic mining and the correlation of light microscopy with automated mineralogy: a case study using BMS and PGM analysis of samples from a PGE-bearing chromite prospect. Proc. Precious Metals 15, 11. doi:10.1016/j.asr.2015.01.024
Houston, W. N., and Mitchell, J. K. (1971). Lunar core tube sampling. Proc. Lunar Sci. Conf. 2nd (1971), 1953–1958.
Huang, H., Xie, X., Tang, L., Liu, H., Liu, N., and Li, M. (2022). Autonomous collision avoidance sample grasping method for extraterrestrial exploration. Acta Astronaut. 193, 303–310. doi:10.1016/j.actaastro.2022.01.017
Jaffe, L. D. (1973). Shear strength of lunar soil from Oceanus Procellarum. moon 8 (1), 58–72. doi:10.1007/bf00562750
Jarvis, I., and Jarvis, K. E. (1992a). Inductively coupled plasma-atomic emission spectrometry in exploration geochemistry. J. Geochem. Explor. 44 (1-3), 139–200. doi:10.1016/0375-6742(92)90050-i
Jarvis, I., and Jarvis, K. E. (1992b). Plasma spectrometry in the earth sciences: techniques, applications and future trends. Chem. Geol. 95 (1-2), 1–33. doi:10.1016/0009-2541(92)90041-3
Kalapodis, N., Kampas, G., and Ktenidou, O. J. (2020). A review towards the design of extraterrestrial structures: from regolith to human outposts. Acta Astronaut. 175, 540–569. doi:10.1016/j.actaastro.2020.05.038
Kobrick, R., Budinski, K., Street, K., and Klaus, D. (2010). “Three-body abrasion testing using lunar dust simulants to evaluate surface system materials,” in 40th International Conference on Environmental Systems, China, 14 Jun 2012, 6077.
Leonovich, A. K., Gromov, V. V., Dmitriyev, A. D., Penetrigov, V. N., Senevov, P. S., and Shvarev, V. V. (1977). The main peculiarities of the processes of the deformation and destruction of lunar soil. NASA, Wash. Soviet-Am. Conf. Cosmochem. Moon Planets 2.
Leonovich, A. K., Gromov, V. V., Rybakov, A. V., Petrov, V. K., Pavlov, P. S., Cherkasov, I. I., et al. (1971). Studies of lunar ground mechanical properties with the self-propelled Lunokhod-1. Peredvizhnaya Lab. na Luna-Lunokhod-1 ‘Lunokhod 1’—Mobile Lunar Lab., 120–135.
Leonovich, A. K., Gromov, V. V., Semyonov, P. S., Penetrigov, V. N., and Shvartov, V. V. (1975). Luna 16 and 20 investigations of the physical and mechanical properties of lunar soil. COSPAR Space Res. XV, 607–616. doi:10.1515/9783112482124-081
Leonovich, A. K., and Rybakov, A. V. (1972). Investigations of the mechanical properties of the lunar soil along the path of lunokhod 1.
Li, C., Hu, H., Yang, M.-F., Pei, Z.-Y., Zhou, Q., Ren, X. L., et al. (2022). Characteristics of the lunar samples returned by the chang’e-5 mission. Natl. Sci. Rev. 9, nwab188. doi:10.1093/nsr/nwab188
Long-Fox, J. M., Landsman, Z. A., Easter, P. B., Millwater, C. A., and Britt, D. T. (2023). Geomechanical properties of lunar regolith simulants LHS-1 and LMS-1. Adv. Space Res. 71 (12), 5400–5412. doi:10.1016/j.asr.2023.02.034
Martin, D. J., Hanna, K. L. D., Joy, K. H., and Gillis-Davis, J. J. (2022). A petrological and spectral characterisation of the NU-LHT-2M lunar highlands regolith simulant in preparation for the PROSPECT test campaign. Planet. Space Sci. 221, 105561. doi:10.1016/j.pss.2022.105561
McKay, D. S., Heiken, G., Basu, A., Blanford, G., Simon, S., Reedy, R., et al. (1991). The lunar regolith. Lunar Sourceb. 567, 285–356.
Mitchell, J. K., Bromwell, L. G., Carrier, W. D. I., Costes, N. C., Houston, W. N., and Scott, R. F. (1972a). Soil-mechanics experiments. Apollo 15 Prelim. Sci. Rep., 7–28. NASA SP-289, 1972a.
Mitchell, J. K., Bromwell, L. G., Carrier, W. D. I., Costes, N. C., and Scott, R. F. (1971). Soil mechanics experiment. Apollo 14 Prelim. Sci. Rep., 87–108. NASA SP-272, 1971.
Mitchell, J. K., Carrier, W. D. I., Costes, N. C., Houston, W. N., and Scott, R. F. (1973a). Surface soil variability and stratigraphy at the apollo 16 site. Proc. Lunar Sci. Conf. 4th, 2437–2445.
Mitchell, J. K., Carrier, W. D. I., Houston, W. N., Scott, R. F., Bromwell, L. G., Durgunoglu, H. T., et al. (1972b). Soil mechanics. Apollo 16 Prelim. Sci. Rep., 8–29. NASA SP-315, 1972b.
Mitchell, J. K., and Houston, W. N. (1974). “Static penetration testing on the Moon,” in European symposium in penetration testing 1st, 277–284.
Moore, M., and Reynolds, R. C. (1997). X-Ray diffraction and the identification and analysis of clay minerals. Oxford: Oxford University Press.
Moum, J. (1965). Falling drop used for grain size analysis of fine-grained materials. Sedimentology 5 (4), 343–347. Also publ. in: Norwegian Geotechnical Institute. Publication, 70. doi:10.1111/j.1365-3091.1965.tb01566.x
Nilsen, B., Dahl, F., Holzhäuser, J., and Raleigh, P. (2007). New test methodology for estimating the abrasiveness of soils for TBM tunnelling. RETC Proc., 104–116.
Norrish, K., and Hutton, J. T. (1969). An accurate X-ray spectrographic method for the analysis of a wide range of geological samples. Geochimica Cosmochimica Acta 33, 431–453. doi:10.1016/0016-7037(69)90126-4
NS-EN ISO 14688-1 (2018). Geotechnical investigation and testing – identification and classification of soil – Part 1: identification and description (ISO 14688-1:2017).
NS-EN ISO 14688-2 (2018). Geotechnical investigation and testing – identification and classification of soil – Part 2: principles for a classification (ISO 14688-2:2017).
NS-EN ISO 17892-1 (2014). Geotechnical investigation and testing. Laboratory testing of soil. Part 1: determination of water content (ISO 17892-1:2014).
NS-EN ISO 17892-3 (2015). Geotechnical investigation and testing. Laboratory testing of soil. Part 3: determination of particle density (ISO 17892-3:2015).
NS-EN ISO 17892-4 (2016). Geotechnical investigation and testing. Laboratory testing of soil. Part 4: determination of particle size distribution (ISO 17892-4:2016).
Pirrie, D., Butcher, A. R., Power, M. R., Gottlieb, P., and Miller, G. L. (2004). “Rapid quantitative mineral and phase analysis using automated scanning electron microscopy (QemSCAN); potential applications in forensic geoscience,” Geological society. Editors K. Pye,, and D. Croft (London: Special Publication), 232, 123–136. doi:10.1144/gsl.sp.2004.232.01.12
Post, J. E., and Bish, D. L. (1989). Rietveld refinement of crystal structures using powder X-ray diffraction data. Mineralogical Soc. Am. Rev. Mineralogy 20, 277–308. doi:10.1515/9781501509018
Quinteros, V. S., Mikesell, T. D., Griffiths, L., and Jerves, A. X. (2024). Geotechnical laboratory testing of lunar simulants and the importance of standardization. Icarus 408, 115812. doi:10.1016/j.icarus.2023.115812
Schultz, B., Sandmann, D., and Gilbricht, S. (2020). SEM-based automated mineralogy and its application in geo- and material sciences. Minerals 10, 1004. doi:10.3390/min10111004
Scott, R. F., and Roberson, F. I. (1968). Soil mechanics surface sampler: lunar surface tests, results, and analyses. J. Geophys. Res. 73 (12), 4045–4080. doi:10.1029/jb073i012p04045
Scott, R. F., and Roberson, F. I. (1969). Soil mechanics surface sampler. J. Geophys. Res. 74 (25), 6175–6214. doi:10.1029/jb074i025p06175
Scott, R. F., and Zuckerman, K. A. (1971). Examination of returned surveyor iii surface sampler. Proc. Lunar Sci. Conf. 2, 2743–2751.
Singh, R., Kapoor, A., Sharma, G., Kumar, A., Shankara, A., and Keshava Murthy, K. A. (2021). “A modular end effector for sample collection from extraterrestrial terrain,” in Mechanism and machine science: select proceedings of asian MMS 2018 (Singapore: Springer), 213–227.
Stockstill-Cahill, K. R., Martin, A. C., Wagoner, C. M., Deitrick, S. R., and Gruener, J. E. (2022). Lunar surface innovation initiative: evaluating lunar simulants. 53rd Lunar Planet. Sci. Conf. 2678, 2201.
Swann, G. A., Bailey, N. G., Batson, R. M., Freeman, V. L., Hait, M., Head, J., et al. (1972). Apollo 15 preliminary science report. NASA 289, 5–1.
Taylor, G. J., Martel, L. M., Lucey, P. G., Gillis-Davis, J. J., Blake, D. F., and Sarrazin, P. (2019). Modal analyses of lunar soils by quantitative X-ray diffraction analysis. Geochimica Cosmochimica Acta 266, 17–28. doi:10.1016/j.gca.2019.07.046
Toklu, Y. C., and Akpinar, P. (2022). Lunar soils, simulants and lunar construction materials: an overview. Adv. Space Res. 70 (3), 762–779. doi:10.1016/j.asr.2022.05.017
Tsuchiyama, A., Sakurama, T., Nakano, T., Uesugi, K., Ohtake, M., Matsushima, T., et al. (2022). Three-dimensional shape distribution of lunar regolith particles collected by the Apollo and Luna programs. Earth, Planets and Space 74 (1), 172.
Williams, H. (2023). “Simulants in in-situ resource utilization technology development,” in Handbook of Space resources (Cham: Springer International Publishing), 381–397.
Zhang, Y., Li, P., Quan, J., Li, L., Zhang, G., and Zhou, D. (2023). Progress, challenges, and prospects of soft robotics for space applications. Adv. Intell. Syst. 5 (3), 2200071. doi:10.1002/aisy.202200071
Keywords: lunar regolith simulant, testbed, highland, mare, geotechnical properties, mineralogy, geochemistry
Citation: Zemeny A, Sardisco L, Quinteros S, Mikesell TD, Pirrie D, Rose L, Cowley A and Manick K (2024) The Luna Analog Facility testbeds (ESA, EAC): contemporary characterization work of highland (lunar) and mare (EAC-1) lunar regolith simulants. Front. Space Technol. 5:1510635. doi: 10.3389/frspt.2024.1510635
Received: 13 October 2024; Accepted: 03 December 2024;
Published: 18 December 2024.
Edited by:
Joseph N. Pelton, International Space University, United StatesReviewed by:
Y. Cengiz Toklu, Istanbul Aydın University, TürkiyeGuang Zhang, Chinese Academy of Sciences (CAS), China
Francesco Cafaro, Politecnico di Bari, Italy
Copyright © 2024 Zemeny, Sardisco, Quinteros, Mikesell, Pirrie, Rose, Cowley and Manick. This is an open-access article distributed under the terms of the Creative Commons Attribution License (CC BY). The use, distribution or reproduction in other forums is permitted, provided the original author(s) and the copyright owner(s) are credited and that the original publication in this journal is cited, in accordance with accepted academic practice. No use, distribution or reproduction is permitted which does not comply with these terms.
*Correspondence: Aliz Zemeny, YWxpei56ZW1lbnlAZXNhLmludA==
 Aliz Zemeny
 Lorenza Sardisco
 Santiago Quinteros
 T. Dylan Mikesell
 Duncan Pirrie
 Libby Rose6
 Kamini Manick