 Jonas Walther
 Ryan Luke Johns1
 Hendrik Kolvenbach
 Valentin Tertius Bickel
 Marco Hutter
94% of researchers rate our articles as excellent or good
Learn more about the work of our research integrity team to safeguard the quality of each article we publish.
Find out more
ORIGINAL RESEARCH article
Front. Space Technol., 06 June 2024
Sec. Space Exploration
Volume 5 - 2024 | https://doi.org/10.3389/frspt.2024.1345337
This article is part of the Research TopicTechnologies for Prospecting, Extraction, and Utilization of Space ResourcesView all 11 articles
Significant infrastructure is required to establish a long-term presence of humans on the lunar surface. In-situ resource utilization (ISRU) is a fundamental approach to ensure the viability of such construction. Here, we investigate the feasibility of constructing blast shields as one example of lunar infrastructure using unprocessed lunar boulders and an autonomous robotic excavator. First, we estimate the volume of unprocessed material required for the construction of blast shield segments. Secondly, we quantify the amount of available boulders in two exploration zones (located at the Shackleton-Henson Connecting Ridge and the Aristarchus Plateau pyroclastic deposit) using LRO NAC images and boulder size-frequency distribution laws. In addition, we showcase an alternative approach that relies on Diviner rock abundance data. Thirdly, we use a path planning algorithm to derive the distance, energy, and time required to collect local material and construct blast shield elements. Our results show that our construction method requires two orders of magnitudes less energy than alternative ISRU construction methods, while maintaining realistic mission time and payload capacity margins.
Permanent lunar infrastructure will be required to establish a sustainable human presence on the Moon, and as a first step in the preparation for the first human mission to Mars (NASA, 2023a). As part of programs such as Artemis (NASA, 2020), frequent landings and launches of spacecraft will continuously eject dust and small particles which cause a significant threat to such infrastructure, as well as to the lunar environment (Mueller et al., 2009; Qiao et al., 2023). The significant detrimental character of blast-debris has first been observed during the Apollo era, after the Apollo 12 astronauts returned parts of the Surveyor III lander to Earth, which was affected by debris blasted off by the Apollo 12 module during touchdown (Immer et al., 2011). The SpaceX HLS (Human Landing System)—selected for the first crewed missions to the Moon (NASA, 2021a)—is expected to physically affect the environment hundreds or even thousands of meters away from the landing site (Qiao et al., 2023), which is one of the reasons why past studies have called for landing pads and blast shields to mitigate blast damage (Mueller et al., 2009; Susante and Metzger, 2016).
Such infrastructure projects require significant building materials—yet the transport of mass from Earth to the Moon is extremely expensive, with current prices of around 1.2 mln USD per kilogram (Astrobotic, 2018). Literature suggests in-situ resource utilization (ISRU) for the construction of infrastructure, which can reduce the need of mass transport from Earth, while in return more energy is required (Moses and Mueller, 2021). Methods and materials based on in-situ resources proposed for construction purposes include, for example, microwave heating (Lim et al., 2021), cast regolith (Benaroya et al., 2012), waterless/sulfur concrete (Susante, 2012; Susante and Metzger, 2016; Khoshnevis et al., 2017), 3D-printing (Cesaretti et al., 2014; Yashar et al., 2021) and dry packing of processed rocks (Thangavelu and Adhikari, 2017).
This paper proposes a novel way of constructing vital infrastructure using boulders that are abundant on the lunar surface, using autonomous construction machines. Such work has been recently demonstrated on Earth, where a robotic hydraulic excavator platform has demonstrated the construction of dry stone walls using irregular boulders and debris (Johns et al., 2020). The advantage of this particular construction method is that in-situ boulders can be used without the need of preprocessing, making it remarkably energy efficient (Johns et al., 2020).
In this work, we assess the viability of deploying such a method toward the construction of key infrastructure on the Moon, using found boulders. First, we calculate in section 2 the amount of in-situ material required for the construction of a blast shield. Next, in section 3, we quantify the amount of physically-available in-situ material (boulders) in two sites of increased exploration interest. Based on those maps, we derive the cost of retrieving the material (i.e., the distance, time, and energy) in section 4. We conclude with a general discussion of the approach and results in section 5. Figure 1 visualizes how the construction of a blast shield with our proposed construction method might look like.
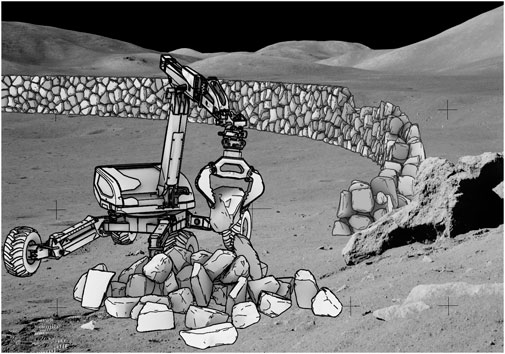
Figure 1. Illustration of the construction of a blast shield with our proposed construction method. Background: photo credit to NASA, processing/scanning credit to Kipp Teague and NASA Johnson (image AS17-141–21610), edited.
Previously-proposed construction methods for blast shields include regolith berms (Mueller et al., 2009; Morris, 2012; Moses and Mueller, 2021), cast regolith (Benaroya et al., 2012) and microwave heating (Lim et al., 2021). The landing pad for Artemis-class missions is expected to have a diameter of 200 m (with possible reduction to 100 m) (Gelino et al., 2023). A possible ratio of blast shield height to radius (resulting in the shielding angle) was given by Morris (2012). Figure 2 shows how the blast shield is geometrically parameterized. Note that the blast shield is shown as a straight wall for simplicity, while it would be wrapped around a round landing pad in practice.
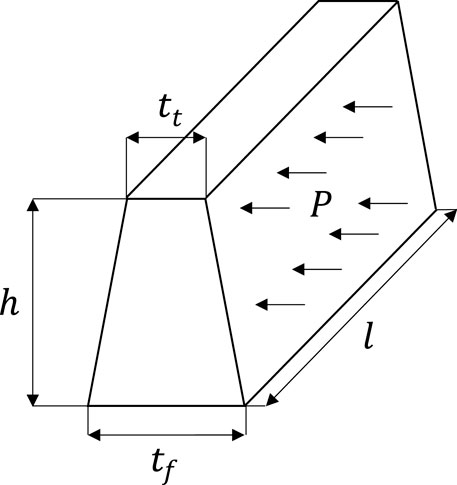
Figure 2. Blast shield segment.
Table 1 shows assumptions on the main dimensions of the considered blast shield and thereafter the required parameters, as well as the results of further calculations. Note that for the friction angle of regolith, the smallest angle in the range mentioned by Benaroya and Bernold (2008) was taken, as this will lead to conservative results.
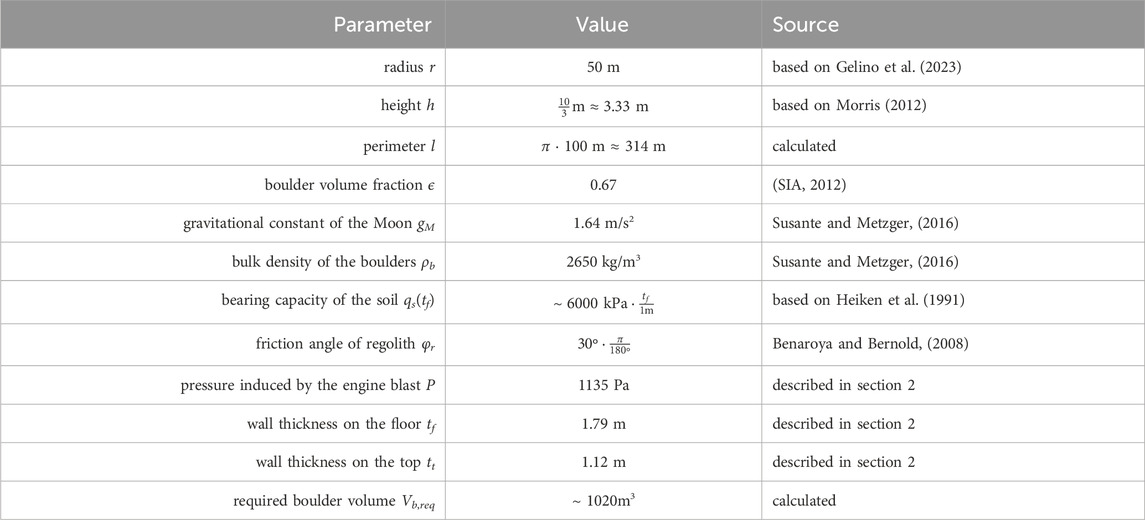
Table 1. Parameters of the blast shield.
A first approximation of the pressure P on the wall induced by the engine blast is done with help of the value of Morris (2012). Morris (2012) found out that for a blast shield with height 1.5 m at radius r = 15 m, the average pressure on the shield is 11.4 Pa and is proportional to r−2.463, when the height is kept constant. In our problem the height however changes, but the ratio of height and radius stays the same, which is why the pressure rather should be proportional to r−2 (Roberts, 1966; Morris, 2012). So, at r = 50 m, the average pressure induced by that rocket should be approximately 1.03 Pa. The pressure thereby consists of the pressure from the exhaust gasses, as well as of the blasted regolith particles that are impacting the blast shield. The named pressure seems to be calculated for an engine thrust of about 13.3 kN (Morris, 2012). The first lander for Artemis is anticipated to be SpaceX’s Starship (NASA, 2021a). The Starship currently is rated to have 1500 tf ≈ 14715 kN of thrust1. Note that the thrust during the lunar landing might be different. The pressure on the blast shield now is linearly scaled by the thrust. The resulting pressure then is P = 1135 Pa. Note that this is a very rough approximation. For a more reliable estimate, the work of Morris (2012) would need to be redone with the characteristics of the engines of the Starship, which however is out of the scope of this paper.
By using assumptions on the relation between tf and tt (Stiftung Umwelt-Einsatz Schweiz, 2014) and applying safety factors on sliding, overturning and the bearing capacity of the soil (McCombie et al., 2015), the values for tf and tt can be obtained and are as well shown in Table 1. Given the thickness of the blast shield, the required boulder volume is calculated and also shown in Table 1. Due to the large size we suggest not to construct the full ring, but only a ring segment in the direction where the shielding really is needed. In the remaining part of this paper, only a quarter ring segment instead of a full ring is considered.
According to the Wentworth scale, boulders are stones that are larger than 256 mm (Wentworth, 1922), which is also the size range that is reasonable for the construction method of Johns et al. (2020). Clusters with lots of lunar boulders are typically found within and near recent impact craters, along potentially tectonically active wrinkle ridges, or at the bottom of topographic depressions (Bickel et al., 2020; Valantinas and Schultz, 2020; NASA, 2021b; Ruesch and Bickel, 2023).
The candidate regions for the Artemis program are all located near the lunar south pole (NASA, 2022c). The region which is closest to the south pole is called Connecting Ridge (NASA, 2022c). This region is of very high interest, as it offers proximity to permanently shadowed and sunlit regions, i.e., access to volatiles and energy (Swiney and Hernandez, 2022).
Additionally, a non-polar region is considered. During the “foundational exploration” of NASA’s “Moon-to-Mars architecture”, possible missions also consider non-polar regions (NASA, 2023a). The HLS is anticipated to be able to land at non-polar sites in future missions (see HLS-S-R-0357 of NASA (2022a)). A top-tier exploration site is the Aristarchus Plateau (NASA, 2022a), a geologically very interesting region (Zisk et al., 1977) containing the deepest and widest sinuous rille of the Moon, which is called Vallis Schröteri (Hurwitz et al., 2013). We focus on a section of the Aristarchus pyroclastic deposit adjacent to Vallis Schröteri, ranging from longitude −51.85° to −51.3° and from latitude 26.21° to 26.71°. The region is approximately 15 km by 15 km, which resembles the approximate size of the Artemis candidate regions (NASA, 2022c). The region contains a small part of Vallis Schröteri and was selected considering resource availability, rock abundance, and topographic slope.
We used images taken by the Lunar Reconnaissance Orbiter (LRO) Narrow Angle Camera (NAC) (Robinson, 2010; Robinson et al., 2010; Speyerer et al., 2012; Humm et al., 2016; Mahanti et al., 2016) to quantify the availability of boulders at the two sites of interest. The NAC images were obtained as EDR (Experimental Data Record) and processed using ISIS3 (Laura et al., 2023) to derive georeferenced images, following Bickel et al. (2021). The mapping of the boulders then was done using QGIS2 version 2.18.28. Some minor processing steps of the resulting shapefiles were done with Python and GDAL (GDAL/OGR contributors, 2020).
The two NACs have a nominal resolution of 0.5 m/pixel at an altitude of 50 km, enabling the detection of “blocks” with horizontal sizes of about 1 m (Robinson et al., 2010). The size of most boulders in the images is only a few pixels. Similar as done by Boazman et al. (2022), only boulders which are at least two pixels wide were mapped. Boulders can be identified by their bright appearance followed by a shadow, while the order of bright and dark pixels is opposite to how it is the case for craters (Gawronska et al., 2020; Boazman et al., 2022).
For Connecting Ridge, we utilized shapefiles provided by Boazman et al. (2022) featuring the location of boulders in this region. With the help of this data, we generated boulder shapefiles, which additionally have information on the size of the boulders. A list of the NAC images used by Boazman et al. (2022) is given at the end of their paper. Our augmented boulder shapefiles are available online (Walther et al., 2023).
For the chosen region at the Aristarchus Plateau, no files with mapped boulders were available. Therefore, the whole mapping process was done for this region, starting with the selection of NAC images that were used. The NAC images were chosen with help of the QuickMap3, with the goal of getting the best visibility for boulders, e.g., using images with high resolution and intermediate solar incidence angle. Regions that were covered by multiple images were mapped with the image with highest resolution. We note that there is a high variation in the resolution of the available images, which affects the size of the smallest identified boulders. The southern part of the chosen region contains parts of the Vallis Schröteri. Here, we consider a traverse of the rille’s slopes (
We combine our mapping results with boulder size-frequency distribution laws to estimate the fraction of boulders smaller than ∼2 m. Li et al. (2017) used a power law α ⋅ dβ to derive the cumulative number of lunar boulders of a certain size d or larger. They compared the data with surface and NAC images in a log-log plot and found out that, except for two of the seven considered landing sites, the data points resulting from the two different imaging methods had the same slope. Based on that they claim that the size-frequency distribution (SFD) of the boulders on the Moon can be modeled using a power law. The SLS-SPEC-159 Cross-Program Design Specification for Natural Environments (DSNE) (NASA, 2021b) also assumes that a power law would be valid for rocks smaller than 2 m (see section 3.4.1.4 in the mentioned document). Baloga et al. (2012) on the other hand stated that a power law leads to unreasonable extrapolations for lunar boulders with size 10 cm, while an exponential law α ⋅ exp (βd) does not have this issue. Rüsch et al. (2022) find that the size-frequency distribution of lunar boulders depends on the age of the considered location. They state that the size-frequency distribution of regions younger than approximately 50 Ma is a power law, while for older regions, it is an exponential law.
Due to different views in literature and as the age of the considered regions are not exactly known and also are assumed to vary within the regions, both the power law (Li et al., 2017) and the exponential law (Rüsch et al., 2022) will be considered in the following. We note that the exponential law is more conservative with respect to the estimated amount of small boulders. This will further be discussed in section 5.3.2.
The size-frequency distribution laws are fitted using the data of the boulders that were mapped as described in section 3.1. For the size d in the size-frequency distribution laws, the longest visible axis of the boulders was used. For the power law, the power index β is region-dependent (Krishna and Kumar, 2016; Rüsch et al., 2022). It therefore should not be assumed to be constant over the whole region. Based on that, it can also be assumed that the size-frequency distribution can be regionally dependent, when the exponential law is used instead.
The fit of the exponential law is derived by applying the natural logarithm and then solving the linear system of equations for ln α and for β. For the power law, a maximum likelihood approach was used, which was proposed by DeSouza et al. (2015) for size-frequency distributions in the context of celestial bodies, which in turn was based on Clauset et al. (2009) and therefore also on Muniruzzaman (1957). A threshold dthreshold for the minimum size of the boulders used for the fit was set. This was done for both mentioned size-frequency distribution laws. The used value was 2 m and motivated by Powell et al. (2023). Fits of the power law and the exponential law for the mapped boulders in Connecting Ridge and the chosen Aristarchus Plateau region will later be shown in the discussion in section 5.3.2.
The precise volume of the mapped boulders is unknown, and thus an approximation based on the longest diameter is performed. We introduce a factor, which relates the cube of the longest diameter dlong to the estimated volume of the boulder Vb. The volume estimate is done by assuming the boulder to be an ellipsoid, as applied by Bickel et al. (2021). It can be assumed, that the height of the boulder corresponds to the smallest of the three axes (Demidov and Basilevsky, 2014). Using a ratio between the height and the visible diameter in surface made images, which was mentioned to be 0.6 by Demidov and Basilevsky (2014), together with an approach mentioned by them to relate this visible diameter with the longest and medium axis length, and by using a ratio between the longest and medium axis length of 2, which is the most conservative value mentioned by Krishna and Kumar (2016), the following relation can be obtained (used for this study)
Our standard assumption is that the useable boulders for the construction are those with the longest axis dlong being in the interval [0.5 m, 1.5 m]. Given a map with large boulders mapped using LRO NAC images, the number of small boulders in a certain area can be estimated based on a size-frequency distribution law from section 3.2. While the map with large boulders contains the location of the boulders, the exact location of the expected smaller boulders of course is unknown. Therefore, a map with smaller boulders should rather be a grid, in which for every grid cell, a separate size-frequency distribution is fitted, which allows to get the number of small boulders. The standard value for the grid spacing was chosen to be 200 m. Choosing it much smaller would not make sense due to the uncertainty of the position of the NAC images, which leads to an uncertainty of the position of the mapped boulders.
As mentioned in section 3.2, the size-frequency distribution is region-dependent (Krishna and Kumar, 2016; Rüsch et al., 2022). Both parameters, so not only the scaling α, but also β, which stands for the ratio between large and small boulders, therefore should be estimated for all grid cells individually. For the fit of β, a minimum number of 400 close-by boulders was used in order to get a good sense of the ratio between large and small boulders. Given the size-frequency distribution of a grid cell, not only the number of smaller boulders can be estimated, but also the volume of boulders with dlong in the interval [0.5 m, 1.5 m]. For this, the relation between longest axis and the boulder volume as shown in Eq. 1 is used. The exact formulas are also shown in the Supplementary Material.
Manual boulder mapping is a time-consuming process. As an alternative, we propose using rock abundance data (Powell, 2022) derived by Powell et al. (2023) using LRO’s Diviner instrument in combination with a description of the fractional area F(d) of boulders of size d or larger (Li and Wu, 2018) to calculate the locally available boulder volume. Note that the mentioned rock abundance data is only available between the latitudes 70 S and 70 N. The Diviner instrument is able to sense rocks larger than 1–2 m (Bandfield et al., 2011; Powell et al., 2023). The rock abundance data kdiviner needs to be converted to the total rock abundance k before it is used. This can be done by requiring F (1 m) to be equal to kdiviner and solving it for k. Using the value 1 m instead of 2 m is more conservative with respect to the expected amount of available boulders, as it estimates a lower total rock abundance k.
The volume of boulders with dlong in the interval [0.5 m, 1.5 m] then can be calculated (Li and Wu, 2018) (section 3.3). The exact formulas are shown in the Supplementary Material. Note that boulder volume maps first are generated with the grid given by the rock abundance data of Powell (2022), and afterwards interpolated to a 200 m by 200 m grid, as a 200 m spaced grid is also used in the method based on mapped boulders.
Figure 3 compares the expected available boulder volume of boulders with longest axis between 0.5 m and 1.5 m in Connecting Ridge, the chosen Aristarchus Plateau region and three of the Constellation Program regions of interest. The different size-frequency distribution laws mentioned in section 3.2 were used, including the exponential law and power law together with mapped boulders and the rock abundance dependent exponential law by Li and Wu (2018). The Connecting Ridge site (exponential law) is shown separately in Figure 4 in large.
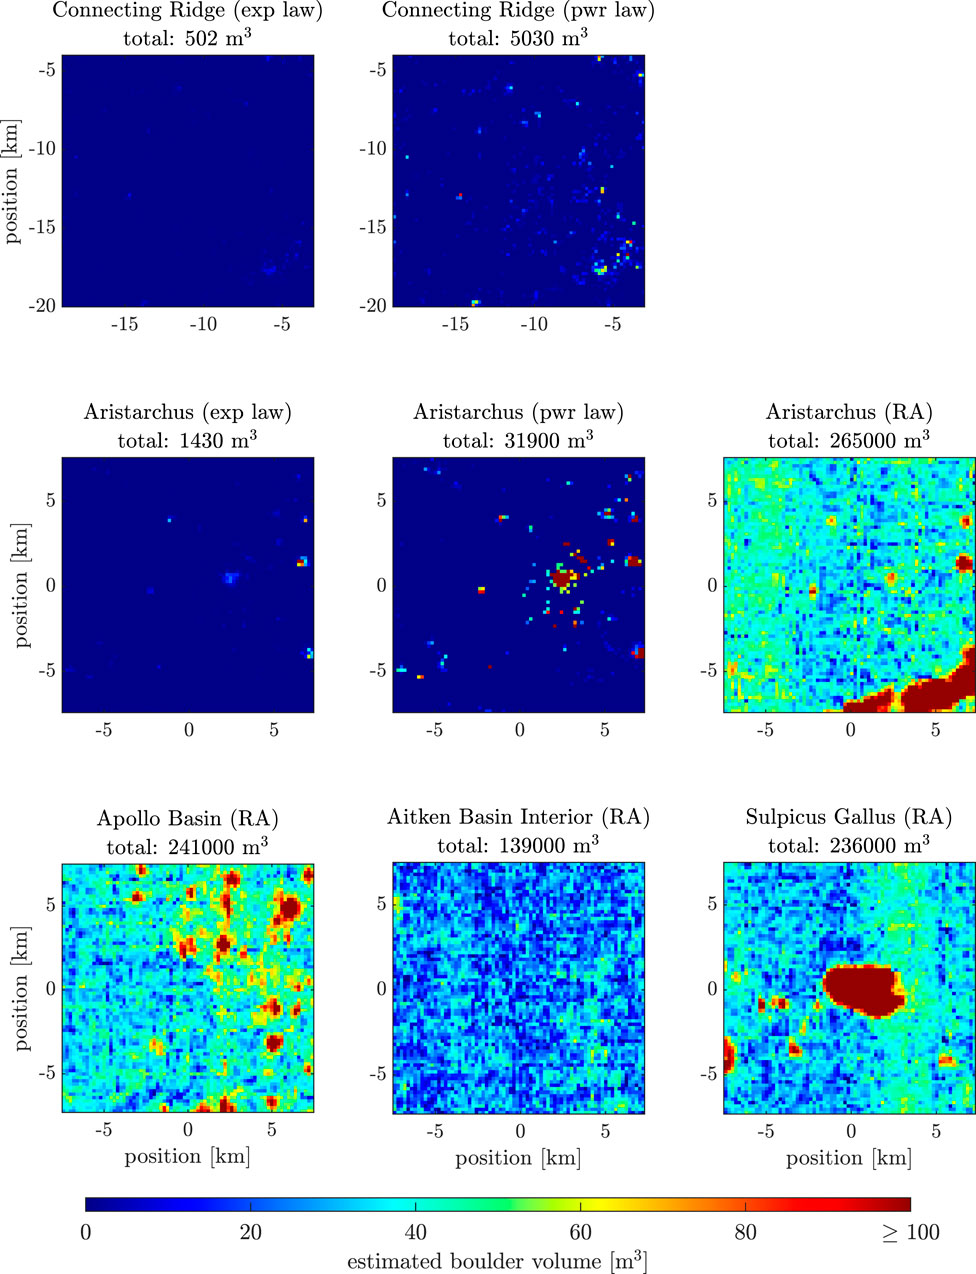
Figure 3. Comparison of the boulder volume maps of different regions with different size-frequency distribution laws (exp law: exponential law; pwr law: power law; RA: rock abundance dependent exponential law by Li and Wu (2018)).
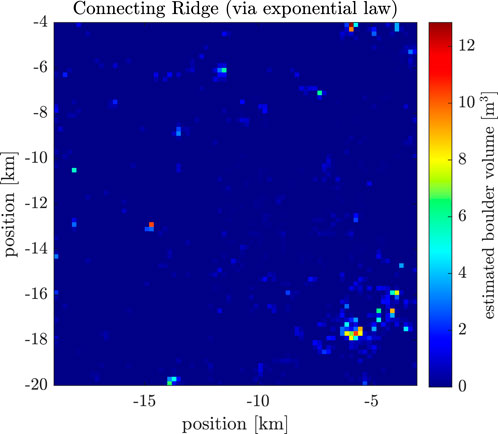
Figure 4. Boulder volume map of Connecting Ridge by using an exponential law for the SFD.
This section describes the determination of the distance the excavator has to travel to collect the required boulders for construction, as well as how long the whole construction process takes and how much energy is needed.
In the following, the problem statement of the path planning for the collection of the boulders is described. The goal of the path planning was to minimize the overall boulder collection distance. This size is linear to the required time and furthermore also has an influence on the total energy consumption, as will be described in section 4.4 and section 4.5.
One of the constraints is the limited payload capacity of the vehicle used for the collection of boulders. It was mentioned by Johns et al. (2023) that the payload in their case usually was about 7 m3. The standard value considered in this study will be 10 m3 of boulders. The influence of the payload capacity on the results will be discussed in section 5.2.3.
Another considered constraint is the allowable slope of the terrain, such that it still is traversable by the vehicle. The LRV (Lunar Roving Vehicle) of the Apollo missions, for example, according to the “Lunar Sourcebook” by Heiken et al. (1991) was able to climb slopes of up to 19°–23°. Another source even mentions that the LRV is capable of climbing 25° steep slopes, while the steepest slopes it actually did climb during the missions were about 10°–15° (Jones and Nola, 1971). For the LTV (Lunar Terrain Vehicle), which will enable to transport crew during Artemis missions (O’Shea, 2023), a draft of a document mentions that the road used to test the vehicle has phases with 20° uphill, downhill, as well as sideways (NASA, 2023b). Based on this, we decided to consider a direction independent slope constraint of 20°.
In the following, two constraints on the excavator landing site are discussed. The term excavator landing site thereby stands for where the excavator will be landed, which does not necessarily need to be at the same location as the base camp site, because the excavator is able to move from its landing location to the base camp site. The HDL (Human-class Delivery Lander), who is considered here as a reference lander for the transport of the excavator, is required to be capable of landing on slopes of at least 10° (requirement HDL-S-R-0041) (NASA, 2022b).
The second constraint concerns hazardous boulders in the landing region and is motivated by Grant et al. (2018). The size of the regions checked for hazardous boulders is chosen to be 100 m by 100 m, which is based on the required 50 m landing precision of the HDL (requirement HDL-S-R-0040) (NASA, 2022b). This constraint will be formulated differently for when the boulder volume map was generated with mapped boulders or rock abundance data as in section 3.4. In the case, where rock abundance data is used, this is done based on a probability to encounter a hazardous rock, which was used by Grant et al. (2018) for Curiosity and Perseverance, as well as on additional information about lunar landers4 (Astrobotic, 2018). In the case, where mapped boulders are used, the possible excavator landing sites are required to be free of any boulders mapped in the NAC images.
For Connecting Ridge, an additional constraint is to not enter permanently shadowed regions. Those regions are scientifically uniquely interesting and should not be traversed or contaminated (Swiney and Hernandez, 2022).
The path planning pipeline consists of multiple modules. It uses a greedy score, motivated by Walther et al. (2022), which is used to select the next target location for the boulder collection. A global planner then searches for the shortest path to the target using the A* algorithm introduced by Hart et al. (1968). The A* algorithm is an adjusted version of the Dijkstra algorithm (Dijkstra, 1959), which, for example, was used by Pena-Asensio et al. (2023) for the path planning of lunar EVA’s. The distance to collect the boulders at the target site itself then is estimated using a formula proposed by Few (1955). The global path planner additionally ensures the payload capacity constraint of the vehicle by sending it back to the base camp location to unload the boulders, when the payload capacity is about to be reached.
A further module of the path planning pipeline is a local planner, which ensures the slope constraints of the vehicle and keeps it out of permanently shadowed regions. For the slope constraint, the elevation data of Barker et al. (2021) is used for Connecting Ridge and the SLDEM2015 data of Barker et al. (2016) otherwise. Regions are considered to be permanently shadowed if the 60 m spaced Sun visibility data of Mazarico et al. (2011) is equal to zero at the corresponding location. For more details about the implementation of the path planning pipeline, the interested reader is referred to the Supplementary Material.
This section presents the results of the boulder collection distances using the path planning pipeline described in the previous sections. The considered task thereby is to collect 250 m3 of boulders, which is about enough for a quarter ring segment of a blast shield as mentioned in section 2. The results are shown in the form of distance maps, where the color of a pixel indicates the collection distance required to build a quarter ring segment at that particular location. Black pixels denote sites without access to a sufficient amount of boulders, as otherwise the slope constraints of the vehicle would be violated or permanently shadowed regions would be entered.
Figure 5 shows the distance map of Connecting Ridge by using an exponential law for the SFD. Note that the x- and y-axis are the position in [km] in the polar-stereographic coordinate system. Figure 6 compares the collection distance maps with different regions and with different size-frequency distribution laws for the boulders. For Connecting Ridge, the x- and y-axes are the polar-stereographic x- and y-coordinates. For the other regions, the x- and y-axes are x- and y-coordinates of a flattened coordinate system with origin in the center of the respective region.
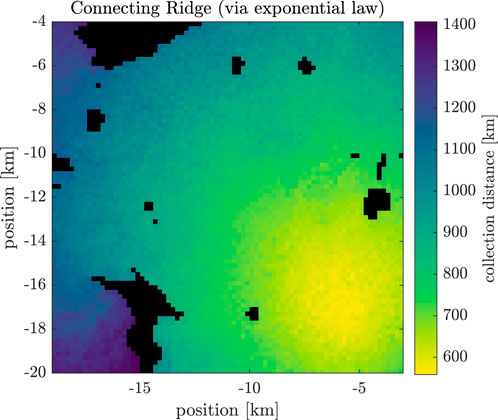
Figure 5. Distance map of Connecting Ridge by using an exponential law for the SFD.
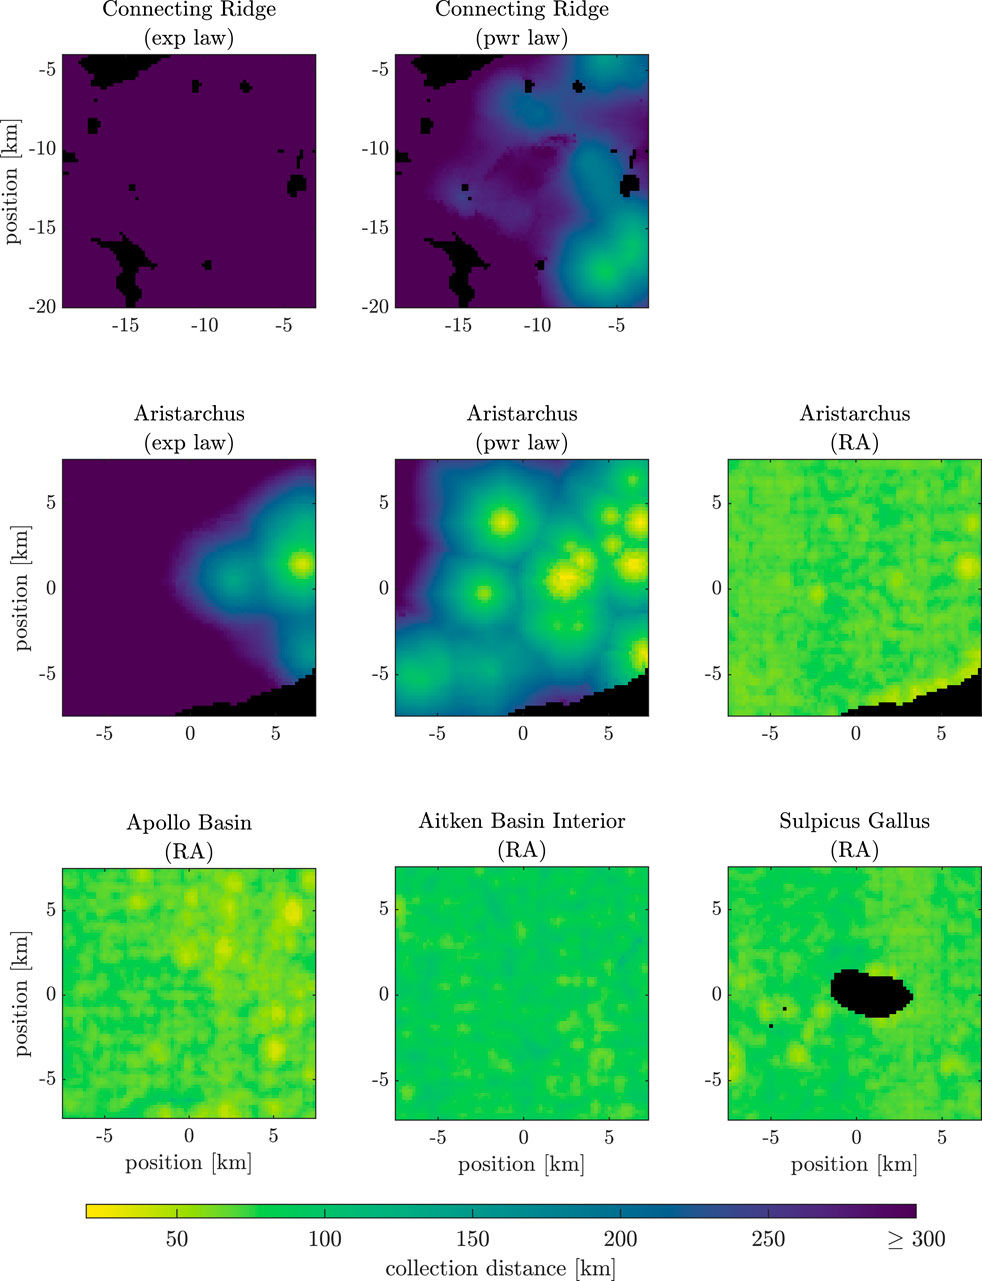
Figure 6. Comparison of the collection distance maps of different regions with different size-frequency distribution laws (exp law: exponential law; pwr law: power law; RA: rock abundance dependent exponential law by Li and Wu (2018)).
The overall time for the construction, assuming the boulder collection and the construction itself take part sequentially, is composed as:
where tcollect, driving is the needed time for driving to collect the required boulders, tconstruct, driving the time for driving during the construction and thandling the time to scan and place the boulders.
For the calculation of the driving times, the velocity of the LRV of the Apollo missions is taken as a reference. For the Apollo 15 mission, the average velocity was 9.2 km/h according to Jones and Nola (1971). The calculation of the handling time is based on the value 21 min/stone by Johns et al. (2023). The exact formulas are shown in the Supplementary Material.
Note that the time calculated as in Eq. 2 is the operational time and neglects charging times and furthermore also the lunar nights, during which operation might not be feasible. The actual time therefore might be about twice as long.
The overall energy for the construction is
where Ecollect is the needed energy to collect the required boulders and Econstruct the energy for the construction itself.
Ecollect and Econstruct furthermore are composed of the work against the driving resistance and the work related to the potential energy change during the collection:
The calculation of the individual parts is shown in the Supplementary Material. Some of the calculations require the gravitational constant of the Moon gM and the density of the boulders ρb. For this, the values gM = 1.64 m/s2 and ρb = 2650 kg/m3 provided by Susante and Metzger (2016) are used. Note that Wcollect,pot also can be negative. We use the elevation data by Barker et al. (2021) for the Connecting Ridge site and the SLDEM2015 data by Barker et al. (2016) for the Aristarchus site.
We assume the driving work to scale linearly with distance and mass, which accords with a formula by Sripad and Viswanathan (2017). The energy per distance and mass is estimated based on data of the LRV of the Apollo missions, which was mentioned by Jones and Nola (1971) and results in 0.334 J/m kg.
The vehicle mass mvehicle is also approximated using data of the LRV given by Jones and Nola (1971), which is scaled according to the payload capacity. For the mass of the incorporated excavator, a rough estimate was done based on a data sheet5 of Menzi Muck. For the full formula of the vehicle mass, the interested reader is referred to the Supplementary Material.
We use some of the parameters of Table 1 to compute the median values of the boulder collection distance and different energy and time components of all base camp sites in Connecting Ridge for a quarter segment of a blast shield (Table 2). An exponential law (boulder size frequency distribution) was assumed when generating those results.
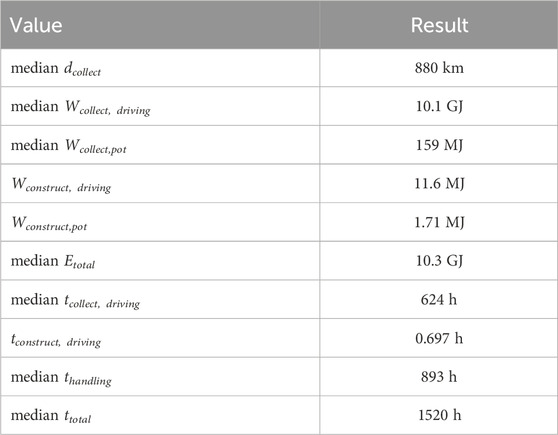
Table 2. Median boulder collection distance, duration and required energy in Connecting Ridge for a quarter segment of a blast shield at a radius of 50 m and by assuming an exponential law.
Furthermore, we present the results of a specifically chosen base camp site in the middle of Connecting Ridge. This base camp site was selected based on the local slope (motivated based on the HLS requirement HLS-S-R-0022 (NASA, 2022a)), in direct proximity of the ridge’s topographic summit, maximizing illumination and direct-to-Earth communication (NASA, 2022c). For this, we used elevation data of Barker et al. (2021) and Sun and Earth visibility data of Mazarico et al. (2011). We again consider a quarter segment of a blast shield, use parameters of Table 1 and assume an exponential law (boulder size-frequency distribution). The resulting boulder collection distance, as well as the energy and time components for this selected base camp site are summarized in Table 3. The driving work turns out to be larger than the energy related to the potential energy change of the collected boulders. The latter one, however, is also not negligible, which is due to the fact that the chosen base camp site is located in a topographic high, as can be seen in elevation data of Barker et al. (2021). The required energy for construction turns out to be much lower than the required energy for the collection of the boulders.
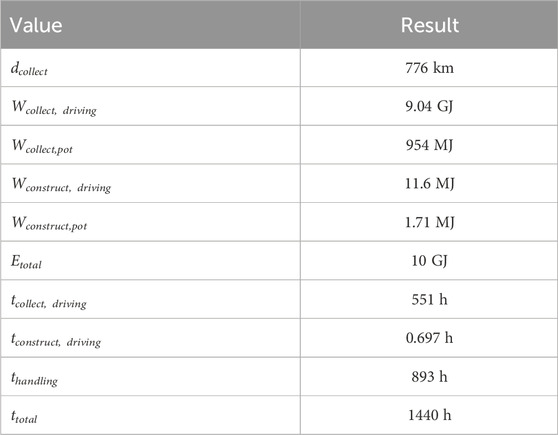
Table 3. Distance, total duration and required energy at the selected base camp site for a quarter segment of a blast shield at a radius of 50 m and by assuming an exponential law.
The resulting path to collect the boulders is visualized in Figure 7. The white square with black edge in Figure 7 shows where the base camp site and the landing site of the excavator are located. As the base camp site fulfils the excavator landing site requirements mentioned in section 4.1.3, the two sites are identical. The right map in the figure indicates sites with available boulders. The vehicle has to traverse a significant portion of the area to collect the boulders, focusing on target locations with high boulder abundance.
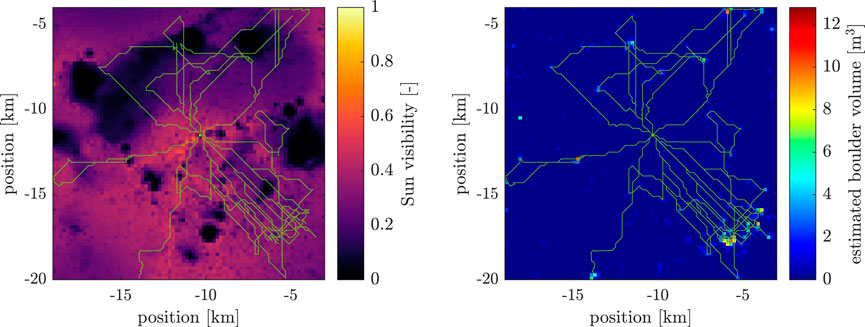
Figure 7. Path for the boulder collection (left background: Sun visibility data of Mazarico et al. (2011) interpolated to the 200 m by 200 m grid; right background: estimated boulder volume; white square with black edge: base camp site and excavator landing site).
In Figure 3, the boulder volume maps of different regions and via different assumptions on the size-frequency distribution law were compared. Boulder volume maps based on manually mapped boulders tend to be sparser than maps based on rock abundance data, which rarely feature locations without boulders. There is also a difference between the resulting expected boulder volume as derived with a power law and an exponential law (both with manually mapped boulder data), which will further be discussed in section 5.3.2.
We note that in case the available boulder volume is insufficient, the region where boulders are collected could simply be enlarged. Furthermore, the Moon is known to have subsurface rocks (Thompson et al., 1970; Elder et al., 2019). As an alternative, those subsurface rocks could be dug out and used for construction. Potential disadvantages include dust ejection and an increased energy consumption (Taylor et al., 2005; Lim et al., 2017).
This section shows multiple trade-offs between design parameters and their implications on the proposed construction method.
The required boulder volume to construct a blast shield as described in section 2 mainly depends on the geometrical dimensions of it. The amount of required boulders increases with the radius of the blast shield ring. This is because of a) the increased perimeter and b) the increased height of the blast shield. Our results indicate that the decrease of the gas/dust pressure for larger blast shield radii does not compensate these effects. Further, the landing accuracy of incoming spacecraft has a large influence on the required boulder volume. In all previous examples it was assumed that incoming landers perform pinpoint landings. The requirements of the sustained HLS and HDL however mention a landing accuracy of 50 m (see requirement HLS-S-R-0021 (NASA, 2022a), respectively HDL-S-R-0040 (NASA, 2022b)). The lack of pinpoint landing capabilities would significantly increase the required amount of boulders, marking a clear trade-off between landing accuracy and the amount of required construction material.
The size range of the considered boulders for the construction is a crucial design parameter. It is limited by the dimensions of the gripper of the excavator and the thickness of the walls that will be constructed. Our results indicate that extending the size range to larger boulders not only increases the amount of available boulders, but also decreases the collection distance and the time to scan and place the boulders. If however only large boulders are used, the time to scan and place the boulders further gets reduced significantly. This is due to the fact that the average volume per boulder is larger, when larger boulders are used, and therefore fewer boulders need to be scanned and placed. It remains unclear how homogeneous/heterogeneous a dry-stone blast shield can be without compromising its ability to retain engine-ejected dust and pebbles.
An important design parameter of the vehicle that collects the boulders is its payload capacity. A larger payload capacity will make the vehicle both larger and heavier, which in turn increases the transportation costs to ship it from Earth to the Moon. In addition, the larger empty mass of the vehicle will lead to a larger energy consumption during traverses without any payload. A larger payload capacity however also decreases the driving distance and therefore the duration of the collection process. The number of empty drives also gets decreased with a larger payload capacity, which then reduces the required energy to move the overhead mass of the gripper across the region.
The standard value for the payload capacity was chosen to be 10 m3. It was found out that the time and energy for driving during the boulder collection are already quite low for a payload capacity of about 5 m3. When increasing it to 10 m3, it will get slightly faster, but the required energy starts to slightly increase due to the larger empty mass. We note that the driving time could also be linearly decreased by increasing the number of vehicles that collect the boulders. The required energy thereby would remain as it is. The drives from the base camp site to the boulder collection sites and back would be split up between the vehicles. The downside of this however is the additional mass that has to be transported from Earth to the Moon, as all vehicles would have their own excavator gripper.
A method to reduce the required energy and, in case of multiple vehicles also the transportation cost to the Moon, would be to separate the excavator and the truck. This would be particularly useful for boulder clusters located far away from the construction site.
This section shows the influence of uncertainties on the results. Note that the trade-offs in section 5.2 in contrast were showing the influence of design parameters on the results.
The assumptions regarding the engine-driven pressure on the blast shield, as described in section 2, are relatively broad. The used scaling of the pressure was done based on the maximum thrust of the Starship from SpaceX. The actual applied thrust during a lunar landing is probably much lower, especially also due to the low lunar gravity. Furthermore, there is also some uncertainty on how well the laws, which are used to scale the pressure by the landing pad radius and the mentioned actual thrust, are. While the used pressure probably should lead to conservative results, more research will be required in the future in order to get a better understanding of the actual pressure induced on the blast shield by a specific lander.
A large uncertainty lies in the estimated amount of boulders based on the extrapolation with the size-frequency distribution law. As already mentioned in section 3.2, Rüsch et al. (2022) find that the applicable law depends on the age of the region. We note that the exact absolute geologic age of the two considered regions is poorly constrained and is subject to local variations. Throughout this work we fall back to using the exponential law as it provides conservative estimates of the amount of available boulders. Figure 8 shows the longest axis length versus the cumulative number of boulders of this size or larger, together with the exponential law and power law fits. Note that the fits only use the data points with dlong ≥ dthreshold as described in section 3.2, where dthreshold was set to 2 m in this study. Note that the SFD-law fits here are made for the whole regions and not locally as done for the boulder volume maps described in section 3.3. In contrast to the power law, the exponential law has a drop off for small sizes and thus predicts lower boulder volume amounts, making it a more conservative approach.
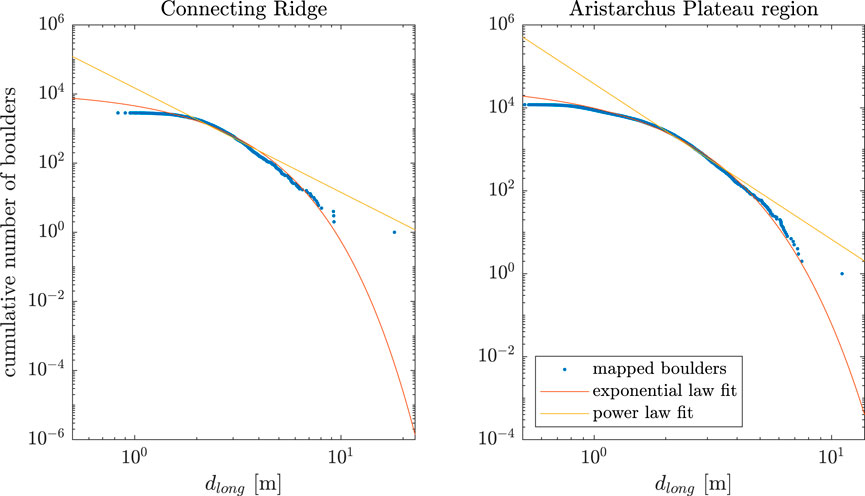
Figure 8. Longest axis length versus cumulative number over the whole Connecting Ridge and chosen Aristarchus Plateau regions.
The available boulder volume, as well as the median distances, median total energies and median total times of all base camp locations are also shown in Table 4 for the case with exponential law and power law. The table shows that the available amount of boulders with the power law is one order of magnitude higher than with the exponential law. Thus, the distances also are much shorter. This then also results in lower total energy consumption.
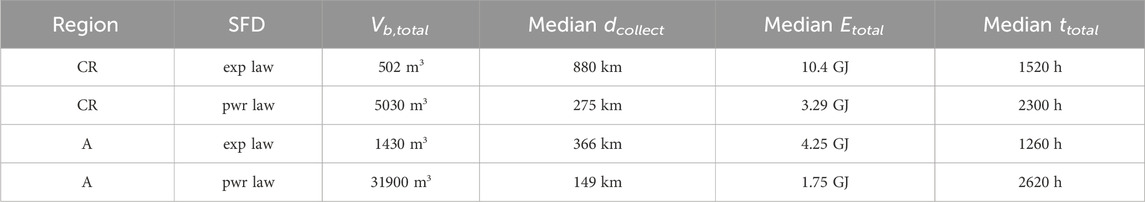
Table 4. Comparison of the totally available boulder volume and the median distances, median total energies and median total times of all base camp locations using different size-frequency distribution laws and for 250 m3 of boulders. CR: Connecting Ridge, A: chosen Aristarchus Plateau region, exp law: exponential law, pwr law: power law.
The handling times however are shorter when the exponential boulder size-frequency distribution is assumed, as the ratio of small to large boulders is lower with the exponential law than with the power law, which then results in assuming less boulders for the same volume. When less boulders have to be scanned and placed, the handling time is shorter. The shorter distance and thus shorter collection time in the case with the power law cannot fully compensate the larger handling time, which is why the total time will be larger with the power law, unless the collection is biased towards large boulders.
Ultimately, the exponential law is conservative with respect to the estimated amount of available small boulders, the distance and the energy consumption. In turn, it might lead to an underestimation of the construction duration.
It stands out in Figure 6 that the distances using the rock abundance dependent exponential law by Li and Wu (2018) are much shorter than when mapped boulders are used. Further, the boulder volume maps using the mentioned rock abundance based method in Figure 3 are much denser than the maps created based on manually mapped boulders. Golombek et al. (2008) observed the phenomena that less small (Martian) boulders are found in orbiter images than in surface made images or predicted by models. Li and Wu (2018) also assume that multiple small boulders sometimes appear as one large boulder in NAC images, which is why too many large and too few small boulders are expected when mapping boulders in images with limited spatial resolution. Bandfield et al. (2011) state that the mapped amount of boulders smaller than 3 m might always be too low. Further, Bandfield et al. (2011) notice that the fractional area of mapped boulders was much lower than the one obtained using the Diviner data. Note that in section 3.4 the new rock abundance data of Powell et al. (2023) is used and not the one created by Bandfield et al. (2011), but the mentioned statements still indicate that the mapped boulders could be incomplete.
In conclusion, this shows that there also is an uncertainty on the completeness of the mapped boulders, and not only on the SFD-law used for the extrapolation. The accuracy of the estimated amount of available boulders could be improved, if there was a lunar orbiter equipped with a camera with a higher resolution than the LRO NAC.
The relation between the longest boulder axis and the volume, which was shown in section 3.3 and depends on the shape of the boulders, is not known exactly. By only using the information about the axis length relations that were mentioned by Demidov and Basilevsky (2014), the factor between longest boulder axis and the volume would approximately be 0.23, while with values of Krishna and Kumar (2016), it can also be down to 0.1 (considered as the standard case in this paper) or 0.025. We note that with the last mentioned value, there would not be enough boulder volume available in Connecting Ridge, when assuming the exponential law, to build a quarter ring segment of a blast shield, while with the value 0.23, the collection distances are significantly shorter than with the standard value of 0.1.
The proposed construction method is facing a series of challenges, some of which require further consideration. A dry stone wall constructed using irregular, unprocessed boulders will contain small gaps. It needs to be examined, whether those gaps are an issue when the wall is used as a blast shield. This will require simulations and experiments under lunar conditions. In case the regolith blasts could pass through the gaps, it would be necessary to seal them, e.g., by using small boulders or loose regolith.
A further challenge is the travel distance and time required to collect the material and construct a blast shield. As shown in Figure 5, the distance to collect the boulders can be around 1000 km. Table 2 on the other hand showed, that the median operation time is about 1500 h, which corresponds to 63 full Earth days. This does not include charging times or hibernation during the lunar night, which is why the actual mission time will be at least twice as long. As a reference, the Lunokhod 1 rover was operative for 321 Earth days and travelled ∼10 km (Karachevtseva et al., 2013). This indicates, that the mission duration is achievable. The LRV of the Apollo 17 mission on the other hand drove approximately 35 km in about 4.5 h driving time Smith et al. (1973), which shows, that much farther distances than the mentioned one of Lunokhod 1 are possible—assuming the rover can reach a human level of navigation autonomy. A remaining challenge will be the recharging process. The robotic excavator thereby might either harvest energy by itself, rely on a few recharging stations, or could be powered by RTGs (radioisotope thermoelectric generators).
In the following, the energy consumption of two alternative blast shield construction methods are calculated and compared to the energy consumption of the proposed method. We note that the creation of un-cast regolith berms, as proposed by Mueller et al. (2009) and Moses and Mueller (2021), is not discussed here. This method probably would need less energy than the other construction methods, but comes with other disadvantages: the impacting stream of spacecraft exhaust and pebbles/dust could erode a regolith berm over time (Morris, 2012). In addition, the excavation and dumping of large amounts of regolith can lead to serious issues with the resulting dust (Taylor et al., 2005; Lim et al., 2017).
Cast regolith has a very high compressive strength and is proposed to be used as a building material on the Moon, including blast shields (Benaroya et al., 2012). Benaroya et al. (2012) state that the creation of cast regolith takes 360 kWh/t, while the density of cast regolith is 3 g/cm3. This leads to a needed energy per volume of 3888 MJ/m3.
The required amount of cast regolith is calculated similarly as it was done in section 2 for our proposed construction method and by also using some of the parameters mentioned in Table 1. The required energy to produce the cast regolith then is 1250 GJ for a quarter ring segment of the blast shield.
Microwave heating of lunar regolith leads to melting or sintering of the material (Lim et al., 2021). Lim et al. (2021) showed in experiments with regolith simulant JSC-1A that 50 g could be hardened with 1000 W and an applied energy of 900 kJ. They state that the true density of the regolith simulant is 2904 kg/m3 and that the resulting material after the microwave treatment had a true density of 3020 kg/m3 (Lim et al., 2021). The required energy per volume then is 54.4 GJ/m3.
The calculation of the needed volume of construction material for a blast shield with radius r = 50 m is done similarly as in section 5.5.1 and also by using some of the parameters mentioned in Table 1. The result is about 1290 m3, respectively only about 322 m3, when only a quarter ring segment is built. The needed energy then is 17500 GJ for the quarter ring segment. Note that the used value for the density given by Lim et al. (2021) is the true density and not the bulk density, which unfortunately is not provided and therefore unknown. Lim et al. (2021) mention that the void ratio in the regolith simulant prior to microwave heating was 47%. By assuming the bulk density to be half of the true density, which probably is too low as melting or sintering takes place according to Lim et al. (2021), the required energy still is 6440 GJ for the quarter ring segment.
In Table 5, the required energy of the three construction methods are compared. Our proposed method requires about two to three orders of magnitudes less energy than the other construction methods. By assuming equal construction time, this would mean that solar arrays used for charging would need about 100–1000 times less surface area. The very low energy consumption is one of the main advantages of the proposed construction method.
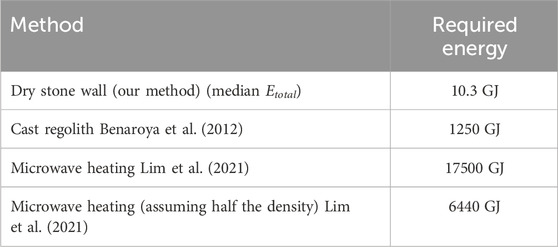
Table 5. Comparison of the energy consumption to build a quarter ring segment of a blast shield with different construction methods.
Figure 7 suggests that the collection of boulders can be quite invasive, as boulders are systematically moved across the surface, negatively impacting future scientific studies. The sustainable utilization of lunar resources—including boulders—is subject to an ongoing debate (Pirtle et al., 2023). We note that the systematic collection of boulders might in fact aid scientific analyses, if properly conducted: all boulders remain unprocessed and can be accessed in the blast shield wall (Johns et al., 2020). Context data collected before and during the collection of boulders (location, orientation, composition, etc.) could be used to create a digital twin of the area of interest, opening up new research venues, such as related to the regional study of impact ejecta composition.
In future missions to Mars, ISRU will become even more important, as the transportation costs from Earth to Mars are much higher than from Earth to the Moon, due to the larger distance, motivating a basic comparison of the median available boulder volume on the Moon and on Mars. For the Moon, the rock abundance dependent exponential law by Li and Wu (2018) and the rock abundance data of Powell (2022) and Powell et al. (2023) was used. For Mars, the rock abundance dependent exponential law and boulder axis length ratio by Golombek and Rapp (1997) and information about the rock abundance of Christensen (1986) was used. For the lunar case, the median area that contains 250 m3 of boulders is slightly larger than 0.2 km2, while the median area on Mars that contains 250 m3 of boulders is about 0.06 km2. This shows, that the proposed construction method would work even better on Mars than on the Moon. We note that the regional geologic context can significantly influence the availability of boulders, particularly on an atmospheric planet like Mars.
This section gives an overview of what work remains open for future research. As mentioned, the estimate of the available amount of boulders has some uncertainties. High resolution images of landers at the regions of interest will allow to get a better understanding of how many small boulders are available. Furthermore, the usage of the proposed construction method could be expanded to also build arch vaults, which could be used as habitats and shelters. The capability of autonomously constructing arches with irregular boulders will need to be demonstrated in experiments. Finally, an excavator capable of operating in the lunar environment needs to be developed and the exact dimensions of the infrastructure need to be set.
In this work we propose an autonomous excavator that is able to collect boulders across the lunar surface and use them to construct dry-stone blast shields. We calculate that a total of about 1000 m3 and 250 m3 is required for a full and a quarter ring blast shield segment. We determine the number and sizes of boulders physically present across two sites of interest, the Shackleton-Henson Connecting Ridge and a section of the Aristarchus pyroclastic deposit, using LRO NAC images. We use size-frequency distribution laws to estimate the fraction of boulders smaller than the NAC spatial resolution. In addition, we explore an alternative approach that exclusively relies on LRO Diviner rock abundance data to estimate the abundance of appropriate construction material. We use a path planning pipeline to calculate the distance an excavator needs to transverse to collect the required amount of boulders and perform energy and time calculations of the overall construction process. We find that the required energy is two to three orders of magnitudes lower than with other construction methods proposed in the literature.
We show that the landing pad radius and the lander precision have a large influence on the boulder volume required for a blast shield. Utilization of large boulders reduces the overall construction time, while utilizing boulders with a wide size range reduces the overall driving distance. Our results indicate that a large vehicle payload capacity does not provide any significant energy consumption and construction time benefits. The results presented here rely on a number of conservative estimates and assumptions, such as the boulder size-frequency distribution law used for the extrapolation of the number of boulders towards small sizes. Finally, we demonstrate the applicability of our overall method on planet Mars using rock abundance data.
This work showcases the strategic importance of innovative in-situ resource utilization and construction strategies for the sustainable exploration of the Moon and beyond.
The datasets presented in this study can be found in online repositories. The names of the repository/repositories and accession number(s) can be found below: Our boulder shapefiles, some geotiff files of the boulder volume maps and the distance maps, as well as the code of the path planning pipeline are available online (Walther et al., 2023). The used data, which is publicly available, is listed in the following, including the source where it can be found:
• NAC images (Robinson et al., 2010; Humm et al., 2016; Mahanti et al., 2016; Speyerer et al., 2012; Robinson, 2010): e.g., via https://wms.lroc.asu.edu/lroc/search or https://pds.lroc.asu.edu/data/LRO-L-LROC-2-EDR-V1.0/
• Artemis candidate regions geojson file: https://files.actgate.com/lunar/A3_Named_regions.geojson
• Constellation Program regions of interest shapefile by Lucey et al. (2009): https://wms.lroc.asu.edu/lroc/view_rdr/SHAPEFILE_CX_TARGETS
• Earth visibility and Sun visibility data of Mazarico et al. (2011): http://imbrium.mit.edu/EXTRAS/ILLUMINATION/JP2/
• Rock abundance data by Powell (2022): https://doi.org/10.25346/S6/LFAVXU
• SLDEM2015 elevation data by Barker et al. (2016): http://imbrium.mit.edu/DATA/SLDEM2015/TILES/JP2/
• SLDEM2015 slope data by Barker et al. (2016): http://imbrium.mit.edu/DATA/SLDEM2015_SLOPE/TILES/JP2/
• SLDEM2015 azimuth data by Barker et al. (2016): http://imbrium.mit.edu/DATA/SLDEM2015_AZIMUTH/TILES/JP2/
• South pole elevation data by Barker et al. (2021): https://pgda.gsfc.nasa.gov/products/78
JW: Conceptualization, Methodology, Software, Validation, Formal analysis, Investigation, Data curation, Visualization, Writing–original draft, Writing–review and editing. RJ: Conceptualization, Methodology, Supervision, Funding acquisition, Visualization, Writing–review and editing, Writing–original draft. HK: Conceptualization, Methodology, Supervision, Funding acquisition, Writing–review and editing, Writing–original draft. VB: Conceptualization, Methodology, Supervision, Funding acquisition, Software, Data curation, Writing–review and editing, Writing–original draft. MH: Conceptualization, Funding acquisition, Supervision, Writing–review and editing, Writing–original draft.
The author(s) declare financial support was received for the research, authorship, and/or publication of this article. This work has been conducted as part of ESA contract No. 4000134584/21/NL/GLC/my. Open access funding by ETH Zurich.
We want to thank Ottaviano Rüsch for his advice concerning the fit of boulder size-frequency distribution laws. Furthermore, we want to thank Boazman et al. (2022) for providing us with the boulder shapefiles of Connecting Ridge. We also acknowledge the use of QGIS6, as well as GDAL (GDAL/OGR contributors, 2020) to handle georeferenced data.
The authors declare that the research was conducted in the absence of any commercial or financial relationships that could be construed as a potential conflict of interest.
All claims expressed in this article are solely those of the authors and do not necessarily represent those of their affiliated organizations, or those of the publisher, the editors and the reviewers. Any product that may be evaluated in this article, or claim that may be made by its manufacturer, is not guaranteed or endorsed by the publisher.
The Supplementary Material for this article can be found online at: https://www.frontiersin.org/articles/10.3389/frspt.2024.1345337/full#supplementary-material
1https://www.spacex.com/vehicles/starship/ accessed: 23.08.2023.
3https://quickmap.lroc.asu.edu/
4https://www.spacex.com/vehicles/starship/accessed: 23.08.2023.
5https://www.menzimuck.com/fileadmin/menzimuck.com/public/03-produktgruppen/38-Menzi-Baumaschinen-Zubehoer/Prospekt/zubehoer-0318-de.pdf accessed: 12.09.2023.
Baloga, S. M., Glaze, L. S., and Spudis, P. D. (2012). Inferred lunar boulder distributions at decimeter scales
Bandfield, J. L., Ghent, R. R., Vasavada, A. R., Paige, D. A., Lawrence, S. J., and Robinson, M. S. (2011). Lunar surface rock abundance and regolith fines temperatures derived from LRO Diviner Radiometer data. J. Geophys. Res. Planets 116, E00H02. 0–02. doi:10.1029/2011JE003866
Barker, M. K., Mazarico, E., Neumann, G. A., Smith, D. E., Zuber, M. T., and Head, J. W. (2021). Improved LOLA elevation maps for south pole landing sites: error estimates and their impact on illumination conditions. Planet. Space Sci. 203, 105119. doi:10.1016/J.PSS.2020.105119
Barker, M. K., Mazarico, E., Neumann, G. A., Zuber, M. T., Haruyama, J., and Smith, D. E. (2016). A new lunar digital elevation model from the lunar orbiter laser altimeter and SELENE terrain camera. Icarus 273, 346–355. doi:10.1016/J.ICARUS.2015.07.039
Benaroya, H., and Bernold, L. (2008). Engineering of lunar bases. Acta Astronaut. 62, 277–299. doi:10.1016/J.ACTAASTRO.2007.05.001
Benaroya, H., Indyk, S., and Mottaghi, S. (2012). Advanced systems concept for autonomous construction and self-repair of lunar surface isru structures. Moon Prospect. Energy Material Resour. 9783642279690, 641–660. doi:10.1007/978-3-642-27969-0_27/COVER
Bickel, V. T., Aaron, J., Manconi, A., and Loew, S. (2021). Global drivers and transport mechanisms of lunar rockfalls. J. Geophys. Res. Planets 126. doi:10.1029/2021JE006824
Bickel, V. T., Aaron, J., Manconi, A., Loew, S., and Mall, U. (2020). Impacts drive lunar rockfalls over billions of years. Nat. Commun. 11 (1 11), 2862–2867. doi:10.1038/s41467-020-16653-3
Boazman, S. J., Shah, J., Gawronska, A. J., Halim, S. H., Satyakumar, A. V., Gilmour, C. M., et al. (2022). The distribution and accessibility of geologic targets near the lunar south pole and candidate Artemis landing sites. Planet. Sci. J. 3, 275. doi:10.3847/PSJ/ACA590
Cesaretti, G., Dini, E., Kestelier, X. D., Colla, V., and Pambaguian, L. (2014). Building components for an outpost on the lunar soil by means of a novel 3d printing technology. Acta Astronaut. 93, 430–450. doi:10.1016/J.ACTAASTRO.2013.07.034
Christensen, P. R. (1986). The spatial distribution of rocks on mars. Icarus 68, 217–238. doi:10.1016/0019-1035(86)90020-5
Clauset, A., Shalizi, C. R., and Newman, M. E. (2009). Power-law distributions in empirical data. SIAM Rev. 51, 661–703. doi:10.1137/070710111
Demidov, N. E., and Basilevsky, A. T. (2014). Height-to-diameter ratios of moon rocks from analysis of Lunokhod-1 and -2 and Apollo 11–17 panoramas and LROC NAC images. Sol. Syst. Res. 48, 324–329. doi:10.1134/s0038094614050013
DeSouza, I., Daly, M. G., Barnouin, O. S., Ernst, C. M., and Bierhaus, E. B. (2015). Improved techniques for size–frequency distribution analysis in the planetary sciences: application to blocks on 25143 itokawa. Icarus 247, 77–80. doi:10.1016/J.ICARUS.2014.10.009
Dijkstra, E. W. (1959). A note on two problems in connexion with graphs. Numer. Math. 1, 269–271. doi:10.1007/bf01386390
Elder, C. M., Douglass, B., Ghent, R. R., Hayne, P. O., Williams, J.-P., Bandfield, J. L., et al. (2019). The subsurface coherent rock content of the Moon as revealed by cold-spot craters. doi:10.1029/2019JE006128
Few, L. (1955). The shortest path and the shortest road through n points. Mathematika 2, 141–144. doi:10.1112/S0025579300000784
Gawronska, A. J., Barrett, N., Boazman, S. J., Gilmour, C. M., Halim, S. H., Harish, , et al. (2020). Geologic context and potential EVA targets at the lunar south pole. Adv. Space Res. 66, 1247–1264. doi:10.1016/J.ASR.2020.05.035
GDAL/OGR contributors (2020). GDAL/OGR geospatial data abstraction software library. Open Source Geospatial Found. Available at: http://gdal.org.
Gelino, N. J., Mueller, R. P., Sibille, L., Dixon, K. L., Gleeson, J., and Buckles, B. (2023). In-situ lunar launch and landing pad construction with regolith-thermoset polymer composite materials. American Society of Civil Engineers (ASCE). Earth and Space 2022: Space Exploration, Utilization, Engineering, and Construction in Extreme Environments - Selected Papers from the 18th Biennial International Conference on Engineering, Science, Construction, and Operations in Challenging Environments , 789–803. doi:10.1061/9780784484470.067
Golombek, M., and Rapp, D. (1997). Size-frequency distributions of rocks on mars and earth analog sites: implications for future landed missions. J. Geophys. Res. Planets 102, 4117–4129. doi:10.1029/96JE03319
Golombek, M. P., Huertas, A., Marlow, J., McGrane, B., Klein, C., Martinez, M., et al. (2008). Size-frequency distributions of rocks on the northern plains of Mars with special reference to Phoenix landing surfaces. J. Geophys. Res. Planets 113, 0–09. doi:10.1029/2007JE003065
Grant, J. A., Golombek, M. P., Wilson, S. A., Farley, K. A., Williford, K. H., and Chen, A. (2018). The science process for selecting the landing site for the 2020 Mars rover. Planet. Space Sci. 164, 106–126. doi:10.1016/J.PSS.2018.07.001
Hart, P. E., Nilsson, N. J., and Raphael, B. (1968). A formal basis for the heuristic determination of minimum cost paths. IEEE Trans. Syst. Sci. Cybern. 4, 100–107. doi:10.1109/TSSC.1968.300136
Heiken, G. H., Vaniman, D. T., and French, B. M. (1991). Lunar sourcebook: a user’s guide to the moon
Humm, D. C., Tschimmel, M., Brylow, S. M., Mahanti, P., Tran, T. N., Braden, S. E., et al. (2016). Flight calibration of the LROC Narrow angle camera. Space Sci. Rev. 200, 431–473. doi:10.1007/s11214-015-0201-8
Hurwitz, D. M., Head, J. W., and Hiesinger, H. (2013). Lunar sinuous rilles: distribution, characteristics, and implications for their origin. Planet. Space Sci. 79-80, 1–38. doi:10.1016/J.PSS.2012.10.019
Immer, C., Metzger, P., Hintze, P. E., Nick, A., and Horan, R. (2011). Apollo 12 lunar module exhaust plume impingement on Lunar Surveyor III. Icarus 211, 1089–1102. doi:10.1016/J.ICARUS.2010.11.013
Johns, R. L., Wermelinger, M., Mascaro, R., Jud, D., Gramazio, F., Kohler, M., et al. (2020). Autonomous dry stone. Constr. Robot. 4, 127–140. doi:10.1007/S41693-020-00037-6
Johns, R. L., Wermelinger, M., Mascaro, R., Jud, D., Hurkxkens, I., Vasey, L., et al. (2023). A framework for robotic excavation and dry stone construction using on-site materials. Sci. Robotics 8, eabp9758. doi:10.1126/scirobotics.abp9758
Karachevtseva, I., Oberst, J., Scholten, F., Konopikhin, A., Shingareva, K., Cherepanova, E., et al. (2013). Cartography of the lunokhod-1 landing site and traverse from lro image and stereo-topographic data. Planet. Space Sci. 85, 175–187. doi:10.1016/J.PSS.2013.06.002
Khoshnevis, B., Carlson, A., and Thangavelu, M. (2017). ISRU-based robotic construction technologies for lunar and martian infrastructures
Krishna, N., and Kumar, P. S. (2016). Impact spallation processes on the moon: a case study from the size and shape analysis of ejecta boulders and secondary craters of censorinus crater. Icarus 264, 274–299. doi:10.1016/J.ICARUS.2015.09.033
Laura, J., Acosta, A., Addair, T., Adoram-Kershner, L., Alexander, J., Alexandrov, O., et al. (2023). Integrated software for imagers and spectrometers. doi:10.5281/ZENODO.7644616
Li, B., Ling, Z., Zhang, J., and Chen, J. (2017). Rock size-frequency distributions analysis at lunar landing sites based on remote sensing and in-situ imagery. Planet. Space Sci. 146, 30–39. doi:10.1016/J.PSS.2017.08.008
Li, Y., and Wu, B. (2018). Analysis of rock abundance on lunar surface from orbital and descent images using automatic rock detection. J. Geophys. Res. Planets 123, 1061–1088. doi:10.1029/2017JE005496
Lim, S., Bowen, J., Degli-Alessandrini, G., Anand, M., Cowley, A., and Prabhu, V. L. (2021). Investigating the microwave heating behaviour of lunar soil simulant jsc-1a at different input powers. Sci. Rep. 11 (1 11), 2133–2216. doi:10.1038/s41598-021-81691-w
Lim, S., Prabhu, V. L., Anand, M., and Taylor, L. A. (2017). Extra-terrestrial construction processes – advancements, opportunities and challenges. Adv. Space Res. 60, 1413–1429. doi:10.1016/J.ASR.2017.06.038
Lucey, P. G., Gillis-Davis, J. T., Hawke, B. R., Taylor, L. A., Duke, M. B., Brady, T., et al. (2009). Leag review of constellation program regions of interest for human exploration of the moon. LPICo 1483, 73–74.
Mahanti, P., Humm, D. C., Robinson, M. S., Boyd, A. K., Stelling, R., Sato, H., et al. (2016). Inflight calibration of the lunar reconnaissance orbiter camera wide angle camera. Space Sci. Rev. 200, 393–430. doi:10.1007/s11214-015-0197-0
Mazarico, E., Neumann, G. A., Smith, D. E., Zuber, M. T., and Torrence, M. H. (2011). Illumination conditions of the lunar polar regions using LOLA topography. Icarus 211, 1066–1081. doi:10.1016/J.ICARUS.2010.10.030
McCombie, P. F., Morel, J. C., and Garnier, D. (2015). Drystone retaining walls: design, construction and assessment. Boca Raton: CRC Press. doi:10.1201/B19095
Morris, A. B. (2012). Simulation of rocket plume impingement and dust dispersal on the lunar surface. MS dissertation. Available at: https://repositories.lib.utexas.edu/handle/2152/ETD-UT-2012-12-6718.
Moses, R. W., and Mueller, R. P. (2021). Requirements development framework for lunar in situ surface construction of infrastructure. American Society of Civil Engineers. Earth and Space 2021: Space Exploration, Utilization, Engineering, and Construction in Extreme Environments - Selected Papers from the 17th Biennial International Conference on Engineering, Science, Construction, and Operations in Challenging Environments , 1141–1155. doi:10.1061/9780784483374.106
Mueller, R., Wilkinson, R. A., Gallo, C. A., Nick, A. J., Schuler, J. M., and King, R. H. (2009). “Lightweight bulldozer attachment for construction and excavation on the lunar surface,” in AIAA 2009 Space Conference and Exposition, Pasadena. Available at: https://ntrs.nasa.gov/citations/20130012987.
Muniruzzaman, A. N. M. (1957). On measures of location and dispersion and tests of hypotheses in a pare to population. Calcutta Stat. Assoc. Bull., 115–123. Secondary reference via [Clauset et al., “Power-law distributions in empirical data,” 2009]. doi:10.1177/0008068319570303
NASA (2020). NASA’s lunar exploration program overview. Available at: https://www.nasa.gov/sites/default/files/atoms/files/artemis_plan-20200921.pdf (Accessed August 10, 2023).
NASA (2021a). NASA picks SpaceX to land next americans on Moon. Available at: http://www.nasa.gov/press-release/as-artemis-moves-forward-nasa-picks-spacex-to-land-next-americans-on-moon (Accessed August 8, 2023).
NASA (2021b). SLS-SPEC-159 cross-program design specification for natural environments (DSNE), revision I. Available at: https://ntrs.nasa.gov/api/citations/20210024522/downloads/SLS-SPEC-159%20Cross-Program%20Design%20Specification%20for%20Natural%20Environments%20(DSNE)%20REVISION%20I.pdf (Accessed June 2, 2023).
NASA (2022a). HLS-RQMT-006 HLS program integrated lander requirements document – sustained phase, revision A + HLS-MD-001. Available at: https://sam.gov/opp/b1852a6dfa144607a517628bcb273e6a/view (Accessed June 2, 2023). 1.
NASA (2022b). HLS-RQMT-007 HLS program human-class delivery lander (HDL) requirements document – sustained phase, revision A. Available at: https://sam.gov/opp/b1852a6dfa144607a517628bcb273e6a/view (Accessed June 2, 2023).
NASA (2022c). NASA identifies candidate regions for landing next americans on moon. Available at: https://www.nasa.gov/press-release/nasa-identifies-candidate-regions-for-landing-next-americans-on-moon (Accessed August 24, 2023).
NASA (2023a). Exploration systems development mission directorate Moon-to-Mars architecture definition document (ESDMD-001). Available at: https://ntrs.nasa.gov/api/citations/20230002706/downloads/M2MADD_ESDMD-001(TP-20230002706).pdf (Accessed August 10, 2023).
NASA (2023b). Lunar Terrain Vehicle (LTV) standard road, draft. Available at: https://sam.gov/opp/17def9439fd348fc8d4dbc4feb9ee80d/view (Accessed June 2, 2023).
O’Shea, C. A. (2023). NASA pursues lunar terrain vehicle services for Artemis missions. Available at: https://www.nasa.gov/press-release/nasa-pursues-lunar-terrain-vehicle-services-for-artemis-missions (Accessed August 23, 2023).
Pena-Asensio, E., Sutherland, J., Tripathi, P., Mason, K., Goodwin, A., Bickel, V. T., et al. (2023). Automated astronaut traverses with minimum metabolic workload: accessing permanently shadowed regions near the lunar south pole. Acta Astronaut. 214, 324–342. doi:10.1016/J.ACTAASTRO.2023.10.010
Pirtle, Z., Mcbrayer, K., Beauchemin, A., Swiney, G., Lopez, L. D., Merrill, G., et al. (2023). in Artemis, ethics and society: Synthesis from a workshop.
Powell, T. (2022). Replication data for: high-resolution nighttime temperature and rock abundance mapping of the moon using the diviner lunar radiometer experiment with a model for topographic removal. doi:10.25346/S6/LFAVXU
Powell, T. M., Horvath, T., Robles, V. L., Williams, J. P., Hayne, P. O., Gallinger, C. L., et al. (2023). High-resolution nighttime temperature and rock abundance mapping of the moon using the diviner lunar radiometer experiment with a model for topographic removal. J. Geophys. Res. Planets 128, e2022JE007532. doi:10.1029/2022JE007532
Qiao, L., Hess, M., Xu, L., Wöhler, C., Head, J. W., Chen, J., et al. (2023). Extensive lunar surface disturbance at the Chang’e-5 mission landing site: implications for future lunar base design and construction. J. Geophys. Res. Planets 128. doi:10.1029/2022JE007730
Roberts, L. (1966). “The interaction of a rocket exhaust with the lunar surface AGARD the Fluid Dyn. Aspects of Space Flight 2. Secondary reference via,” in Simulation of rocket plume impingement and dust dispersal on the lunar surface. Editor A. Morris, 2012.
Robinson, M. S. (2010). Lunar reconnaissance orbiter camera experimental data record, LRO-L-LROC-2-EDR-V1.0, NASA Planetary Data System.
Robinson, M. S., Brylow, S. M., Tschimmel, M., Humm, D., Lawrence, S. J., Thomas, P. C., et al. (2010). Lunar reconnaissance orbiter camera (LROC) instrument overview. Space Sci. Rev. 150, 81–124. doi:10.1007/s11214-010-9634-2
Ruesch, O., and Bickel, V. (2023). Global mapping of fragmented rocks on the moon with a neural network: implications for the failure mode of rocks on airless surfaces. PSJ 4, 126. doi:10.3847/psj/acd1ef
Rüsch, O., Marshal, R. M., Iqbal, W., Pasckert, J. H., van der Bogert, C. H., and Patzek, M. (2022). Catastrophic rupture of lunar rocks: implications for lunar rock size–frequency distributions. Icarus 387, 115200. doi:10.1016/J.ICARUS.2022.115200
SIA (2012). SIA 266/2:2012, Secondary reference via Stiftung Umwelt-Einsatz Schweiz, Trockenmauern: Grundlagen, Bauanleitung, Bedeutung. Haupt Verlag, 2014.
Smith, E. C., Mustin, W. C., and Marshall, G. C. (1973). Lunar roving vehicle navigation system performance review
Speyerer, E. J., Wagner, R. V., Robinson, M. S., Humm, D. C., Becker, K., Anderson, J., et al. (2012). In-flight geometric calibration of the lunar reconnaissance orbiter camera. Int. Archives Photogrammetry, Remote Sens. Spatial Inf. Sci. XXXIX-B4, 511–516. doi:10.5194/ISPRSARCHIVES-XXXIX-B4-511-2012
Sripad, S., and Viswanathan, V. (2017). Performance metrics required of next-generation batteries to make a practical electric semi truck. ACS Energy Lett. 2, 1669–1673. doi:10.1021/acsenergylett.7b00432
Stiftung Umwelt-Einsatz Schweiz (2014). Trockenmauern: Grundlagen, Bauanleitung, Bedeutung (Haupt Verlag).
Susante, P. J. V. (2012). Landing pad construction rover attachment development earth and Space 2012 - proceedings of the 13th ASCE aerospace division conference and the 5th NASA/ASCE workshop on granular materials in Space exploration , 165–174. doi:10.1061/9780784412190.019
Susante, P. J. V., and Metzger, P. T. (2016). “Design, test, and simulation of lunar and mars landing pad soil stabilization built with in situ rock utilization,” in Earth and Space 2016: Engineering for Extreme Environments - Proceedings of the 15th Biennial International Conference on Engineering, Science, Construction, and Operations in Challenging Environments, 642–652. doi:10.1061/9780784479971.060
Swiney, G., and Hernandez, A. (2022). Lunar landings and operations policy analysis. Available at: https://www.nasa.gov/wp-content/uploads/2022/10/lunar_landing_and_operations_policy_analysis_final_report_24oct2022_tagged_0.pdf (Accessed September 30, 2022).
Taylor, L. A., Schmitt, H. H., Carrier, W. D., and Nakagawa, M. (2005). Lunar dust problem: from liability to asset. A Collect. Tech. Pap. - 1st Space Explor. Conf. Continuing Voyage Discov. 1, 71–78. doi:10.2514/6.2005-2510
Thangavelu, M., and Adhikari, P. (2017). MPIT: minimally processed ISRU technology structures for rapid extraterrestrial settlement infrastructure development, 5208. Orlando: AIAA SPACE and Astronautics Forum and Exposition.
Thompson, T. W., Pollack, J. B., Campbell, M. J., and O’leary, B. T. (1970). Radar maps of the Moon at 70-cm wavelength and their interpretation. Radio Sci. 5, 253–262. doi:10.1029/RS005i002p00253
Valantinas, A., and Schultz, P. H. (2020). The origin of neotectonics on the lunar nearside. Geology 48, 649–653. doi:10.1130/G47202.1
Walther, J., Johns, R. L., Kolvenbach, H., Bickel, V. T., and Hutter, M. (2023). Dataset for the paper: “autonomous construction of lunar infrastructure with in-situ boulders”. Available at: http://hdl.handle.net/20.500.11850/643602. doi:10.3929/ethz-b-000643602
Walther, J., Lim, J., Lawrance, N., and Siegwart, R. (2022). Topological path planning for information gathering in alpine environments, ETH Zurich, Autonomous Systems Lab. doi:10.3929/ETHZ-B-000559560
Wentworth, C. K. (1922). A scale of grade and class terms for clastic sediments, The Journal of Geology 30, 377–392. doi:10.1086/62291030
Yashar, M., Netti, V., Rajkumar, A., Morris, M., Pailes-Friedman, R., Elshanshoury, W., et al. (2021). “Project olympus: off-world additive construction for lunar surface infrastructure,” in 50th International Conference on Environmental Systems.
Keywords: Moon, ISRU, construction, boulder, dry stone wall, infrastructure, excavator, autonomous
Citation: Walther J, Johns RL, Kolvenbach H, Bickel VT and Hutter M (2024) Autonomous construction of lunar infrastructure with in-situ boulders. Front. Space Technol. 5:1345337. doi: 10.3389/frspt.2024.1345337
Received: 27 November 2023; Accepted: 02 April 2024;
Published: 06 June 2024.
Edited by:
Joseph N. Pelton, International Space University, United StatesReviewed by:
Madhu Thangavelu, University of Southern California, United StatesCopyright © 2024 Walther, Johns, Kolvenbach, Bickel and Hutter. This is an open-access article distributed under the terms of the Creative Commons Attribution License (CC BY). The use, distribution or reproduction in other forums is permitted, provided the original author(s) and the copyright owner(s) are credited and that the original publication in this journal is cited, in accordance with accepted academic practice. No use, distribution or reproduction is permitted which does not comply with these terms.
*Correspondence: Jonas Walther, am0ud2FsdGhlckBob3RtYWlsLmNvbQ==
Disclaimer: All claims expressed in this article are solely those of the authors and do not necessarily represent those of their affiliated organizations, or those of the publisher, the editors and the reviewers. Any product that may be evaluated in this article or claim that may be made by its manufacturer is not guaranteed or endorsed by the publisher.
Research integrity at Frontiers
Learn more about the work of our research integrity team to safeguard the quality of each article we publish.