 Stewart Sherrit1*
 Mircea Badescu1
 Aaron C. Noell1
 Florian Kehl1,2,3,4
 Maria F. Mora1Nathan J. Oborny1
 Jessica S. Creamer1
 Peter A. Willis1
- 1Jet Propulsion Laboratory, California Institute of Technology, Pasadena, CA, United States
- 2Innovation Cluster Space and Aviation (UZH Space Hub), Air Force Center, University of Zurich, Dübendorf, Switzerland
- 3Institute of Anatomy, Faculty of Medicine, University of Zurich, Zurich, Switzerland
- 4Institute of Medical Engineering, Space Biology Group, Lucerne University of Applied Sciences and Arts, Hergiswil, Switzerland
The search for life on other planetary bodies is driven by our quest to determine if Earth is unique with respect to harboring life. In order to answer this question, instrumentation with suitable sensitivity is required to measure biosignatures. In addition to accurate measurements by in-situ instruments, specialized sample acquisition and sample handling hardware is required to maximize the scientific information obtained from an acquired sample. This paper discusses a class of compact sample processing instrumentation using solid-state mechanisms that use acoustic waves to process samples prior to delivery to the instrument. Some of the acoustic sample processes that can be used to aid in preparation of liquid and liquid/solid mixtures include: mixing, milling, cavitating, lysing, heating, streaming, stirring, lofting, concentrating, segregating, and filtering. We will review these acoustic processes and show how they are generated using electromechanical systems. In addition to processing, these transduction systems could also use acoustics to interrogate physical properties such as the state of the sample, the acoustic velocity, and its attenuation. In order to generate these processes and sensing capabilities at these frequencies, a transduction mechanism is required to produce stress waves from electrical signals and vice versa. One commonly used technique is to use piezoelectric transducers that generate a stress that is linearly proportional to the voltage across the transducer and a voltage that is proportional to the stress on a transducer’s face. A variety of transducer modes are available to excite the sample, including thickness, transverse, radial, and shear extensional, and these can be used to build composite resonance structures including ultrasonic horns, tuning forks, bimorph, and unimorph benders to increase stress generated in the sample. We discuss how to model the acoustic interactions with the sample and the sample chamber in order to produce the required stress waves and illustrate the use of network models of piezoelectric transducers to accomplish this modeling. We demonstrate how to build up these models using Mason’s equivalent circuit for a piezoelectric and network models for acoustic layers in a design. Finally, to illustrate this acoustic processing ability, we will discuss a few systems that we have developed for sample handling systems for other planetary bodies like Mars and ocean worlds Enceladus and Europa.
Introduction
Searching for organics to understand the biotic and abiotic processes on rocky or icy worlds is a significant challenge for robotic planetary exploration (Willis et al., 2021). In order to take advantage of some of the most sensitive analytical instruments, including gas chromatography mass spectrometry (GCMS), or capillary electrophoresis with laser-induced fluorescence detection (CE-LIF) (Mahaffy et al., 2012; Willis et al., 2015; Mora et al., 2020), or even X-ray diffraction (Blake et al., 2012), the sample acquired via a sampling tool must first be processed in sample handling instrumentation before delivery to selected instrumentation for analysis. The issues associated with this processing are complicated by a variety of factors, including sample state, temperature, pressure, and local gravity. Table 1 outlines a variety of potential mission targets and the nominal local environment.
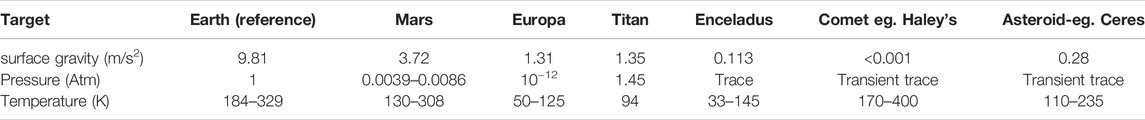
TABLE 1. Potential mission targets and the nominal local environment (Wikipedia 2022).
The wide range of sample types, including unconsolidated and consolidated solids and liquids, suggests a variety of different sampling devices/systems are required to acquire these samples. In addition, the sample handling systems could be open or closed systems with respect to the local environment, and the sample processing may introduce solvents or carry gases to aid in the movement heating and extraction of targeted chemical signatures.
A variety of mechanical processes are potentially important at the beginning of the sample handling chain, including transport, mixing, size selection (sieving), dissolution, and others. An issue common to all of these processes is the desire to avoid using mechanisms which can clog, cross-contaminate, or wear out easily from use. Therefore, “contact-free” approaches to generating a variety of mechanical processes are highly desirable, and acoustic approaches based on piezoelectric materials have proven themselves to be promising.
Acoustic Modelling
There are a variety of acoustic-driven processes that may be desired, including movements like mixing, stirring, streaming, convection, and fluidization (Yaralioglu et al., 2004; Sherrit et al., 2009; Blake et al., 2012; Catarino et al., 2014; Tang and Hu, 2015), heating (Yaralioglu, 2011; Sherrit et al., 2016) and diminution like milling, cavitation, and lysing (Taylor et al., 2001; Feng et al., 2002; Sherrit et al., 2004). There has been considerable work in acoustofluidics on the interaction of acoustics with fluids and particulates, including attenuation (Hahn and Dual, 2015), radiation forces on small particles (Bruus, 2012a), and resonance modes in fluidic channels (Bruus, 2012b).
Acoustic processing involves the generation of stress waves at known frequencies in a solid, liquid, gas, or mixtures to pressurize, move or heat the sample. Stress waves can be produced by a variety of means, including electromagnetic (Rueter and Morgenstern, 2014), electrostrictive (Cross et al., 1980; Sherrit et al., 1999a), magnetostrictive (Hom and Shankar, 1998) or more commonly by piezoelectric excitation (Berlincourt et al., 1964; Sherrit and Mukherjee, 2007). Piezoelectric materials are widely used in the generation of ultrasound because they are nominally linear, solid-state, have a large power density, and are relatively cheap. Various polymers (e.g., PVDF-TrFE) (Sherrit et al., 1996), ceramics lead zirconate titanate PZT, or Barium Titanate BaTiO3 (Berlincourt et al., 1964), and single crystal (quartz, lithium niobate) materials have significant piezoelectric activity. In addition, the use of piezoelectric materials has been demonstrated at temperatures from cryogenic (10 K) (Zhang et al., 2016) to very high temperatures as found on Venus (>750 K) (Sherrit et al., 2014).
For the majority of industrial applications, the most commonly used material is PZT, which is a family of poled ferroelectric ceramic materials that is used in a wide variety of applications from medical imaging (Powell et al., 1997) to ultrasonic welding (Tsujino et al., 1996) and a variety of space applications (Harkness and Lucas, 2012). Poled PZT has C6v symmetry (polycrystalline poled materials), and the number of constants can be reduced to five independent elastic constants, three independent piezoelectric constants, and two independent dielectric constants. For details on the specific modes and the constants that define them and examples of full reduced matrices, including loss, see (Sherrit and Mukherjee, 2007; Sherrit et al., 2011).
Three common modes of excitation of the bulk PZT material are shown in Figure 1. The thickness and length modes have a surface displacement that is parallel to the electric field on the piezoelectric disk, bar, or plate. If one applies an AC electric voltage V across the electrodes, then the AC displacement of the surface is proportional to the product of the voltage applied and the appropriate piezoelectric coefficient for the mode, inducing vibration at the same frequency as the applied voltage. In the lateral or transverse mode, the displacement is perpendicular to the applied field, while in the shear mode, the surfaces of the electrodes displace in the opposite transverse direction to the applied field. At high frequencies, piezoelectric ultrasonic excitation by transducers similar to those shown in Figure 1 is feasible and can create a high-power density due to the increase in power with frequency. However, at lower frequencies, the displacements of the piezoelectric surfaces are too limited to radiate higher power. PZT has a significant energy density due to the considerable stress it produces. However, the strain it produces is limited without the design of actuators to amplify the strain.
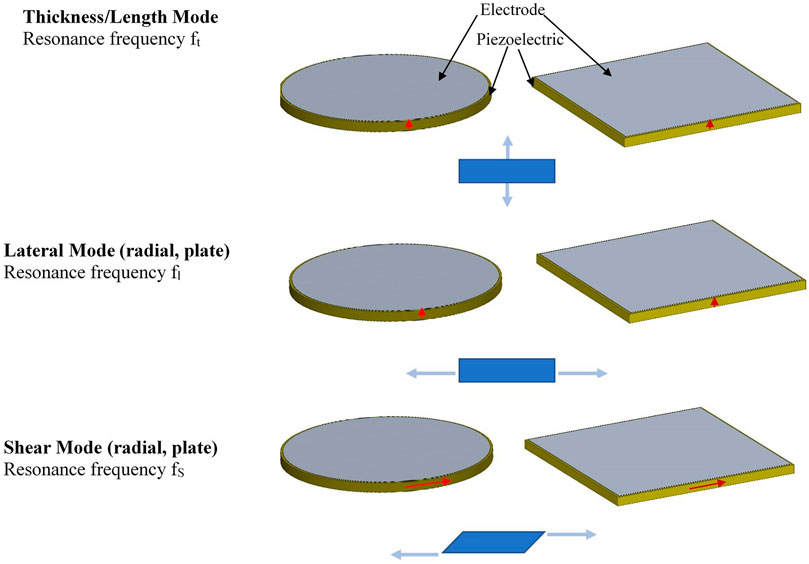
FIGURE 1. Three common modes of resonance of piezoelectric plates. The red arrows show the direction of the poling with respect to the top and bottom electrodes. The thickness and lateral mode transducer have the poling perpendicular to the electrode area. The motions are shown in the blue cross sections for a voltage across the bottom and top electrode. Under opposite voltages the motions would reverse and alternating voltages would generate expansions and contractions depending on the sign of the voltage.
One way to overcome this limitation is to build actuators to match the acoustic impedance of the material to increase the energy and power density in the material to be processed. This typically involves a tradeoff of force for stroke. A variety of common actuators that increase the stroke of the piezoelectric material are shown in Figure 2. The bimorph and unimorph are bending modes that produce dome shape displacements. The motions are shown with the blue arrows. There are three types of stroke amplification for a given voltage. Stacking layers creates a stroke amplification proportional to the number of layers (n). Resonance amplification creates an amplification at the resonance frequency that is proportional to the mechanical Q of the actuator. The mechanical Q of an actuator is inversely proportional to the loss or damping (McSkimmin and Mason, 1964). The larger the Q the larger the strain wave build up at resonance in the actuator. Finally, there are geometric amplifications due to the angle of the flextensional, the area ratio of the horn tip to the base, the actuation position along the length of the tuning fork, or thickness to width of the bimorph and unimorph.
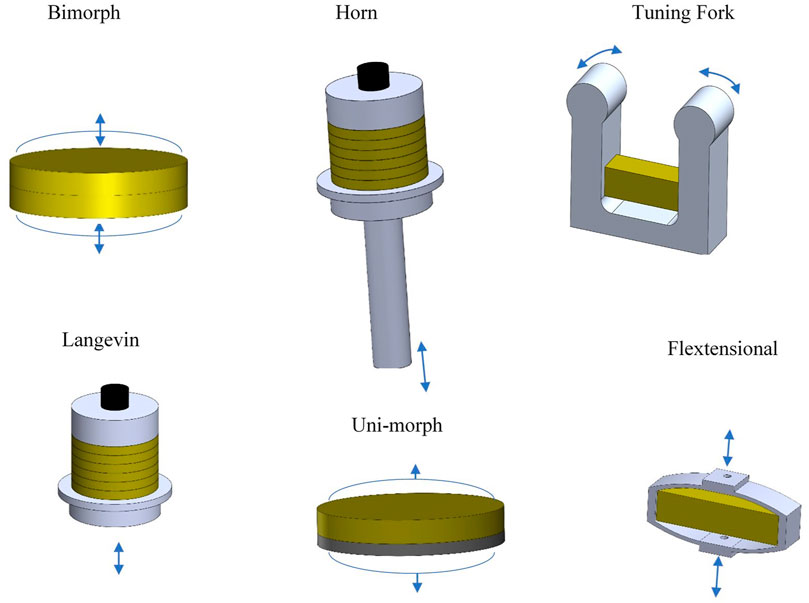
FIGURE 2. Common actuator designs used to amplify the stroke of a piezoelectric material.
Network modeling to determine the acoustic output (generated pressure amplitudes) for electrical input for the actuation modes shown in Figure 1 has been published for lossless (Mason, 1935; Berlincourt et al., 1964) and lossy structures (Sherrit et al., 1999c; Sherrit et al., 2020). In addition, many of the common actuator geometries shown in Figure 2 have a network equivalent, including the stepped horn and Langevin transducer (Sherrit et al., 1999b; Al-Budairi et al., 2013), Flextensionals (Sherrit et al., 2010; Tajdari et al., 2020), Bimorphs [Ballato and Smits, 1991, Unimorphs (Smyth and Kim, 2015), and tuning forks (Stuart-Watson, 2006).
One of the most common modes of actuation for fluidics is the thickness mode transducer. Mason’s Network model for the thickness mode is shown in Figure 3. In this model there is an electrical port corresponding to the electroded surfaces of the piezoelectric plate and two acoustic ports corresponding to each plate surface. An application of a voltage on the electrical port produces mechanical stress/force on the acoustic ports which causes these surfaces to move. The conversion of the electrical voltage to a mechanical force/stress is accomplished via the transformer. Typically, one adds acoustic layers to the acoustic ports of the piezoelectric to model the stress and velocity of these layers. On the electrical side of the transformer the circuit is treated as a normal electrical circuit. On the acoustic side of the transformer the impedance is the acoustic impedance and force is analogous to a voltage and a surface velocity is analogous to the current. For specific details and examples of transducer design ((Sherrit et al., 1999b; Sherrit et al., 1999c; Sherrit et al., 2020).
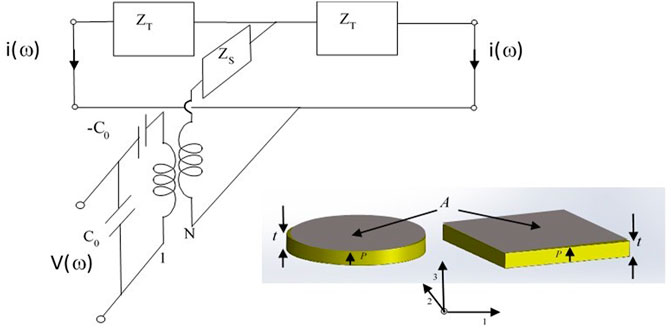
FIGURE 3. The Mason’s equivalent circuit network model for free standing piezoelectric plates with the poling axes as shown in the inset. The electrical voltage is converted to force across an ideal electromechanical transform with turns ratio N. On the electrical side of the transformer, voltage and currents are electrical variables. On the acoustic side, voltages are forces and currents are velocities of surfaces. The model shown is for a free resonator and the acoustic ports are shorted which represents an unclamped/stress-free surface.
The functions
When using network models to represent layered structures, we attach a network representation as shown in Figure 4 for each layer. The network model for the layer is the solution to the wave equation for the layer with open boundary conditions in the frequency domain. When combining the network equivalent and the layer at the surface of the acoustic port, we ensure stress continuity across the interface. In Figure 4, we show a model for a layer with a free surface (short circuit on right port) being driven by an oscillatory force or velocity and an acoustic layer that is clamped (open circuit on right port) that generates a force on the clamping structure.
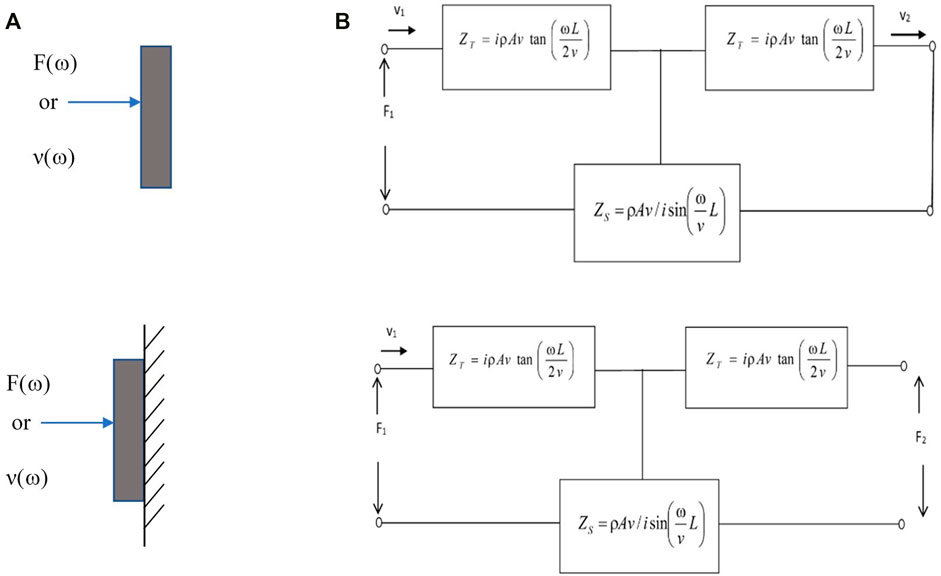
FIGURE 4. The network equivalent of a layer with free surface (A) and clamped surface (B) on the right acoustic port. The left acoustic port is driven by a force F(ω) or a velocity v(ω). The plate velocity of sound is v, and ρ is the density of the layer. The area of the layer is A and the thickness of the layer is L.
These models are very useful for calculating the impedance spectra of the mounted transducer. The dissipated power in these models represents the power delivered by the amplifier to account for electrical and mechanical power dissipated. They can also be used to calculate the force or pressure at a layer surface, the layer surface velocity, and the acoustic power delivered to the load. It should be noted that the use of solid-state actuation techniques rather than motorized mechanisms is not without costs. Because the design is integrated into structures, care has to be taken to ensure that any further structural modifications in the existing hardware do not shift nodal planes, or resonance peaks and do not dampen resonances as these changes could considerably degrade performance.
Examples of Acoustic Processing of Samples
CheMin Powder Fluidization and Circulation
Mars Science Laboratory (MSL) Curiosity rover has two major instruments (SAM—Mahaffy et al., 2012, CheMin—Blake et al., 2012) that required the ingestion of rock powder samples from the sample acquisition system (Jandura et al., 2010). Both of these instruments have funnels which incorporated vibrators to fluidize the sample received from the acquisition system and allow for delivery to the instrument test cells. A funnel mechanism with three flextensional actuators was designed at JPL (Sherrit et al., 2009) to vibrate the funnel and fluidize the rock powder, as shown in Figure 5. The flextensional actuator free resonances were isolated with little sideband coupling. However, when mounted to the funnel, many resonance peaks were visible due to the coupling to the funnel structure. The funnel structure has longitudinal, barrel, radial, and ring modes which can be excited. The funnel vibrators each had strong resonances in the 10–12 kHz frequency range, which fluidized rock powder when mounted on the hexapod ring. The impedance spectra showed multiple resonances and mode coupling over the frequency range from 1 to 30 kHz. However, the 10–12 kHz frequency range was found to excite the funnel walls and screen and fluidized the powder sufficiently to allow the powder to flow. In the cross-contamination testing, they were driven with a 7 V peak signal with a frequency sweep of 11–12 kHz over 5 s for a total of 300 s. Testing demonstrated that cross-contamination of different samples after multiple uses was less than 1% after 10 rock powder (quartz, corundum) drops. The powder was fluidized and flowed into a tube at the bottom of the funnel.
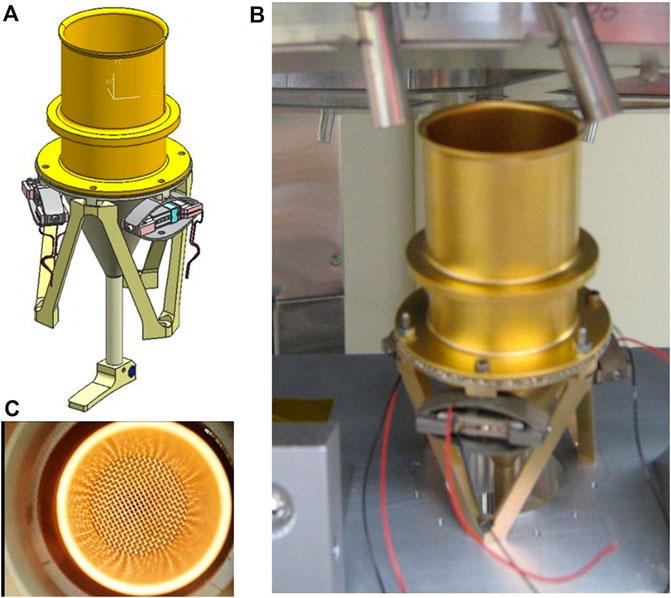
FIGURE 5. The CheMin inlet funnel (A) solid model (B) photograph of CheMin funnel with three flextensional actuators at 120o in test chamber for cross contamination testing and (C) photograph of the inside of the funnel showing a top view of the frustum shaped screen.
The CheMin X-ray diffraction (XRD) and X-ray fluorescence (XRF) instrument on the Curiosity rover can accurately identify mineralogical X-ray spectra for powdered rock samples sieved to 150 microns. In order to accomplish this, the sample must be delivered to the CheMin sample cells located on the CheMin sample wheel. For CheMin analysis, prior to dropping the sample into the funnel, a CheMin sample cell shown in Figure 6 was aligned with the tube outlet (Blake et al., 2012; Sarrazin and Blake, 2006). There are 16 tuning fork sample cells on a wheel inside the CheMin instrument and 32 sample cells with windows (8 mm Dia.). Some of the cells are sealed (HEPA filter) containing standard samples for instrument calibrations and checks. The sample cells are a tuning fork actuator design (Mechanical Q 200–300) driven by a piezoelectric stack. The resonance frequency can be roughly predicted by the tuning fork equation (Rossing et al., 1992).
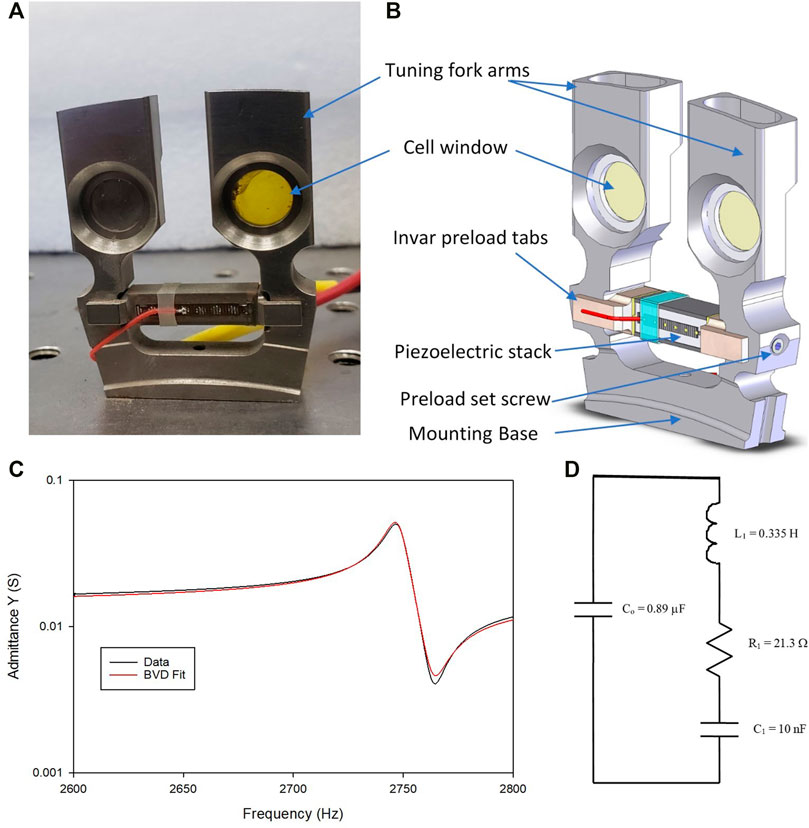
FIGURE 6. The CheMin sample test cells for vibrating the geological powdered sample while undergoing X-ray diffraction analysis (A). An early prototype with left window filled with sieved powder (lunar simulant JSC1) (B) solid model of a later sample cell. The admittance spectra for an original prototype (C) and a fit using the Butterworth Van Dyke circuit model (D).
The piezoelectric stack is driven at the tuning fork resonance during all three stages: filling, analysis, and dumping of the sample (in order to reuse the test cell). During analysis, the vibrations of the forks create convection patterns in the powder in the window which deliver sample grains in random orientations into the volume exposed to the X-ray beam (≈70 μm diameter) which maximizes the number of crystal faces interrogated by the beam for a given sample volume (10 mm3). Due to potential segregation of the sample due to particle size and density, a higher amplitude mode can be excited to remix the sample during analysis. Figure 6 shows an early prototype of the sample cell with stiffer tuning forks, longer piezoelectric stacks (PI PICMA P-885.51 stacks). The tuning fork was softened via a notch near the base, and Invar endcaps with a ball/set screw mount were used to preload the piezoelectric stack. The resonance spectra and fit using the Butterworth Van Dyke (BVD) circuit model (Sherrit et al., 1997; IEEE Standard on Piezoelectricity, (1987), IEEE/ANSI Std-76) are also shown. The BVD circuit is useful for determining a variety of properties of the resonance and for designing drive circuitry for the actuator as the circuit approximates the electrical impedance of the actuator around resonance. The relatively high Q allowed the system to be incorporated into an oscillator circuit for hardware resonance frequency tracking and produced circulation patterns in the powder at power levels of a few watts or less. Both the CheMin funnel vibrators and sample cells have been tested successfully on the Curiosity rover on Mars, and (Bish et al., 2014) attributed the success of handling finely powdered samples remotely on the use of the unique powder vibration approach (Sarrazin and Blake, 2006).
Astrobionibbler- Acoustic Mixing and Heating
The Astrobionibbler task was a microfluidic SubCritical Water Extraction (SCWE) instrument developed at JPL to extract amino acids from rock powder for laser-induced fluorescence detection and quantification (Sherrit et al., 2016; Sherrit et al., 2017; Noell et al., 2018). The microfluidic handling is composed of two major systems.
The two systems are an acoustic mixing chamber for producing a slurry of soil sample and solvent (water), and a subcritical water extraction chamber where the slurry is then heated to ≤200°C using attenuation of ultrasonic waves. The mixing chamber is shown in Figure 7A, which is assembled using a 17.9 mm OD quartz tube 25.4 mm long embedded in a piezoelectric nebulizer transducer (APC Ceramics #50-1013, f = 1.65 MHz) and fastened together using an aluminum cap and screws. The acoustic mixing is initiated by supplying up to 48 V AC signal to the nebulizer board (APC #1011) rectifying circuit, or as was operated in this case, up to 48 V DC (typically 25–30 V) at the outlet of the rectifier circuit (Gwinstek GPD–3303S DC power supply). The top picture in the figure shows the unmixed sample and then the sample/solvent after acoustic mixing for 10 s. The bottom picture on the left shows a schematic of the transducer model. The plot on the bottom right shows the measured admittance for the mixing chamber and the admittance calculated using Mason’s network equivalent for the piezoelectric disk and a 1.8 cm long slug of water. It is interesting to note that from the data one can calculate the velocity of sound in the sample by calculating the comb frequency which is the equally space resonance frequencies in the water column. The resonance of the piezoelectric disk is at about 1.7 MHz. The resonance in the water occurs when the height of the water is nλn/2. Each of the peaks of the comb represent a λ/2 resonance in the fluid sample. The average comb frequency (14 resonances between 1.34 and 1.9 MHz) is about 40 kHz (560,000/14 Hz) which gives a velocity of sound in the water as v = λf = 2df = 2 × 0.018 m × 40,000 Hz = 1440 m/s.
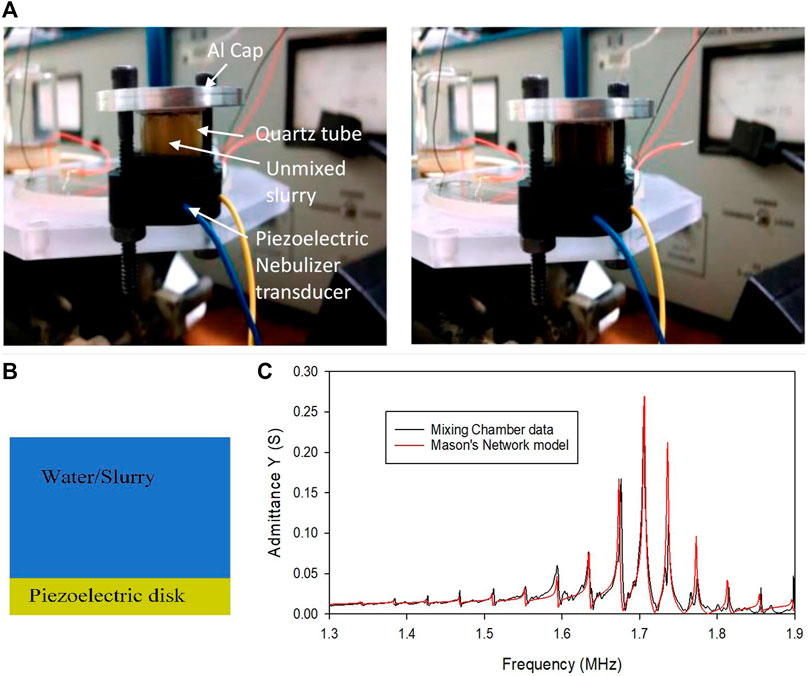
FIGURE 7. (A) Mixing chamber showing the demonstration of mixing. The left figure shows solution prior to mixing while the right photograph is after acoustic mixing for 10 s. The (B) figure shows a schematic of the system. The system can be modeled with a network model for a piezoelectric disk in the thickness mode and an acoustic layer of water. The measured electrical admittance the electrical admittance from the model for the chamber with 1.8 cm height of water is shown in the graph on the (C). For details of mixing results, see (Sherrit et al., 2017).
The SubCritical Water Extraction (SCWE) chamber was designed in borosilicate wafer that was capped with a borosilicate plate. The slurry in the chamber was heated using high-frequency ultrasonic excitation. A schematic of the transducer and a network model of the ultrasonic heating circuit is shown in Figure 8, along with an early version of the SCWE setup and a close-up of the SCWE chamber and top thermocouple. The resonance frequency of the free piezoelectric disk was 1.65 MHz. On assembly, a variety of resonances were apparent in the impedance spectra and the model. Some of these resonances are associated with the acoustics of the composite SCWE structure and likely coupled radial modes associated with the piezoelectric disk or chamber. These are not all thickness extensional modes and some of these resonances will not be present in the model as the network model does not consider mode conversion (Sherrit et al., 2016). It should be noted that increasing the temperature of the water to 200°C in a closed container produces considerable stresses due to the thermal expansion and incompressibility of water. In the current designs, we have injected a gas bubble (as visible in Figure 8) to act as an expansion volume and to force the pressure to be in equilibrium with the vapor pressure.
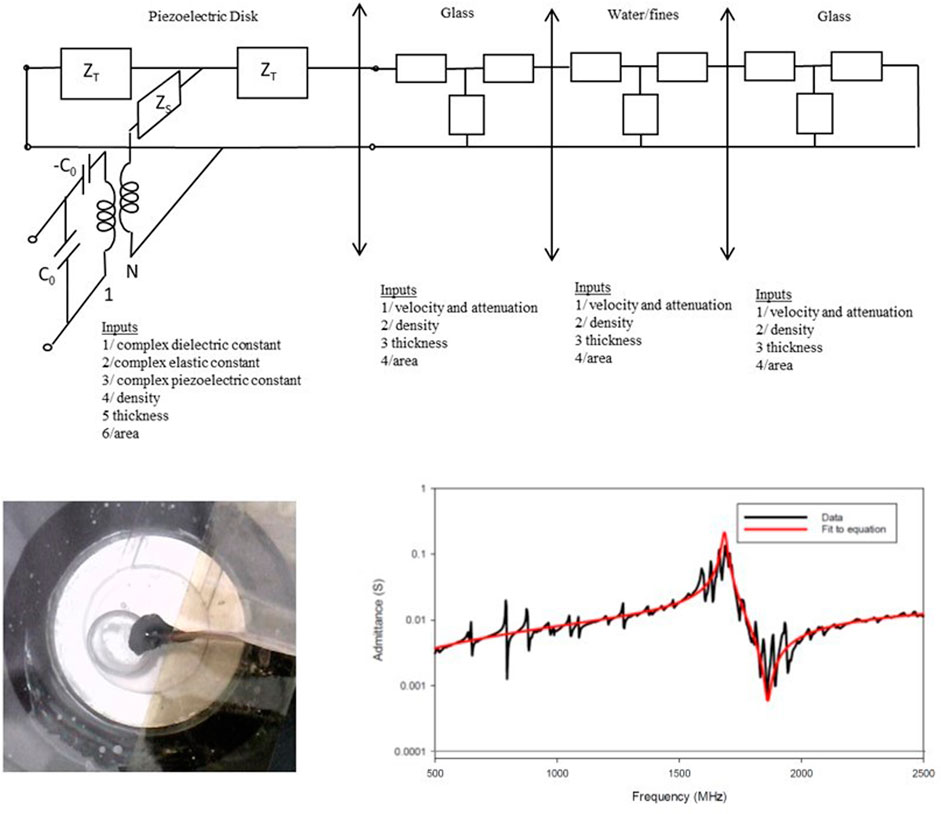
FIGURE 8. A Schematic of the ultrasonic heating and the network model used to model it along with the input constants required to model the system for each layer (top). An early version of the microfluidic SCWE chamber with bubble on the chip and the measured admittance spectra along with a fit. The red curve can be generated with a BVD circuit and constants as shown in Figure 6. with C0 = 1.075 nF, C1 = 0.239 nF, L1 = 37.3 μH, R1 = 4.90 Ω (Sherrit et al., 2016 for full model results).
The piezoelectric disk (APC disk # 50-1014) was initially driven by the nebulizer circuit at 1.65 MHz, and significant heating was generated. However, in order to study the various heating regimes, we used a Sony Function generator (AFG 320) and an ENI power amplifier (A150 RF –0.3–35 MHz) to drive the piezoelectric at frequencies other than the free piezoelectric resonance. The piezoelectric excitation demonstrated heating the SCWE chamber up to 200°C for 2000 s. The rate of heat rise initially was >2°C/s which decreased to about 0.2°C/s at 200°C. For more details, see (Sherrit et al., 2016; Sherrit et al., 2017). The extraction yield of the microfluidic SCWE chip process ranged from 50% compared to acid hydrolysis and 80–100% compared to a benchtop microwave SCWE for low biomass samples (Noell et al., 2018).
Ocean Worlds Life Surveyor Acoustic Mixing/Cavitation Transducer
The Ocean Worlds Life Surveyor (OWLS) extractor unit, currently under development at JPL, is a sophisticated sample processing system that accepts solid/liquid samples and prepares them for downstream analysis. A single chamber is capable of multiple operational modes. In one mode, gentle mechanical mixing and coarse (<40 µm) filtering is enabled to prepare samples for microscopy analysis. The other mode, similar to the Astrobionibbler just discussed, enables SCWE at 200°C to allow digestion of both whole cells and macromolecules to enable sensitive chemical detection. A solid model rendering of a prototype of the OWLS extractor test chamber is shown in Figure 9.
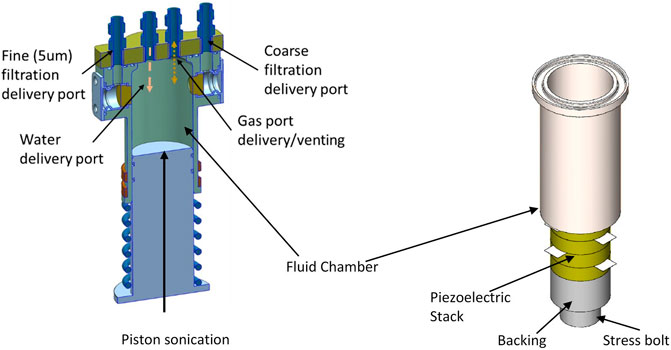
FIGURE 9. Schematic of the OWLS extraction sample processing cell unit showing the position of the bottom excitation and a solid model of a test bed to study the mixing and cavitation.
It is well known that sonication can be used for cell lysis (Fykse et al., 2003; Borthwick et al., 2005), and so this enhancement for chemical analysis preparation was desired when designing the OWLS extractor. The enhancement can improve the overall efficiency of extraction by “prelysing” cells present ahead of hydrolysis via SCWE. In addition, sonication/cavitation adds an additional control in the extraction process, allowing more careful discrimination of intracellular compounds released only via lysis, as opposed to larger structural molecules broken down via SCWE.
In order to investigate the production of high-power ultrasound for the OWLS extractor, a testbed was developed to study the mixing and cavitation in a similar volume envelope. The testbed is shown on the right in Figure 9.
To produce cavitation, it is required to drive the piezoelectric stack at relatively high power (1–10 W). To ensure the piezoelectric elements do not experience tension at resonance, the piezoelectric elements have to be pre-stressed to 20 MPa using a stress bolt. In order to reduce the drive voltage to levels that can be supported by the instrument bus, the effects of using thinner piezoelectric elements also had to be investigated. To test this approach, the chamber was designed and assembled as shown in Figure 9, and the device was modeled with Mason’s equivalent circuit shown in Figure 10. The chamber is stainless steel, and the material constants used to model this configuration are shown in Table 2. It should be noted that nominal material constants produced resonance curves similar to the data, and some of the material properties were adjusted to produce a better match between resonance and antiresonance frequencies in the data. One dimensional transducer models as discussed here are useful in determining whether one can generate a stress wave in the frequency range and with appropriate amplitude for a given voltage amplitude. The closer the device is to a layered structure the better the model will match the data for the transducer. Nominal values of piezoelectric material coefficients quoted by piezoelectric materials suppliers usually are quoted to ±10% or higher. Additionally, dielectric and piezoelectric data are measured at lower frequencies and these coefficients will decrease with increasing frequency. The addition of layers which are not modelled like epoxy bonds and electrodes and non-ideal geometries can produce discrepancies that can sometimes be accounted for by adjusting coefficients. In order to match the model to the transducer both the antiresonance and the resonance frequency should align to insure the coupling of the transducer and model matches. In addition, the amplitude of the impedance will be higher than the impedance produced by the model due to other damping mechanisms, including electrodes and epoxies used during assembly, which were also not accounted for. This means the resistance at resonance of the device will be larger, and the adjustments to the materials coefficients are used to account for excluding these effects.
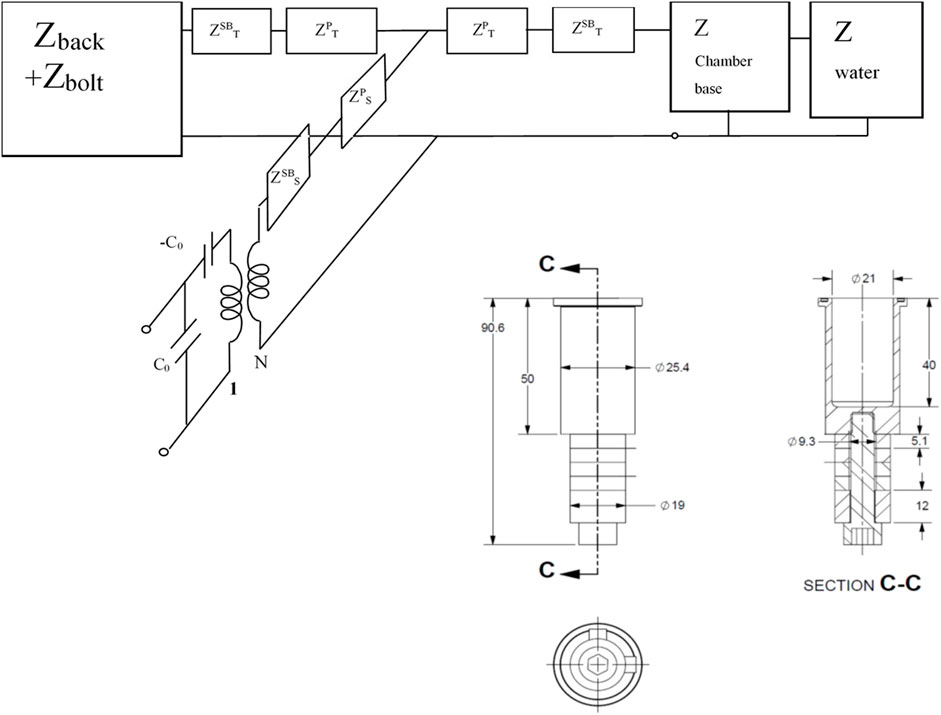
FIGURE 10. Network equivalent circuit (A) of the sonication chamber (B). The dimensions are in mm. The block impedance for the base, and the water is a T-network as shown in Figure 4.
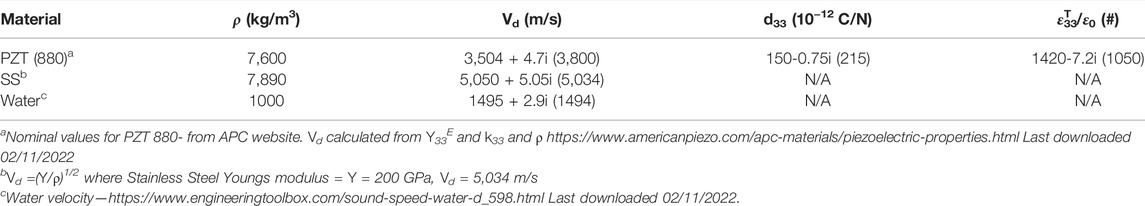
TABLE 2. Material constants used to model the piston sonication design adjusted from nominal values in brackets. Imaginary components adjusted to fit data.
The device was assembled, the impedance spectra for the chamber with water were measured, and the spectra plotted vs. the model. The admittance Y from the testbed (data) is shown in Figure 11 along with the admittance for the model with the parameters in Table 2. The resonance frequency and the anti-resonance frequency were 38.1 and 40.7 kHz respectively which corresponds to an electromechanical coupling factor k = 0.30. The measured Q with water in the chamber was Q = 142. The longitudinal resonances in the chamber sidewall were not modeled since they are in parallel to the water and are only weekly coupled through shearing at the water interface. A second larger resonance (35 kHz) in the data is seen below the primary resonance which may be associated with a coupled radial breathing mode (radius of chamber expands and contracts) of the chamber sidewalls but this mode coupling to other modes is not modeled in these simple network models. The measured admittance curves with the water show good agreement with the model shown in Figure 10 with the adjusted coefficients shown in Table 2. In the measured data, there are small sideband resonances below the primary resonance that are associated with other modes not modeled in Mason’s equivalent circuit (Mason, 1935). The OWLS bottom/piston sonication system was connected to a function generator (Tektronix AFG320) and amplifier (ENI 1140LA) and driven at the primary resonance frequency, and the voltage and current were monitored on an oscilloscope. The voltage, current, and power for a 46 V peak voltage were 0.2 A and 4.6 W. The BVD constants for the chamber resonances with water are Co = 1.53 nF, C1 = 0.114 nF, L1 = 0.144 H and the R at anti-resonance R1a = 164 Ω. Each resonance has a best fit for the impedance. To get a better fit at resonance, the BVD circuit was fitted at resonance to determine Rg = 1/Gmax = 220 Ω.
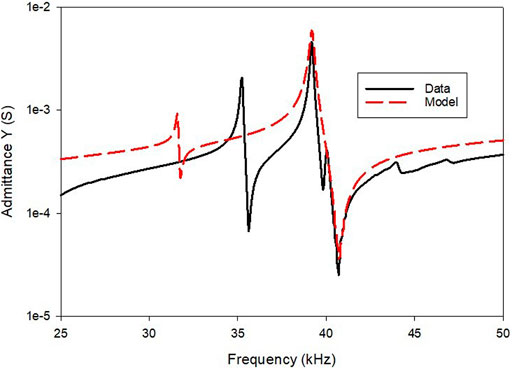
FIGURE 11. The admittance spectra data and for the model using the parameters shown in Table 2. The data in Table 2 was adjusted from nominal values to produce a good fit to the major resonance using the model in Figure 9.
In order to test the mixing, three particulate samples (Miapoxy 64 and 65 and JSC1 a lunar simulant) were placed in the chamber with distilled water and drove the sonication system at 48 V and 39 kHz. The photographs in Figure 12 show the samples as deposited (top row) and after activation. The Miapoxy samples were less dense than water and floated on the surface, and displayed circulation on the surface when activated. Miapoxy ceramic spheres showed dispersion after mixing, while the Miapoxy 65 borosilicate spheres displayed clumping with circulation and some breakage of the clumps on activation. The lunar simulant JSC1 showed volumetric mixing and lofting during activation and settling after powering off the sonication chamber.
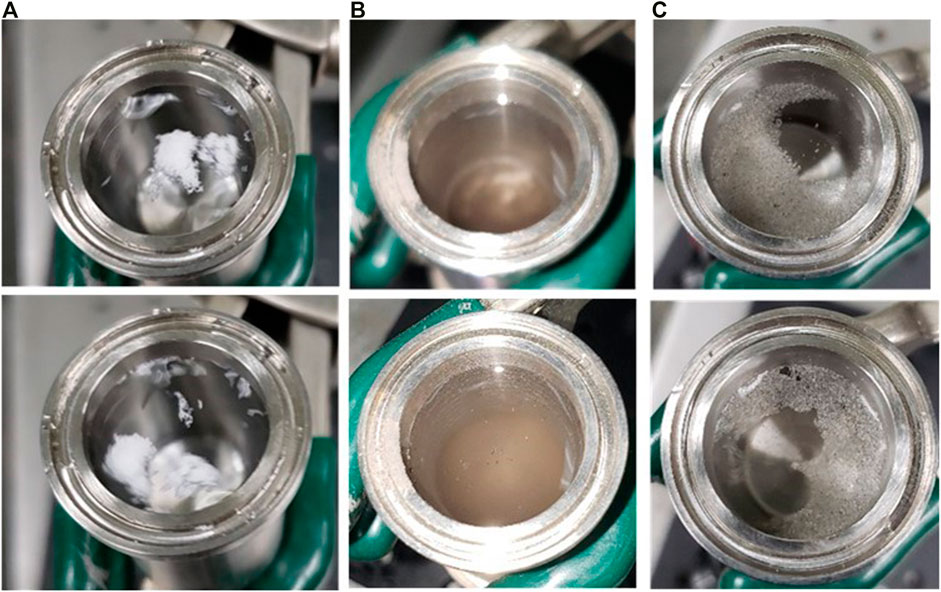
FIGURE 12. Photographs of mixing for three different materials as deposited and after activation. Miapoxy 65 borosilicate hollow glass spheres showed clumping and surface circulation when sonication system driven at resonance (A). JSC1 lunar simulant (B) showed mixing/lofting similar to Figure 7 when activated. Miapoxy 64 ceramic hollow glass spheres showed dispersion and surface circulation when sonication system driven at resonance (C).
In order to test cavitation, we compared the OWLS sonication testbed to a commercial ultrasonic cleaner (Cole Parmer 8891 ultrasonic cleaner) which was used on previous studies to produce cavitation. The ultrasonic cleaner tank was filled to its recommended level with distilled water and a 100 ml beaker with distilled water was inserted into the water in the tank. It was apparent from the signature “hissing” sound that both the desktop ultrasonic cleaner and the OWLS sonication testbed discussed above were producing cavitation. In order to test the cavitation, we cut a small piece of aluminum foil and placed it under a microscope to photograph the surface. We then cut identical foils and placed them in a desktop ultrasonic cleaning system (Cole Parmer 8891 ultrasonic cleaner in a 100 ml beaker) and in the OWLS sonication chamber developed at JPL. The surface of aluminum foil before sonication under a microscope (left) after sonication (≈100 W) in an ultrasonic cleaner for 25 min (middle) and after sonication in the test chamber (≈4 W) for 25 min are shown in Figure 13. The degree of cavitation in the testbed is comparable to the cavitation that is produced in the benchtop system.
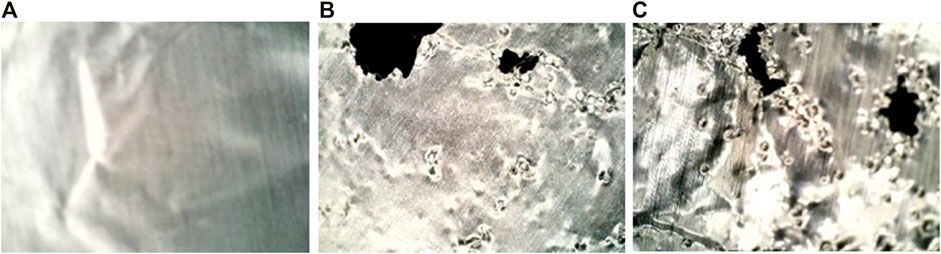
FIGURE 13. The surface of Aluminum foil before sonication under a microscope (A) after sonication in an ultrasonic cleaner for 25 min (B) and after sonication in the test chamber for 25 min (C).
The results of this testbed are currently being used to redesign a sonication/cavitation transducer in the piston of the OWLS extractor using thinner piezoelectric rings that can be driven at 24 V amplitude.
Summary
This paper discusses a class of compact sample processing instrumentation which are solid-state and based on acoustics to process samples prior to delivery to the instrument. Solid-state actuation has been shown to be advantageous due to the lack of macroscopic moving parts as is found in motorized mechanisms. This simplifies the mechanism and reduces the need for lubricants, gearing, and complex electronics, and allows for low-profile surfaces that are easier to rinse and clean and reduce sample to sample contamination. In addition, solid-state actuation has the potential advantage for increased life if designed to be driven below fatigue limits. Common modes of excitation of piezoelectric ceramics were presented, including longitudinal, transverse, and shear excitation of the piezoelectric plates. At high frequencies, these plate transducers can deliver significant power however, as the frequency drops, the ability to transfer acoustic power to the sample decreases.
In order to accommodate for the limited stroke and power delivery of piezoelectric plates at low frequency a variety of impedance matching actuators including: ultrasonic horns, tuning forks, bimorph, and unimorph benders were presented. These devices amplified the stroke of the piezoelectric to produce larger stresses and power delivery to the sample at the resonance frequency of the actuator.
In order to design efficient transduction mechanisms, the initial step is to use Mason’s network model (Mason 1935; Berlincourt et al., 1964). This model allows for determination of the electrical behavior of the transducer and the transformation via the piezoelectric effect of the electrical drive signal to the stress wave at the same frequency. In the simplest systems, the model combines network models for acoustic layers and a piezoelectric network element and can be used to determine the electrical impedance of the system. It can also be used to determine the stress and acoustic power delivered to the sample in the system. The model for the most common mode, the Thickness Extensional (TE) (Figure 3), was presented along with the network model for passive elastic acoustic layers (Figure 4) and the constants of the model in terms of material coefficients were defined in the section on Acoustic Modeling. The modeling and constants used for other modes and actuators were discussed, and references to these models presented.
We then presented some examples of acoustic processing that has been done in the past at JPL, including systems to prepare drilling fines, lofting, fluidizing and mixing or stirring as was demonstrated on the inlet funnel and sample cells of the CheMin instrument. In liquid, and liquid/solid mixtures we demonstrated mixing, heating, streaming, and lofting on the Astrobionibbler system. On the OWLS sonication testbed we demonstrated mixing and cavitation to break cell walls (lysing). We showed how these acoustic processes are designed and how the acoustic forces are generated using electromechanical systems. The fluidization and mixing of solid particulate were demonstrated on CheMin instrument at frequencies between 2 and 12 kHz. Systems to produce cavitation as demonstrated on the OWLS sonication testbed were in the 20–60 kHz range, while systems to mix, loft, and stream could be produced in the 40kHz–2 MHz frequency range as was demonstrated in the OWLS sonication testbed and Astrobionibbler instrument. Heating of slurries of solvent and powder was found to be more efficient in the 500 kHz to 2 MHz frequency range as was demonstrated on the Astrobionibbler instrument.
A model for a small cavitation testbed for the OWLS extractor was developed, and a sonication device was fabricated and tested. The tests demonstrated both acoustic mixing and cavitation at 4–5 W range of electrical power with no moving parts. We modeled the piezoelectric layers, backing, front layer, stress bolt, and water and determined the resonance and antiresonance frequencies for the actuator with water. We used the data to determine the BVD circuit parameters for the primary resonance to allow for modeling of the drive circuitry and model the drive frequency and admittance. The demonstrated cavitation at power levels of 4 W has given confidence that we can design the Langevin transducer in the piston of the OWLS extractor instrument. The new piston design is currently being fabricated.
Conclusion
The use of acoustics to manipulate and process samples was demonstrated in a variety of systems that demonstrated low complexity sample processing that can be incorporated in a variety of fluidic systems for sample processing in space. Acoustic processing in these systems was demonstrated using piezoelectric actuators, which enabled novel solutions to sample processing which are compact, low profile, solid-state, low power, and low mass. These included two systems for rock powder fluidization and circulation which are currently operating on the Curiosity rover on Mars. In situ processing in space is made more complex by the wide range of environmental conditions under which the processing needs to occur. Piezoelectric materials were shown to offer unique solutions to many of the sample processing requirements. In addition, these actuators have been shown to be operational over a large range of temperatures and pressures, which makes them compatible with many future mission environments, including missions to Ocean Worlds like Enceladus and Europa, where the temperatures and pressures would produce challenges for conventional mechanisms based on motors. Although these piezoelectric solid-state actuators offer many advantages over other actuator mechanisms it should be noted that the actuator is typically a resonant structure that is integrated into hardware and care has to be taken to ensure that any further modifications to any of the structure of the existing hardware do not shift nodal planes, resonance peaks or does not dampen resonance since each of these could reduce performance considerably.
Data Availability Statement
The original contributions presented in the study are included in the article/supplementary material, further inquiries can be directed to the corresponding author.
Author Contributions
SS, MB, AN, and FK took part in writing the paper with the level of the contributions in the order shown. SS modeled the various transducers prior to fabrication, testing, and assembly. SS and MB designed and assembled the OWLS extractor testbed. MM and PW conceived the need for the OWLS sonication system. MM, JC, NO, and PW defined the requirements for the sonication in the OWLS testbed. All authors took part in discussions, reviews, and editing of the paper.
Funding
Research reported in this manuscript was conducted at the Jet Propulsion Laboratory (JPL), California Institute of Technology, under a contract with National Aeronautics Space Administration (NASA) (80NM0018D0004). Reference herein to any specific commercial product, process, or service by trade name, trademark, manufacturer, or otherwise, does not constitute or imply its endorsement by the United States Government or the Jet Propulsion Laboratory, California Institute of Technology.
Conflict of Interest
The authors declare that the research was conducted in the absence of any commercial or financial relationships that could be construed as a potential conflict of interest.
Publisher’s Note
All claims expressed in this article are solely those of the authors and do not necessarily represent those of their affiliated organizations, or those of the publisher, the editors and the reviewers. Any product that may be evaluated in this article, or claim that may be made by its manufacturer, is not guaranteed or endorsed by the publisher.
References
Al-Budairi, H., Lucas, M., and Harkness, P. (2013). A Design Approach for Longitudinal-Torsional Ultrasonic Transducers. Sensors Actuators A: Phys. 198, 99–106. doi:10.1016/j.sna.2013.04.024
Ballato, A., and Smits, J. G. (1991). Network Representation for Piezoelectric Bimorphs. IEEE Trans. Ultrason. Ferroelect., Freq. Contr. 38 (6), 595–602. doi:10.1109/58.108858
Berlincourt, D. A., Curran, D. R., and Jaffe, H. (1964). Piezoelectric and Piezomagnetic Materials and Their Function in Transducers. Phys. Acoust. Principles Methods 1, 169–270. doi:10.1016/b978-1-4832-2857-0.50009-5
Bish, D., Blake, D., Vaniman, D., Sarrazin, P., Bristow, T., Achilles, C., et al. (2014). The First X-ray Diffraction Measurements on Mars. Int. Union Crystallogr. J. 1 (6), 514–522. doi:10.1107/s2052252514021150
Blake, D., Vaniman, D., Achilles, C., Anderson, R., Bish, D., Bristow, T., et al. (2012). Characterization and Calibration of the CheMin Mineralogical Instrument on Mars Science Laboratory. Space Sci. Rev. 170 (1-4), 341–399. doi:10.1007/978-1-4614-6339-9_12
Borthwick, K. A. J., Coakley, W. T., McDonnell, M. B., Nowotny, H., Benes, E., and Gröschl, M. (2005). Development of a Novel Compact Sonicator for Cell Disruption. J. Microbiol. Methods 60 (2), 207–216. doi:10.1016/j.mimet.2004.09.012
Bruus, H. (2012a). Acoustofluidics 7: The Acoustic Radiation Force on Small Particles. Lab. Chip 12 (6), 1014–1021. doi:10.1039/c2lc21068a
Bruus, H. (2012b). Acoustofluidics 2: Perturbation Theory and Ultrasound Resonance Modes. Lab. Chip 12 (1), 20–28. doi:10.1039/c1lc20770a
Catarino, S. O., Silva, L. R., Mendes, P. M., Miranda, J. M., Lanceros-Mendez, S., and Minas, G. (2014). Piezoelectric Actuators for Acoustic Mixing in Microfluidic Devices-Numerical Prediction and Experimental Validation of Heat and Mass Transport. Sensors Actuators B: Chem. 205, 206–214. doi:10.1016/j.snb.2014.08.030
Cross, L. E., Jang, S. J., Newnham, R. E., Nomura, S., and Uchino, K. (1980). Large Electrostrictive Effects in Relaxor Ferroelectrics. Ferroelectrics 23 (1), 187–191. doi:10.1080/00150198008018801
Feng, R., Zhao, Y., Zhu, C., and Mason, T. J. (2002). Enhancement of Ultrasonic Cavitation Yield by Multi-Frequency Sonication. Ultrason. Sonochem. 9 (5), 231–236. doi:10.1016/s1350-4177(02)00083-4
Fykse, E. M., Olsen, J. S., and Skogan, G. (2003). Application of Sonication to Release DNA from Bacillus Cereus for Quantitative Detection by Real-Time PCR. J. Microbiol. Methods 55 (1), 1–10. doi:10.1016/s0167-7012(03)00091-5
Hahn, P., and Dual, J. (2015). A Numerically Efficient Damping Model for Acoustic Resonances in Microfluidic Cavities. Phys. Fluids 27 (6), 062005. doi:10.1063/1.4922986
Harkness, P., and Lucas, M. (2012). A Brief Overview of Space Applications for Ultrasonics. Ultrasonics 52 (8), 975–979. doi:10.1016/j.ultras.2012.09.004
Hom, C. L., and Shankar, N. (1998). Modeling Nonlinearity in Electrostrictive Sonar Transducers. The J. Acoust. Soc. America 104 (4), 1903–1913. doi:10.1121/1.423761
Jandura, L., Burke, K., Kennedy, B., Melko, J., Okon, A., and Sunshine, D. (2010). An Overview of the Mars Science Laboratory Sample Acquisition, Sample Processing, and Handling Subsystem. Earth Space 2010: Eng. Sci. Construction, Operations Challenging Environments, 941–948. doi:10.1061/41096(366)89
Mahaffy, P. R., Webster, C. R., Cabane, M., Conrad, P. G., Coll, P., Atreya, S. K., and Mumm, E. (2012). The Sample Analysis at Mars Investigation and Instrument Suite. Space Sci. Rev. 170 (1), 401–478. doi:10.1007/s11214-012-9879-z
Mason, W. P. (1935). An Electromechanical Representation of a Piezoelectric crystal Used as a Transducer. Proc. IRE 23 (10), 1252–1263. doi:10.1109/jrproc.1935.227273
McSkimmin, H. J., and Mason, W. P. (1964). Ultrasonic Methods for Measuring the Mechanical Properties of Solids and Liquids. Phys. Acoust. 1.
Mora, M. F., Kehl, F., Tavares da Costa, E., Bramall, N., and Willis, P. A. (2020). Fully Automated Microchip Electrophoresis Analyzer for Potential Life Detection Missions. Anal. Chem. 92 (19), 12959–12966. doi:10.1021/acs.analchem.0c01628
Noell, A. C., Fisher, A. M., Fors‐Francis, K., and Sherrit, S. (2018). Subcritical Water Extraction of Amino Acids from Mars Analog Soils. Electrophoresis 39 (22), 2854–2863. doi:10.1002/elps.201700459
Powell, D. J., Wojcik, G. L., Desilets, C. S., Gururaja, T. R., Guggenberger, K., Sherrit, S., et al. (1997). “Incremental" Model-Build-Test" Validation Exercise for a 1-D Biomedical Ultrasonic Imaging Array,” in 1997 IEEE Ultrasonics Symposium Proceedings. An International Symposium, Toronto, Canada (IEEE) 2, 1669–1674.(Cat. No. 97ch36118).
Rossing, T. D., Russell, D. A., and Brown, D. E. (1992). On the Acoustics of Tuning forks. Am. J. Phys. 60 (7), 620–626. doi:10.1119/1.17116
Rueter, D., and Morgenstern, T. (2014). Ultrasound Generation with High Power and Coil Only EMAT Concepts. Ultrasonics 54 (8), 2141–2150. doi:10.1016/j.ultras.2014.06.012
Sarrazin, P. C., and Blake, D. F. (2006). U.S. Patent and Trademark Office, U.S. Patent No. 7,113,265.
Sherrit, S., and Mukherjee, B. K. (2007). Characterization of Piezoelectric Materials for transducers., Dielectric and Ferroelectric Reviews. Editors S. S. N. Bharadwaja, and R. A. Dorey (Kerala, India: Research Signpost) 2012, 175–244. arXiv preprint arXiv:0711.2657.
Sherrit, S., Wiederick, H. D., Mukherjee, B. K., and Sayer, M. (1997). An Accurate Equivalent Circuit for the Unloaded Piezoelectric Vibrator in the Thickness Mode. J. Phys. D: Appl. Phys. 30 (16), 2354–2363. doi:10.1088/0022-3727/30/16/014
Sherrit, S., Catoiu, G., and Mukherjee, B. K. (1999a). The Characterisation and Modelling of Electrostrictive Ceramics for Transducers. Ferroelectrics 228 (1), 167–196. doi:10.1080/00150199908226134
Sherrit, S., Dolgin, B. P., Bar-Cohen, Y., Pal, D., Kroh, J., and Peterson, T. (1999b). “Modeling of Horns for Sonic/ultrasonic Applications,” in 1999 IEEE Ultrasonics Symposium. Proceedings. International Symposium, Lake Tahoe, NV (IEEE) 1, 647–651. (Cat. No. 99CH37027). doi:10.1109/ultsym.1999.849482
Sherrit, S., Leary, S. P., Dolgin, B. P., and Bar-Cohen, Y. (1999c). “Comparison of the Mason and KLM Equivalent Circuits for Piezoelectric Resonators in the Thickness Mode,” in 1999 IEEE Ultrasonics Symposium. Proceedings. International Symposium, Lake Tahoe, NV (IEEE) 2, 921–926. (Cat. No. 99CH37027).
Sherrit, S., Bar-Cohen, Y., Bao, X., Dolgin, B. P., and Chang, Z. (2004). Ultrasonic Apparatus for Pulverizing Brittle MaterialNASA Tech Brief, NPO-30682, 28,8, 48–49.
Sherrit, S., Frankovich, K., Bao, X., and Tucker, C. (2009). Miniature Piezoelectric Shaker Mechanism for Autonomous Distribution of Unconsolidated Sample to Instrument Cells. SPIE Proceedings,Industrial Commercial Appl. Smart Structures Tech. 2009 7290, 72900H. International Society for Optics and Photonics. doi:10.1117/12.815201
Sherrit, S., Haysom, J. E., Wiederick, H. D., Mukherjee, B. K., and Sayer, M. (1996). “Frequency Dispersion and Field Dependence in the Material Constants of PVDF-TrFE Copolymers in the Thickness Mode,” in ISAF’96. Proceedings of the Tenth IEEE International Symposium on Applications of Ferroelectrics (IEEE) 2, 959’962.
Sherrit, S., Trebi-Ollennu, A., Bonitz, R., Bar-Cohen, Y., and Yen, J. T. (2010). Compact Sensitive Piezoelectric Mass Balance for Measurement of Unconsolidated Materials in Space. Sensors Smart Structures Tech. Civil, Mech. Aerospace Syst. 20107647, 76471A. International Society for Optics and Photonics. doi:10.1117/12.847038
Sherrit, S., Masys, T. J., Wiederick, H. D., and Mukherjee, B. K. (2011). Determination of the Reduced Matrix of the Piezoelectric, Dielectric, and Elastic Material Constants for a Piezoelectric Material with C∞ Symmetry. IEEE Trans. Ultrason. Ferroelect., Freq. Contr. 58 (9), 1714–1720. doi:10.1109/tuffc.2011.2008
Sherrit, S., Lee, H. J., Zhang, S., and Shrout, T. R. (2014). “Chapter 11: High Temperature Electromechanical Actuators,” in High Temperature Materials and Mechanisms. Boca Raton, Florida: CRC Press, Taylor & Francis Group. ISBN 13: 9781466566453, ISBN 10: 1466566450.
Sherrit, S., Noell, A. C., Fisher, A. M., Takano, N., and Grunthaner, F. (2016). Micro Acoustic Resonant chambers for Heating/agitating/mixing (MARCHAM). Sensors Smart Structures Tech. Civil, Mech. Aerospace Syst. 20169803, 980338. International Society for Optics and Photonics. doi:10.1117/12.2219230
Sherrit, S., Noell, A. C., Fisher, A., Lee, M. C., Takano, N., Bao, X., Kutzer, T. C., and Grunthaner, F. (2017). A Microfluidic Sub-critical Water Extraction Instrument. Rev. Scientific Instr. 88 (11), 114101. doi:10.1063/1.4999932
Sherrit, S., Lee, H. J., Bao, X., Badescu, M., and Bar-Cohen, Y. (2020). Composite Piezoelectric Resonator 1D Modeling with Loss. Behav. Mech. Multifunctional Mater. IX 11377, 113770T. International Society for Optics and Photonics. doi:10.1117/12.2559111
Smyth, K., and Kim, S.-G. (2015). Experiment and Simulation Validated Analytical Equivalent Circuit Model for Piezoelectric Micromachined Ultrasonic Transducers. IEEE Trans. Ultrason. Ferroelect., Freq. Contr. 62 (4), 744–765. doi:10.1109/tuffc.2014.006725
Stuart-Watson, D. (2006). A Simple Force Feedback Accelerometer Based on a Tuning fork Displacement Sensor. Doctoral dissertation, Ph. D. dissertation. Town, South Africa: University of Cape.
Tajdari, F., Berkhoff, A. P., Naves, M., Nijenhuis, M., and de Boer, A. (2020). A Low-Profile Flexural Displacement-Converter Mechanism for Piezoelectric Stack Actuators. Sensors Actuators A: Phys. 313, 112198. doi:10.1016/j.sna.2020.112198
Tang, Q., and Hu, J. (2015). Diversity of Acoustic Streaming in a Rectangular Acoustofluidic Field. Ultrasonics 58, 27–34. doi:10.1016/j.ultras.2014.11.015
Taylor, M. T., Belgrader, P., Furman, B. J., Pourahmadi, F., Kovacs, G. T. A., and Northrup, M. A. (2001). Lysing Bacterial Spores by Sonication through a Flexible Interface in a Microfluidic System. Anal. Chem. 73 (3), 492–496. doi:10.1021/ac000779v
Tsujino, J., Ueoka, T., Hasegawa, K., Fujita, Y., Shiraki, T., Okada, T., et al. (1996). New Methods of Ultrasonic Welding of Metal and Plastic Materials. Ultrasonics 34 (2-5), 177–185. doi:10.1016/0041-624x(96)81780-x
Wikipedia (2022). The Data Was Compiled from Wikipedia Pages of the Target Bodies. [downloaded 02/07/2022). Available at: https://en.wikipedia.org/wiki/X. X = Earth, Mars, Europa_(moon), Titan_(moon), Enceladus, Halley’s_Comet, Ceres_(dwarf_planet).
Willis, P. A., Creamer, J. S., and Mora, M. F. (2015). Implementation of Microchip Electrophoresis Instrumentation for Future Spaceflight Missions. Anal. Bioanal. Chem. 407, 6939–6963. doi:10.1007/s00216-015-8903-z
Willis, P., Mora, M. F., Noell, A., Creamer, J., Kehl, F., Zamuruyev, K., and Templeton, A. (2021). How to Search for Chemical Biosignatures on Ocean Worlds. Bull. Am. Astronomical Soc. 53 (4), 293. doi:10.3847/25c2cfeb.8a770808
Yaralioglu, G. G., Wygant, I. O., Marentis, T. C., and Khuri-Yakub, B. T. (2004). Ultrasonic Mixing in Microfluidic Channels Using Integrated Transducers. Anal. Chem. 76 (13), 3694–3698. doi:10.1021/ac035220k
Yaralioglu, G. (2011). Ultrasonic Heating and Temperature Measurement in Microfluidic Channels. Sensors Actuators A: Phys. 170 (1-2), 1–7. doi:10.1016/j.sna.2011.05.012
Keywords: fluidics, processing, piezoelectrics, actuation, mixing, cavitation, network modeling, acoustics
Citation: Sherrit S, Badescu M, Noell AC, Kehl F, Mora MF, Oborny NJ, Creamer JS and Willis PA (2022) Acoustic Processing of Fluidic Samples for Planetary Exploration. Front. Space Technol. 3:752335. doi: 10.3389/frspt.2022.752335
Received: 02 August 2021; Accepted: 03 March 2022;
Published: 11 April 2022.
Edited by:
Alessandro Donati, Kayser, ItalyCopyright © 2022 Sherrit, Badescu, Noell, Kehl, Mora, Oborny, Creamer and Willis. This is an open-access article distributed under the terms of the Creative Commons Attribution License (CC BY). The use, distribution or reproduction in other forums is permitted, provided the original author(s) and the copyright owner(s) are credited and that the original publication in this journal is cited, in accordance with accepted academic practice. No use, distribution or reproduction is permitted which does not comply with these terms.
*Correspondence: Stewart Sherrit, c3NoZXJyaXRAanBsLm5hc2EuZ292