 Yash V. Varshney
 Azizuddin Khan
95% of researchers rate our articles as excellent or good
Learn more about the work of our research integrity team to safeguard the quality of each article we publish.
Find out more
ORIGINAL RESEARCH article
Front. Signal Process. , 25 March 2022
Sec. Biomedical Signal Processing
Volume 2 - 2022 | https://doi.org/10.3389/frsip.2022.760643
This article is part of the Research Topic Physiological Signal Processing for Wellness View all 6 articles
Imagined speech can be used to send commands without any muscle movement or emitting audio. The current status of research is in the early stage, and there is a shortage of open-access datasets for imagined speech analysis. We have proposed an openly accessible electroencephalograph (EEG) dataset for six imagined words in this work. We have selected six phonetically distributed, monosyllabic, and emotionally neutral words from W-22 CID word lists. The phonetic distribution of words consisted of the different places of consonants’ articulation and different positions of tongue advancement for vowel pronunciation. The selected words were “could,” “yard,” “give,” “him,” “there,” and “toe.” The experiment was performed over 15 subjects who performed the overt and imagined speech task for the displayed word. Each word was presented 50 times in random order. EEG signals were recorded during the experiment using a 64-channel EEG acquisition system with a sampling rate of 2,048 Hz. A preliminary analysis of the recorded data is presented by performing the classification of EEGs corresponding to the imagined words. The achieved accuracy is above the chance level for all subjects, which suggests that the recorded EEGs contain distinctive information about the imagined words.
Speech communication is the most natural way of exchanging information between humans. However, disorders like amyotrophic lateral sclerosis (ALS), muscular dystrophies, brainstem stroke, etc. can disrupt the neuromuscular channels to perform regular communication. It is also required to transfer verbal information without making any sounds, for instance, in the military situation (Pei et al., 2012). In such cases, information transfer using imagined speech is a desirable solution (García et al., 2012). Imagined speech is the thinking of speech prompts (phonemes, vowels, words, etc.) without any auditory stimulation and tongue, lips, or hand movement (Martin et al., 2014). Decoding imagined speech by using electroencephalography (EEG) is still in its infancy. However, there is vast excitement to use the electrophysiological method to decode imagined speech. Imagined speech can establish a brain–computer interface (BCI) system, which can decode the brain activities during imagined speech into respective commands. A BCI system consists of three major components: 1) signal acquisition, 2) signal decoding (which include feature extraction and translation), and 3) device output. A variety of methods for brain activity acquisition might be used in the BCI. These include EEG electrocorticography (ECoG), magnetoencephalography (MEG), positron emission tomography (PET), functional magnetic resonance imaging (fMRI), and optical imaging. However, ECoG, MEG, PET, fMRI, and optical imaging are either highly expensive or immobile, which makes them difficult for general uses (Wolpawa et al., 2002). EEG is noninvasive, is portable, is relatively cheaper, and has high time resolution. EEG devices provide a noninvasive mechanism for measuring electrical signals transmitted near the surface of the brain.
In recent years, several studies have addressed the imagined speech recognition problem for establishing the BCI using EEG (Deng et al., 2010; Pei et al., 2011; Martin et al., 2016; Min et al., 2016; Hashim et al., 2018). Although the results were encouraging, the degree of freedom and the accuracy of current methods are not yet sufficient to enable fluid communication between humans and machines. For a BCI system, degrees of freedom define the number of output classes allowed to vary. An efficient BCI system requires a good tradeoff between the degree of freedom and accuracy. Several studies were performed to classify EEG corresponding to five imagined vowels (Matsumoto and Hori, 2013, 2014; Riaz et al., 2015; Aguila et al., 2017; Sree and Kavitha, 2017; Morooka et al., 2018; Cooney et al., 2019; Ghosh et al., 2019) and reported that imagination of vowel’s articulation could modulate the brain activities. However, the research is still lagging in the multiclass classification of words considering the imagined speech. One of the possible reasons behind fewer studies in imagined word classification is the shortage of open-access datasets for imagined words. García et al. (2012) recorded EEG data for five Spanish language words, i.e., “arriba,” “abajo,” “izquierda,” “derecha,” and “seleccionar” equivalent to “up,” “down,” “left,” “right,” and “select.” The pronunciation of each word was repeated 33 times in succession during the EEG recording. Still, a maximum accuracy of 65.5% was obtained to classify 5 words (García-Salinas et al., 2019). Pawar and Dhage (2020) classified words corresponding to four directions, i.e., “left,” “right,” “up,” and “down,” and achieved 49.77% classification accuracy using wavelet-based features. However, the dataset used in the above studies is not openly accessible, so testing of new signal decoding techniques is not possible over these datasets.
An open-access dataset proposed by Zhao and Rudzicz (2015) consisted of seven syllables/phonemes (“iy,” “uw,” “piy,” “tiy,” “diy,” /m/, /n/) and four phonologically similar words (i.e., pat, pot, knew, and gnaw). They recorded data from 12 subjects using a 62-channel data acquisition system. However, no one has reported classifying four imagined words using the presented dataset in our knowledge. Another open-access imagined speech EEG dataset consisted the 16 English phonemes and 16 Chinese syllables (Wellington and Clayton, 2019). The dataset was recorded using a 14-channel EEG data acquisition system from 21 English-speaking and two Chinese-speaking participants. Though humans mostly think in the form of words, decoding brain signals corresponding to the imagined words is required to understand human thoughts. For developing and testing the algorithms for decoding the imagined words, the primary requirement is the dataset containing the EEG signals corresponding to the imagined words. The dataset collected by researchers is recorded for some specific purposes. Nguyen et al. (2018) provided an imagined word dataset to understand the imagined word length effect over brain activities. The dataset consisted of three short words, two long words, and three imagined vowels. The dataset was recorded from six–six subjects for short and long imagined words while collecting data from eight subjects for imagined vowels. An EEG dataset with four direction-based Spanish words, i.e., “arriba,” “abajo,” “derecha,” “izquierda” (i.e., “up,” “down,” “right,” “left,” respectively) was recorded by Nieto et al. (2021) from 10 subjects. This dataset aimed to develop an imagined word database that can decode the direction of movement. However, the trials for all subjects were varied as few subjects left the experiment in the middle due to willingness and tiredness. Another dataset for six Spanish imagined words representing different directions (“arriba,” “abajo,” “izquierda,” “derecha,” “adelante,” and “atras”) was recorded from 15 subjects (Coretto et al., 2017). Coretto et al.’s dataset was recorded from six EEG channels (F3, F4, C3, C4, P3, and P4). It showed the distinctive information corresponding to the imagined words by classification accuracy of 18.61% using wavelet-based features, which was above the chance level. However, the dataset was not acquired from the whole brain regions, which could cause missing some important EEG activities from different brain areas.
The aforementioned works have indicated that the research fraternity required more open-access databases to explore the distinctive features in multiclass imagined speech signals. There are two important parameters observed to keep in mind during EEG data collection for imagined speech: brain region selection for acquiring EEG signals and selection of imagined speech prompts. It is well accepted that Wernicke’s area and Broca’s area play significant roles in speech production. However, several studies reveal that other brain regions also activate during speech production (Blank et al., 2002). Zhao and Rudzicz (2015) show that features extracted from EEGs acquired from different brain areas (left and right temporal regions, auditory cortex, and left middle central cortex) contain speech-related features. Another study performed by Torres-García et al. (2013) found that when a person imagines the pronunciation of a word, he/she internally “hears” the word that is observed from the data collected from the auditory cortex. It suggests that data collection from multiple brain regions will be helpful to extract the distinctive features related to speech prompts.
The changes in imagined speech prompt vary the corresponding brain activities. It may happen due to various reasons like change in the length of speech prompt, emotion attached with the speech prompt, and the commands generated to pronounce the word in imagination (or overtly in case of overt speech) composed of different phonemes. It can be said that the phonological structure of the word is highly responsible for the change in brain activities. Several studies have been performed using different types of speech prompts, e.g., response for a question in (Yes/No) (Halder et al., 2010), the direction of movement (García et al., 2012; Coretto et al., 2017; Pawar and Dhage, 2020), word length (Nguyen et al., 2018), words used in daily needs (Mohanchandra and Saha, 2016), etc. It is observed that no study is performed for the imagined words with different phonological structures. On the other hand, the phonetic difference in the words may lead into the activation of brain activities in distinctive manners (Bakhshali et al., 2020; Cooney et al., 2019) and help us to understand the brain activity pattern corresponding to different phonemes.
The present work aims to provide an imagined words dataset where each word consists of the phonemes with different places/manner of articulation and height/positions of tongue advancement. The distinctive information in the recorded EEG is quantified by performing classification for six imagined words using wavelet-based features proposed by Torres-García et al. (2013) and Sereshkeh et al. (2017). The classification accuracies obtained for the proposed dataset are compared with the baseline obtained from the classification of another open-access dataset given by Coretto et al. (2017) using the same feature set. The presented study shows that phonetic differences in the imagined words vary the brain activities effectively and can be utilized to develop an imagined speech recognition system.
Fifteen healthy subjects (seven male/eight female) volunteered for the study, and all of them were graduate and postgraduate students of the Engineering Institute. Twelve subjects were right-handed, and three (subjects 5, 7, and 13) were left-handed. Subjects were aged between 20 and 35 years (with a mean of 26.41 years and a standard deviation of 5.23 years) and residents of different states in India. All subjects were proficient in British English; however, everyone had different native language (i.e., Oria, Hindi, Marathi, Kashmiri, and Malayalam). The required demographic details and the linguistic identity of each subject are given in Appendix B. None of the subjects had any history of neurological disorder, and they were not undergoing any medical treatment at the time of the experiment. Subjects gave their informed consent before participating in the experiment.
The subjects were comfortably seated in a reclining armchair in the dimly lit recording room. Subjects were instructed to perform overt and imagined speech tasks for a displayed word on the screen. The experiment was started with the cue displayed on a computer screen, followed by a fixation time, overt speech time window, another fixation time, imagined speech time window, and feedback window, as shown in Figure 1. Both fixation times were represented by the “+” sign display on the screen, while the screen kept blank for the duration of overt and imagined speech production. The timings for word display, overt speech production, and imagined speech production events were 2 s, and the fixation duration was 1 s. Subjects have to speak the displayed word loudly after the first fixation time. Then they have to imagine the pronunciation of a word (imagined speech task) after displaying the second fixation time. Subjects had to perform overt and imagined speech tasks in the given time window of 2–2 s. The subjects themselves did a self-assessment of performing correct/incorrect trials after performing the imagined speech task. If the subjects felt that they had performed both overt and imagined speech tasks properly in the given time frame, they were asked to press the numeral key “1”; otherwise, they pressed “2.” The total duration for one trial was around 9 s. All trials were separated by each other by a duration of 1 s. A total of 50 trials for each word were recorded in five sessions of approximately 10-10 min, resulting in a total of 300 trials per subject. The subjects were allowed to take rest and recover from the tiredness in between the sessions.
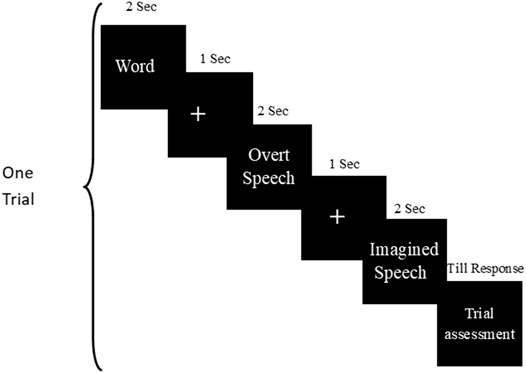
FIGURE 1. Paradigm for the experiment.
Subjects were asked about their physical and emotional wellness before starting the experiment. The subjects were asked to avoid eye blinks during overt and imagined speech production. However, they were not forced to keep their eyes open if they felt stressed during the trial. A training session of 20 trials was performed before starting the experiment. However, each trial’s overt speech production helped the subject observe the speech production process of the presented word. They were asked to think the same process without creating any sound.
The selection of the words was performed in a way; the imagined word dataset should be used later to test the ability of the imagined speech recognition technique. For such purpose, words were selected from the CID W-22 word lists. CID W-22 word lists were administered by Hosford-dunn and Runge (2016) under the hypothesis that judiciously chosen words can test the word recognition ability of the human auditory system without compromising test accuracy. CID W-22 consists of four-word lists (“List 1,” “List 2,” “List 3,” and “List 4”) of 50 monosyllabic words arranged in the order of recognition difficulty. Word selection was made from the first fifteen words of “List 1,” which were reported with a lower difficulty level in understanding by the human audiotory system. Words were selected with two major constraints: 1) There must be the phonetic difference in consonants that appeared in words based on the places and manner of articulations. 2) Different vowels should appear in words that require different heights and advancements of tongue position in pronunciation. The word length was controlled based on the number of syllables per word (Grzybek, 2015). All selected words were monosyllabic and emotionally neutral. The selected six words for the experiment were “could,” “yard,” “give,” “him,” “there,” and “toe.” The phonetic transcription, place of articulation of consonants, and advancement in the pronunciation of vowels in selected words are presented in Table 1 and the manner of articulation with tongue height is presented in Table 2.
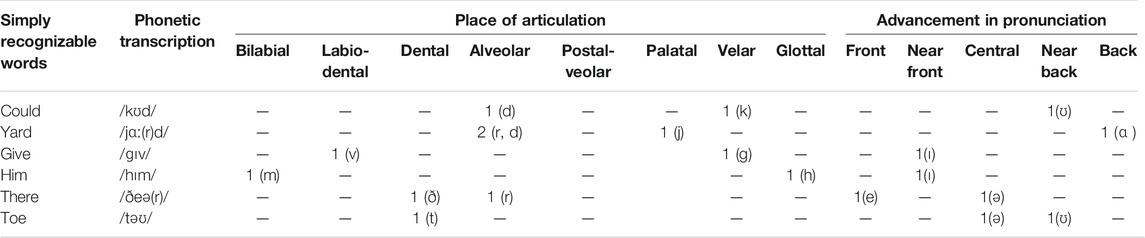
TABLE 1. Phonetic transcription, place of articulation of consonants, and advancement in pronunciation of vowels in selected words.
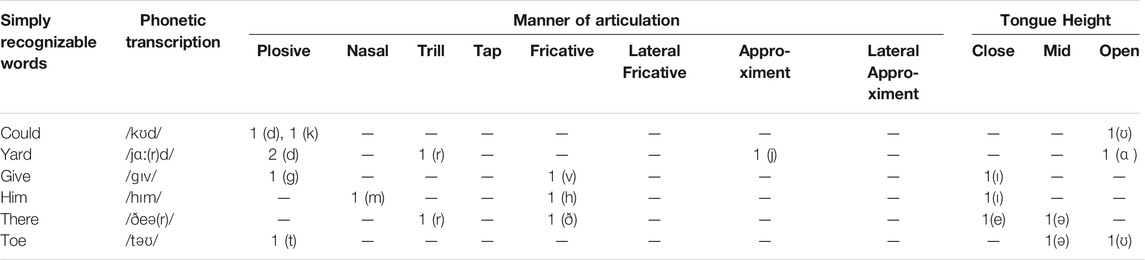
TABLE 2. Manner of articulation and tongue height in the pronunciation of vowels in selected words.
A 64-channel BioSemi ActiveTwo system with active Ag/AgCl electrodes with CMS and DRL as the ground was used to record EEG at a sampling rate of 2,048 Hz with a 24-bit analog-to-digital converter. BioSemi head cap (according to the subject’s head size) was used to position the 64 EEG electrodes on the scalp according to the international 10–20 system as shown in Figure 2. All electrodes were referenced to none (Biosemi, 2013). The impedance for all electrode sites was kept at less than 10 kΩ. All the required instructions, tasks, and triggers to the BioSemi were provided through the E-Prime 2.0 software. Trigger information for the start and endpoint of overt and imagined speech tasks with the information of data structure is presented in Supplementary Appendix SA.
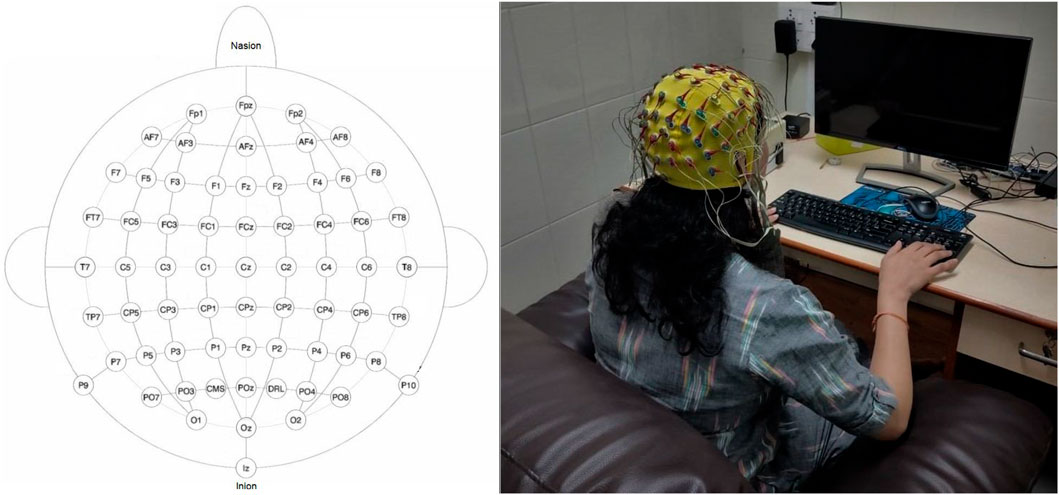
FIGURE 2. Electrode placement over the scalp and experimental setup. The subject is looking at a monitor from a two-feet distance. The monitor displayed the word and task to be performed. In this illustrative figure, the subject was imagining the pronunciation after the word’s display. The monitor was blank during imagined speech task.
Signals were visually inspected during the recordings. Trials consisting of the muscles and other artifacts were marked for rejection, and the experiment was paused until the EEG stabilized. Trials in which the subject did not perform the given tasks properly were discarded based on feedback given by the subjects in each trial. After rejecting inappropriate trials, the total number of trials selected for analysis per subject is shown in Table 3 and Figure 2.

TABLE 3. Number of trials selected from all subjects for analysis of EEG data with bad channels.
The recorded signal was spatially re-referenced using a common average reference (CAR) montage. The raw EEG signal from each electrode was filtered using a zero-phase band-pass filter with a cutoff frequency of 0.01–250 Hz to remove low-frequency trends and high-frequency noises. A finite-impulse-response (FIR) notch filter in the range of 48–52 Hz with zero phase (forward and inverse) was used to remove the 50-Hz line noise harmonic. The eye blinks artifacts were removed using independent component analysis (Jung et al., 2000). Then, recorded data of each stimulus type were epoched into trials from 0 to +1 s centered on the stimulus onset.
Event-related potentials (ERPs) were visualized by normalizing the EEGs using the subject’s prestimulus standard deviation during all epochs. Then grand average ERPs were obtained for all spoken and imagined words. Since there is no clear standard for understanding the EEG acquired for imagined words, the change in EEG potential and cortical depth was observed in early duration (Figure 3). It indicated the early positive deflection in the left temporal region [channels 6–9 (F5, F7, FT7, FC5) and 15, 16 (T7, TP7)] for all imagined words from 0 to 150 m, the possible duration for word preparation. Another differentiable amplitude during 200–500 m of the stimuli onset was observed in both temporal regions. ERPs show that the left temporal lobe elicited negative potential just after the speech preparation, while the right temporal region [channels 51–54 (C6, T8, TP8, CP6) and 42, 43 (F8, FT8)] shows opposite positive potential during imagined word production. For further exploration of the dominating frequency band in EEG with change in imagined words is also observed. Figure 4 shows the time-frequency analysis of EEG obtained through channels F5, T7, Tp7, and T8.
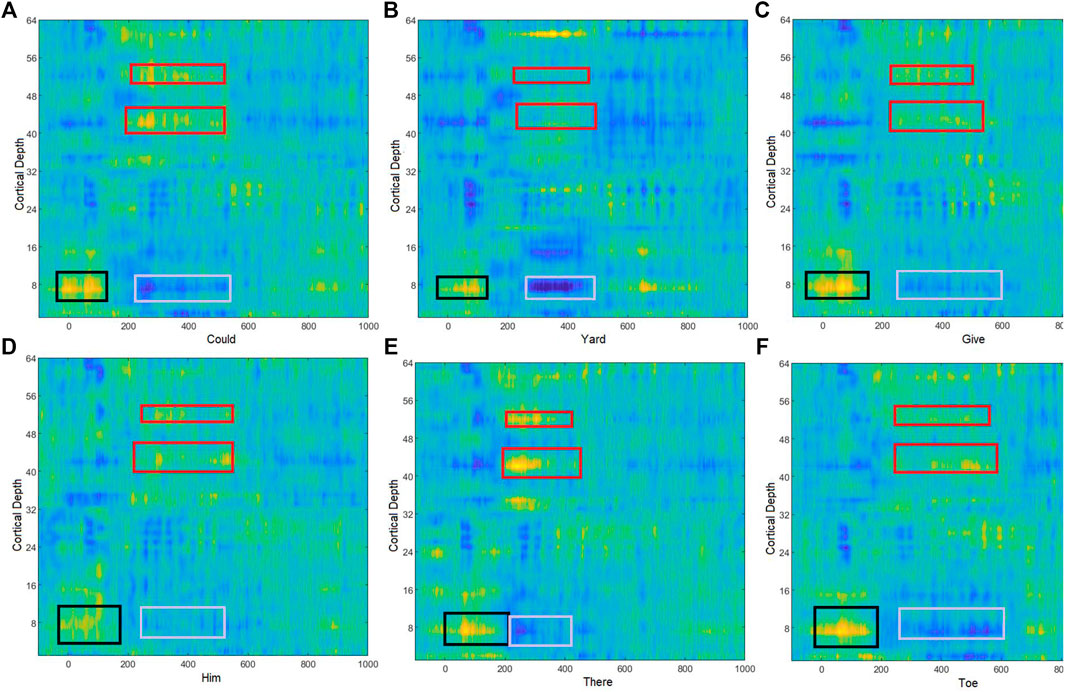
FIGURE 3. Brain activity during the imagined words (A) could, (B) yard, (C) give, (D) him, (E) there, and (F) toe. Black boxes represent the early positive deflection in the left temporal region, which represents the speech comprehension. Red boxes represent the higher positive deflection at the right temporal region during imagined speech production where gray boxes represent corresponding negative deflection in the EEG amplitude.
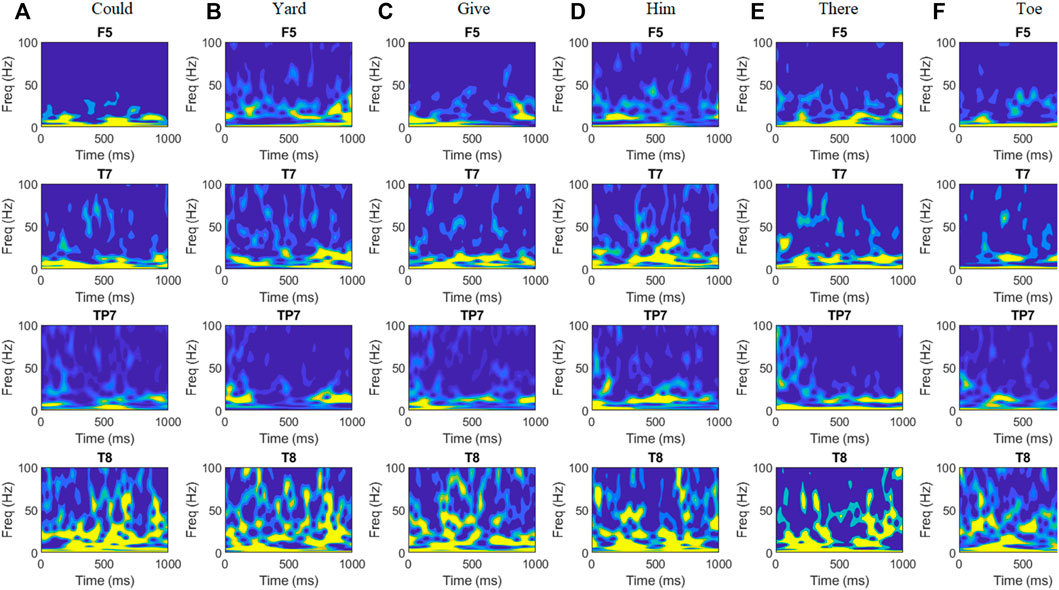
FIGURE 4. Time-frequency representations (TFRs) of averaged EEG signals for six words (A) Could, (B) Yard, (C) Give, (D) Him, (E) There, and (F) Toe acquired from subject ID 2. The TFRs are plotted for the first 1 s after stimulus onset and for the frequency range of 0–100 Hz. TFRs show high activation during 0–200 ms and around 500 ms in the left temporal region around Wernicke’s area (T7, TP7). Maximum variation in amplitude for different words can be observed in the beta and gamma bands in both temporal regions and Broca’s area (F5).
Time-frequency representation shows a large deflection in beta frequencies during 0–200 m and around 500 m of the event onset. For the remaining duration, differentiable changes in gamma frequency powers can be observed. The TFR supports the results of a previous study performed by Manca and Grimaldi (2016). The study suggests a remarkable correspondence between average durations of speech units and the frequency ranges of cortical oscillations. Phonetic features (mean duration of 20–50 m) of imagined prompts are associated with high gamma (>40 Hz) and beta (15–30 Hz) oscillations. The change in beta- and gamma-band amplitude in the whole-brain region was also observed using topographic plots, as shown in Figure 5.
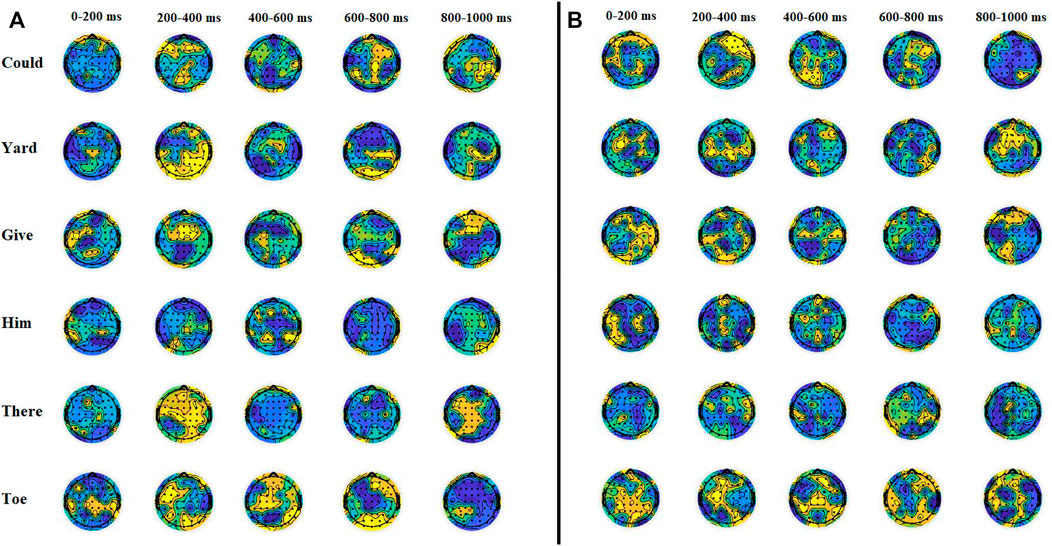
FIGURE 5. Topographical distribution of (A) beta and (B) gamma band activities for different imagined words. The pattern of beta wave’s amplitude in the left temporal region was significantly different during 0–200 m (p < 0.03 at T7) of onset. There were maximum beta and gamma activities observed for the word "toe," while activities were minimum in amplitude for the word "him." There is a high amplitude observed in both beta and gamma waves at both temporal regions for all words from 200 to 400 m of onset.
The most activated brain regions for change in imagined words were the left/right superior temporal gyrus, Wernickes’ area (left posterior superior temporal gyrus), and the posterior frontal lobe. The interesting fact was that the change in brain activities was observed in both hemispheres’ temporal lobes, which could be possibly due to the reason such as when people imagine the pronunciation of a word, they “hear” that word internally. ANOVA test was conducted between the average left temporal region’s ERPs (consisting of Wernicke’s area) of all six words, which were not statistically significant (p = 0.231). Pairwise t-tests were performed along with the word pairs. The ERPs for word pairs “could” and “there” (p = 0.004), “toe” and “him” (p = 0.007), “Yard” and “Could” (p = 0.011), “him” and “yard” (p = 0.029), and “toe” and “give” (p = 0.014) were significantly different. The rest of the other word pairs did not show significant differences in the left temporal region’s ERPs. Similarly, for the right temporal region’s ERP, the ANOVA test for six words was not statistically significant (p = 0.389). Pairwise t-tests were again performed along with the word pairs. The ERPs for word pairs “could” and “there” (p = 0.008), “toe” and “him” (p = 0.013), “yard” and “could” (p = 0.001), and “toe” and “give” (p = 0.004) were significantly different. Other brain regions have also displayed the marginal change in EEG amplitude for different words. Therefore, the features extracted from all channels were utilized for the classification of imagined different words.
The classification of recorded data is performed using the features extracted using a discrete wavelet transform (DWT) suggested by Coretto et al. (2017), Sereshkeh et al. (2017), and Panachakel et al. (2020). The wavelet transform decomposes a signal using a set of functions called wavelets, which are scaled and shifted versions of another function named mother wavelet
where
where
The recorded signals were downsampled to 512 Hz and decomposed using the Daubechies-4 (db4) mother wavelet (Popov et al., 2018) to the eight levels corresponding to the following frequency bands: 128–256 (D1), 64–128 (D2), 32–64 (D3, γ), 16–32 (D4, β), 8–16 (D5, α), 4–8 (D6, θ), 2–4 (D7,δ), and <2 (A7). The root mean square (RMS), standard deviation (SD), and relative wavelet energy (RWE) were calculated for D3, D4, D5, D6, and D7 bands and used as features. RWE was calculated by taking the ratio of the energy of a single decomposition level to the total energy of a segment using Eq. 3.
where
There are five bands per EEG segment selected for feature extraction. Three features (RMS, SD, and RWE) per band were extracted, resulting in 15 features per channel and 960 features per epoch.
Before training of classifiers using extracted features, principal component analysis (PCA) was applied to the feature sets to reduce dimensionality and identify the components with the maximum variance. Dimensionality reduction is significant when used with computationally expensive training algorithms, such as multiclass SVM. The PCA algorithm extracts the components from a dataset most responsible for the variance in those data. The first principal component contains the greatest variance, with the second containing less, and so on. Typical approaches include retention of the first k principal components (where k = 1, 2, 3, etc.) or retention of k number of components such that a specified fraction of the total variance is explained. In this case, the number of components corresponding to 95% of the total variance has been retained for classifier training.
Three different classifiers, random forest (RF) and support vector machine (SVM), were trained using all extracted feature sets discussed in the previous section. Details about the selected classifiers are discussed below.
Random forest (RF): RF consists of many individual decision trees that operate as an ensemble. Each tree in the random forest spits out a class prediction, and the class with the most votes becomes the model’s prediction. The random forest approach’s fundamental principle comprises the construction of many “simple” decision trees in the training stage and the majority vote (mode) across them in the classification stage. Among other benefits, this voting strategy has the effect of correcting for the undesirable property of decision trees to overfit training data. The number of trees in the ensemble is a free parameter that is readily learned automatically using the so-called out-of-bag error (Chiu and Tavella, 2008). In this work, the classifier was implemented using the following hyper-parameters: the number of trees was 50, and the number of attributes considered at each node was
Support vector machine (SVM): SVM is very commonly used due to its good generalization properties; it is not sensitive to overtraining and can handle high-dimensional datasets. Specifically, a hyperplane is used for SVM to maximize the boundaries of each class. The fashion in which this hyperplane makes the separation between the classes can be modified using a kernel. The influence of a single data point training can also be controlled in SVM, which is termed as a gamma parameter. In the present work, a radial basis function was used for the SVM kernel, and gamma was kept as 1.0.
A 5-fold cross-validation scheme was selected to ensure that robust estimates of classification accuracy have been obtained. The EEG epochs were randomly divided into five sets, four of which were used for training the classifier. The other set was used as a test set. This process is repeated through five iterations, with each classifier’s accuracy retained to compute an average value for the final accuracy. The classification accuracy was calculated by the ratio of correct classification and the total number of samples.
Table 4 shows the subject-wise classification accuracies resulting from the training of RF and SVM classifiers. The average accuracy is more significant than chance level accuracy (16.67% for six classes) for all subjects. The maximum accuracy is achieved for subject 2, while the minimum classification accuracy was achieved for subject 13. Further analysis is performed by considering the native language of subjects as a variable. It was observed that the imagined speech for the subject whose first language was Marathi or Hindi was better classifiable (>28.6%) than the subject whose first language was Malayalam (<27.3%). This could happen due to the change in the accent of a subject. A confusion matrix was obtained to understand the effect of phonological changes in the words over the classification accuracy, as shown in Table 5. It shows that maximum true positives were obtained for the word “yard.” It was also observed that classification for phonologically similar words was poorer than those with a high phonetic difference.
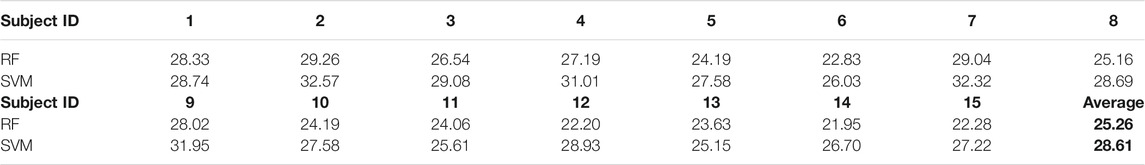
TABLE 4. Subject-wise classification accuracy obtained for proposed imagined word dataset. The chance level of classification is 16.6% (six classes).
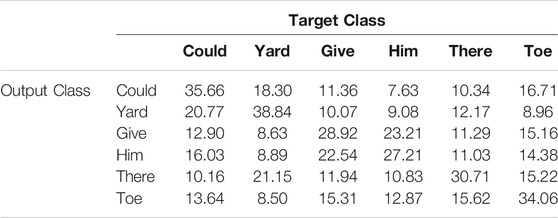
TABLE 5. Confusion matrices obtained for subject 2 after classification with SVM classifier.
Pairwise classification of imagined words was also performed to get an insight of phonologically difference/similarity effect over classification accuracy (Table 6).
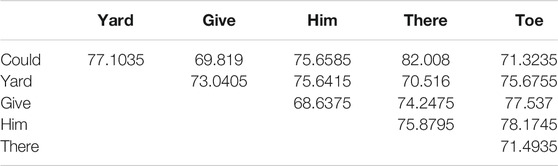
TABLE 6. Average pairwise classification accuracy of selected words for subject 2.
The maximum classification accuracy was observed for the word-pair “there” and “could” (82.0%), while the minimum accuracy of 68.63% was obtained for the word-pair “give” and “him.” It was observed that the place of consonants’ articulation and the position of tongue advancement in vowel pronunciation affect the classification accuracy. The example of words “give” and “him” shows that the similar position of tongue advancement in vowel pronunciation and the lower difference of place of consonant’s articulation reduce brain activity changes during imagined speech production. Another example of words “yard” and “could” shows an accuracy of 77.10%, although the same phoneme was involved in the word’s coda (/d/). There may be two factors for good results: the first is the prosodic feature in the vowel (ɑv) in the word “yard,” and the second is the change in the manner of articulation for words’ onsets “/j/” and “/k/.”
There is no imagined word database available in literature where the phonetic distribution of the selected words is examined for imagined speech classification. Therefore, a comparison is made based on the higher classification accuracy of six imagined words. For such purpose, a dataset recorded by Coretto et al. (2017) is considered, which consists the imagined speech dataset for five Spanish vowels (/a/, /e/, /i/, /o/, and /u/) and six Spanish commands \arriba,” \abajo,” \derecha,” \izquierda,” \adelante,” and \atrás" (up, down, right, left, forward, and backward, respectively). The presented comparison shows that word selection for imagined speech tasks affects the accuracy of signal classification techniques. In this dataset, the EEG signals corresponding to channels F3, F4, C3, C4, P3, and P4 were recorded from 15 subjects. Each subject performed the imagined speech trials around 50 times per speech unit. The data corresponding to imagined "words" were selected for comparison purposes. The phonetic distribution of the words chosen in Correto’s dataset is compared with the proposed dataset in Supplementary Appendix SC.
Classification with selected features and the SVM classifier was performed over Coretto’s dataset, which provided average classification accuracy of 18.14%. Figure 6 shows the subject-wise classification accuracy achieved for Coretto’s dataset. Maximum accuracy was achieved for subject "10," which was about 20.85%.
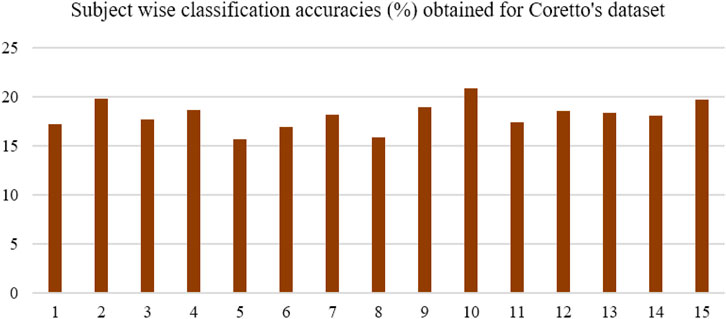
FIGURE 6. Classification accuracy obtained for Coretto’s data using selected feature set with SVM classifiers. Accuracy was lower than the chance level for subjects five and eight, while for others, it was higher than the chance level (16.6%).
The comparison of the proposed dataset with Coretto’s dataset was performed in two cases. In the first case, the classification was performed using the same channels (F3, F4, C3, C4, P3, and P4) as used in Coretto’s data. Selected features provided an average classification accuracy of 25.02%. In the second case, all the 64 channels were used for classification purposes, providing 28.61% of classification accuracy. It suggests that other brain regions also contain distinctive features that can help in better classification of imagined speech.
The objective of this work is to create an openly accessible imagined speech EEG database for six words. We have verified whether the proposed dataset contains distinctive features corresponding to imagined words. All selected words were monosyllabic and emotionally neutral. The selection of words was made by considering the phonetic distribution among the words. To understand the effect of phonetic distribution in word selection, EEG analysis was performed. The grand averages of recorded EEG signals were obtained for each imagined word. The ERPs showed a similar pattern of brain activation for imagined speech for all words. Our result was in line with the neural representation discovered in the previous works.
During imagined speech production, the maximum activated brain region was the temporal and the prefrontal region (Wernicke’s and Broca’s area) (Martin et al., 2016). Although early activity for imagined speech was observed in the left temporal region when the speech comprehension process occurs, both temporal regions were active during speech production, which could be observed in the ERPs shown over the cortical depth (Figure 3). It was also observed how the place and manner of articulation of phonemes in the words change the EEG activities across the brain. For frequency band-wise comparisons, topographical plots for beta and gamma bands were presented, which show how band energy varies with the change in phonemes in the imagined words. It was observed that a larger difference in the place of articulation of the phonemes involved in words made a more significant change in beta and gamma band activities. It was also observed that the ERP during word utterance highly depends upon the vowel following a consonant. For example, the utterance of the word "could," which consists of /k/ followed by /ʊ/, provides a large amplitude at the beginning of EEG. Here, /k/ originates from velar, and it is a plosive sound. However, the utterance of the word “give” consists of /g/ followed by /I/. /g/ also originates from velar and is a plosive sound, but the changes in EEG amplitudes depend upon the following vowel /I/. Another difference can be observed for the words “there” and “toe.” Here, close tongue height with front pronunciation provides greater changes in EEG as compared to mid and open tongue height with central tongue position.
The classification of imagined speech further explored distinctive information in each class of imagined speech signal. DWT-based features were obtained from the dataset, and classification was performed, which provided above chance level classification accuracy for all subjects. The effect of word selection on classification accuracy is compared with an existing dataset. Classification results show that the phonetically distributed words contain more distinctive information as compared to direction-based imagined words. Comparison of both datasets was performed using similar channels’ EEG as well as the maximum data available in both datasets. The results showed that along with word selection, data collected from other brain regions also displayed an effective potential change corresponding to different imagined words and helped in improving classification accuracy. One possible reason for the inferior results obtained using Coretto’s data is that it consists of multisyllabic and long words; most of the words consist of similar phonemes, which may cause the inclusion of similar features in all words. At the time of classification, all features come into account, which decreases the classification accuracy. However, it is difficult to obtain the exact onset/offset of imagined speech utterance, so phoneme-wise feature extraction will also be difficult. The proposed dataset, which consists of more variation in phoneme occurrence, is better for classification. We believe that the proposed dataset will facilitate and encourage the research fraternity to develop better EEG decoding techniques for imagined speech recognition systems. In the future, a time-locked imagined speech dataset can be collected with user-driven triggers. The user-driven triggers may help to identify the onset and offset of the imagined speech event. However, such paradigm may consist of motor movement by the user and cause for muscle artifacts.
The raw data supporting the conclusion of this article will be made available by the authors, without undue reservation.
The studies involving human participants were reviewed and approved by the Indian Institute of Technology Bombay, India. The patients/participants provided their written informed consent to participate in this study.
Conceptualization: YV and AK. Designing paradigm: YV and AK. Data collection: YV. Results: YV and AK. Interpretation and discussion: AK and YV.
The authors declare that the research was conducted in the absence of any commercial or financial relationships that could be construed as a potential conflict of interest.
All claims expressed in this article are solely those of the authors and do not necessarily represent those of their affiliated organizations, or those of the publisher, the editors, and the reviewers. Any product that may be evaluated in this article, or claim that may be made by its manufacturer, is not guaranteed or endorsed by the publisher.
The Supplementary Material for this article can be found online at: https://www.frontiersin.org/articles/10.3389/frsip.2022.760643/full#supplementary-material
Aguila, M. J., Basilio, H. D. V., Suarez, P. V. C., Dueñas, J. P. E., and Prado, S. V. (2017). “Comparative Study of Linear and Nonlinear Features Used in Imagined Vowels Classification Using a Backpropagation Neural Network Classifier,” in ACM International Conference Proceeding Series, 7–11. doi:10.1145/3051166.3051175
Bakhshali, M. A., Khademi, M., Ebrahimi-Moghadam, A., and Moghimi, S. (2020). EEG Signal Classification of Imagined Speech Based on Riemannian Distance of Correntropy Spectral Density. Biomed. Signal Process. Control. 59, 101899–101911. doi:10.1016/j.bspc.2020.101899
Biosemi (2013). Biosemi {EEG} amplifiers. Available at: http://www.biosemi.com/faq/cms26;drl.htm.
Blank, S. C., Scott, S. K., Murphy, K., Warburton, E., and Wise, R. J. S. (2002). Speech Production: Wernicke, Broca and beyond. Brain 125 (8), 1829–1838. doi:10.1093/brain/awf191
Chiu, S., and Tavella, D. (2008). “Introduction to Data Mining,” in Introduction to Data Mining, 137–192. doi:10.1016/b978-0-7506-8234-3.00007-1
Cooney, C., Korik, A., Folli, R., and Coyle, D. (2019). “Classification of Imagined Spoken Word-Pairs Using Convolutional Neural Networks,” in The 8th Graz BCI Conference, 2019, 6–11. doi:10.3217/978-3-85125-682-6-62
Cooney, C., Folli, R., and Coyle, D. (2019). “Optimizing Layers Improves CNN Generalization and Transfer Learning for Imagined Speech Decoding from EEG,” in Conference Proceedings - IEEE International Conference on Systems, Man and Cybernetics, 2019-Octob(Dl), 1311–1316. doi:10.1109/SMC.2019.8914246
Correia, J. M., Caballero-Gaudes, C., Guediche, S., and Carreiras, M. (2020). Phonatory and Articulatory Representations of Speech Production in Cortical and Subcortical fMRI Responses. Sci. Rep. 10 (1), 1–14. doi:10.1038/s41598-020-61435-y
Deng, S., Srinivasan, R., Lappas, T., and D'Zmura, M. (2010). EEG Classification of Imagined Syllable Rhythm Using Hilbert Spectrum Methods. J. Neural Eng. 7 (4), 046006. doi:10.1088/1741-2560/7/4/046006
García, A. A. T., García, C. A. R., and Pineda, L. V. (2012). “Toward a Silent Speech Interface Based on Unspoken Speech,” in BIOSIGNALS 2012 - Proceedings of the International Conference on Bio-Inspired Systems and Signal Processing, 370–373. doi:10.5220/0003769603700373
García-Salinas, J. S., Villaseñor-Pineda, L., Reyes-García, C. A., and Torres-García, A. A. (2019). Transfer Learning in Imagined Speech EEG-Based BCIs. Biomed. Signal Process. Control. 50, 151–157. doi:10.1016/j.bspc.2019.01.006
Ghosh, R., Sinha, N., Biswas, S. K., and Phadikar, S. (2019). A Modified Grey Wolf Optimization Based Feature Selection Method from EEG for Silent Speech Classification. J. Inf. Optimization Sci. 40 (8), 1639–1652. doi:10.1080/02522667.2019.1703262
Grzybek, P. (2015). “Word Length,” in The Oxford Handbook of the Word, 1–32. (Issue January 2019. doi:10.1093/oxfordhb/9780199641604.013.37
Halder, S., Rea, M., Andreoni, R., Nijboer, F., Hammer, E. M., Kleih, S. C., et al. (2010). An Auditory Oddball Brain-Computer Interface for Binary Choices. Clin. Neurophysiol. 121 (4), 516–523. doi:10.1016/j.clinph.2009.11.087
Hashim, N., Ali, A., and Mohd-Isa, W.-N. (2018). “Word-Based Classification of Imagined Speech Using EEG,” in International Conference on Computational Science and Technology, 241–251. doi:10.1007/978-981-10-8276-4doi:10.1007/978-981-10-8276-4_193January 2018
Huss, M., Kherif, F., Moscoso, F., and Hauk, O. (2006). Motor Cortex Maps Articulatory Features of Speech Sounds. 103(20), 7865–7870.
Jung, T.-P., Makeig, S., Humphries, C., Lee, T.-W., McKeown, M. J., Iragui, V., et al. (2000). Removing Electroencephalographic Artifacts by Blind Source Separation. Psychophysiology 37 (2), 163–178. doi:10.1111/1469-8986.3720163
Manca, A. D., and Grimaldi, M. (2016). Vowels and Consonants in the Brain: Evidence from Magnetoencephalographic Studies on the N1m in normal-hearing Listeners. Front. Psychol. 7 (SEP), 1–25. doi:10.3389/fpsyg.2016.01413
Martin, S., Brunner, P., Iturrate, I., Millán, J. d. R., Schalk, G., Knight, R. T., et al. (2016). Word Pair Classification during Imagined Speech Using Direct Brain Recordings. Sci. Rep. 6. doi:10.1038/srep25803
Martin, S. p., Brunner, P., Holdgraf, C., Heinze, H.-J., Crone, N. E., Rieger, J., et al. (2014). Decoding Spectrotemporal Features of Overt and covert Speech from the Human Cortex. Front. Neuroeng. 7 (MAY), 1–15. doi:10.3389/fneng.2014.00014
Matsumoto, M., and Hori, J. (2013). “Classification of Silent Speech Using Adaptive Collection,” in Proceedings of the 2013 IEEE Symposium on Computational Intelligence in Rehabilitation and Assistive Technologies, CIRAT 2013 - 2013 IEEE Symposium Series on Computational Intelligence2013 (SSCI), 5–12. doi:10.1109/CIRAT.2013.6613816
Matsumoto, M., and Hori, J. (2014). Classification of Silent Speech Using Support Vector Machine and Relevance Vector Machine. Appl. Soft Comput. 20, 95–102. doi:10.1016/j.asoc.2013.10.023
Min, B., Kim, J., Park, H.-j., and Lee, B. (2016). Vowel Imagery Decoding toward Silent Speech BCI Using Extreme Learning Machine with Electroencephalogram. Biomed. Res. Int. 2016, 1–11. doi:10.1155/2016/2618265
Mohanchandra, K., and Saha, S. (2016). A Communication Paradigm Using Subvocalized Speech: Translating Brain Signals into Speech. Augment Hum. Res. 1 (1). doi:10.1007/s41133-016-0001-z
Morooka, T., Ishizuka, K., and Kobayashi, N. (2018). “Electroencephalographic Analysis of Auditory Imagination to Realize Silent Speech BCI,” in 2018 IEEE 7th Global Conference on Consumer Electronics (GCCE 2018), 73–74. doi:10.1109/GCCE.2018.8574677
Nguyen, C. H., Karavas, G. K., and Artemiadis, P. (2018). Inferring Imagined Speech Using EEG Signals: A New Approach Using Riemannian Manifold Features. J. Neural Eng. 15 (1), 016002. doi:10.1088/1741-2552/aa8235
Nieto, N., Peterson, V., Rufiner, H. L., Kamienkoski, J., and Spies, R. (2021). “Thinking Out Loud”: an Open-Access EEG-Based BCI Dataset for Inner Speech Recognition. BioRxiv 2021, 440473. doi:10.1101/2021.04.19.440473
Panachakel, J. T., Ramakrishnan, A. G., and Ananthapadmanabha, T. V. (2020). A Novel Deep Learning Architecture for Decoding Imagined Speech from EEG. Arxiv Priprint Available at: http://arxiv.org/abs/2003.09374.
Pawar, D., and Dhage, S. (2020). Multiclass covert Speech Classification Using Extreme Learning Machine. Biomed. Eng. Lett. 10 (2), 217–226. doi:10.1007/s13534-020-00152-x
Pei, X., Barbour, D. L., Leuthardt, E. C., and Schalk, G. (2011). Decoding Vowels and Consonants in Spoken and Imagined Words Using Electrocorticographic Signals in Humans. J. Neural Eng. 8 (4), 046028. doi:10.1088/1741-2560/8/4/046028
Popov, D., Gapochkin, A., and Nekrasov, A. (2018). An Algorithm of Daubechies Wavelet Transform in the Final Field when Processing Speech Signals. Electronics 7 (7), 120–210. doi:10.3390/electronics7070120
Pressel Coretto, G. A., Gareis, I. E., and Rufiner, H. L. (2017). “Open Access Database of EEG Signals Recorded during Imagined Speech,” in 12th International Symposium on Medical Information Processing and Analysis, 10160, 1016002. doi:10.1117/12.2255697
Rezazadeh Sereshkeh, A., Trott, R., Bricout, A., and Chau, T. (2017). EEG Classification of Covert Speech Using Regularized Neural Networks. Ieee/acm Trans. Audio Speech Lang. Process. 25 (12), 2292–2300. doi:10.1109/TASLP.2017.2758164
Riaz, A., Akhtar, S., Iftikhar, S., Khan, A. A., and Salman, A. (2015). “Inter Comparison of Classification Techniques for Vowel Speech Imagery Using EEG Sensors,” in 2014 2nd International Conference on Systems and Informatics (ICSAI 2014), 712–717. doi:10.1109/ICSAI.2014.7009378
Runge, C. A., and Hosford-Dunn, H. (2016). Word Recognition Performance with Modified CID W-22 Word Lists. J. Speech Hear. Res. 28 (September 1985), 355–362. doi:10.1044/jshr.2803.355
Sree, R. A., and Kavitha, A. (2017). “Vowel Classification from Imagined Speech Using Sub-band EEG Frequencies and Deep Belief Networks,” in 2017 4th International Conference on Signal Processing, Communication and Networking (ICSCN 2017), 16–19. doi:10.1109/ICSCN.2017.8085710
Torres-García, A. A., Reyes-García, C. A., Villaseñor-Pineda, L., and Ramírez-Cortés, J. M. (2013). Análisis de señales electroencefalográficas para la clasificación de habla imaginada. Revista Mexicana de Ingenieria Biomedica 34 (1), 23–39.
Wang, J., Green, J. R., Samal, A., and Yunusova, Y. (2013). Articulatory Distinctiveness of Vowels and Consonants: A Data-Driven Approach. J. Speech Lang. Hear. Res. 56 (5), 1539–1551. doi:10.1044/1092-4388(2013/12-0030doi:10.1044/1092-4388(2013/12-0030)
Wellington, S., and Clayton, J. (2019). Fourteen-channel EEG with Imagined Speech (FEIS) Dataset. doi:10.5281/zenodo.3554128
Wolpaw, J. R., Birbaumer, N., McFarland, D. J., Pfurtscheller, G., and Vaughan, T. M. (2002). Brain-Computer Interfaces for Communication and Control. Clin. Neurophysiol. 113, 767–791. doi:10.3389/conf.fnins.2010.05.00007doi:10.1016/s1388-2457(02)00057-3
Xiaomei Pei, X., Hill, J., and Schalk, G. (2012). Silent Communication: Toward Using Brain Signals. IEEE Pulse 3 (1), 43–46. doi:10.1109/MPUL.2011.2175637
Keywords: EEG Decoding, Imagined speech, Monosyllabic words, Brain-Computer interface, Open access data
Citation: Varshney YV and Khan A (2022) Imagined Speech Classification Using Six Phonetically Distributed Words. Front. Sig. Proc. 2:760643. doi: 10.3389/frsip.2022.760643
Received: 23 August 2021; Accepted: 26 January 2022;
Published: 25 March 2022.
Edited by:
Ahsan H. Khandoker, Khalifa University, United Arab EmiratesReviewed by:
Khalil Iskarous, University of Southern California, United StatesCopyright © 2022 Varshney and Khan. This is an open-access article distributed under the terms of the Creative Commons Attribution License (CC BY). The use, distribution or reproduction in other forums is permitted, provided the original author(s) and the copyright owner(s) are credited and that the original publication in this journal is cited, in accordance with accepted academic practice. No use, distribution or reproduction is permitted which does not comply with these terms.
*Correspondence: Azizuddin Khan, a2hhbmF6aXpAaWl0Yi5hYy5pbg==
Disclaimer: All claims expressed in this article are solely those of the authors and do not necessarily represent those of their affiliated organizations, or those of the publisher, the editors and the reviewers. Any product that may be evaluated in this article or claim that may be made by its manufacturer is not guaranteed or endorsed by the publisher.
Research integrity at Frontiers
Learn more about the work of our research integrity team to safeguard the quality of each article we publish.