 Christos Chatzichristos1*
 Lauren Swinnen2
 Jaiver Macea2Miguel Bhagubai1
 Wim Van Paesschen2
 Maarten De Vos1,3
- 1Department of Electrical Engineering, STADIUS Center for Dynamical Systems, Signal Processing and Data Analytics, KU Leuven, Leuven, Belgium
- 2Laboratory for Epilepsy Research, Department of Neurology, University Hospitals, KU Leuven, Leuven, Belgium
- 3Department Development and Regeneration, KU Leuven, Leuven, Belgium
Patients with absence epilepsy fail to report almost 90% of their seizures. The clinical gold standard to assess absence seizures is video-electroencephalography (vEEG) recorded in the hospital, an expensive and obtrusive procedure which requires also extended reviewing time. Wearable sensors, which allow the recording of electroencephalography (EEG), accelerometer and gyroscope have been used to monitor epileptic patients in their home environment for the first time. We developed a pipeline for accurate and robust absence seizure detection while reducing the review time of the long recordings. Our results show that multimodal analysis of absence seizures can improve the robustness to false alarms, while retaining a high sensitivity in seizure detection.
1 Introduction
Absence seizures are the main seizure type in various idiopathic generalized epilepsy syndromes, among others, in juvenile absence epilepsy (JAE) (Hirch et al., 2022). Typical absence seizures are characterized by motor arrest and impaired awareness. On the electroencephalogram (EEG), they are visualized by 3–4.5 Hz generalized spike-and-wave discharges. In patients with JAE, lifelong treatment with antiseizure medications may be required as relapse after withdrawal is high (83%) (Hirch et al., 2022). Even patients who are considered to be seizure free under treatment, can still relapse (25%).
It is, therefore, paramount to accurately detect absence seizures in order to improve therapeutic decisions. However, the subtle clinical manifestation of absence seizures hampers the patient’s and the caregiver’s ability to correctly report the seizure in the seizure diary. In studies with patients with absence seizures, 86%–94% of the absences are not reported (Keilson et al., 1987; Akman et al., 2009; Swinnen et al., 2021). As such, the seizure diary is an unreliable method, although commonly used in clinical practice as well as surrogate endpoint in trials for antiseizure medication (Fisher et al., 2012).
Current diagnostics are based on the clinical history and in-hospital monitoring of seizures with video-EEG (which is considered the gold-standard for seizure detection). Hence, devices that could record the seizures during normal everyday life conditions could facilitate a better logging of the seizure events, as the use of ambulatory EEG is limited due to the complexity of placement and the visibility and constraints in daily life.
An explosion in the capability of monitoring individuals via sensors built into smartphones or wearable devices has been taking place. Following the views of the patients, the devices need to be “as ‘normal’ as possible,” “non-stigmatizing” and “non-intrusive” (Bruno et al., 2018). Furthermore, the majority of the patients were willing to use a wearable device for long-term seizure tracking, envisaged by the possibility of understanding their condition better. The detection of absence seizures with wearable devices is a very suitable use-case, since the number and location of electrodes is likely to be less important than in focal epilepsies (Duun-Henriksen et al., 2012).
However, the clinical adoption of wearable EEG remains challenging, since no phase-4 clinical study, proving the feasibility and comfort of the device in a home environment, has yet been conducted. Furthermore, there are challenges regarding the signal quality and the time needed by the neurologists to annotate the data. Hence, research for automated seizure detection algorithms, tailored for wearable EEG, is still in its infancy, especially in wearable detection of absence seizures (Kjaer et al., 2017; Dan et al., 2020; Swinnen et al., 2021; Japaridze et al., 2022), (semi) automated seizure detection would facilitate the adoption of EEG wearables in clinical practice. Furthermore, even the annotation of wearable EEG data, compared to vEEG, is not trivial (Zhang et al., 2022).
In a previous paper (Swinnen et al., 2021), we reported the performance of an EEG-based wearable, CE marked device to detect absence seizures, the Sensor Dot (SD; Byteflies). SD is a discrete, user-friendly wearable that consists of four electrodes, creating two ipsilateral channels. This device was developed during SeizeIT1 (2016–2019). The initial results currently reported belong to an extension of SeizeIT1, SeizeIT2 which is a larger multicenter trial with focus on clinical validation of the SD in people with typical absence, focal impaired awareness, and generalized tonic–clonic seizures (EIT Health: SeizeIT2, clinicaltrials.gov: NCT04284072) (EIT Health, 2020).
In the same paper we proposed a novel automated absence detection algorithm which achieved a mean sensitivity of 0.983 in the detection of absence seizures, with mean False Alarm (FA) per hour equal to 0.9138. The use of the automated algorithm reduced the review time of a 24 h recording from 1 to 2 h to around 5–10 min for the neurologists.
Nevertheless, the reported results in (Swinnen et al., 2021) were obtained from data acquired within the hospital environment. We argued that the first phase of the recording of each patient will consist of routine monitoring in the EMU after which these data can be used to train the algorithm. The obtained classifier can be used to detect seizures from the data acquired when the patient wears the SD at home. Similar assumptions are being made by all of the aforementioned studies with wearable devices and absence seizure detection. Even in the phase-3 clinical trial of Epihunter (Japaridze et al., 2022), the data were not obtained in an actual home environment [as proposed in (Beniczy and Ryvlin, 2018)].
As observed from the data obtained from the patients in the home environment with SD, the performance of the automated seizure annotation was lower, compared to the performance of the algorithm trained and tested with data obtained in the hospital (Swinnen et al., 2021), especially in terms of FAs. In the current paper we will present a pipeline for the automated absence seizure detection for in-home monitoring, which will be tested and validated, for the first time, with data obtained from patients with absence seizures in their home environment. The focus of the current paper will only be the algorithmic pipeline, used to flag the possible seizures, the physiological findings of the home studies will be released in future publications. The goal of the pipeline is to be used by the neurologists in the rest of the subjects and reduce the time needed to annotate the data. The neurologists are requested instead of reviewing the whole recording to only review the provided alarms from the algorithm.
2 Materials and methods
2.1 Patients
The current home-based phase of the SeizeIT2 study, is a follow up of the phase-2 clinical study of SeizeIT2 presented in (Swinnen et al., 2021). In total 13 patients were enrolled in two epilepsy centers: University Hospital Leuven and University Hospital Freiburg. Patients with a confirmed electroclinical diagnosis of refractory Juvenile Absence Epilepsy were enrolled between 11 March and 15 June 2022 if they had previously participated in the in-hospital phase (Phase 2 study). Here, we used data of the first four patients (mean age = 21 years; 3 female, 1 male) that were enrolled, to explore the algorithmic pipeline.
In addition we included one patient with refractory absence epilepsy, which is part of a long term monitoring study in patients with different seizure types (Plug&Patch—PnP, clinicaltrials.gov: NCT04642105), who had only measured EEG at home with SD.
All patients from the trials gave written informed consent and the studies were approved by the ethics committee of UZ/KU Leuven.
2.2 Data collection
The patients had been initially admitted to UZ Leuven and were followed for a 24-h vEEG monitoring (Schwarzer EEG amplifier, O.S.G.) using the standardized 25- electrode array of the International Federation of Clinical Neurophysiology. Behind each ear, two additional Ag/AgCl cup electrodes (Ambu Neuroline cup, Ambu) were attached on the mastoid bone for concomitant recording with the SD. The SD, a small device of 24.5 × 33.5 × 7.73 mm (mm) and 6.3 g, was attached on the upper back using a patch (Figure 1), and two bipolar channels were created by connecting the ipsilateral top and lower electrode. Impedance was
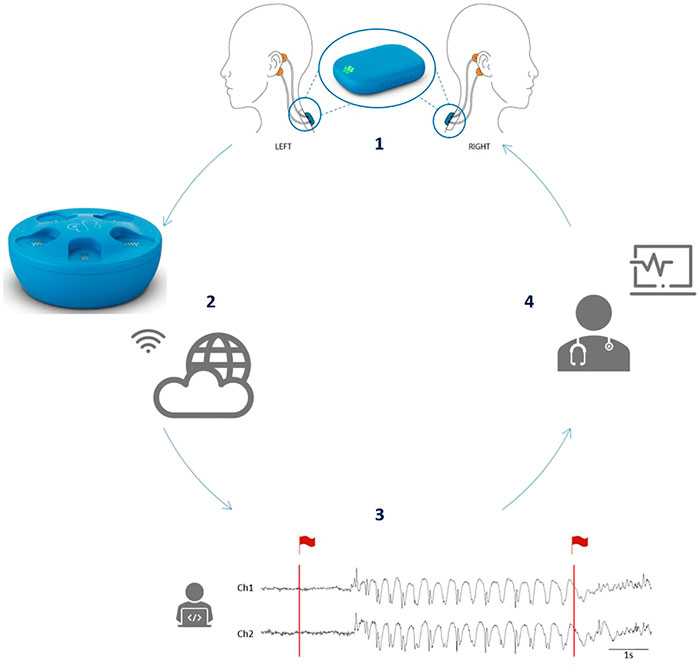
FIGURE 1. The full concept enabled by the use of the SD. (1) Four electrodes (in orange) are placed behind the ears of the patient and connected to the mobile EEG device, the SD, which is attached to the upper back via an adhesive (in blue). An enlarged image of the SD is given in the circle. (2) After 24 h of recording, the SD is placed in the docking station which will allow recharging of the battery. In addition, when the SD is in the docking station, the SD EEG data will be automatically uploaded to the cloud via a WiFi connection. (3) Afterwards, the absence detection algorithm will analyze the data and flag segments of interest (in red). (4) Finally, the flagged data are send back to the treating neurologist who can then review the SD EEG data in a very short time. (Figure reused from Swinnen et al., 2021).
For the home-based study, all five patients received via post the SD kit (Byteflies, Belgium), containing the two-channel EEG-based SDs, the EEG-holder, the docking station, and four Ambu BRS neonatal electrocardiography (ECG) adhesive electrodes, here used for behind-the-ear EEG. The Inertial Measurement Unit (IMU) is embedded in the SD and are collected simultaneously with the EEG data. They received instructions on paper and via phone call on how to install the docking station and connect it to Wi-Fi in order to allow upload of SD data to the cloud. They were also instructed on how to place the electrodes behind the ears on the mastoid bone, two on each side of the head, with the upper and lower electrode being approximately 5 cm apart. Electrodes on the same side had to be connected to create two ipsilateral, left and right, EEG channels. Impedance was not checked in the home-environment. Four of the patients had one SD recording at home lasting 22, 23, 24, and 24 h, respectively. The fifth patient had SD recordings at home during 16–24 h per day, twice per week for several months1.
2.3 Pipeline for the ML-based seizure detection
The pipeline that we have used for the analysis of the in-home recordings consists of several blocks (Figure 2). The main Machine Learning (ML) algorithm is similar to the one used in (Swinnen et al., 2021) with minor modifications (as will be described). Extra blocks have been added in order to detect movement artifacts, flat lines and disconnected electrodes which constitute a significant portion of the in-home recordings. All the pipeline blocks will be described in detail in the following subsections.
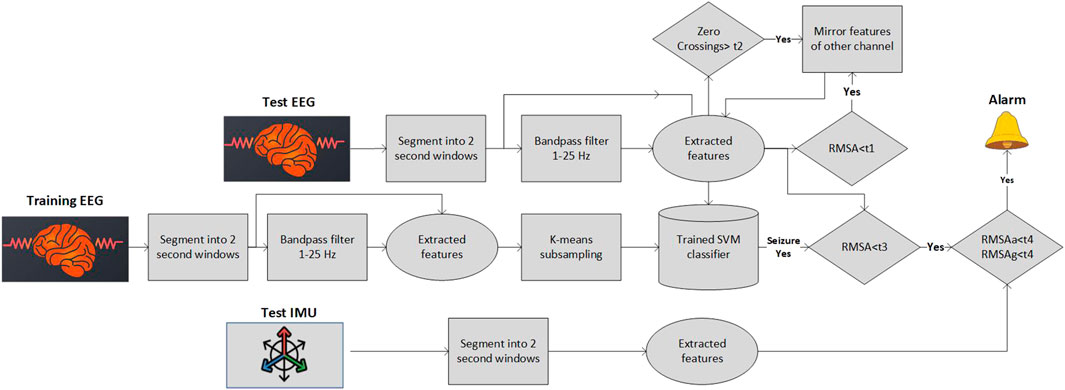
FIGURE 2. The pipeline for the analysis of the home data recordings.
2.3.1 Preprocessing and segmentation
Each EEG SD channel was filtered with a bandpass filter (1–25 Hz). Subsequently, the data were segmented in 2-s windows with 50% overlap. The same segmentation process was performed for the signals of the IMU, the accelerometer and the gyroscope, which is embedded in SD.
2.3.2 Balancing the classes
The seizure detection task is a highly unbalanced problem. Limited number of seizure segments exist and the background (non-seizure) segments are dominant. As noted in (Swinnen et al., 2021) when a random subsampling of the background data is implemented the algorithm suffers from stability issues, with high standard deviation of the sensitivity and the false alarm rate. Therefore, different under-sampling approaches have been tested and we opted for the use of an adapted version of the cluster-based under-sampling approach (Yen and Lee, 2009). The number of background samples, Nk, selected from each cluster k was set equal to
2.3.3 Feature calculation
The feature set used in this study is similar to the one used in (Swinnen et al., 2021). The feature set was chosen among the features used in (Kjaer et al., 2017) and in (Vandecasteele et al., 2020) after performing Random Forest selection (Deviaene et al., 2019). Our final feature set is given in Table 1. The thirteen different features were extracted from each window and each channel separately. Due to the subject dependent differences in the amplitude of the EEG over time, normalization of the features was needed to achieve optimal detection of seizure events. We have used the median decaying memory as the optimal normalization method for line length features. The main difference between the feature set used in (Swinnen et al., 2021) is the fact that the zero crossings were computed from the raw signal and not the filtered one. Similarly to Swinnen et al. (2021) all the frequency domain features were derived using the raw signal.
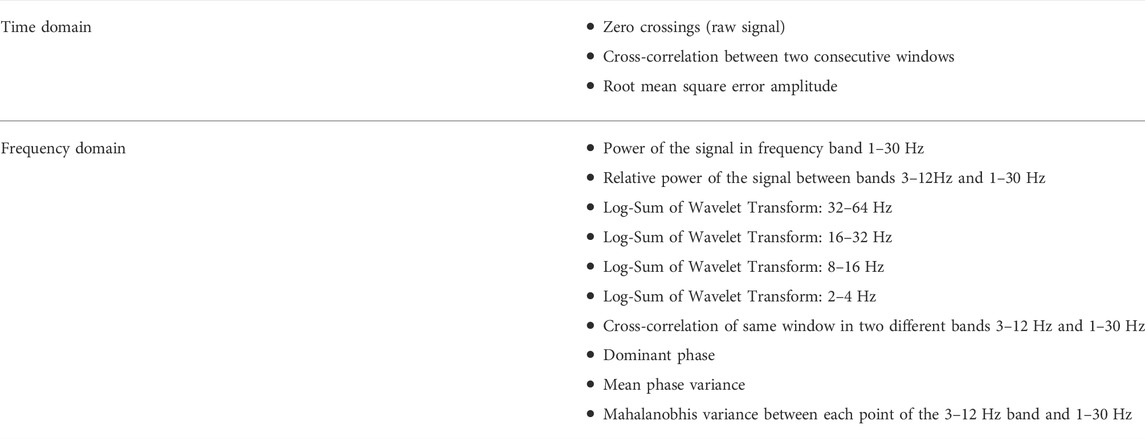
TABLE 1. Feature set of EEG.
2.3.4 Discarding of bad quality segments
We noticed that in home recordings there are some segments (not whole recordings) that one of the channels is either flat, or disconnected. In such cases, the original algorithm that was developed to detect seizures based on two channels is not able to capture the seizure solely from the remaining, non-artifacted channel (e.g., such a case can be seen in Figure 3). We do not want to discard the complete recording or the whole channel for the entire recording in order to maximize the data utility. In every segment (window of 2 s) we check the zero-crossings of the raw signal and the Root Mean Squared Amplitude (RMSA) of the filtered signal. RMSA equal (or very close) to zero indicates a flat line, a very big number of zero-crossings per segment indicates a possible misplacement of the electrode (high impedance). Hence, we have set two different thresholds t1 = 0.01 and
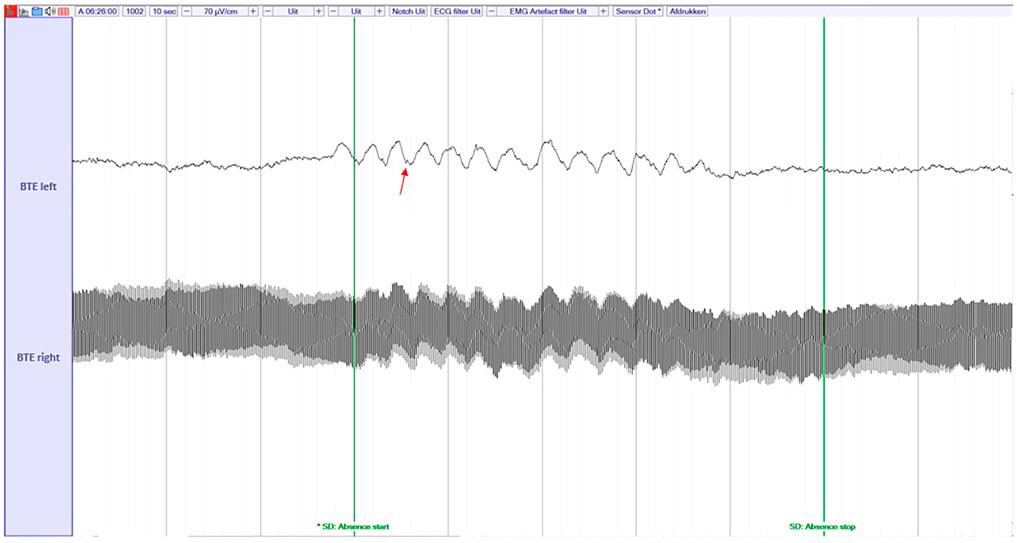
FIGURE 3. An example of disconnected channel (low impedance) during an absence seizure. The absence seizure can be detected by the spike-and-wave discharges (red arrow) on the remaining channel. The raw, unfiltered signal is shown here.
2.3.5 Training and classification
A weighted Support Vector Machine (SVM) with a radial basis function kernel was used as classifier. Even though a cluster-sized sub-sampling method was used for balancing the clusters, still the ratio m was not set to one but equal to m = 25, which is why the weighted version of the classifier was used. The weights given to each non-seizure and seizure data point were
Three different approaches are being used for the training of the SVM model, based on the availability of the data (Figure 4). We opted for different alternatives for the detection pipeline since the amount of data collected per patient in the home environment fluctuates among different studies (e.g., SeizeIt2 and PnP). The available in-home data determines the best training scheme for the ML models.
• Train with data of the test patient obtained during first day of in-home recording. The first day shall be annotated by the neurologists. This approach shall be used when multiple days exist (PnP study).
• Train with the hospital data of the patient. In this case the post-processing (explained in next subsection) must be softer in order to capture all the seizures. A bigger number of FAs is expected
• Train with annotated home data from other patients (if available) and “personalize” with the hospital data of the test patient.
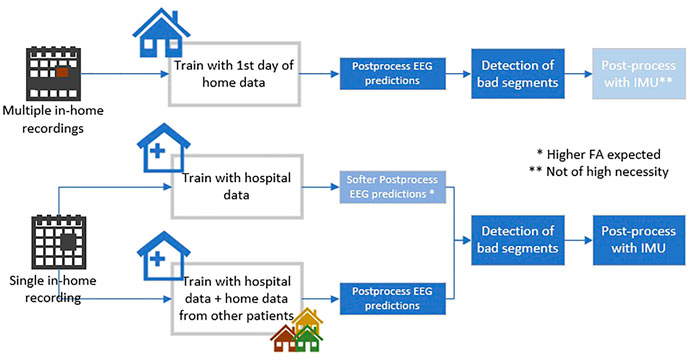
FIGURE 4. The different options for the analysis of the home data recordings based on the amount of available data.
The values of the hyperparameters, which resulted in the maximum sensitivity in the training set, were selected for the test set (in our use-case we were looking for maximum sensitivity to mark all possible events after which they were reviewed by an epileptologist). Hence, the hyperparameter search is not likely to overfit the dataset as it is only exposed to the training set.
2.3.6 Multimodal postprocessing
In (Swinnen et al., 2021) (where our models were trained and validated only with in-hospital data) we had a single EEG-based postprocessing rule. As mentioned before with the data obtained from the home of the patients we noticed high FAs rates. Most of the FAs were arising from the movement of the patients within their home environment, which was not present in hospital. In order to minimize the FAs we employed the accelerometer and gyroscope data obtained from IMU. The use of IMU and Electromygraphy (EMG) data in a multimodal framework is common for the detection of tonic-clonic seizures (Milošević et al., 2016) but has never been employed in the context of absence seizure detection.
Four different postprocessing rules were set:
• If the (normalized) RMSA of the segment is above t3 = 200 μV the segment is considered as artifact and no alarm is provided
• An alarm for seizure detection is given only when three consecutive windows were noted as seizures
• Whenever two seizures (of three windows each) were separated only by one non-seizure window, they were merged
• If the standard deviation either of the accelerometer or of the gyroscope is above a specific threshold t4 = 0.05 then the specific EEG segment is considered a movement artifact and no alarm is provided. The multimodal postprocessing based on the IMU data has significantly decreased the FAs in some patients.
3 Results
In this section we will provide some initial results from the two home studies. The selection of the recordings of the patients that were analyzed was based on the number of seizures. We selected the first four patients of SeizeIt2 recorded in 2022 that had at least one absence seizure and the first 6 days of the first absence patient of PnP study for which at least one seizure was recorded. In both datasets, the onset and end of all 3-Hz generalized spike- and- wave discharges (SWD), lasting 3 s or more1, were marked by neurologists. We will refer to these annotations as “absences,” these annotations were used as the ground truth for the performance metrics that will be presented.
In this section we will try to justify and explain the usability of the different blocks of our pipeline. We will compare the results with the three different training options and to the algorithm presented in (Swinnen et al., 2021) that was tested only with in-hospital recordings. We must note that for the PnP patient no in-hospital recording exists, hence only the first training option will be used. For the SeizeIt2 patients since we have a single day of in-home recordings we will use options two and three for training.
The following metrics were applied to determine the performance of the seizure detection algorithm [following the definitions in Vandecasteele et al. (2020)]:
• Sensitivity:
• FAs/h. FAs within 3 s of each other were counted as one FA.
We will not report specificity measures since for all cases the specificity was above 99%, due to the highly imbalanced classes.
As can be noted from Table 2 in the PnP patient, the postprocessing decreases significantly the Fas/h, with a slight decrease of the sensitivity in most of the recordings. The removal of the bad segments (column 4) retains the low FA rate but increases the Sensitivity, reaching 1 in almost all of the days. There is minor influence from the postprocessing with the IMU data.
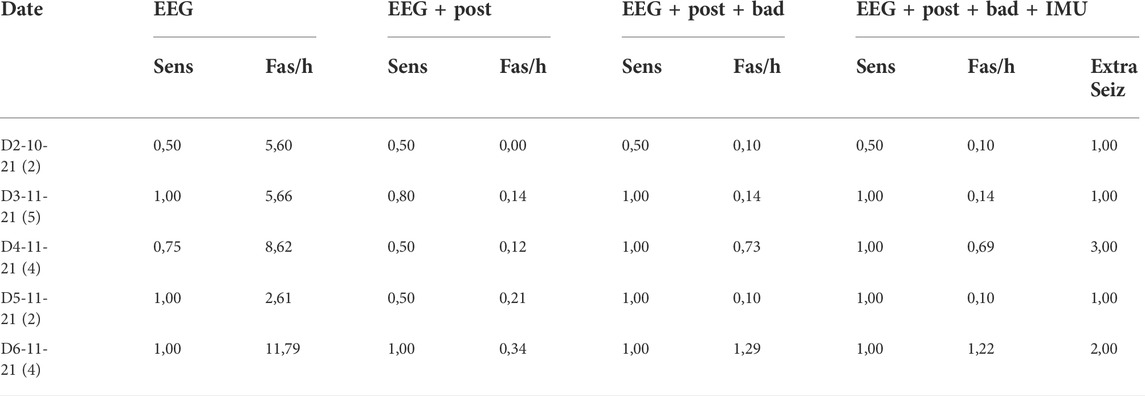
TABLE 2. Results of the PNP patient trained with the first day of in-home recording. In the first column in parenthesis the total number of seizures per subject. In the last column the number of seizures missed by the neurologists and detected by the algorithm can be viewed (in the metrics they are counted as FAs though).
For the SeizeIt2 data (Table 3) we can see that the postprocessing has similar effect as in the PnP patient. We shall note the tremendous decrease in the FAs/h for Subj-3. Furthermore, the IMU postprocessing results in a slight decrease in the sensitivity in Subj-3. The decrease is due to the activity noticed in accelerometer and gyroscope during two seizures (Figure 5). We note the very low performance of all the versions of the algorithm in the last Subject.

TABLE 3. Results of the SeizeIt2 patients trained with the hospital recordings. In the first column in parenthesis the total number of seizures per subject.

FIGURE 5. One of the two seizures that were missed when the multimodal post processing was used. In this rare case we can see activity both in gyroscope and accelerometer during this short absence.
When we train the SVM with data obtained from home recordings of other patients and “personalize” it with the hospital recording of the test patient (Option 3- Figure 4), we note that the performance in Subj-4 increases significantly and is comparable to the other Subjects (Table 4). There is a minor effect to the rest of the Subjects.
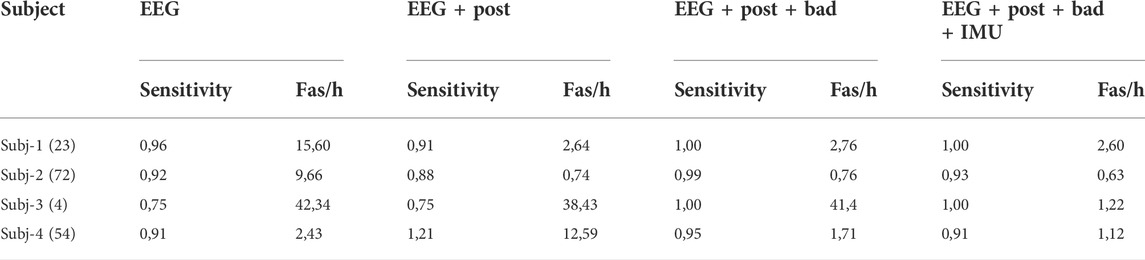
TABLE 4. Results of the SeizeIt2 patients trained with the hospital recordings + in-home recordings of other patients. In the first column in parenthesis the total number of seizures per subject.
We must note that both for the PnP subject and the SeizeIt2 subjects, the algorithm found some seizures that were missed by the neurologists (and are currently counted as FAs, since they were not included in the gold standard). More specifically for the PnP subject eight seizures were found that were initially missed by the neurologist (the extra seizures per recording can be viewed in the last column of Table 2), while for the SeizeIt2 subjects 1 seizure was found (examples of missed seizures can be viewed in Figure 6.
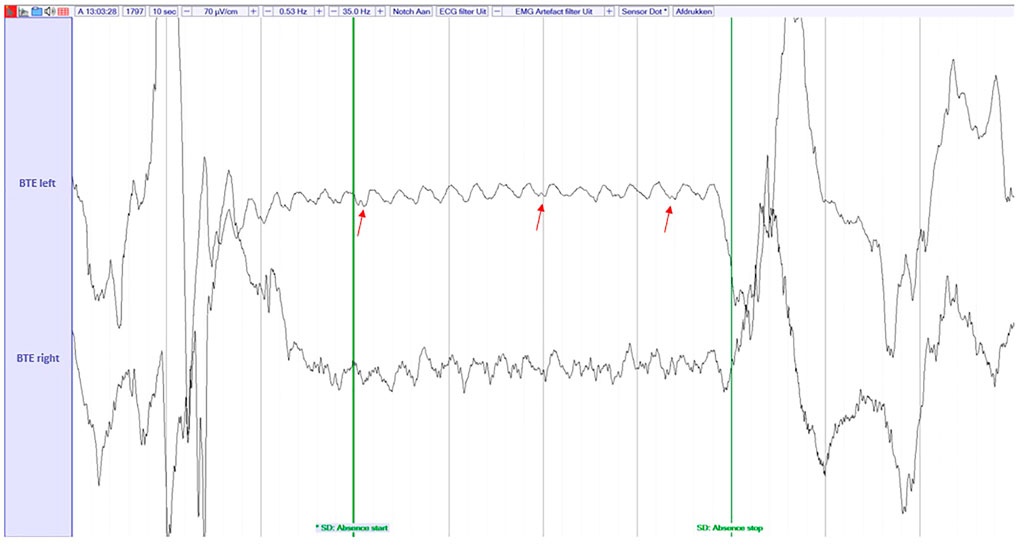
FIGURE 6. An example of an absence seizure missed by the reviewer in the PnP study, but captured by the ML algorithm. The signal is filtered with a highpass filter of 0.53 Hz, a lowpass filter of 35 Hz and a Notch filter of 50 Hz. The EEG was visualized at a sensitivity of 70 μV/cm. These settings were also used by the reviewers during the review process. The red arrows point the spike-and-wave discharges.
4 Discussion
According to the standards for testing and clinical validation of seizure detection devices (Beniczy and Ryvlin, 2018), our studies can be classified as a phase-4 study, since the accuracy and usability of the SD in a home environment is investigated in a multicenter trial (EIT Health: SeizeIT2, clinicaltrials.gov: NCT04284072). To the best of our knowledge, these are the first (preliminary) results of a phase-4 trial of an automated detection of absence seizures with a wearable device. As mentioned in the introduction the full analysis and report for the findings of the study will follow in another publication and the main focus of this paper is to investigate design choices in the pipeline used for the automatic detection of the seizure events.
The current state-of-the art have failed to provide accurate detection of the absence seizures with the home data mainly due to the high FA rate obtained. We have exhibited that our pipeline provides accurate detection of the absence seizures with very high sensitivity and low FAs/h. Furthermore, it managed to detect seizures that were initially missed by the neurologists. We shall note the difference in the amount of seizures missed by the two neurologists in the different studies which is probably due to the multiple recordings in the span of several months for the PnP study. The large amount of EEG data requires extended time for annotation of the seizures, hence, lower performance might be expected by the annotators. The need of automated seizure detection pipelines is evident when large amount of data are acquired. The lower signal quality of the in-home recordings and the presence of artifacts that did not exist in the hospital recordings, dictate the use of alternative blocks in our pipeline.
Furthermore, we have exhibited for the first time the added value of multimodality in the context of absence seizure detection. Multimodal seizure detection has been widely used for the detection of motor seizures (Leijten, 2017) and focal seizures (Vandecasteele et al., 2021). However, multimodal approaches have not been employed for the detection of absence seizures, mainly due to lack of movement or heart rate variability during typical absence seizures. We have shown that detection of movement with SD can help into distinguishing seizure events from movement and dramatically decrease FAs (Subj-3, SeizeIt2).
The thresholding based on the standard deviation of the IMU signals was adopted in order to decrease the significant amount of FAs that were caused by the movement of everyday life. The hospital data do not include such movement segments, hence, the classifier, when trained only with hospital data do not recognize those segments as background but as seizure segments. “Turning off” the IMU postprocessing can result in a detection of a very limited number of seizures, similar to the one presented in Figure 5, for which the standard deviation (std) of the IMU data is above the threshold.
The current pipeline uses IMU modality only for postprocessing, an initial attempt to use an hierarchical clustering for detection of walking and running artifacts had inferior performance to the simple threshold-based postprocessing. However, different “true” fusion approaches (Chatzichristos et al., 2022) either early or late ones will be further explored.
Concerning the different training approaches that we have proposed we can note that it seems that in some cases (Subj-4, SeizeIt2) the in-hospital data differ a lot from the in-home data. In such cases the addition to the training set of data from in-home recordings of other patients can be beneficial. When multiple days of in-home recordings exist the training of the model with labelled data from one of the days provides the best performance. We recommend the use of the first option of the pipeline if there are multiple day recordings per subjects and the third pipeline when a single day of recording exist per subject.
Further work will aim to independently replicate those results with the data collected from the different centers that participate in SeizeIt2 and with the rest of the patients from UZ Leuven. Correct interpretation of artifacts in SD recordings will also be helpful in the detection of other seizure types and reduction of FA in the home setting.
Furthermore, when the amount of the data collected allows, we will study approaches based on Neural Networks which have shown significant success in several seizure detection applications (Chatzichristos et al., 2020; Japaridze et al., 2022), very recently even with the detection of absence seizures with two-channel EEG (Hartmann et al., 2022).
Data availability statement
The datasets presented in this article are not readily available because The dataset will be available after communication with the coauthor WV and after the results of the full study will be released. Requests to access the datasets should be directed to wim.vanpaesschen@uzleuven.be.
Ethics statement
The studies involving human participants were reviewed and approved by Ethics comitee of UZ/KU Leuven. The patients/participants provided their written informed consent to participate in this study.
Author contributions
CC wrote the main part of the paper and developed the pipeline for the analysis of absence seizures, LS and JM annotated the seizures, wrote part of the manuscript, and helped in the collection of the data. MB helped into the design of the multimodal fusion and tested alternative versions. WV and MD contributed to conception and design of the study as well as the analysis approach followed. All authors contributed to manuscript revision, read, and approved the submitted version.
Funding
EIT Health Grant: 21,263—SeizeIT2: Discreet Personalized Epileptic Seizure Detection Device. SeizeIT started out as an imec. icon research project (2016–2019), and currently continues as an EIT Health funded initiative (2020–2021). Project partners are KU Leuven, UCB Pharma, Byteflies and Pilipili, Neuroventis, Karolinska Institute, Aachen UMC, UH Freiburg, Oxford University Hospitals NHS, King’s College London and CHUC Coimbra. This research received funding from the Flemish Government under the “Onderzoeksprogramma Artifici’ele Intelligentie (AI) Vlaanderen” program.
Conflict of interest
The authors declare that the research was conducted in the absence of any commercial or financial relationships that could be construed as a potential conflict of interest.
Publisher’s note
All claims expressed in this article are solely those of the authors and do not necessarily represent those of their affiliated organizations, or those of the publisher, the editors and the reviewers. Any product that may be evaluated in this article, or claim that may be made by its manufacturer, is not guaranteed or endorsed by the publisher.
References
Akman, C. I., Montenegro, M. A., Jacob, S., Eck, K., Chriboga, C., and Gilliam, F. (2009). Seizure frequency in children with epilepsy: Factors influencingaccuracy and parental awareness. Seizure 18, 524–529. doi:10.1016/j.seizure.2009.05.009
Beniczy, S., and Ryvlin, P. (2018). Standards for testing and clinical validation of seizure detection devices. Epilepsia 59, 9–13. doi:10.1111/epi.14049
Bruno, E., Simblett, S., Lang, A., Biondi, A., Odoi, C., Schulze-Bonhage, A., et al. (2018). Wearable technology in epilepsy: The views of patients, caregivers, and healthcare professionals. Epilepsy & Behav. 85, 141–149. doi:10.1016/j.yebeh.2018.05.044
Chatzichristos, C., Dan, J., Narayanan, A. M., Seeuws, N., Vandecasteele, K., De Vos, M., et al. (2020). Epileptic seizure detection in eeg via fusion of multi-view attention-gated u-net deep neural networks. IEEE SPMB.
Chatzichristos, C., Kofidis, E., Van Paesschen, W., Lathauwer, L. D., Theodoridis, S., and Van Huffel, S. (2022). Early soft and flexible fusion of electroencephalography and functional magnetic resonance imaging via double coupled matrix tensor factorization for multisubject group analysis. Hum. Brain Mapp. 43, 1231–1255. doi:10.1002/hbm.25717
Dan, J., Vandendriessche, B., Paesschen, W. V., Weckhuysen, D., and Bertrand, A. (2020). Computationally-efficient algorithm for real-time absence seizure detection in wearable electroencephalography. Int. J. Neural Syst. 30, 2050035. doi:10.1142/s0129065720500355
Deviaene, M., Testelmans, D., Borzée, P., Buyse, B., Van Huffel, S., and Varon, C. (2019). “Feature selection algorithm based on random forest applied to sleep apnea detection,” in Annual international conference of the engineering in medicine and biology society (EMBC).
Duun-Henriksen, J., Madsen, R., Remvig, L. S., Thomsen, C. E., Sorensen, H. B., and Kjaer, T. W. (2012). Automatic detection of childhood absence epilepsy seizures: Toward a monitoring device. Pediatr. Neurol. 46, 287–292. doi:10.1016/j.pediatrneurol.2012.02.018
EIT Health (2020). SeizeIT2: Discreet, personalised epileptic seizure detection device. Available from: https://eithealth.eu/project/seizeit2.
Fisher, R. S., Blum, D., DiVentura, B., Vannest, J., Hixson, J. D., Moss, R., et al. (2012). Seizure diaries forclinical research and practice: Limitations and future prospects. Epilepsy Behav. 24, 304–310. doi:10.1016/j.yebeh.2012.04.128
Guo, J., Kim, R., Chen, Y., Negishi, M., Jhun, S., Weiss, S., et al. (2016). Impaired consciousness in patients with absence seizures investigated by functional MRI, EEG, and behavioural measures: A cross-sectional study. Lancet Neurol. 15, 1336–1345. doi:10.1016/s1474-4422(16)30295-2
Hartmann, M., Koren, J., Baumgartner, C., Duun-Henriksen, J., Gritsch, G., Kluge, T., et al. (2022). Seizure detection with deep neural networks for review of two-channel electroencephalogram. Epilepsia 00, 1–6. doi:10.1111/epi.17259
Hirch, E., French, J., Scheffer, I., Bogacz, A., Alsaad, T., Sperling, M., et al. (2022). Ilae definition of the idiopathic generalized epilepsy syndromes: Position statement by the ilae task force on nosology and definitions. Epilepsia 00, 1. doi:10.1111/epi.17236
Japaridze, G., Loeckx, D., Buckinx, T., Armand Larsen, S., Proost, R., Jansen, K., et al. (2022). Automated detection of absence seizures using a wearable electroencephalographic device: A phase 3 validation study and feasibility of automated behavioral testing. Epilepsia n/a.
Keilson, M. J., Hauser, A., and Tepperberg, J. (1987). Ambulatory cassette eeg in absence epilepsy. Pediatr. Neurol. 3, 273–276. doi:10.1016/0887-8994(87)90067-1
Kjaer, T. W., Sorensen, H., Groenborg, S., Pedersen, C., and Duun-Henriksen, J. (2017). Detection of paroxysms in long-term, single-channel EEG-Monitoring of patients with typical absence seizures. IEEE J. Transl. Eng. Health Med. 5, 1–8. doi:10.1109/jtehm.2017.2649491
Leijten, F. S., Andel, J., Ungureanu, C., Arends, J., Tan, F., Dijk, J., et al. (2017). Multimodal seizure detection: A review. Epilepsia 59, 42–47. doi:10.1111/epi.14047
Milošević, M., Van de Vel, A., Bonroy, B., Ceulemans, B., Lagae, L., Vanrumste, B., et al. (2016). Automated detection of tonic–clonic seizures using 3-d accelerometry and surface electromyography in pediatric patients. IEEE J. Biomed. Health Inf. 20, 1333–1341. doi:10.1109/jbhi.2015.2462079
Swinnen, L., Chatzichristos, C., Jansen, K., Lagae, L., Depondt, C., Seynaeve, L., et al. (2021). Accurate detection of typical absence seizures in adults and children using a two-channel electroencephalographic wearable behind the ears. Epilepsia 62, 2741–2752. doi:10.1111/epi.17061
Vandecasteele, K., Cooman, T. D., Dan, J., Cleeren, E., Van Huffel, S., Hunyadi, B., et al. (2020). Visual seizure annotation and automated seizure detection using behind-the-ear electroencephalographic channels. Epilepsia 61, 766–775. doi:10.1111/epi.16470
Vandecasteele, K., De Cooman, T., Chatzichristos, C., Cleeren, E., Swinnen, L., Macea Ortiz, J., et al. (2021). The power of ecg in multimodal patient-specific seizure monitoring: Added value to an eeg-based detector using limited channels. Epilepsia 62, 2333–2343. doi:10.1111/epi.16990
Yen, S. J., and Lee, Y. S. (2009). Cluster-based under-sampling approaches for imbalanced data distributions. Expert Syst. Appl. 36, 5718–5727. doi:10.1016/j.eswa.2008.06.108
Zhang, J., Chatzichristos, C., Vandecasteele, K., Swinnen, L., Broux, V., Cleeren, E., et al. (2022). Automatic annotation correction for wearable EEG based epileptic seizure detection. J. Neural Eng. 19, 016038. doi:10.1088/1741-2552/ac54c1
Footnotes
1Following (Swinnen et al., 2021) the definition was selected for research purposes only, considering that we aimed to study whether these typical EEG patterns can be equally detected by the ML algorirthm. A 3 s 3-Hz SWD might not always have a clinical correlation (Guo et al., 2016).
Keywords: epilepsy, typical absence seizures, multimodal, EEG, wearables, home monitoring, accelerometer, gyroscope
Citation: Chatzichristos C, Swinnen L, Macea J, Bhagubai M, Van Paesschen W and De Vos M (2022) Multimodal detection of typical absence seizures in home environment with wearable electrodes. Front. Sig. Proc. 2:1014700. doi: 10.3389/frsip.2022.1014700
Received: 08 August 2022; Accepted: 26 September 2022;
Published: 17 October 2022.
Edited by:
Massimo Walter Rivolta, University of Milan, ItalyReviewed by:
Stefania Coelli, Politecnico Di Milano, ItalyFerruccio Panzica, Carlo Besta Neurological Institute Foundation (IRCCS), Italy
Copyright © 2022 Chatzichristos, Swinnen, Macea, Bhagubai, Van Paesschen and De Vos. This is an open-access article distributed under the terms of the Creative Commons Attribution License (CC BY). The use, distribution or reproduction in other forums is permitted, provided the original author(s) and the copyright owner(s) are credited and that the original publication in this journal is cited, in accordance with accepted academic practice. No use, distribution or reproduction is permitted which does not comply with these terms.
*Correspondence: Christos Chatzichristos, Y2NoYXR6aWNAZXNhdC5rdWxldXZlbi5iZQ==