 Sara Baldoni
 Marco Carli
 Federica Battisti
- 1Department of Industrial, Electronic and Mechanical Engineering, Roma Tre University, Rome, Italy
- 2Department of Information Engineering, University of Padova, Padova, Italy
In this contribution, a flexible context-based security framework is proposed by exploring two types of context: distributed and local. While the former consists in processing information from a set of spatially distributed sources, the second accounts for the local environment surrounding the monitored system. The joint processing of these two types of information allows the identification of the anomaly cause, differentiating between natural and attack-related events, and the suggestion of the best mitigation strategy. In this work, the proposed framework is applied the Cyber Physical Systems scenario. More in detail, we focus on the distributed context analysis investigating the definition of a 2D representation of network traffic data. The suitability of four representation variables has been evaluated, and the variable selection has been performed.
1 Introduction
During the last years, we witnessed a rapid spread of connected devices. This phenomenon involved several market segments from mass market to critical infrastructures (e.g., healthcare, transportation, energy and industrial systems) thus leading to a huge expansion of the attack surface. In addition, due to the use of connected devices in safety-critical applications, attacks may potentially result in the denial of pivotal services to the society or in life losses. To address this issue, the monitoring of connected systems and the identification of anomalous behaviors becomes of paramount importance.
The anomaly detection methods available in the literature can be mainly classified into two categories: signature-based and profile-based. The techniques belonging to the first class detect known anomalies by exploiting the a-priori knowledge of their features. The approaches residing in the second category, on the other hand, exploit the history of the nominal system behavior to define its normal profile. Then, an anomaly is defined as a system behavior that is significantly different from the modeled one. This may be due both to malicious actions and to genuine but unusual activities (Fernandes et al., 2015). Both categories show advantages and disadvantages. Profile-based techniques do not require a model for the anomalous behaviors thus allowing the detection of new and unforeseen anomalies. Signature-based approaches, on the contrary, are able to detect only previously known anomalous behaviors. However, since only well-known anomalies are identified, the false alarm rate can be reduced.
Anomaly detection systems can be also differentiated based on the approach adopted for setting the threshold. More in detail, two classes can be identified: the first foresees the manual setting of alert thresholds that are monitored by experts, whereas the second relies on an automatic approach that can also be based on artificial intelligence. The latter systems have proven to be more effective, adaptive with respect to traffic variations (without the need to manually re-calibrate the thresholds) and require a reduced human intervention. In this work, the selection of the approach has been made considering that anomalies show the following features (Pang et al., 2021):
• unknowness: anomalies are linked to many unknowns (e.g., behavior, data structure, distribution);
• heterogeneity: anomalies are irregular and have different properties;
• rarity: anomalies are rare, so that it is difficult to gather a large amount of labeled anomalous samples.
For these reasons, in this work we propose a profile-based context-aware security framework which relies on deep learning approaches to detect anomalies. The core idea of the presented research is to satisfy the security requirements through the exploitation of a set of sources and the joint processing of the information flow. The proposed approach involves both local and non-local data. Local data account for information that is dependent on the environment in which they are collected whereas non-local data are monitored on a larger area typically through the deployment of sensors. In the following, non-local data will be indicated as distributed context, since the information sources are assumed to be spatially distributed, whereas local data will be referred to as the local context, since they allow to gather information about what happens in the proximity of the monitored system. The idea of context-aware security has been introduced in (Wang et al., 2010) where the context has been defined as the set of environmental states and settings that either determine an application’s behavior or in which an application event occurs. Although this concept has been previously addressed in the literature, a general framework which jointly handles both distributed and local contexts is missing. Therefore, the combined processing of local and non-local data paves the way for the definition of a new approach for context-based security.
In this work, we apply the proposed framework to the Cyber Physical System (CPS) scenario. A CPS can be defined as the integration of computing, communication, and control capabilities for monitoring and managing physical objects. The connectivity allowed by the use of the Internet, on one hand has extended the ability of sharing information and on the other one has made these systems prone to vulnerabilities that did not exist before. The interaction between the Internet and CPSs requires greater efforts to ensure the security of connected systems. In fact, the security of CPSs concerns several aspects such as data collection, information transmission, and processing and control subsystems. The exploitation of both local and distributed contexts for estimating the anomaly origin in CPSs allows to evaluate the anomaly impact on the system, with respect to the available reaction and mitigation strategies, also considering the associated costs. In this work, we focus on the distributed-context analysis by adopting a 2D representation of network traffic to design the anomaly detection system. The use of a 2D representation allows to characterize the multi-input information collected from the sensors in a compact form.
The reminder of the paper is organized as follows. In Section 2 the literature concerning context-based security and network anomaly detection systems based on multi-dimensional representations of data is reviewed. Then, Section 3 describes the proposed framework and its application to the CPS scenario. Moreover, Section 4 describes the dataset selected for the performed study, and the 2D traffic representation issue. At last, some preliminary results concerning the 2D data representation are provided in Section 5, and in Section 6 the conclusions are drawn.
2 Related Works
In this section, the related works concerning both context-based security approaches and anomaly detection methods exploiting a multi-dimensional representation of data are detailed.
2.1 Context-Based Security Approaches
In previous works, context-related information has been adopted for improving the safety and security of CPSs, (Ivanov et al., 2018). More specifically, context data has been exploited both for inferring information about the system state and for preventing wrong detections due to the presence of non reliable data. In (Sylla et al., 2019), for instance, a context-aware security architecture for Internet of Things (IoT) is proposed. More in detail, the authors suggest to select the security and privacy mechanisms based on the user contextual information (e.g., mobility). In (Dsouza et al., 2019), a context-aware biometric security framework fusing real-time data with contextual information such as the client setting area, lighting, and time is presented. Context is considered also in the security infrastructure for the IoT systems proposed in (Roukounaki et al., 2019). The environmental impact has been exploited in (Sharaf Dabbagh and Saad, 2019), where device fingerprinting for IoT authentication is analyzed. In this case the approach relies on the assumption that an attacker will not be able to imitate the environmental changes experienced by the legitimate device thus failing in reproducing an environment-based fingerprint. Moreover, an attribute-based encryption method which automatically learns the attributes thanks to a context-aware module is proposed in (Ghosh et al., 2021). Similarly, in (Alagar et al., 2018), a context-sensitive role-based access control technique for healthcare IoT is presented. Furthermore, in (Park et al., 2020), the concept of context-aware intrusion detection systems is realized by including networking conditions (e.g., source and destination address/port, access frequency, data traffic), and systematic operation conditions (e.g., idle CPUs or memory load) in the analyzed data. At last, in (Ehsani-Besheli and Zarandi, 2018), the context is exploited for detecting anomalies in embedded systems communications. The key innovation of our framework is the joint exploitation of local and distributed contexts. As previously mentioned, in fact, a framework which jointly processes local and non-local data is currently missing.
2.2 Security Approaches Based on Multi-Dimensional Representation of Traffic Data
In the literature, few solutions for network anomaly detection have been proposed using a 2D or 3D representation of data. A first example of image-based network traffic visualization is provided in (Kim et al., 2004). The authors exploit source and destination IP addresses and destination port number to represent traffic in 3D. They represent each flow as a point in the 3D space defined by the three attributes. In presence of attacks, regular patterns arise whereas legitimate traffic is widely and irregularly dispersed. To detect the attacks, an attack signature table is defined so that by comparing the packet signatures with the pre-defined ones it is possible to identify the presence and the type of attack. In (Kim and Reddy, 2005a) classical image processing techniques have been exploited to analyze traffic patterns. To define the images packet counts in the address domain are used. The same representation is employed in (Kim and Reddy, 2005b) where the authors compute the DCT of the image and select a set of coefficients for computing the standard deviation. This value is used as anomaly detection metric by defining a lower and upper threshold for the standard deviation under nominal conditions. Moreover, the authors propose using motion prediction techniques to predict following attack targets. Furthermore, Nataraj et al. proposed a 2D representation of malware binaries in (Nataraj et al., 2011), and presented a malware classification technique based on image processing methods. More recently, deep learning techniques have been exploited. In (Wang et al., 2017), malware traffic classification is performed based on an image representation of network traffic and a Convolutional Neural Network (CNN). The authors grouped network data based on flows and sessions and found out that different types of traffic result in different images, whereas images within the same class are consistent. Taheri et al. used the same representation for detecting botnet in the IoT environment (Taheri et al., 2018). In addition, an ensemble method employing pre-trained networks and fine-tuning for malware classification has been presented in (Vasan et al., 2020). Finally, an hybrid model based on both unsupervised and supervised methods for malware detection and classification has been proposed in (Venkatraman et al., 2019). Another approach for representing general time series data as images has been proposed in (Zhang et al., 2019), where a multi-scale signature matrix is employed to characterize the system using different time steps. These matrices are then given as input to a convolutional encoder and an attention-based convolutional Long Short Term Memory (LSTM) to capture the temporal patterns. The same data representation has been used in (Luo et al., 2021), and applied to CPSs. In this case, a single scale has been used and the different time series represent measurements provided by a set of sensors. Concerning the processing, a CNN-based autoencoder has been used. Finally, a deep learning model has been employed for network intrusion detection in (Mohammadpour et al., 2018). More specifically, a one-dimensional feature vector has been re-arranged in a 2D structure and then provided as input to a CNN.
3 Proposed Framework
The proposed framework aims at providing an effective tool for detecting anomalies and for suggesting the best mitigation actions. The idea underlying this framework is the exploitation of both local and distributed contexts as shown in Figure 1.
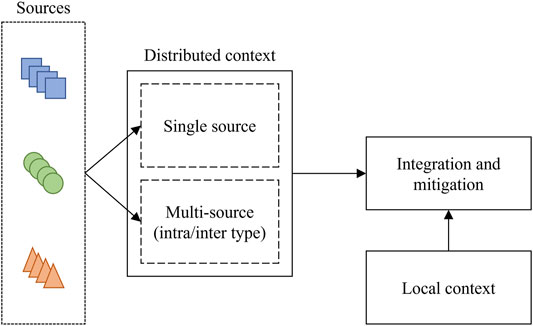
FIGURE 1. Proposed framework.
More specifically, the set of sources provides the input for the distributed context building block. The input type may vary depending on the specific application (e.g., sensor measurements, signals, network parameters). In this stage, three processing options are available: the detection of anomalies through the information provided by single information sources and the late fusion of the outcomes, the joint processing of the information coming from sources of the same type, or the joint analysis of data gathered from different types of sources. As previously mentioned, anomaly detection will be performed through a profile-based deep learning approach. This choice guarantees a detection system able to work independently from the specific type of attack and that consequently can be applied in a wide number of cases. The selected learning approach is based on autoencoders, which are unsupervised architectures that have already been applied for anomaly detection in different application scenarios.
The motivation behind this choice is that the autoencoder is enforced to learn important regularities of the data to minimize reconstruction errors. If the algorithm is trained on non-attacked data, a non-desired modification in the system behavior will result in large reconstruction errors.
The information coming from the local context is then integrated in order to differentiate between natural and attack-related anomalies. A natural event, in fact, may be associated to an anomalous local context, and should concern more than one source deployed in the same area. Once the root cause has been identified, and the mitigation costs have been taken into account, the best mitigation strategy can be selected.
The proposed framework is extremely flexible since it can be adapted to different application scenarios with a minimal modification of its building blocks. Depending on the specific application, the inputs of the proposed framework may change and, according to this variation, also the practical definition of the context evolves. Moreover, the number of parameters that can be detected for performing the anomaly detection can be increased to achieve a desired level of detection accuracy, (Wang et al., 2010).
3.1 CPS Security Case Study
CPSs can be described through a three-layer architecture: perception, transmission, and application. The first layer collects data in real-time, the second allows data exchange, and the last layer realizes data processing and control functionalities. CPSs directly interact with the surrounding environment and are usually deployed in groups on a pre-defined area. Therefore, the distributed nature of CPSs, together with their inter-dependency with the deployment environment makes them the perfect application scenario for the proposed security approach. The flowchart of the proposed framework applied to the CPS scenario is presented in Figure 2.
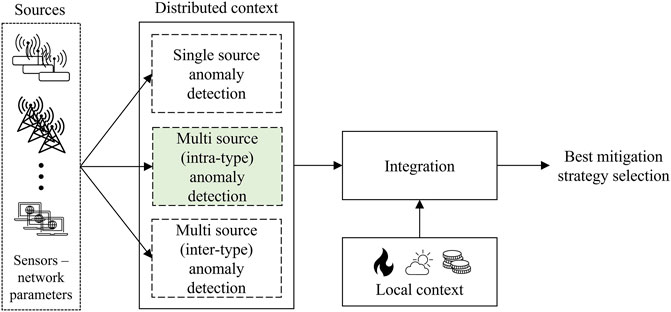
FIGURE 2. Proposed framework applied to the CPS case study.
According to the CPS definition, the distributed context could work both analyzing the measurements, and processing the network traffic data. Since, as pointed out in (Luo et al., 2021), the majority of the research literature has focused on detecting anomalies from sensor and actuator data, in this work we aim at analyzing the anomaly detection issue from the network traffic data point of view. Concerning the local data, in this case, they may concern the operating conditions of the CPS (e.g., weather forecast or presence of natural emergencies like fires and earthquakes), and the cost of the different mitigation actions.
We aim at defining the multi-source intra-type anomaly detection subsystem of the distributed context building block. To this end, we investigate the use of a 2D representation of traffic data. Thanks to this representation, the information gathered by a set of distributed nodes (i.e., the distributed context), is analyzed by providing to the anomaly detection system a single input. In addition, the 2D data structure is suitable to be processed by deep-learning based algorithms. The complete realization of this subsystem aims at defining an anomaly detection technique that will advance the state-of-the-art by working towards three specific objectives:
1. selection of the most effective two-dimensional representation of network traffic information;
2. definition of a deep learning model for the detection of anomalies based on the two-dimensional representation of traffic data;
3. design and implementation of a context-sensitive network anomaly detection system by exploiting the information gathered from a set of distributed nodes.
Among these three goals, in this contribution we focus on the first. To do so, the first issues to be solved is the research of available datasets to be used in the training phase. In fact, even if network security is a well-studied topic, the availability of verification datasets does not follow the rapid evolution trend of attack strategies and communication system development. Furthermore, the use of deep learning-based analytic methods requires a large amount of data to effectively train networks. Therefore, the choice of the dataset containing the traffic data to be analyzed, is an important step towards the realization of the proposed anomaly detection system. To this aim, two key aspects have to be considered: the sampling interval and the total duration of the data recording. The sampling interval must be short and fixed for all recorded data. If the sampling interval was long, in fact, assuming that the recorded data is analyzed exploiting time windows, in order to collect a sufficient amount of samples in each of them, a single time window would correspond to a long time period, thus impacting on the system promptness. On the contrary, the use of smaller time windows would result in the processing of a reduced number of samples, thus impairing the system effectiveness. As for the total data recording period, it should be long enough for both normal and anomalous traffic in order to perform an effective training and testing. Moreover, one of the first problems to deal with is the pre-processing of the network data and the definition of its structure so that the subsequent analysis module, based on deep learning, is more effective. More specifically, the following characteristics need to be selected: 1) the traffic parameters (e.g., bytes, packets) to be used in the two-dimensional representation of the network status; 2) the protocol level at which data will be analyzed (e.g., IP layer, transport layer); 3) the data normalization model to guarantee that the resulting images have the same dynamic range; 4) the best domain representation of the 2D data (e.g., transform domain, time domain); 5) the type of information that needs to be represented for each traffic parameter (e.g., the traffic volume, the correlation between traffic patterns of different nodes).
4 Network Traffic Analysis
In this section, the definition of the most effective 2D data representation is carried out. To do so, the dataset selection is performed and four 2D representation variables are identified. The suitability of these variables for anomaly detection will be assessed in Section 5.
4.1 Dataset
Due to the aforementioned requirements, the UGR′16 dataset has been selected (Maciá-Fernández et al., 2018). This dataset is composed of two parts: a calibration subset and a test subset. The former includes real background traffic and can be used for training, whereas the second is a combination of real background and controlled attack traffic and can be used for testing. The recording period for the calibration subset lasted 100 days, with two gaps of few hours documented in (Maciá-Fernández et al., 2018). As for the for the test subset, data have been recorded for approximately a month. The considered network infrastructure is shown in Figure 3. Data capture is performed through the netflow probes configured on the outgoing network interfaces of the border routers. The probes performed the collection of incoming and outgoing traffic.
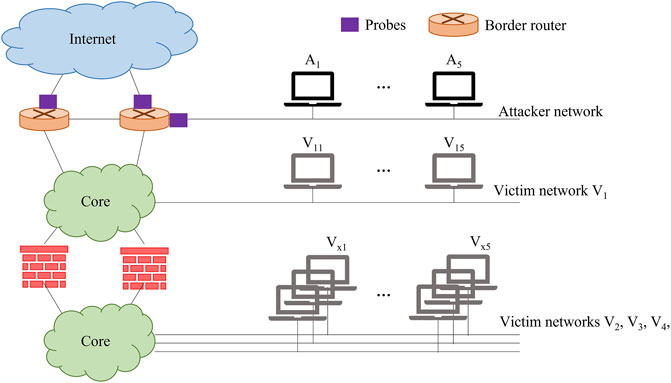
FIGURE 3. UGR′16 network infrastructure.
The captured data are organized in flows and for each flow the following features are provided: timestamp of the end of a flow, duration of the flow, source and destination IP addresses, source and destination port, protocol, flags, forwarding status, type of service, packets and bytes exchanged in the flow.
Concerning the attacks, the following classes have been simulated:
• Denial of Service (DoS):
• DoS11: one-to-one DoS where attacker A1 attacks the victim V21;
• DoS53: the five attackers (A1 − A5) attack three victims. More specifically, attackers A1 and A2 attack the victim V21, attackers A3 and A4 attack the victim V31, and attacker A5 attacks the victim V41;
• DoS53a: follows the same structure as DoS53 but the attacks are sequentially executed.
• Port Scanning:
• Scan11: one-to-one scan attack where attacker A1 scans the victim V41;
• Scan44: four-to-four scan attack where the attackers A1, A2, A3 and A4 scan the victims V21, V11, V31 and V41, respectively.
• Botnet: an attack involving all the twenty victim machines is simulated.
The attacks have been simulated according to two different scheduling: a planned scheduling, in which there is no overlap between the attacks, and a random scheduling in which overlap is possible. Moreover, since the calibration set is composed of real traffic, although attack data have not been injected, real anomalies may be present. For this reason, in (Maciá-Fernández et al., 2018), a further classification has been performed to differentiate between normal and anomalous background traffic in the calibration set.
In this work, only DoS and scan attacks have been considered, and only the planned scheduling has been taken into account. The former choice is related to how the botnet traffic has been generated. More specifically, as highlighted in (Maciá-Fernández et al., 2018), the produced traffic may not be realistic since it does not consider the effect of botnet traffic over the normal one. The authors underline that the produced traffic can be considered as sufficiently realistic for scenarios in which the influence of the botnet attack on background traffic is negligible but, in order to define the optimal 2D data representation, this attack has been currently excluded. In this work we chose to consider only the planned scheduling since the random scheduling may result in multiple simultaneous attacks. By considering the planned scheduling only we are sure that an individual attack is present for each time window, and we are able not only to analyze its effects on the 2D representation, but also the difference between the attacks. The study of multiple contemporary attacks will be the subject of future contributions.
4.2 2D Traffic Representation
The goal of this step is to obtain a 2D representation in which the attack presence is highlighted. Therefore, a traffic parameter has to be selected and a pre-processing has to be performed to produce a 2D structure in which the value of the element corresponding to the attack is significantly different from all the others. In addition, the variables associated to rows and columns have to be selected. In this work, exchanged bytes have been considered as traffic parameters and source and destination IPs have been used for indexing rows and columns. Moreover, when dealing with a 2D representation, an important aspect to define is the data structure dimension. More specifically, how data are organized in the 2D structure depends on the asset to be protected, on the threat source, and on the following processing flow. In order to define a distributed-context subsystem which can be applied in several application scenarios, the asset to be protected has been defined as a sub-network consisting of a fixed number of IP addresses. This consideration leads to the definition of the number of elements for one of the dimensions (i.e., the rows) of the 2D structure. The definition of the variable indexing the other dimension has been chosen based on how the data structure is processed. More specifically, deep learning techniques usually employ data with fixed dimensions. Therefore, in order to use the source IPs as variable which indexes the columns, an IP selection procedure was needed. However, in a realistic scenario, no assumptions can be made about the attack source, and using a number of columns equal to the number of all the possible source IPs is not feasible in practice. As a consequence, we decided to split the available source IPs in subsets of fixed dimensions. Moreover, the number of source IPs in each set has been selected to be equal to the number of monitored destination IPs to obtain a squared data structure. It is useful to highlight that this design choice allows not only to detect an anomaly, but also to identify the network IP subset from which it comes from.
In order to represent the bytes exchanged between two IP addresses, additional design choices are needed: the duration of the observation time window and how to process the bytes to define the value of a single element of the 2D structure. The time window specifies the time interval Δt (in seconds) in which data are aggregated for computing the representation variables. Starting from the timestamp associated to the first captured sample, it is possible to define consecutive non-overlapping time windows of length Δt for obtaining a 2D representation associated to each time interval. The length of the observation time window impacts on the effectiveness of the anomaly detection method. More specifically, if it is too short it may impair the attack visibility, whereas if it is too long it reduces the detection promptness. A possible way to overcome this issue is to employ multiple windows in parallel. As for the processing, several options are available. The easiest solution is the computation of the number of bytes exchanged between a node pair. This variable will be referred to as Σ in the following. However, the choice of focusing on the traffic volume may lead to the detection of high-rate and high-volume attacks only, while loosing useful information. Therefore, in order to define the representation variable for highlighting the presence of an attack, the targeted attacks have been analyzed in detail, and the features of both scan and DoS attacks are discussed in the following.
4.2.1 Scan Analysis
A port scan attack usually results in a high number of flows of similar length exchanged between the attacker and the victim. These attack features lead to the following considerations:
1. If a victim is scanned, more than one flow will be exchanged with the attacker. As a consequence, a single flow in the time window should not be related to a scanning attack. To delete the contribution of single flows we computed the sum of bytes exchanged in the time window, and subtracted the mean. More specifically, the mean has been computed as
where N indicates the number of samples in the time window, i.e., the number of flows for the considered dataset, and bi is the number of bytes exchanged within each flow. In this way, single flows will result in a 0 value, whereas long runs of flows will be only slightly affected by the subtraction. The resulting variable will be referred to as Σμ in the following.
2. If a victim is scanned, the flows are often equal in length thus resulting in a low standard deviation. In order to highlight this feature it is possible to divide Σμ by the standard deviation of the flow bytes. More specifically, the standard deviation has been computed as
where N indicates the number of samples in the time window and bi is the number of bytes exchanged within each flow. To avoid a denominator equal to 0, we divided Σμ by the standard deviation summed to a small quantity (i.e., 10−4). This variable will be referred to as Σμ,σ in the following.
3. The variable Σμ,σ has been defined based on the attack features. However, also normal traffic consisting of a small number of flows may have a small standard deviation. To account for this issue, another attack feature has been employed: the high number of flows. More specifically, the variable Σμ,σ has been multiplied by a function of the number of flows and, to compensate for standard deviations tending to zero, the exponential function has been considered. The resulting variable will be indicated as
4.2.2 DoS Analysis
In order to assess if the proposed variables Σ, Σμ, Σμ,σ and
5 Representation Variable Assessment
In order to study if the considered variables, namely Σ, Σμ, Σμ,σ and
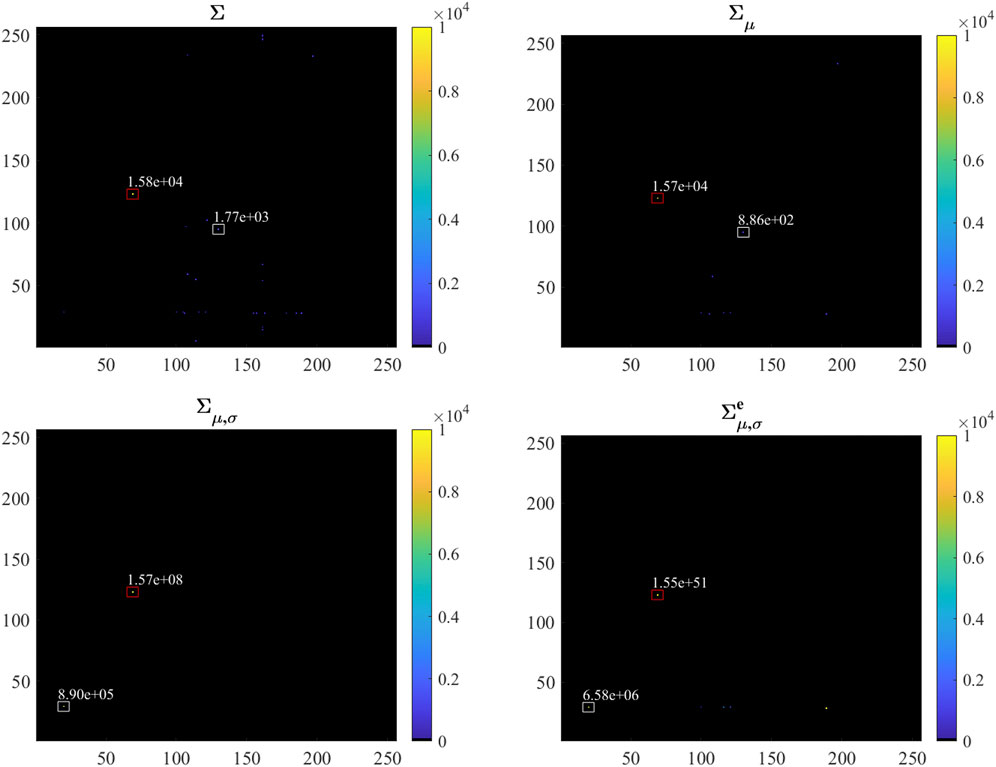
FIGURE 4. Example images for a DoS attack (attacker A5 attacks victim V41).
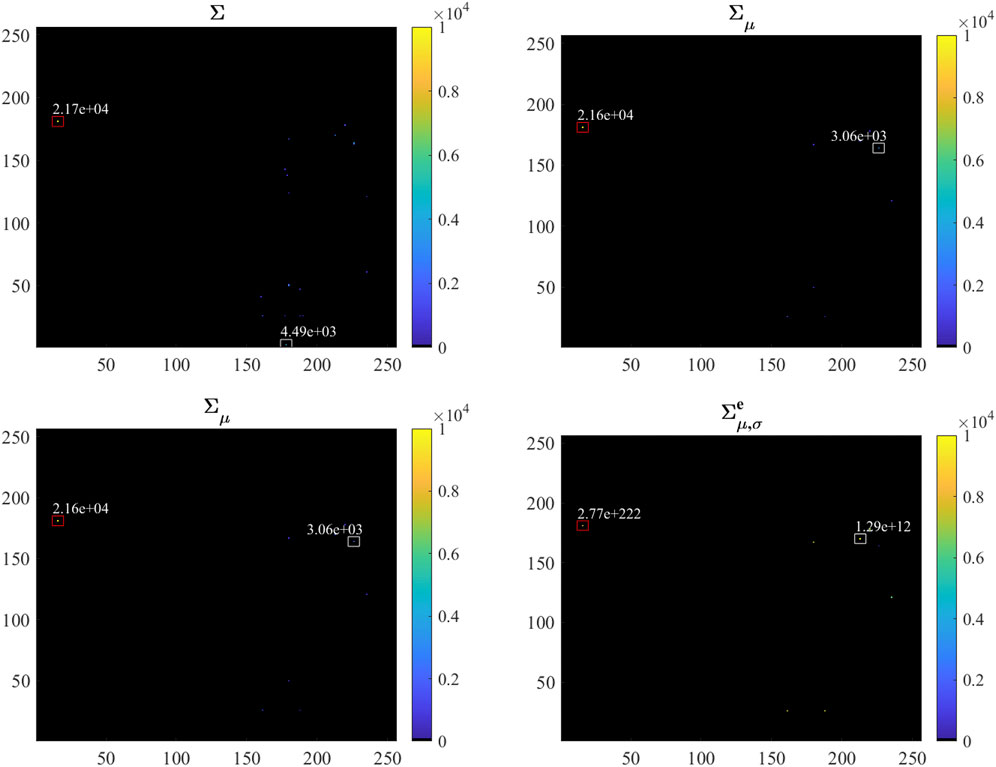
FIGURE 5. Example images for a scan attack (attacker A1 attacks victim V21).
Figures 4, 5 show that the use of the variable Σ fails to effectively highlight the attack for two main reasons. The former is that several non-zero values are present in the generated image, and the latter is that background and attack-related pixels show a similar order of magnitude thus making it difficult to detect the presence of the attack. The former issue can be mitigated with the use of the variable Σμ which allows the reduction of the number of non-zero values by eliminating the single-flow samples as described in Section 4.2.1. However in this case, due to the subtraction of the mean, the value of the pixel corresponding to the attack becomes smaller so that the separation gap between pixels corresponding to the attack and the ones associated to background traffic is further reduced. This phenomenon is avoided using the variable Σμ,σ since in this case, dividing by the standard deviation, the value of the pixels corresponding to the attack becomes larger. However, as shown in the figures, also background pixels undergo a huge increase so that the separation between attack and background pixel values may be insufficient for detecting the attack. This behavior is due to the fact that, given the limited extension of the time window, a reduced number of flows may be present for background traffic. The corresponding standard deviation, as a consequence, will be small, thus causing the growth of Σμ,σ. This effect can be mitigated by using the variable
In order to provide quantitative results concerning the suitability of the different variables for highlighting the attack presence, a single day of recording has been taken as example and the number of times for which the attack value is larger than the corresponding largest background sample has been computed. The results, expressed as percentages, are reported in Tables 1, 2 for the DoS and for the scan attack, respectively. From these results, it is clear that the variable Σ is not reliable for highlighting the presence of an attack with respect to background traffic. As for the others, usually Σμ,σ performs better than Σμ. In some cases, however, Σμ,σ performs worse than Σ and Σμ. This is due to the fact that, as already mentioned, while Σμ,σ increases the attack pixel value, it also enlarges background traffic pixels without causing an enlargement of the gap between them. At last, the tables show that
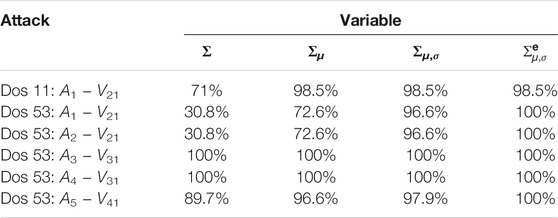
TABLE 1. Percentage of samples for which the attack value is larger than the maximum of the non attacked samples (DoS).
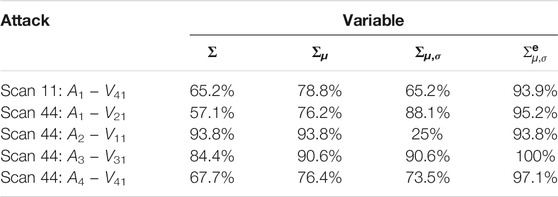
TABLE 2. Percentage of samples for which the attack value is larger than the maximum of the non attacked samples (scan).
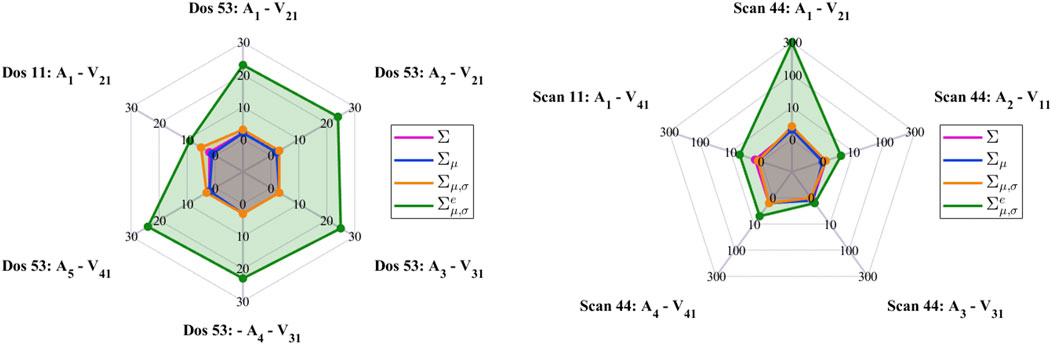
FIGURE 6. Powers of ten of the minimum differences between the attack sample and the largest background pixel for DoS and scan attacks.

FIGURE 7. Powers of ten of the median differences between the attack sample and the largest background pixel for DoS and scan attacks.
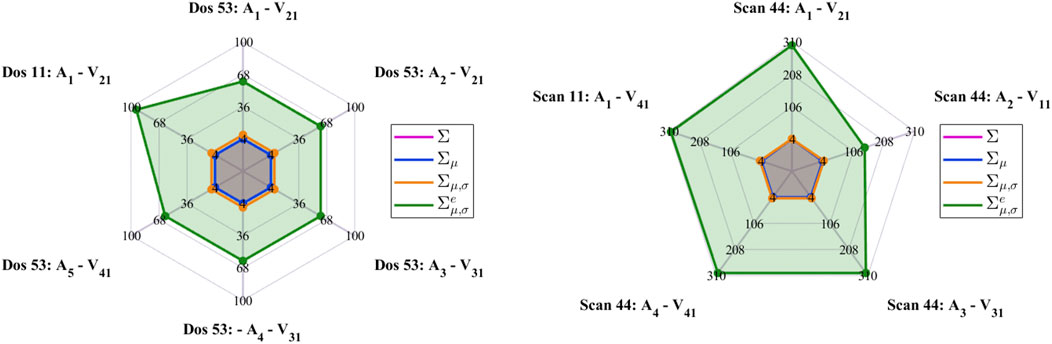
FIGURE 8. Powers of ten of the maximum differences between the attack sample and the largest background pixel for DoS and scan attacks.
6 Conclusion
In this contribution, a context-based security framework has been presented. It exploits information gathered both from local and distributed contexts for detecting the presence of an anomaly and estimating its cause. Through the joint processing of the two types of contexts it is possible to evaluate the impact of the detected anomaly on the system, thus allowing the selection of the most effective mitigation strategies, also considering the associated costs.
In this work we applied the proposed framework to the CPS scenario focusing on the distributed context analysis. To this aim, a 2D representation of network traffic for anomaly detection has been investigated and a representation variable has been selected. Preliminary results demonstrate its suitability to highlight the presence of attacks. The full implementation of the distributed-context building block and its integration in the overall framework will be the subject of future contributions.
Data Availability Statement
Publicly available datasets were analyzed in this study. This data can be found here: https://nesg.ugr.es/nesg-ugr16/.
Author Contributions
SB, MC, and FB contributed to conception and design of the study. SB performed the software implementation of the system and wrote the first draft of the manuscript. All authors contributed to manuscript revision, read, and approved the submitted version.
Conflict of Interest
The authors declare that the research was conducted in the absence of any commercial or financial relationships that could be construed as a potential conflict of interest.
Publisher’s Note
All claims expressed in this article are solely those of the authors and do not necessarily represent those of their affiliated organizations, or those of the publisher, the editors and the reviewers. Any product that may be evaluated in this article, or claim that may be made by its manufacturer, is not guaranteed or endorsed by the publisher.
Acknowledgments
The research presented in this paper was partially funded by the project “ISEEYOO: AI-based Network Anomaly Detection for CPS exploiting 2D data representation” within the University of Padova funding framework “SID research grants.”
References
Aamir, M., Rizvi, S. S. H., Hashmani, M. A., Zubair, M., and Usman, J. A. (2021). Machine Learning Classification of Port Scanning and DDoS Attacks: A Comparative Analysis. Mehran Univ. Res. J. Eng. Technol. 40, 215–229. doi:10.22581/muet1982.2101.19
Alagar, V., Alsaig, A., Ormandjiva, O., and Wan, K. (2018). “Context-Based Security and Privacy for Healthcare IoT,” in 2018 IEEE International Conference on Smart Internet of Things (SmartIoT), Xi’an, China, 122. doi:10.1109/SmartIoT.2018.00-14
Dsouza, J., Elezabeth, L., Mishra, V. P., and Jain, R. (2019). “Security in Cyber-Physical Systems,” in 2019 Amity International Conference on Artificial Intelligence (AICAI), Dubai, United Arab Emirates, 840–844. doi:10.1109/AICAI.2019.8701411
Ehsani-Besheli, F., and Zarandi, H. R. (2018). “Context-Aware Anomaly Detection in Embedded Systems,” in Advances in Dependability Engineering of Complex Systems. Editors W. Zamojski, J. Mazurkiewicz, J. Sugier, T. Walkowiak, and J. Kacprzyk (Cham: Springer International Publishing, 151–165. doi:10.1007/978-3-319-59415-6_15
Fernandes, G., Rodrigues, J. J. P. C., and Proença, M. L. (2015). Autonomous Profile-Based Anomaly Detection System Using Principal Component Analysis and Flow Analysis. Appl. Soft Comput. 34, 513–525. doi:10.1016/j.asoc.2015.05.019
Ghosh, T., Roy, A., Misra, S., and Raghuwanshi, N. S. (2021). CASE: A Context-Aware Security Scheme for Preserving Data Privacy in IoT-Enabled Society 5.0. IEEE Internet Things J. 1, 1. doi:10.1109/JIOT.2021.3101115
Ivanov, R., Weimer, J., and Lee, I. (2018). “Towards Context-Aware Cyber-Physical Systems,” in 2018 IEEE Workshop on Monitoring and Testing of Cyber-Physical Systems (MT-CPS), Porto, Portugal, 10. doi:10.1109/MT-CPS.2018.00012
Kim, H., Kang, I., and Bahk, S. (2004). Real-time Visualization of Network Attacks on High-Speed Links. IEEE Netw. 18, 30–39. doi:10.1109/MNET.2004.1337733
Kim, S. S., and Reddy, A. L. N. (2005a). “Modeling Network Traffic as Images,” in IEEE International Conference on Communications, 2005, Seoul, South Korea (ICC 2005), 168–172. doi:10.1109/ICC.2005.1494341
Kim, S. S., and Reddy, A. L. N. (2005b). “A Study of Analyzing Network Traffic as Images in Real-Time,” in Proceedings IEEE 24th Annual Joint Conference of the IEEE Computer and Communications Societies, Miami, FL, 2056–2067. doi:10.1109/INFCOM.2005.1498482
Luo, Y., Xiao, Y., Cheng, L., Peng, G., and Yao, D. (2021). Deep Learning-Based Anomaly Detection in Cyber-Physical Systems. ACM Comput. Surv. 54, 1–36. doi:10.1145/3453155
Maciá-Fernández, G., Camacho, J., Magán-Carrión, R., García-Teodoro, P., and Therón, R. (2018). UGR‘16: A New Dataset for the Evaluation of Cyclostationarity-Based Network IDSs. Comput. Security 73, 411–424. doi:10.1016/j.cose.2017.11.004
Mohammadpour, L., Ling, T. C., Liew, C. S., and Chong, C. Y. (2018). “A Convolutional Neural Network for Network Intrusion Detection System,” in Proceedings of the Asia-Pacific Advanced Network, 50–55.
Nataraj, L., Karthikeyan, S., Jacob, G., and Manjunath, B. S. (2011). “Malware Images,” in Proceedings of the 8th International Symposium on Visualization for Cyber Security, Pittsburgh, PA (New York, NY, USA: Association for Computing Machinery). doi:10.1145/2016904.2016908
Pang, G., Shen, C., Cao, L., and Hengel, A. V. D. (2021). Deep Learning for Anomaly Detection. ACM Comput. Surv. 54, 1–38. doi:10.1145/3439950
Park, S.-T., Li, G., and Hong, J.-C. (2020). A Study on Smart Factory-Based Ambient Intelligence Context-Aware Intrusion Detection System Using Machine Learning. J. Ambient Intell. Hum. Comput 11, 1405–1412. doi:10.1007/s12652-018-0998-6
Roukounaki, A., Efremidis, S., Soldatos, J., Neises, J., Walloschke, T., and Kefalakis, N. (2019). “Scalable and Configurable End-To-End Collection and Analysis of IoT Security Data : Towards End-To-End Security in IoT Systems,” in Global IoT Summit (GIoTS). Aarhus, Denmark: IEEE ComSoc. doi:10.1109/GIOTS.2019.8766407
Sharaf Dabbagh, Y., and Saad, W. (2019). Authentication of Wireless Devices in the Internet of Things: Learning and Environmental Effects. IEEE Internet Things J. 6, 6692–6705. doi:10.1109/JIOT.2019.2910233
Sylla, T., Chalouf, M. A., Krief, F., and Samaké, K. (2020). “Towards a Context-Aware Security and Privacy as a Service in the Internet of Things,” in 13th IFIP International Conference on Information Security Theory and Practice (WISTP), Paris, France. Editors M. Laurent, and T. Giannetsos (Paris, France: Springer International PublishingLNCS-12024 of Information Security Theory and Practice), 240–252. doi:10.1007/978-3-030-41702-4_15
Taheri, S., Salem, M., and Yuan, J.-S. (2018). Leveraging Image Representation of Network Traffic Data and Transfer Learning in Botnet Detection. Bdcc 2, 37. doi:10.3390/bdcc2040037
Tang, D., Tang, L., Dai, R., Chen, J., Li, X., and Rodrigues, J. J. P. C. (2020). MF-adaboost: LDoS Attack Detection Based on Multi-Features and Improved Adaboost. Future Generation Comput. Syst. 106, 347–359. doi:10.1016/j.future.2019.12.034
Taylor, R. (1990). Interpretation of the Correlation Coefficient: A Basic Review. J. Diagn. Med. Sonography 6, 35–39. doi:10.1177/875647939000600106
Vasan, D., Alazab, M., Wassan, S., Safaei, B., and Zheng, Q. (2020). Image-Based Malware Classification Using Ensemble of CNN Architectures (IMCEC). Comput. Security 92, 101748. doi:10.1016/j.cose.2020.101748
Venkatraman, S., Alazab, M., and Vinayakumar, R. (2019). A Hybrid Deep Learning Image-Based Analysis for Effective Malware Detection. J. Inf. Security Appl. 47, 377–389. doi:10.1016/j.jisa.2019.06.006
Wang, E. K., Ye, Y., Xu, X., Yiu, S. M., Hui, L. C. K., and Chow, K. P. (2010). “Security Issues and Challenges for Cyber Physical System,” in 2010 IEEE/ACM Int’l Conference on Green Computing and Communications Int’l Conference on Cyber, Physical and Social Computing, Hangshou, China, 733–738. doi:10.1109/GreenCom-CPSCom.2010.36
Wang, W., Zhu, M., Zeng, X., Ye, X., and Sheng, Y. (2017). “Malware Traffic Classification Using Convolutional Neural Network for Representation Learning,” in 2017 International Conference on Information Networking (ICOIN), Da Nang, Vietnam (IEEE), 712–717. doi:10.1109/icoin.2017.7899588
Keywords: security, context, anomaly detection, cyber-physical systems, network traffic, 2D representation
Citation: Baldoni S, Carli M and Battisti F (2022) Analysis of a 2D Representation for CPS Anomaly Detection in a Context-Based Security Framework. Front. Sig. Proc. 1:814129. doi: 10.3389/frsip.2021.814129
Received: 12 November 2021; Accepted: 24 December 2021;
Published: 21 January 2022.
Edited by:
Monica Bugallo, Stony Brook University, United StatesReviewed by:
Nasharuddin Zainal, National University of Malaysia, MalaysiaJoilson Rego, Federal University of Rio Grande do Norte, Brazil
Copyright © 2022 Baldoni, Carli and Battisti. This is an open-access article distributed under the terms of the Creative Commons Attribution License (CC BY). The use, distribution or reproduction in other forums is permitted, provided the original author(s) and the copyright owner(s) are credited and that the original publication in this journal is cited, in accordance with accepted academic practice. No use, distribution or reproduction is permitted which does not comply with these terms.
*Correspondence: Federica Battisti, ZmVkZXJpY2EuYmF0dGlzdGlAdW5pcGQuaXQ=