 Faheem Khan1*
 Naeem Khan
- 1Lab STICC, Communications Engineering, UBO, Brest, France
- 2Electrical Engineering Department, UET Bannu Campus, University of Engineering and Technology, Bannu, Pakistan
- 3Electrical Engineering Department, HITEC, Islamabad, Pakistan
Two vital signs including heartbeat and respiratory rate are monitored in this work under two constraint situations; namely noise disturbance and intermittent observations. The existing scheme for finding, measuring and monitoring vital signs was Fourier Transform which could not deal with non-stationary process. As an alternative, the Wavelet Transform is used in this work which is equally applicable to both stationary and non-stationary processes. Additionally, the loss of output data may result in crucial implications in observing vital signs. Formerly, only un-interrupted data has been amalgamated in tracing vital signs. A novel adaptive ARMA-based scheme is proposed to obtain optimum estimated results in the presence of the above two critical scenarios. Simulation results obtained on real (practical) data show that the ARMA-based model produces similar vital signs as shown by clean and un-distorted data. It is shown that the proposed ARMA-based algorithm improves the breathing rate accuracy by 0.3% and heart rate accuracy by 2.5% as compared to the existing AR-based vital signal reconstruction algorithm.
1 Introduction
Formerly, the Ultra-Wide Band (UWB) standards were allowed unauthorized operation in the area of 3.1–10.6 GHz (Fernandes and Wentzloff, 2010). Since the authorization of UWB by the Federal Communication Commission in 2002, Ultra-Wide Band has a huge contribution in wireless communication (Fontana, 2004; Li et al., 2010; Choliz et al., 2011) and radar sensor applications (Oziel et al., 2017; Fear et al., 2002; Buehrer et al., 2003; Lazaro et al., 2009; Thiel et al., 2010). Ultra-Wide Band has many advantages namely strength in harsh environments, location accuracy and high penetration capability (Briso et al., 2019), etc. With the help of IR-UWB radar, both micro and macro movements can be sensed inside the human body (Staderini, 2002). For such reasons, UWB has large applications in the medical field because it consumes less power and provides higher extensional quality (Grewal and Andrews, 2001). The monitoring of vital signs has acquired greater attention in case of surveillance of non-communicable patients and the search for people after natural disasters (Khan et al., 2020; Le, 2020; Yang et al., 2020). Figure 1 shows the experimental setup for this work. The patient is sitting in front of the radar in a range of around 1 m. The radar signal is back scattered from the human body as well as the background environment. The background signal is considered as clutter and removed using a moving averaging filter while the moving part of the signal contains the displacement caused by the human lungs and heart. These periodic motions are extracted from the signal using signal processing techniques explained in Section 2 of this work.
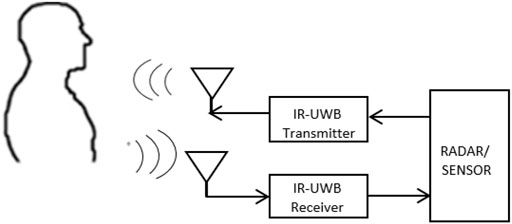
FIGURE 1. IR-UWB radar working principle.
The standard model of static UWB Cramer et al., (2002) can be expressed as
The extended version used in the multi-channel UWB model (Liu et al., 2019), is developed as follows:
In the above equations, α is the time delay and t shows time instance. The most scattered M-line overlap is the channel model parameter
An important challenge in this field is to deal with the intermittent or anomalous data that can occur for a variety of reasons. No doubt, the availability of output data for processing purposes is necessary for majority of communication systems. In this connection, it is perhaps more crucial to consider the possible consequences of interrupted or intermittent data in case of diagnosis of a patient. The main cause of data loss occurs when the patient’s position is slightly offset and does not accurately face the radar/sensor for a period of time, so the Radar Cross Section (RCS) with a narrow beam width in front of the antenna is reduced, resulting in intermittent measurement. In this case, we ignore the outliers and treat them as missing data. This paper also aims to identify such data loss and propose remedial measures in the form of robust algorithms. In a related work (Gu et al., 2013), a radar sensor system with camera aided random body movement detection and tracking was presented. However, it is expensive to use additional camera for tracking the body movement. In (Cardillo et al., 2021), only one radar sensor is used for both vital signs and motion detection, however, the motion considered in that work is due to the radar sensor and human body motion was not considered in that work. In our presented work, the source of the interrupted or intermittent data is not important. The main contributions of this paper are best explained in schematic shown in Figure 2, which also illustrates the strategy used in this paper.
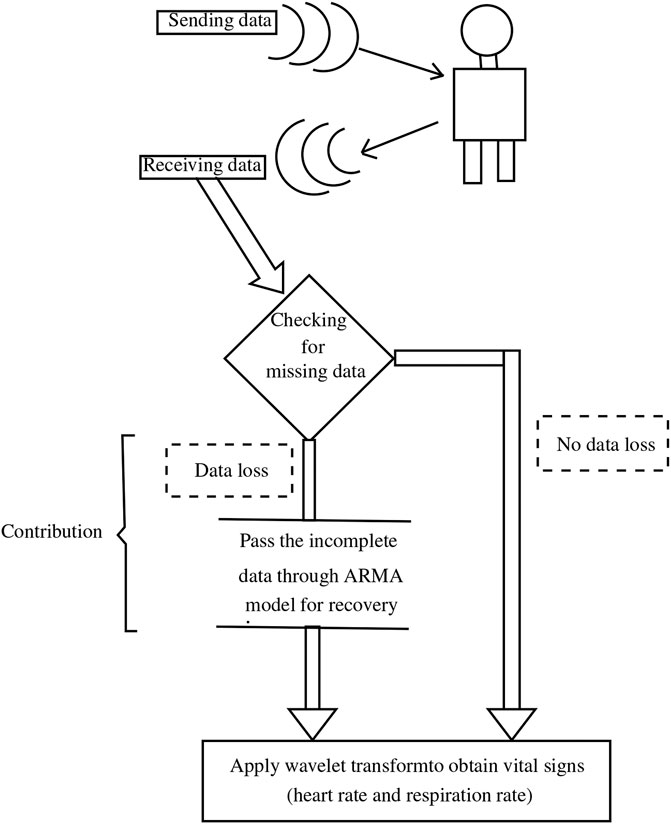
FIGURE 2. Graphical representation of the paper strategy.
It is necessary to state that data loss can be recovered through many techniques which mainly depends on the structure or pattern available in the data. As assumed in (Khan et al., 2019), this paper assumes that the processing time interval is limited enough so that the signal can be seen as being almost stationary. The main contribution of this paper is that it proposes an algorithm based on WT and ARMA model. A proper wavelet is carefully selected to detect the breathing and heart rate signal in the radar back scattered signal. An ARMA model is proposed for predicting the missing data that may cause inaccuracy in the vital measurement process. Another contribution is that this work is based on real radar data which was collected in a university hospital from a patient.
The structure of this paper is given as: Section 2 describes the details of existing techniques for data Loss. Section 3 contains Auto-Regressive Moving Average (ARMA) based model and Wavelet Transform. Section 4 describes the scenario when there is no data loss in the measurement of vital signs. Section 5 introduces the case of data loss during vital signs measurement. Section 6 includes measurement recovery through AR-based model. Section 7 includes loss recovery measurement through proposed ARMA-based model. Finally, Section 7 concludes this work and discusses possible future work in this research area.
It is worth mentioning that all the results obtained in this paper are based on radar technology using Xethru X4 (Novelda, Norway) sensor (Andersen et al., 2017). The central frequency of this radar sensor is 8.7 GHz with a bandwidth of 2.9 GHz. The output power, pulse repetition frequency and beam width parameters are -12.6 dB m, 400 MHz and 65°, respectively. The sensor has a very fine range resolution of 6.4 cm. It consists of one transmitter and one receiver antenna. The radar sensor was connected to PC through USB cable. The radar back scattered signals were processed in the PC using Matlab software.
2 Existing Techniques for Packet Loss
Several mechanisms exist which handle data loss, such as Open-Loop Estimation (OLE) and Compensated Closed-loop Estimation (CCLE). In the following sub-sections, these algorithms are briefly elaborated with associated shortcomings.
2.1 Open-Loop Estimation
It is a very simpler scheme devised for data loss and has been employed in numerous application. The basic mechanism of OLE is discussed as follows:
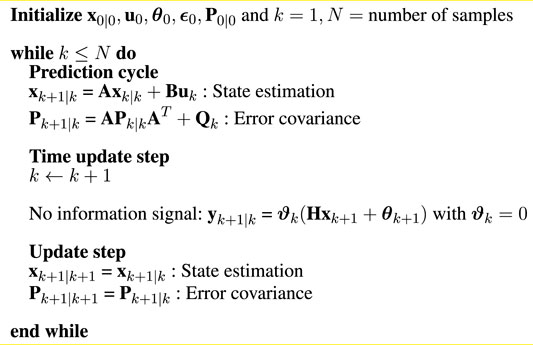
For a discrete-time LTI system, with dynamics
the standard Kalman filtering estimates xk+1|k in two steps namely prediction-cycle and update-cycle. Contrary to the standard Kalman filter, the OLE is summarized in Algorithm 1. OLE is a fast algorithm for signal recovery, however, it may cause divergence in case of adequate data loss and sudden crusts and troughs may appear in recovered signal. Further, it may be difficult to reach the steady state after resumption of the original signal. Due to these limitations, series-based algorithms are proposed in the next section to predict the missing part of the signal.
Algorithm 1 Open loop estimation
2.2 Series-Based Algorithms
The compensated closed-loop scheme has efficiently reconstructed the missing data and promising estimation results have been achieved. The recent achievements obtained through this model can be seen in Khan et al. (2013) and Khan et al. (2010). Data loss occurred in series which may have any trend are more expected to be recovered through Autoregressive (AR) series. These series include AR, MA, and ARMA to name but a few. Human vital signal possess a periodic trend, therefore it can be recovered through AR series. AR model employed for compensation of measurement has the mathematical formulation as
where γj are prediction coefficients, yk−j are previous samples of observation stored in memory stack, and W is the order of linear prediction filter. The optimum values of the prediction coefficients can be computed as
where,
is the vector containing the unknown coefficients,
is the linear prediction array and
is the auto-correlation matrix. The elements of linear prediction array and auto-correlation matrix can be obtained as
With the help of Equation 4, the optimal values of linear prediction coefficients are computed which are then employed in finding the lost samples using Eq. 3. The AR model uses only measurement vector for linear prediction coefficient (LPC) computation, however, in our proposed ARMA-based reconstruction of vital signal the input as well as measurement vector are used for LPC computation which improves the prediction accuracy.
3 Proposed ARMA-Based Model and Wavelet Transform
In the subsequent section, we present the proposed model which is based on ARMA series.
3.1 Proposed ARMA-Based Model
The data recovery scheme used in this paper is based on ARMA based model. The mathematical description of ARMA based model is as follows;
where,
In the above equations, W represent filter linear prediction order, yk−j shows sensor readings and uk−j shows the input signal to the plant/system. The symbols γj and δj represent weights given to measurements and input respectively. The error resulting by this compensating vector would be
where yk is the actual observation vector. In order to compute linear prediction coefficients efficiently, the cost function consists of mean square prediction error as;
or
In order to find the optimal value of γj, which will result in the minimum cost function, we proceed as
Let
Substituting Eq. 15 in Eq. 14 will result in
In the similar way, the optimal value of δj are calculated as
Substituting Eq. 19 in Eq. 18 will result in
Multiply Eq. 16 by L4 and Eq. 20 by L2 and solve simultaneously i.e.
Multiply Eq. 16 by L3 and Eq. 20 by L1 and solve simultaneously i.e.
Using Eq. 21 and Eq. 22, the auxiliary measurement vector can be reconstructed through a model depicted in Eq. 9.
Algorithm 2 Filter order selection
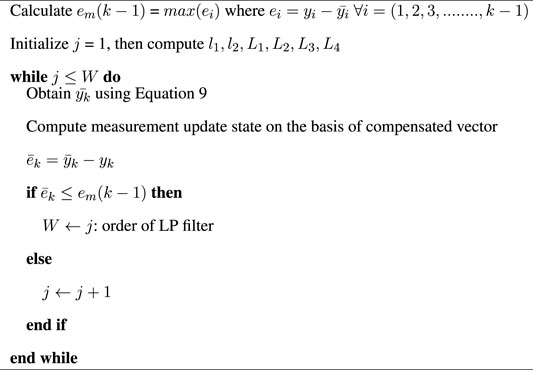
Additionally, it is fundamental to decide the optimal value of prediction filter order W. Various schemes can be proposed to compute this important parameter. The importance of this parameter can be judged from the fact that a high value of W will take a large number of samples to reconstruct the missing sample and hence will consume more computational time. On the other hand, a smaller value of W may generate degraded results at the price of less computational time. Hence, it is a task for the designer to devise an optimal value of W to result in optimum achievements. In Algorithm 2, a simple and straightforward mechanism is proposed to decide the order of prediction filter, when samples start missing at kth instance.
3.2 Clutter Removal and Wavelet Transform
Due to the vital limitations of FT-based scheme, this paper aims to employ Wavelet Transform (WT) as an alternate, and hence, a brief review of WT is considered to be beneficial. IR-UWB radar surrounds the body under study. From the patient’s body, constant reflected rays are received. The received signal from the body contains data, stored in an m ×n matrix, where m is the sample size in the slow time and n represents the occurrence of the sample in the fast time. First, search for the column with the highest power. For clutter cancellation, the signal must pass through a filter, such as a notch filter (Sifuzzaman et al., 2009; Chia et al., 2005; Grewal and Andrews, 2001. From a graphical perspective, the clutter removal process can be seen in Figure 3. Mathematically, the separator can be described as follows (Wang et al., 2017.
where, y(t), u(t) and g(t) represent the clutter signal, original signal and clutter free signal respectively.
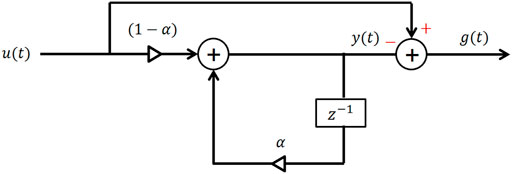
FIGURE 3. Algorithm for removing clutters.
The Wavelet coefficients are achieved by applying WT on the clutter free signal. In addition, the mother Wavelet used in this case is Daubechies-2. The pictorial view of db-2 Wavelet is given in Figure 4.
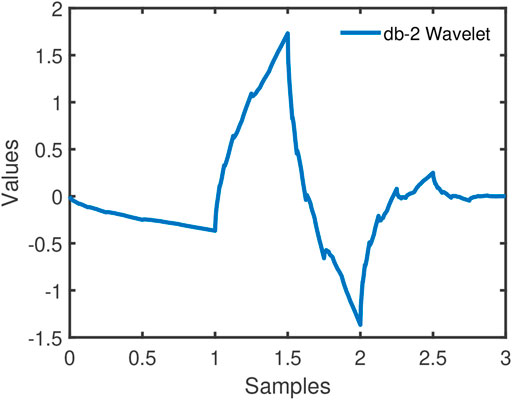
FIGURE 4. The Daubechies (db-2) wavelet.
The Wavelet coefficients are obtained after the Wavelet is applied to the clutter-free signal. It needs to be noted that the Wavelet coefficients, when plotted on Energy-Spectral Density (ESD) graph, provide scale value. Another commending feature of Wavelet transform is that it gives Scale-to-Frequency graphs (for example Figure 5) Tariq et al. (2017). So, core objective of Figure 5, is to locate the corresponding frequency of scale factor related to heart rate or respiration rate. This strategy is adopted for the detection of vital signs in the following four scenarios:
1. Analysis of Normal Scenario (discussed in Section 4)
2. Consequences of data loss (discussed in Section 5)
3. Analysis after Recovery of Data Loss through AR-based Model (discussed in Section 6)
4. Analysis after Recovery of Data Loss through ARMA-based model (discussed in Section 7)
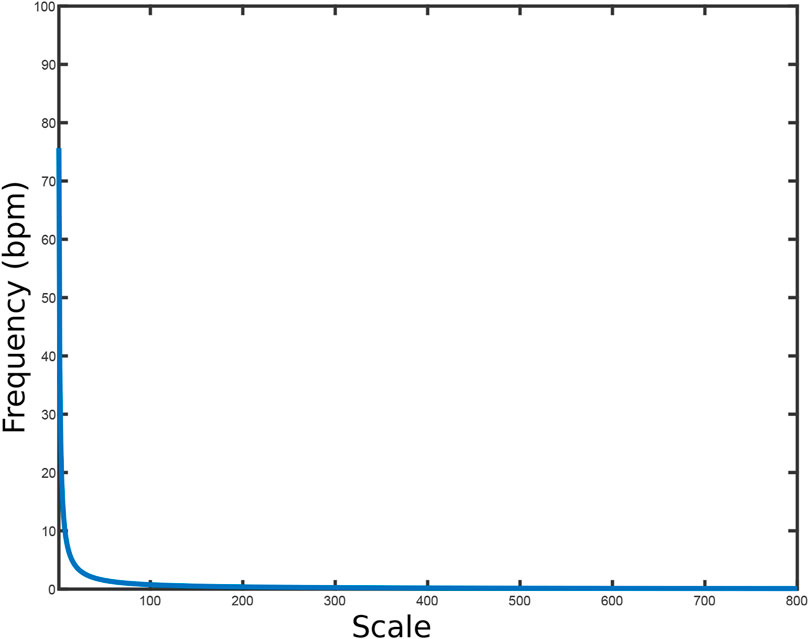
FIGURE 5. Frequency plot of Daubechies (db-2) Wavelet.
4 Analysis of Normal Scenario
Initially, smoothly arrived data has been analyzed which will serve as a baseline for comparison. After removing the clutter by any convenient method (such as notch filter), the clutter-free signal will consist of two parts (heart rate and respiration rate), and the Wavelet coefficients are obtained by applying Wavelet transform to the clutter-free signal. This results in the scale-frequency plot depicted in Figure 5. From this figure, the frequency can be found which corresponds to the density of the Wavelet coefficients.
In the same way, applying WT to the signal received without any missing sample from the patient gives the result shown in Figure 6, which contains two sub-results. Upper figure shows the analysis signal in the survey. The scalogram chart in lower figure is Daubechies (db-2) Wavelet (Tariq et al., 2017). It is important to note that in normalized case, the heart rate is between 60–120 beats/min, which is related to the scale value of 35–75. The appropriate measurement range is chosen for the heart rate and the selected scale, where Wavelet coefficients have the largest low energy, as shown in Figure 6. For heart rate, the approximate scale has a value of 42 (continuous pink line in Figure 6), which corresponds to a frequency of 1.801 Hz in Figure 7. The heart rate can be calculated as 1.801 × 60 = 108.08 bpm.
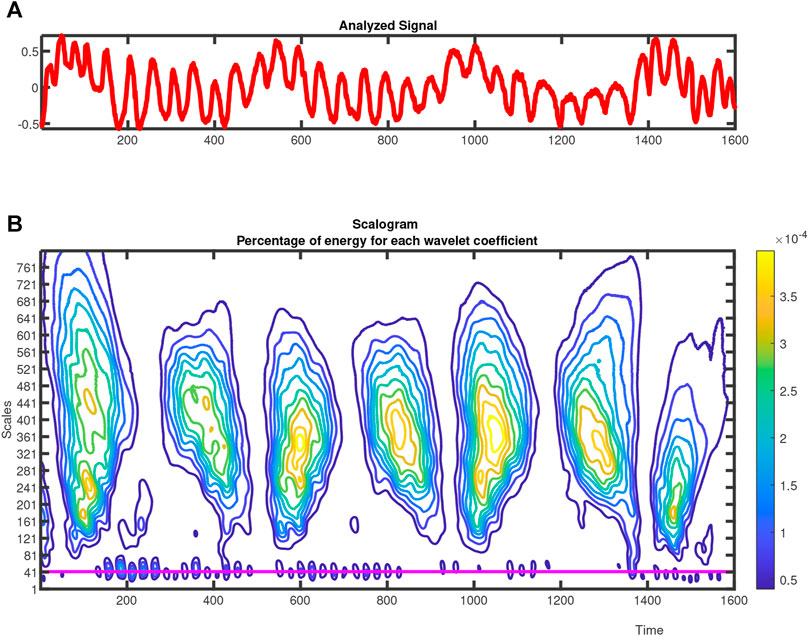
FIGURE 6. ESD of Wavelet coefficient for normal heart rate.
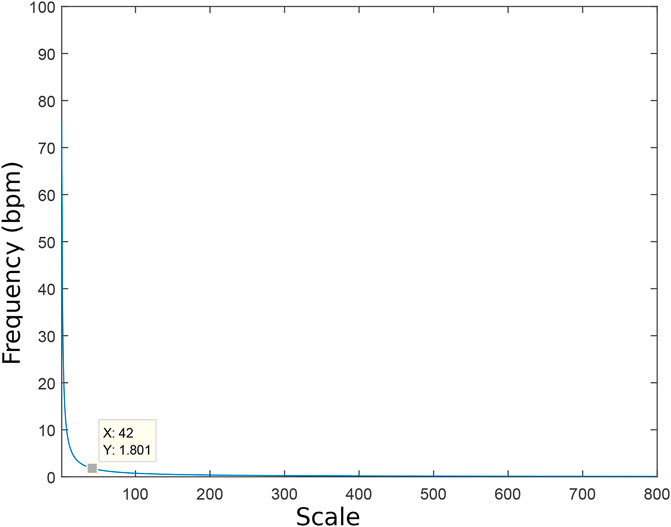
FIGURE 7. Frequency plot of Wavelet coefficient for normal heart rate.
In the same way, the range of respiration rate lies between 10–30 bpm, which corresponds to a scale value of 150–450 (Chia et al., 2005; Wang et al., 2017). The respiration rate scale can be selected by measuring the maximum spectral energy within these ranges. The generated scale value associated with the loss-free data is 350 as shown in Figure 8. The 350 scale value corresponds to a frequency of 0.2161 Hz in Supplementary Figure S1. Therefore, the heart rate can be calculated as 12.96 = (0.2161*60) bpm. There are two readings, obtained from uninterrupted signal, which are:
1. Respiration rate = 12.96 bpm.
2. Heart rate = 108.08 bpm.
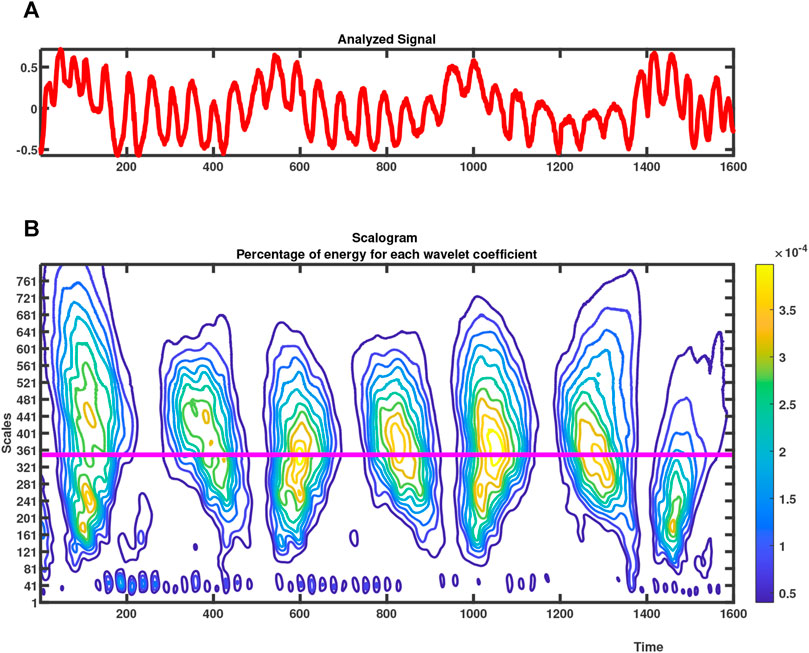
FIGURE 8. ESD of Wavelet coefficients for normal respiration rate.
Hence, this information would work as a benchmark for a particular patient. In this work, we have used ECG sensor; which is current gold standard in monitoring heart rate (Nelson and Allen, 2019), for comparison of the results. The respiration was monitored manually to find the actual breathing rate of the human.
So far, we have considered the normal situation wherein complete data is received from patients under investigation for analysis purposes. In the unique approach used in this article, we have generated simulation results for comparison in this section. However, in real life, data may not be available smoothly for a number of reasons, including Radar Cross Section (RCS) issues or congestion of buffer which is often used for storage purposes. In such cases, it is important to design a remedy to cure this critical issue. This paper aims to address this situation by proposing a data loss recovery scheme embedded with vital signs implemented by the Wavelet transform.
5 Consequences of Data Loss
In the previous section, the importance of vital sign and its monitoring tool (WT) has been elaborated for uninterrupted data. In the next section, vital signs are monitored when the received data is incomplete for any practical reason (e.g. CSR area, channel or buffer congestion, sensor fault and/or failure, etc.). It is necessary to deal with this, otherwise it can lead to serious consequences, especially in terms of human casualty. The received data is random and overall 50 samples are lost.
The data with intermittent samples has been analyzed and is shown in Supplementary Figure S2 (upper sub-figure) where the interruption can be viewed by a circle in the initial phase. The Wavelet coefficients generated from the interrupted analyzing signal can be seen in the lower sub-figure of Supplementary Figure S2. The energy associated with heart rate (low assembled energy line) corresponds to a scale-factor of 39 which is shown by a pink continuous line.
From the scale to the frequency Supplementary Figure S3, the corresponding frequency of the 39 scale-factor is 1.94 Hz. The equivalent heart rate is 1.94 × 60 = 116.4 bpm (beats/min). Therefore, the data loss has led to a noticeable misunderstanding, which may offer hindrance effects, specifically in the medical treatment of a patient. The deviation resulted by the data-loss is 7.71%.
From the same interrupted analyzing signal, the maximum energy for high dense coefficients correspond to 345 scale factor which is shown by a pink continues line in Supplementary Figure S4. Transforming these coefficients to scale-to-frequency mapping results in a frequency of 0.2193 Hz as shown in Supplementary Figure S5. The respiration rate computed from this would be 0.2193 × 60 = 13.158 rpm (respiration/minute). The percent deviation of respiration rate from the normal reading is 1.48%.
Once again, the intermittent observations have caused a drift in readings of the respiration rate. In the subsequent section, we provide a remedy for the loss of data and its effect in vital sign monitoring has been provided.
6 Analysis After Recovery of Data Loss Through AR-Based Model
In this section, the analyzing signal which was subjected to data loss earlier has been recovered through AR-based series and then employed in vital signs monitoring. This recovered analyzing signal is shown in Supplementary Figure S6 (Upper sub-figure). In the next stages, the Wavelet coefficients are achieved for respiration and heart rates from this recovered analyzing signal.
The Wavelet coefficients show a scale of 40 for heart rate as shown in Supplementary Figure S6. Planting these coefficients to scale-frequency mapping results in a frequency of 1.891 Hz which is shown in Supplementary Figure S7. The heart rate computed from this is 1.891 × 60 = 113.46 bpm (beats/minute). The amount of deviation by this reading from the uninterrupted reading would be 4.99%.
Which is almost 30.11% recovery compared to the results with lossy data. For the same recovered analyzing signal through AR based series depicted in Supplementary Figure S8 (upper sub-figure). The maximum energy for high dense coefficients correspond to coefficients at 348 scale which is shown by a pink continues line at the bottom depicted in Supplementary Figure S8 (lower sub-figure). Transforming these coefficients to scale to frequency mapping would produce a frequency of 0.2174 Hz shown in Supplementary Figure S9. The respiration rate computed from this reading is 0.2174*60 = 13.04 bpm (breath/minute). The degree of deviation by this reading from uninterrupted reading would be 0.57%, which is almost 60% recovery compared to the results with loss.
This paper aims to improve the results obtained in this section, by introducing ARMA based recovery as discussed earlier in Section 3. Using this novel approach, improvement in accuracy is expected at the cost of computational efforts.
7 Analysis After Recovery of Data Loss Through ARMA-Based Model
It is believed that using more information (input and measure signal), more accurate data can be reconstructed. Hence, the recovery made through ARMA based model where both signals are employed should generate more efficient results than AR-based model, where only the measurement vector is used in the recovery.
In this section, using the concept of the ARMA-based model, the intermittent analyzing signal is first recovered, then the two critical information is obtained. This recovered signal is shown in Supplementary Figure S10 (upper sub-figure). In the next phase, the Wavelet coefficients are achieved for respiration and heart rates from this recovered analyzing signal. The Wavelet coefficients reflect a scale of 41 for heart rate shown in Supplementary Figure S10 (lower sub-figure). Transforming these coefficients to scale to frequency mapping results in a frequency of 1.845 Hz shown in Supplementary Figure S11. The heart rate computed from this scale is 1.845 × 60 = 110.7bpm (beats/minute). The level of deviation by this reading from the uninterrupted reading would be 2.44%, which is approximately 66% recovery compared to the results with lossy data. Through the same strategy, the maximum energy-column comprising of high dense coefficients associate a scale value of 349 which is depicted by the continues line in Supplementary Figure S12. Substituting these coefficients into scale-frequency mapping show a frequency of 0.2167 Hz (Supplementary Figure S13). The respiration rate computed from this is 0.2167*60 = 13.002bpm (breath/minute). The degree of deviation of this reading from benchmark reading would be 0.28%, which is 80.28% recovery compared to results with data loss.
To summarize, four compact scenarios have been compiled for monitoring of vital signs, namely;
1. When normal data arrives (without any loss).
2. When there is random data loss.
3. When the data is recovered through AR-based model (existing method)
4. When data is recovered through ARMA-based model (proposed technique)
A total of 50 samples are manually lost at a particular location. Although various scenarios may be introduced and described through this case study. In this paper, a chunk of data, collectively at one location is considered to be lost. Table 1 and Table 2 summarize the performance of two algorithms (existing AR-based model and proposed ARMA-based model) for the respiration and heart rates, respectively. As can be viewed from the last row of the two tables, the proposed ARMA-based model efficiently reproduced the lost information and the vital signs (the two rates) are very much close to actual readings. Hence it results in minimum error.
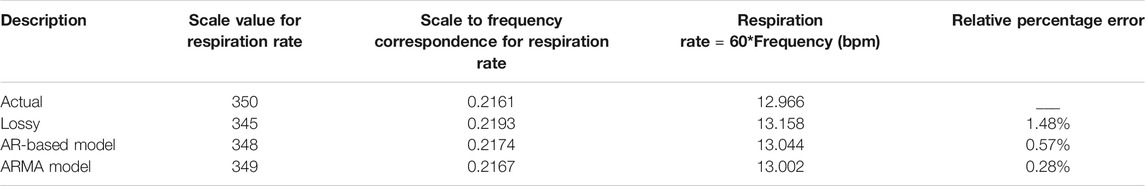
TABLE 1. Respiration rate comparison.
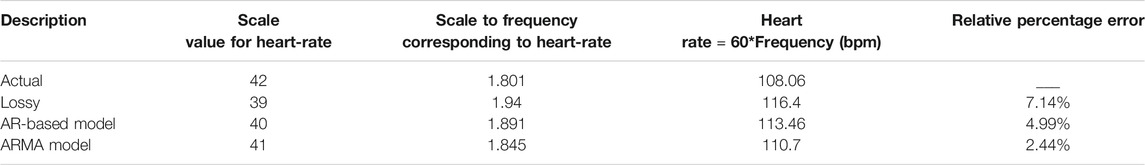
TABLE 2. Heart rate comparison.
Conclusion
In this paper, vital signs monitoring has been considered for practically achieved data. Due to its direct link with human beings, the importance of vital signs is very clear. The loss of such information needs to be efficiently handled in order to avoid catastrophic results. Initially, the vital signs are monitored from normal data, where there is no data loss. This provides a benchmark to perform comparison for later stages where measurement data is intermittent in nature after striking the patient. This lossy data has been observed in vital sign monitoring (heart and respiration rates) with degrading outcomes. This data loss is then attempted to be recovered through the AR-based model which gives much better results compared to lossy results. However, the AR-based model entertained only the measurement vector in the recovery process. An improved version is introduced in this paper, which implies both measurement vector and input data in the recovery phase. After recovery, when implanted in the vital sign monitoring, the simulation results show that more efficient and closer to actual data is obtained through this scheme. In other words, the reproduced data is less affected by data-loss which is verified by vital sign monitoring results.
It can be concluded that, if any data has a certain level of a trend in its structure, the data can be reproduced through the AR-based or ARMA-based model. If not, then piece-wise similarity may be assumed in the recovery process. It is necessary to mention that both AR and ARMA-based models are computationally expensive. In future, non-stationary attitude may be investigated in the same context as it could give further insights into the problem.
Data Availability Statement
The raw data supporting the conclusion of this article will be made available by the authors, without undue reservation.
Author Contributions
NK designed the experiments, wrote the paper and supervised the algorithm development. SS worked on the implementation of algorithms. IA and FK (1st author) helped in experiments to design and write the manuscript. FK (5th author) participated in data collection and paper writing.
Funding
This research work was jointly supported by the EU H2020 MSCA project UWB-IODA SF-PC (project no. 838037) and Lab-STICC (UBO, Brest France), CNRS, UMR 6285.
Conflict of Interest
The authors declare that the research was conducted in the absence of any commercial or financial relationships that could be construed as a potential conflict of interest.
Publisher’s Note
All claims expressed in this article are solely those of the authors and do not necessarily represent those of their affiliated organizations, or those of the publisher, the editors and the reviewers. Any product that may be evaluated in this article, or claim that may be made by its manufacturer, is not guaranteed or endorsed by the publisher.
Supplementary Material
The Supplementary Material for this article can be found online at: https://www.frontiersin.org/articles/10.3389/frsip.2021.742441/full#supplementary-material
Supplementary Figure S1 | Frequency plot of Wavelet coefficients for normal respiration rate.
Supplementary Figure S2 | ESD of Wavelet coefficients for heart rate (Lossy Data).
Supplementary Figure S3 | Frequency plot of Wavelet coefficients for heart rate (Lossy Data).
Supplementary Figure S4 | ESD of Wavelet coefficients for respiration rate (Lossy data).
Supplementary Figure S5 | Frequency plot of Wavelet coefficients for respiration rate (Lossy data).
Supplementary Figure S6 | ESD of Wavelet coefficients for heart rate (AR-based approach).
Supplementary Figure S7 | Frequency plot for Wavelet coefficients for heart rate (AR-based approach).
Supplementary Figure S8 | ESD of Wavelet coefficients for respiration rate (AR-based approach).
Supplementary Figure S9 | Frequency plot of Wavelet coefficients for respiration rate (AR-based model).
Supplementary Figure S10 | ESD of Wavelet coefficients for heart rate (ARMA-based approach).
Supplementary Figure S11 | Frequency plot for Wavelet coefficients for heart rate (ARMA-based approach).
Supplementary Figure S12 | ESD of Wavelet coefficients for respiration rate (ARMA-based approach).
Supplementary Figure S13 | Frequency plot of Wavelet coefficients for respiration rate (ARMA-based model).
References
Andersen, N., Granhaug, K., Michaelsen, J. A., Bagga, S., Hjortland, H. A., Knutsen, M. R., et al. (2017). A 118-mw Pulse-Based Radar Soc in 55-nm Cmos for Non-Contact Human Vital Signs Detection. IEEE J. Solid-State Circuits 52, 3421–3433. doi:10.1109/jssc.2017.2764051
Briso, C., Calvo, C., and Xu, Y. (2019). Uwb Propagation Measurements and Modelling in Large Indoor Environments. IEEE Access 7, 41913–41920. doi:10.1109/access.2019.2905142
Buehrer, R. M., Davis, W. A., Safaai-Jazi, A., and Sweeney, D. (2003). “Characterization of the Ultra-Wideband Channel,” in IEEE Conference on Ultra Wideband Systems and Technologies, Reston, VA, 26–31. doi:10.1109/UWBST.2003.1267796
Cardillo, E., Li, C., and Caddemi, A. (2021). Vital Sign Detection and Radar Self-Motion Cancellation through Clutter Identification. IEEE Trans. Microwave Theor. Techn. 69, 1932–1942. doi:10.1109/tmtt.2021.3049514
Chia, M. Y. W., Leong, S. W., Sim, C. K., and Chan, K. M. (2005). “Through-wall UWB Radar Operating within FCC's Mask for Sensing Heart Beat and Breathing Rate,” in European Radar Conference, Paris, France, 267. doi:10.1109/EUMC.2005.1610358
Chóliz, J., Hernández, Á., and Valdovinos, A. (2011). A Framework for Uwb-Based Communication and Location Tracking Systems for Wireless Sensor Networks. Sensors 11, 9045–9068. doi:10.3390/s110909045
Cramer, R. J.-M., Scholtz, R. A., and Win, M. Z. (2002). Evaluation of an Ultra-Wide-Band Propagation Channel. IEEE Trans. Antennas Propagat. 50, 561–570. doi:10.1109/tap.2002.1011221
Fear, E. C., Li, X., Hagness, S. C., and Stuchly, M. A. (2002). Confocal Microwave Imaging for Breast Cancer Detection: Localization of Tumors in Three Dimensions. IEEE Trans. Biomed. Eng. 49, 812–822. doi:10.1109/tbme.2002.800759
Fernandes, J. R., and Wentzloff, D. (2010). “Recent Advances in Ir-Uwb Transceivers: An Overview,” in Proceedings of 2010 IEEE International Symposium on Circuits and Systems, Paris, France, 3284–3287. doi:10.1109/ISCAS.2010.5537916
Fontana, R. J. (2004). Recent System Applications of Short-Pulse Ultra-Wideband (Uwb) Technology. IEEE Trans. Microwave Theor. Techn. 52, 2087–2104. doi:10.1109/tmtt.2004.834186
Grewal, M., and Andrews, A. (2001). Kalman Filtering: Theory and Practice Using MATLAB. Hoboken, New Jersey: John Wiley & Sons.
Gu, C., Wang, G., Inoue, T., and Li, C. (2013). “Doppler Radar Vital Sign Detection with Random Body Movement Cancellation Based on Adaptive Phase Compensation,” in IEEE MTT-S International Microwave Symposium Digest (MTT), Seattle, WA, 1–3. doi:10.1109/mwsym.2013.6697618
Khan, F., and Cho, S. (2017). A Detailed Algorithm for Vital Sign Monitoring of a Stationary/Non-Stationary Human through IR-UWB Radar. Sensors 17, 290. doi:10.3390/s17020290
Khan, F., Ghaffar, A., Khan, N., and Cho, S. H. (2020). An Overview of Signal Processing Techniques for Remote Health Monitoring Using Impulse Radio Uwb Transceiver. Sensors 20, 2479. doi:10.3390/s20092479
Khan, F., Leem, S. K., and Cho, S. H. (2018). Human-Computer Interaction Using Radio Sensor for People with Severe Disability. Sensors Actuators A: Phys. 282, 39–54. doi:10.1016/j.sna.2018.08.051
Khan, N., Fekri, S., and Gu, D. (2010). Improvement on State Estimation for Discrete-Time Lti Systems with Measurement Loss. Measurement 43, 1609–1622. doi:10.1016/j.measurement.2010.09.011
Khan, N., Khan, K., Khan, A., Alam, I., Khan, F. U., Khan, S. U., et al. (2019). Accommodate Data Loss in Monitoring Vital Signs through Autoregressive Model. J Med. Imaging Hlth Inform. 9, 1205–1214. doi:10.1166/jmihi.2019.2712
Khan, N., Khattak, M. I., Khan, M. N., Khan, F., Khan, L. U., Salam, S. A., and Gu, D.-W. (2013). “Implementation of Linear Prediction Techniques in State Estimation,” in Proceedings of 2013 10th International Bhurban Conference on Applied Sciences Technology (IBCAST), Islamabad, Pakistan, 77–83. doi:10.1109/IBCAST.2013.6512134
Lazaro, A., Girbau, D., and Villarino, R. (2009). Wavelet-Based Breast Tumor Localization Technique Using a Uwb Radar. Prog. Electromagnetics Res. 98, 75–95. doi:10.2528/pier09100705
Le, M. (2020). Heart Rate Extraction Based on Eigenvalues Using Uwb Impulse Radar Remote Sensing. Sensors Actuators A: Phys. 303, 111689. doi:10.1016/j.sna.2019.111689
Li, B., Zhou, Z., Zou, W., Li, D., and Zhao, C. (2010). Optimal Waveforms Design for Ultra-Wideband Impulse Radio Sensors. Sensors 10, 11038–11063. doi:10.3390/s101211038
Liu, H., Allen, J., Zheng, D., and Chen, F. (2019). Recent Development of Respiratory Rate Measurement Technologies. Physiol. Meas. 40, 07TR01–28. doi:10.1088/1361-6579/ab299e
Nelson, B. W., and Allen, N. B. (2019). Accuracy of Consumer Wearable Heart Rate Measurement during an Ecologically Valid 24-Hour Period: Intraindividual Validation Study. JMIR Mhealth Uhealth 7, e10828. doi:10.2196/10828
Oziel, M., Korenstein, R., and Rubinsky, B. (2017). Radar Based Technology for Non-Contact Monitoring of Accumulation of Blood in the Head: A Numerical Study. PLOS ONE 12, e0186381–20. doi:10.1371/journal.pone.0186381
Shen, H., Xu, C., Yang, Y., Sun, L., Cai, Z., Bai, L., et al. (2018). Respiration and Heartbeat Rates Measurement Based on Autocorrelation Using Ir-Uwb Radar. IEEE Trans. Circuits Syst. 65, 1470–1474. doi:10.1109/tcsii.2018.2860015
Sifuzzaman, M., Islam, M. R., and Ali, M. Z. (2009). Application of Wavelet Transform and its Advantages Compared to Fourier Transform. J. Phys. Sci. 13, 121–134.
Staderini, E. M. (2002). Uwb Radars in Medicine. IEEE Aerosp. Electron. Syst. Mag. 17, 13–18. doi:10.1109/62.978359
Tariq, A., Zahid, A., Khan, U., Khan, N., and Khan, F. (2017). “Implementation of Wavelet Transform for Monitoring of Vital Signs through Ir-Uwb Radar,” in 2017 International Conference on Communication, Computing and Digital Systems (C-CODE), Islamabad, Pakistan, 337–340. doi:10.1109/C-CODE.2017.7918953
Thiel, F., Kosch, O., and Seifert, F. (2010). Ultra-Wideband Sensors for Improved Magnetic Resonance Imaging, Cardiovascular Monitoring and Tumour Diagnostics. Sensors 10, 10778–10802. doi:10.3390/s101210778
Wang, G. R., Han, H. G., Kim, S. Y., and Kim, T. W. (2017). Wireless Vital Sign Monitoring Using Penetrating Impulses. IEEE Microw. Wireless Compon. Lett. 27, 94–96. doi:10.1109/lmwc.2016.2630001
Yang, X., Zhang, X., Qian, H., Ding, Y., and Zhang, L. (2020). “Mmt-Hear: Multiple Moving Targets Heartbeats Estimation and Recovery Using Ir-Uwb Radars,” in 42nd Annual International Conference of the IEEE Engineering in Medicine and Biology Society (EMBC), Montreal, QC, 5733–5736. doi:10.1109/EMBC44109.2020.9175318
Keywords: vital signs, radar-cross section, ARMA-model, kalman filtering, intermittent observations
Citation: Khan F, Sherazi SM, Khan N, Ashraf I and Khan F (2021) Handling Radar Cross-Section Performance in Monitoring Vital Signs Under Constraint Conditions. Front. Sig. Proc. 1:742441. doi: 10.3389/frsip.2021.742441
Received: 16 July 2021; Accepted: 23 September 2021;
Published: 25 October 2021.
Edited by:
Shekh Md Mahmudul Islam, University of Dhaka, BangladeshReviewed by:
Wei Pu, University College London, United KingdomMd Zobaer Islam, Oklahoma State University, United States
Copyright © 2021 Khan, Sherazi, Khan, Ashraf and Khan. This is an open-access article distributed under the terms of the Creative Commons Attribution License (CC BY). The use, distribution or reproduction in other forums is permitted, provided the original author(s) and the copyright owner(s) are credited and that the original publication in this journal is cited, in accordance with accepted academic practice. No use, distribution or reproduction is permitted which does not comply with these terms.
*Correspondence: Naeem Khan, bmtoYW5AdWV0cGVzaGF3YXIuZWR1LnBr; Faheem Khan, ZmFoZWVta2hhbkBoYW55YW5nLmFjLmty; Imran Ashraf, aW1yYW4uYXNocmFmQGhpdGVjdW5pLmVkdS5waw==